Embed Size (px)
Citation preview

Czy mozemy zrozumieć chmury nie rozumiejąc turbulencji?
Szymon Malinowsk
KMMF, 12.04.2012i

Turbulence: what is it ?
turbulence — 1. Irregular fluctuations occurring in fluid motions. It is characteristic of turbulence that the fluctuations occur in all three velocity components and are unpredictable in detail; however, statistically distinct properties of the turbulence can be identified and profitably analyzed. Turbulence exhibits a broad range of spatial and temporal scales resulting in efficient mixing of fluid properties. 2. Random and continuously changing air motions that are superposed on the mean motion of the air.
Glossary of Meteorology, American Meteorological Society
turbulence — In fluid mechanics, a flow condition (see turbulent flow) in which local speed and pressure change unpredictably as an average flow is maintained.
atmospheric turbulence — small-scale, irregular air motions characterized by winds that vary in speed and direction. Turbulence is important because it mixes and churns the atmosphere and causes water vapour, smoke, and other substances, as well as energy, to become distributed both vertically and horizontally.
Britannica Online

Cloud: what is it?
Cloud – A visible aggregate of minute water droplets and/or ice particles in the atmosphere above the earth’s surface
Glossary of Meteorology, American Meteorological Society
Cloud – any visible mass of water droplets, or ice crystals, or a mixture of both that is suspended in the air, usually at a considerable height
Britannica Online
What is the typical size of aerosol and cloud particles ? From a few nanometers: a few molecules condensed
To a few centimeters: hailstones
Measurable parameters from in-situ observations
Particle size………………….µm, mm, cm…………1µm<D<10cmNumber Concentration……..cm-3; l -1; m-3……….1000cm-3<N<1m-3
Extinction Coefficient…….…km-1…………………100km-1<β<0.01 km-1
Water Content……………….g/m3…………………10g/m3<W<0.0001g/m3

Cloud particles at various heights (temperatures) imaged by CPI (SPEC Inc.)

Cloud formation processes:
Condensation of water vapour into small droplets
adiabatic expansion (e.g. ascending motions);
isobaric cooling (radiative, conductive);
isobaric mixing.

Examples of condensation (formation of clouds) due to adiabatic expansion.

Examples of condensation (formation of clouds) due to isobaric cooling.

Examples of condensation (formation of clouds) due to isobaric mixing of two humid unsaturated airmasses.

Clouds and Turbulence – overview.
Cloud topped boundary layer:– turbulence in Stratocumulus clouds;– turbulence in cumulus convection.
Condensation in convective motions.- a sketch of Koehler's theory;- collisions and coalescence and a „bottleneck”
problem.
Experimental evidence of warm rain formation- drizzle in Stratocumulus;- warm rain in cumulus clouds.

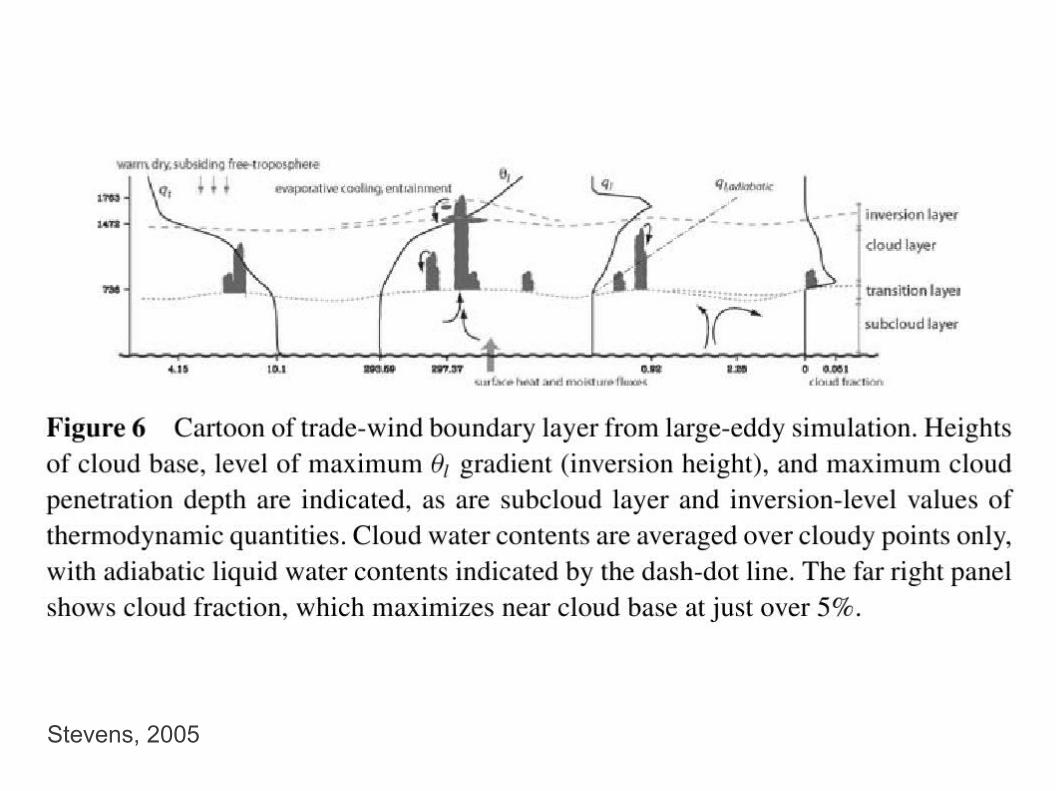
Stevens, 2005


Stevens et al., 2005
Stevens, 2005
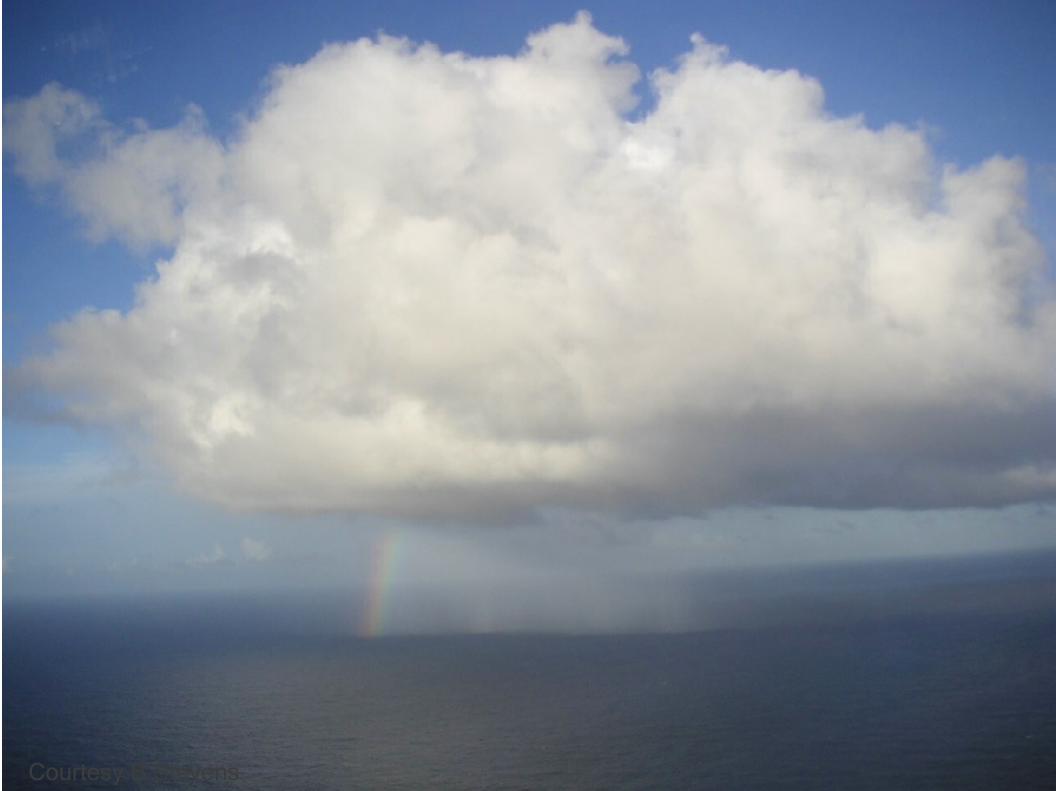
Courtesy B.Stevens

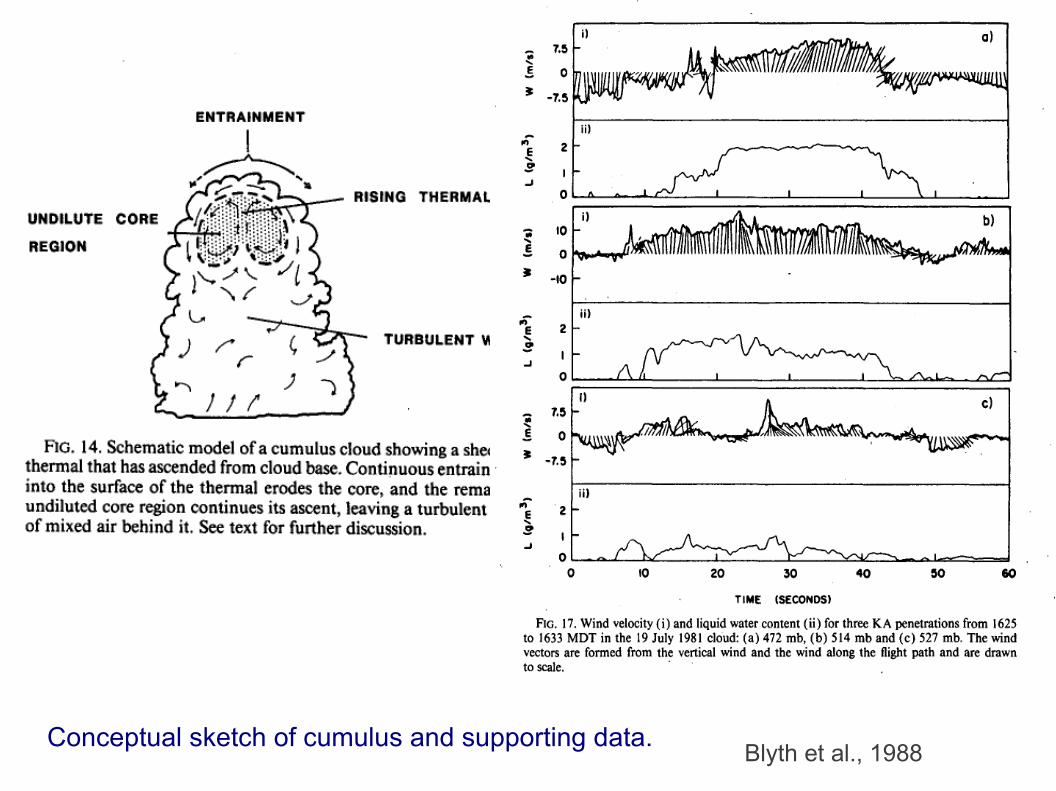
Blyth et al., 1988
Conceptual sketch of cumulus and supporting data.

Siebert, Lehmann and Wendisch, 2006.
TKE dissipation in small cumulus clouds

The following parameters characterize warm turbulent clouds and give some indication of their variability.
Mean ε, can vary from ~10 cm2s−3 in stratiform clouds to ~2000 cm2s−3 in cumulonimbus clouds (e.g. Caughey et al., 1982; MacPherson and Isaac, 1977).
Rλ , varies from ~5000 in stratiform clouds to ~20,000 in strong deep
convective clouds (e.g. Shaw, 2003; Khain et al., 2007);
ε 3 cm∼ 2s−3 and Rλ 5000 for stratocumulus∼ (Siebert et al., 2010)
ε ≈ ~ 30 cm2s−3 and Rλ 4 × 10∼ 4 for small cumulus (Siebert et al., 2006).
The maximum LWC are in convective clouds with very strong updrafts and not exceed 4–5 g m−3 ; typically in cumulus 0.1–2 g m−3 depending on the stage of development (Pruppacher and Klett, 1997, §2.1.3).
Most estimates of cloud parameters come from a limited number of measurements at low resolution; only recently (Siebert et al., 2006; Siebert et al., 2010) have higher-resolution ( 20cm) measurements.∼
Devenish et al., 2012

Clouds and Turbulence – overview.
Cloud topped boundary layer:– turbulence in Stratocumulus clouds;– turbulence in cumulus convection.
Condensation in convective motions.- a sketch of Koehler's theory;- collisions and coalescence and a „bottleneck”
problem.
Experimental evidence of warm rain formation- drizzle in Stratocumulus;- warm rain in cumulus clouds.
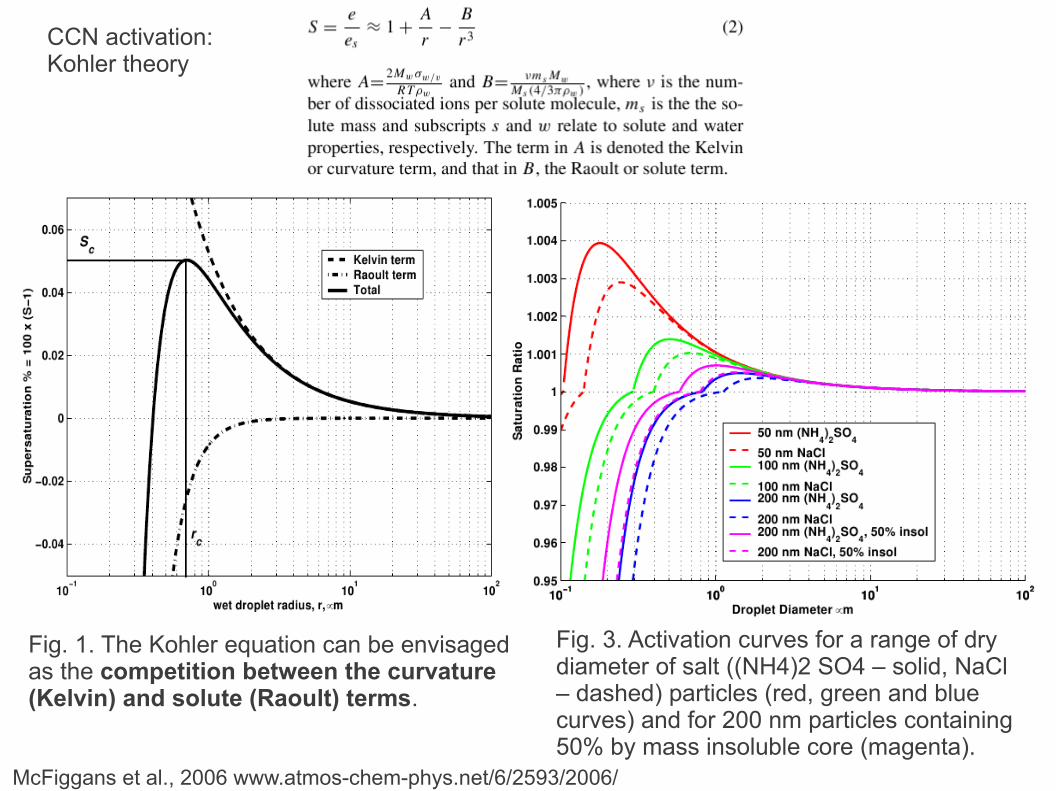
McFiggans et al., 2006 www.atmos-chem-phys.net/6/2593/2006/
Fig. 1. The Kohler equation can be envisaged as the competition between the curvature (Kelvin) and solute (Raoult) terms.
Fig. 3. Activation curves for a range of dry diameter of salt ((NH4)2 SO4 – solid, NaCl – dashed) particles (red, green and blue curves) and for 200 nm particles containing 50% by mass insoluble core (magenta).
CCN activation:Kohler theory
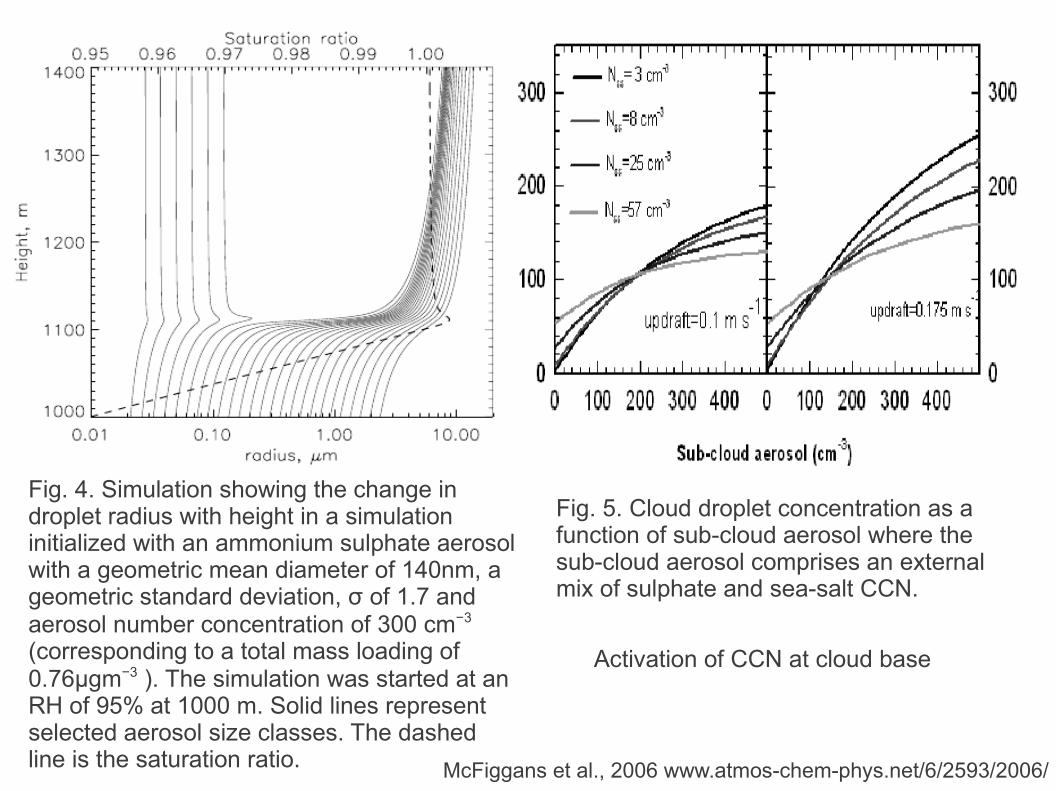
Fig. 4. Simulation showing the change in droplet radius with height in a simulation initialized with an ammonium sulphate aerosol with a geometric mean diameter of 140nm, a geometric standard deviation, σ of 1.7 and aerosol number concentration of 300 cm−3 (corresponding to a total mass loading of 0.76µgm−3 ). The simulation was started at an RH of 95% at 1000 m. Solid lines represent selected aerosol size classes. The dashed line is the saturation ratio.
Fig. 5. Cloud droplet concentration as a function of sub-cloud aerosol where the sub-cloud aerosol comprises an external mix of sulphate and sea-salt CCN.
McFiggans et al., 2006 www.atmos-chem-phys.net/6/2593/2006/
Activation of CCN at cloud base

Wpływ aerozoluna budowę chmur (rozmiar kropelek)i w konsekwencjina ich własności radiacyjne:tzw. pośrednie efekty aerozolowe- pierwszy (albedo)drugi (czas trwania).

What is rain?
rain — Precipitation in the form of liquid water drops that have diameters greater than 0.5 mm, or, if widely scattered, the drops may be smaller. The only other form of liquid precipitation, drizzle, is to be distinguished from rain in that drizzle drops are generally less than 0.5 mm in diameter, are very much more numerous, and reduce visibility much more than does light rain.
warm rain — Rain formed from a cloud having temperatures at all levels above 0°C (32°F), and resulting from the droplet coalescence process.
Glossary of Meteorology, American Meteorological Society
rain — Precipitation of liquid water drops with diameters greater than 0.5 mm (0.02 inch). When the drops are smaller, the precipitation is usually called drizzle. See also precipitation.
Britannica Online
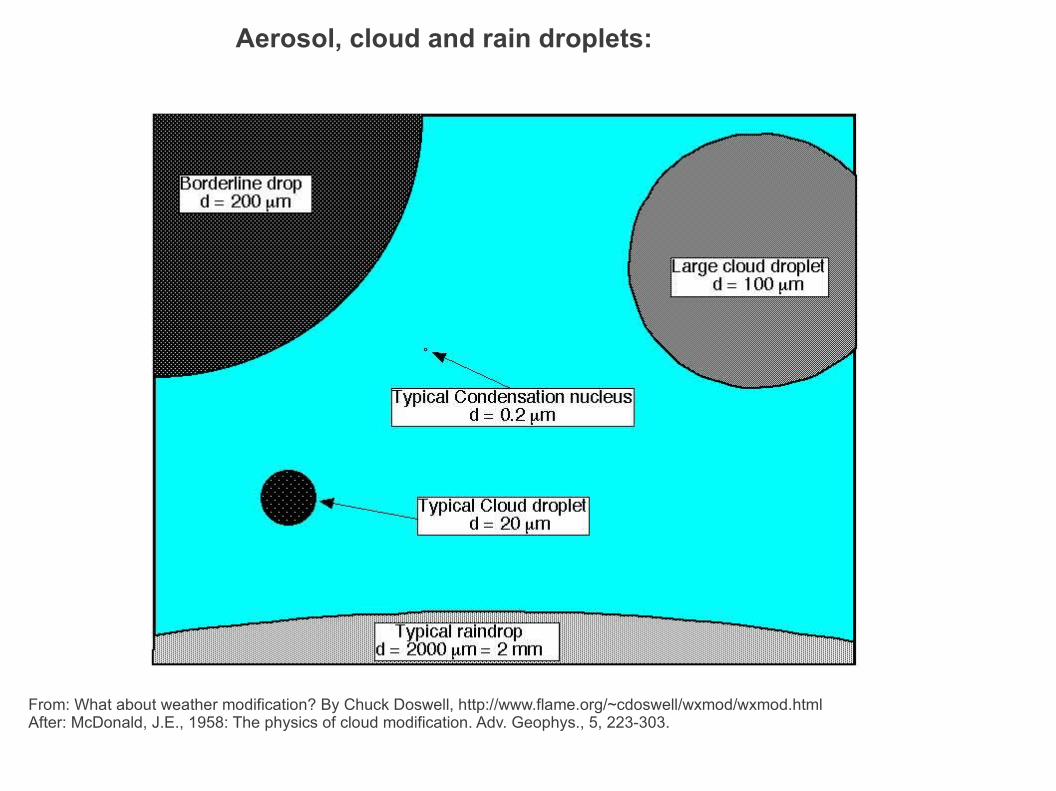
Aerosol, cloud and rain droplets:
raindrops
From: What about weather modification? By Chuck Doswell, http://www.flame.org/~cdoswell/wxmod/wxmod.htmlAfter: McDonald, J.E., 1958: The physics of cloud modification. Adv. Geophys., 5, 223-303.


After Shaw, 2003.
Rain formation HOW large droplets responsible for collision/coalescence cascade may appear in clouds???

Concepts of rain formation:
1. Giant Condensation nuclei
2. Entrainment and secondary activation
3. “Something to do with turbulence”

Clouds and Turbulence – overview.
Cloud topped boundary layer:– turbulence in Stratocumulus clouds;– turbulence in cumulus convection.
Condensation in convective motions.- a sketch of Koehler's theory;- collisions and coalescence and a „bottleneck”
problem.
Experimental evidence of warm rain formation- drizzle in Stratocumulus;- warm rain in cumulus clouds.

Stevens et al., 2005
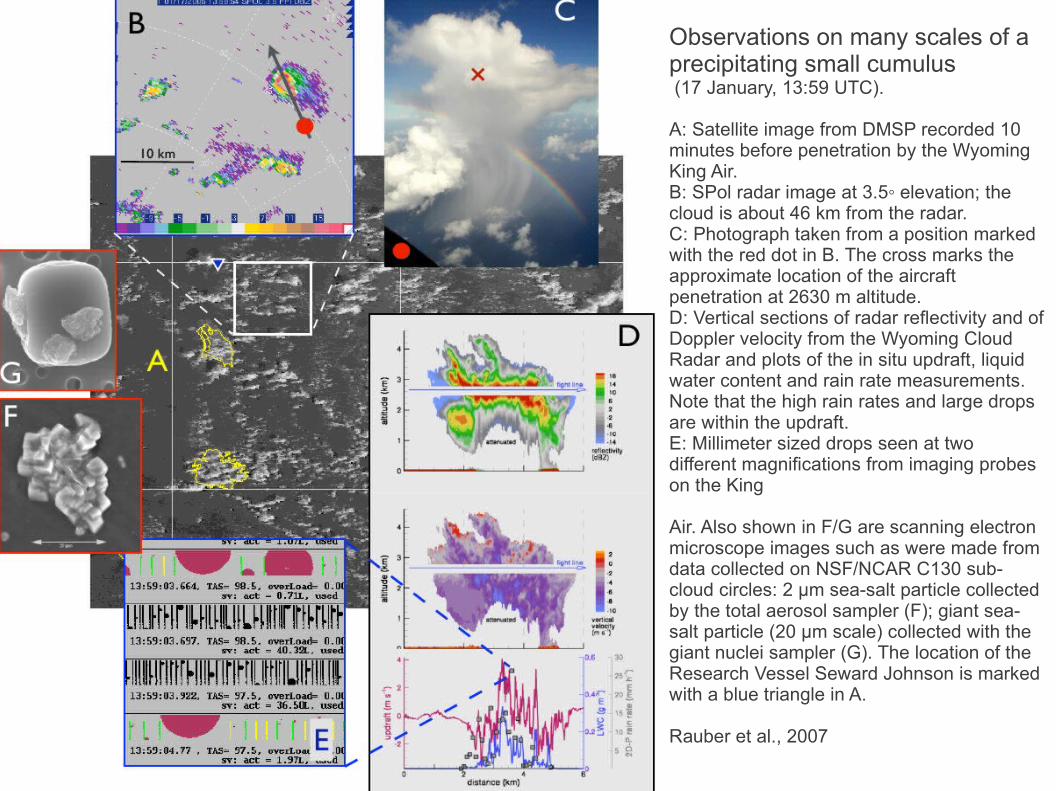
Observations on many scales of a precipitating small cumulus (17 January, 13:59 UTC).
A: Satellite image from DMSP recorded 10 minutes before penetration by the Wyoming King Air. B: SPol radar image at 3.5◦ elevation; the cloud is about 46 km from the radar. C: Photograph taken from a position marked with the red dot in B. The cross marks the approximate location of the aircraft penetration at 2630 m altitude. D: Vertical sections of radar reflectivity and of Doppler velocity from the Wyoming Cloud Radar and plots of the in situ updraft, liquid water content and rain rate measurements. Note that the high rain rates and large drops are within the updraft. E: Millimeter sized drops seen at two different magnifications from imaging probes on the King
Air. Also shown in F/G are scanning electron microscope images such as were made from data collected on NSF/NCAR C130 sub-cloud circles: 2 µm sea-salt particle collectedby the total aerosol sampler (F); giant sea-salt particle (20 µm scale) collected with the giant nuclei sampler (G). The location of the Research Vessel Seward Johnson is marked with a blue triangle in A.
Rauber et al., 2007

Cloud-scale and small-scale turbulence
Entrainment and mixing:CumulusStratocumulusMechanisms for entrainment in clouds
Turbulence and cloud microphysics:motion of cloud droplets
Droplet size distributionCondensational growth and turbulenceCollisions, coalescence and turbulence
Droplet relative velocityDroplet clustering (preferential concentration)Preferential sweeping
The effect of entrainment on the droplet size distributionHomogeneous and inhomogeneous mixing
Already partially discussed

Entrainment as a result of interfacial instabilities: Klaasen, Clark, Grabowski......Illustrations from Grabowski and Clark 1991, 1993
Entrainment into cumulus:

Haman and Malinowski 1996
Arrows indicate filamentation due to entrainment-mixing
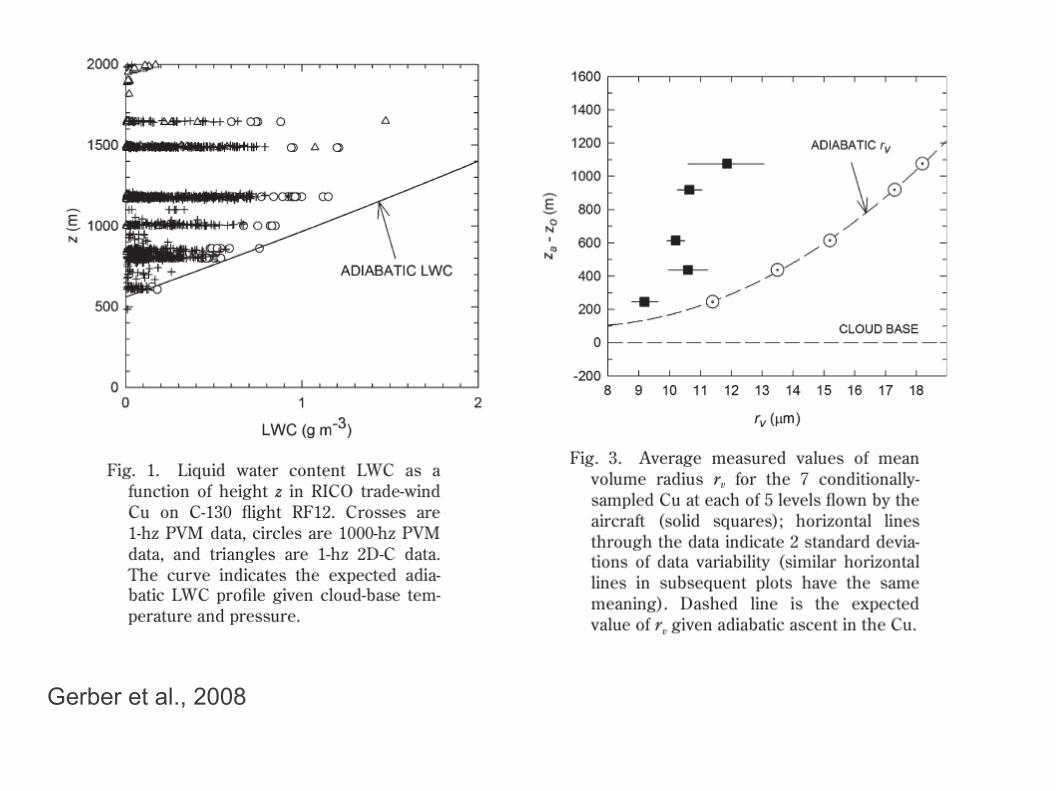
Gerber et al., 2008

Passive scalar concentration χ (left, cloud water contours shown by white lines) and enstrophy (right), at 6 hours of simulations.
Kurowski, Malinowski, Grabowski 2009
Entrainment into stratocumulus:

Mixing diagram showing buoyancy (density temperature) of mixture of cloud and free-tropospheric air (upper lines) and cloud and EIL air (lower lines).
Negative buoyancy – below the blue line.
T is the temperature, q is the water vapor mixing ratio, l is the liquid water (cloud droplet)mixing ratio, and ε = (Rv /Rd − 1) 0.61; Rd and Rv are gas constants of dry air and water vapor∼

Cloud-scale and small-scale turbulence
Entrainment and mixing:CumulusStratocumulusMechanisms for entrainment in clouds
Turbulence and cloud microphysics:motion of cloud droplets
Droplet size distributionCondensational growth and turbulenceCollisions, coalescence and turbulence
Droplet relative velocityDroplet clustering (preferential concentration)Preferential sweeping
Entrainment and the droplet size distributionHomogeneous and inhomogeneous mixing

Effects due to turbulence:
preferential concentration,
various mechanism of enhanced collisions,
homogeneous vs. inhomogeneous mixing.

Preferential concentration weak turbulence in cloud chamber.
Jaczewski and Malinowski, 2005.

EXAMPLE: droplets in prescribed stretched vortex flow – 2D projection
Bajer et al., 2000

F.Toschi
Example: motion of droplets in small-scale vortical structure in fluid.

First experimental evidence of droplets expelled from vortex tubes in real clouds – Bodenschatz, Xu, Malinowski et al., 2011, Zugspitze cloud campaigh – not published yet....

Length scales associated with condensational growth of droplets.
The condensational growth of droplets is characterized by vapor pressure gradients and temperature gradients.
When the growth of an ensemble of droplets in turbulent air is considered, the temperature and the moisture fields away from the droplet may vary considerably and the concept of ambient conditions becomes vague. The ‘boundary conditions’ imposed between droplets may depend on both the spatial distribution of droplets as well as on the supersaturation and temperature fields
Vaillancourt et al. (2001) defined the ambient conditions to be the moisture and temperature fields in the vicinity of a given droplet averaged over the volume defined by the mean distance between droplets (so-called point-particle approach to describe the evolution of the droplet phase (adopted by Celani et al., 2007; Lanotte et al. 2009).
Most studies of the growth of an ensemble of droplets neglect the direct thermodynamic interaction between droplets, arguing that the mean distance between cloud droplets ( 2mm for a typical concentration of 100 cm∼ −3 ) is at least an order of magnitude larger than the distance affected by the variation of moisture and temperature due to cloud droplet growth.

Time scales associated with condensational growth of droplets
Scale of diffusional growth of an isolated droplet and in typical conditions is less than 1×10⁻³ s.
Another time scale occurs when the boundary conditions for water-vapor concentration and temperature at the surface of the droplet are not assumed constant. During condensation water vapor diffuses onto the surface of the droplet, latent heat is released, and consequently the surface temperature (the psychometric temperature) of the droplet changes. The relaxation time associated with this process lies typically between 5×10⁻⁴s and 1×10⁻²s for droplet radii between 5 µm and 25 µm) SLOWEST!!!
Vaillancourt et al. (2001) showed that, for a=20µm and ε=100 cm2 s−3 , the ratio of this time scale to fastest time scale associated with changes to the ambient conditions due to turbulence (either τ
η or τ
v ) is much less than one and the assumption of a steady-state
distribution of water-vapor concentration and temperature is valid.
Numerical simulations by Celani et al. (2005, 2007), Lanotte et al. (2009) , Sidin et al., (2009) suggest that cloud droplet spectra can be broadened during condensation, which is different from simulations of Vaillancourt et al. (2002) and from the measurements in real clouds (as we can interpret them).
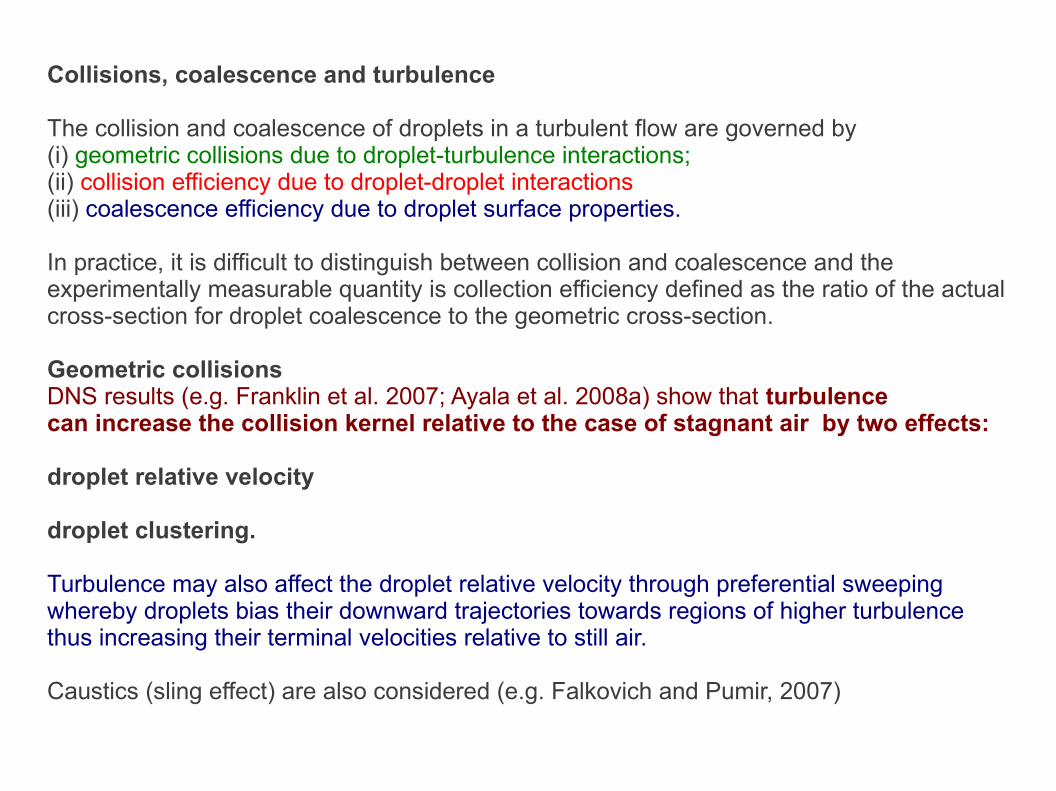
Collisions, coalescence and turbulence
The collision and coalescence of droplets in a turbulent flow are governed by (i) geometric collisions due to droplet-turbulence interactions; (ii) collision efficiency due to droplet-droplet interactions(iii) coalescence efficiency due to droplet surface properties.
In practice, it is difficult to distinguish between collision and coalescence and the experimentally measurable quantity is collection efficiency defined as the ratio of the actual cross-section for droplet coalescence to the geometric cross-section.
Geometric collisionsDNS results (e.g. Franklin et al. 2007; Ayala et al. 2008a) show that turbulencecan increase the collision kernel relative to the case of stagnant air by two effects:
droplet relative velocity
droplet clustering.
Turbulence may also affect the droplet relative velocity through preferential sweeping whereby droplets bias their downward trajectories towards regions of higher turbulence thus increasing their terminal velocities relative to still air.
Caustics (sling effect) are also considered (e.g. Falkovich and Pumir, 2007)

In multidisperse suspensions, w
12| is always larger than its
monodisperse counterpart.
This can be understood by considering a limiting case of monodisperse suspension, in the absence of gravity. For low St, velocities of equally sized droplets are strongly correlated, both with the fluid and each other. As St increases, the correlation of thedroplets with the flow and each other decreases and |w
12| increases.
However, for St>>1, droplets respond slowly to changes in the fluid velocity and |w
12| decreases.
For multidisperse droplets, the velocities of the droplets decorrelate more rapidly than the equivalent monodisperse cases since the droplets with different inertia responddifferently to changes in the flow.
Computational results

However.....in situ measuremets...
With the improved size and spatial resolutions of the Fast-FSSP measurements it has been possible to identify very narrow spectra in most of the cloud traverses ...
These spectra are much narrower than previously measured with the standard probe. The regions of narrow spectra show characteristics close to the adiabatic reference, such as LWC values slightlylower than the adiabatic value at that level and values of droplet concentration close to the maximum value within the cloud traverse. The spectra observed in theseregions are narrow but still broader than the adiabatic reference. The high concentration densities of dropletswith diameter smaller than the mode can be attributed to partial evaporation of some droplets resulting from the mixing with dry air. The occurrence of this process is attested by the slightly subadiabatic values of LWC.
Chaumat and Brenguier, 2001

Short summary of clustering and collisions:
Observations of droplet clustering in real clouds remain ambiguous which has led some authors to question its importance in real clouds.
Moreover, DNS of sedimenting droplets has shown that turbulent enhancement of collision rates occurs primarily through changes to the droplet relative velocity and the collision efficiency.
Nevertheless, some argue that the vortex tubes that are associated with small-scale turbulence at high Reynolds numbers persist for long and droplets with a considerable range of St are able to spin out of the vortex.
The importance of intermittency in potentially increasing droplet clustering has also been raised by Falkovich et al. (2002) who based on theoretical arguments claim that clustering can increase collisions by a factor of 10.
Without a clear theoretical basis for the Rλ -dependence of clustering, which will remain
valid in the large-Rλ limit, it is likely that these arguments will continue.

Extremely homogeneous
Ext
rem
ely
inho
mog
eneo
us
Homogenenous vs. Inhomogeneous mixing (Baker and Latham 1979)n numerical simulations of small-scale mixing
In the homogeneous mixing scenario, the number of droplets does not change and the mean droplet size decreases. In the extreme inhomogeneous mixing scenario, droplets from a fraction of the cloudy volume evaporate completely to bring the mixture to saturation, and the droplets from the rest of the cloudy volume are dispersed over the combined volumes without changing their size.
If the droplet evaporation time scale is much larger than the time scale of turbulent homogenization, the mixing is expected to be close to homogeneous. In the opposite limit (i.e., the droplet evaporation time scale much smaller than the time scale of turbulent homogenization), the mixing is supposed to be close to the extremely inhomogeneous.

Small-scale turbulence/rain formation in clouds – a subgrid scale process
a) inadequate measurement capabilities (resolution problem, different sampling volumes of various sensors)
b) subgrid-scale processes in cloud resolving and LES simulations.
Closing the gap in resolved scalesa) DNS and particles in turbulence;b) laboratory experiments with particle tracking and collisions.c) in situ efforts.
Issuesa) (almost) no combined measurements of microphysics,
turbulence and dynamics in small-scales;b) problems with the statistical interpretation of data from measurements;c) unclear subgrid-scale parameterizations in cloud simulations.
In the following: my efforts to address issues....

Examples of the cloud edge in 1000 Hz temperature (thin line) and LWC (thick line) records. Sharp jumps in LWC and temperatureat distances of the order of 10 cm (data resolution) are currently observed. Notice a shift between the temperature and LWC records resultingfrom the 6 m separation between the instruments and the low pitch angle of the aircraft with respect to the cloud clear air interface.
Haman et al., 2007

From the top to the bottom: successive ‘blow ups’ of 10 kHz temperature records showing self-similar structures – filaments of significantly different temperatures separated by narrow interfaces. The bottom panel presents the evidence for filaments of thickness of the orderof 10 cm as well as for the steep gradients of temperature. Notice that UFT-F in its present configuration and signal conditioning (low-pass filtering) is still too slow to resolve adequately all interesting small-scale features of the temperature field.
Penetration through a mixing event at Sc top

microphysics droplet counting
POST – Physics of Stratocumulus Top, California, 2008
temperature,humidity,liquid water,turbulence,
aerosol (CCN)
Airborne measurements of small-scale turbulent mixing in clouds

11m
1000Hz data
Descend into the cloud deck
more blow-up
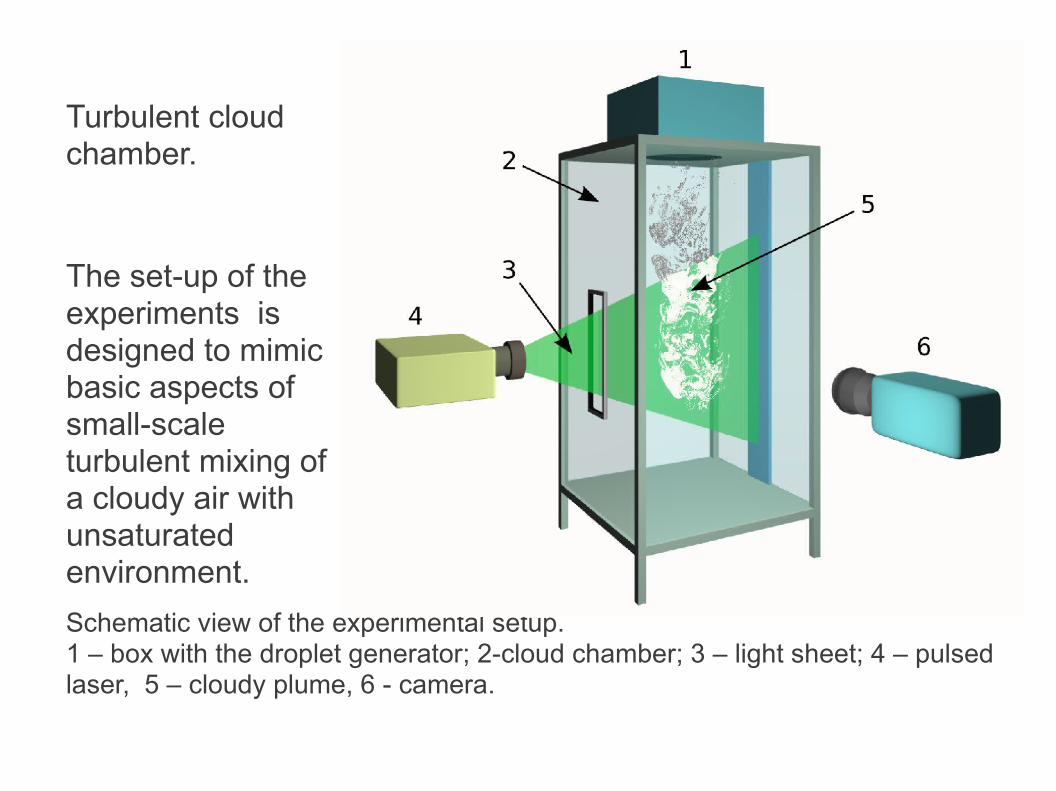
Schematic view of the experimental setup. 1 – box with the droplet generator; 2-cloud chamber; 3 – light sheet; 4 – pulsed laser, 5 – cloudy plume, 6 - camera.
Turbulent cloud chamber.
The set-up of the experiments is designed to mimic basic aspects of small-scale turbulent mixing of a cloudy air with unsaturated environment.

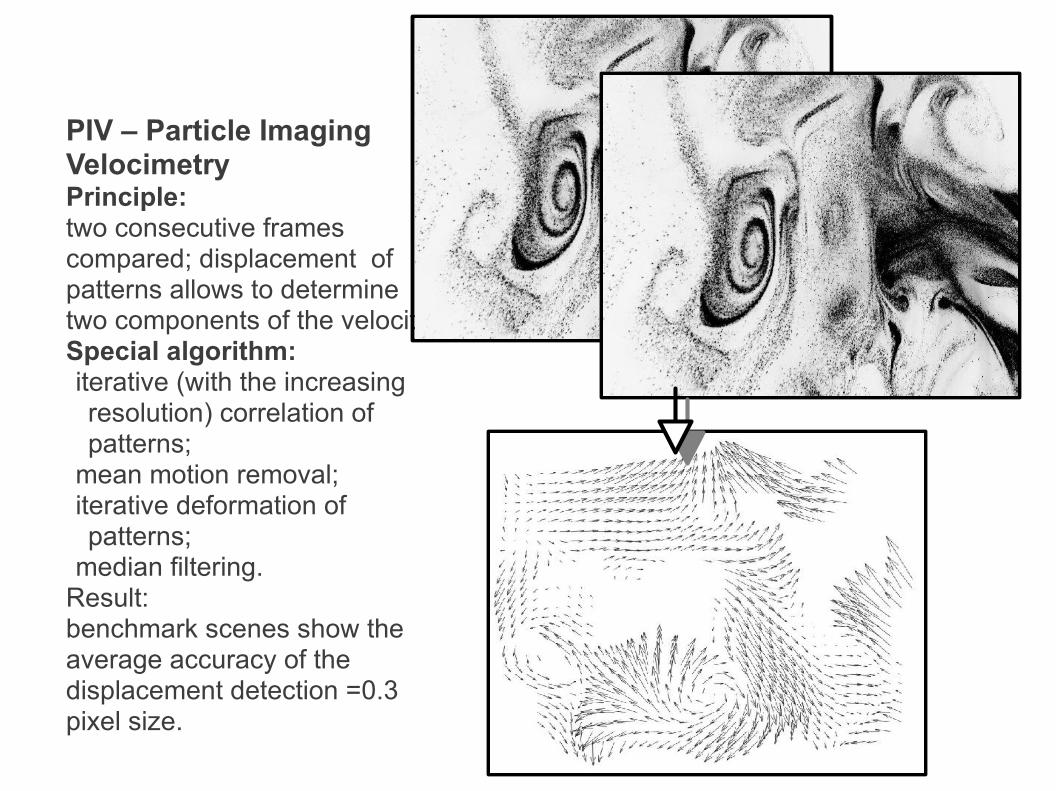
PIV – Particle Imaging VelocimetryPrinciple:two consecutive frames compared; displacement of patterns allows to determine two components of the velocity.Special algorithm:iterative (with the increasing resolution) correlation of patterns;mean motion removal;iterative deformation of patterns;median filtering.Result: benchmark scenes show the average accuracy of the displacement detection =0.3 pixel size.

Numerical simulations of small scales of cloud mixing with the environment.

Non-standard symbols:
π – normalized pressure fluctuationC
d – condensation rate
qv, q
c – specific humidity, liquid water content
B – normalized buoyancy
Andrejczuk et al., 2004,Andrejczuk et al., 2006Malinowski et al., 2008Andrejczuk et al., 2009
Equations for dynamics, thermodynamics and microphysics (droplets)

Andrejczuk et al., 2004, 2006, 2009, Malinowski et al., 2008
Simplified set of equations of cloud dynamics, thermodynamics and microphysics :
π – normalized pressure fluctuationC
d – condensation rate
qv, q
c – specific humidity, liquid water content
B – normalized buoyancy

LWCafter11s
Andrejczuk et al., 2006
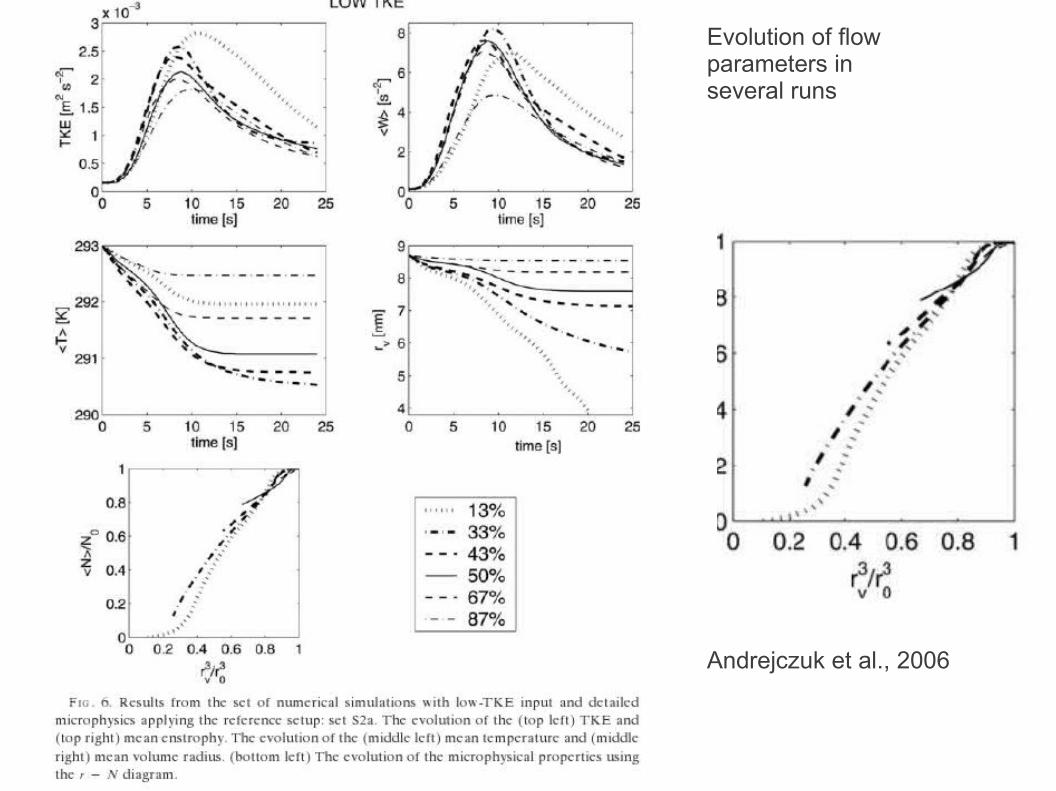
Evolution of flow parameters in several runs

Malinowski et al., 2008
Evolution of buoyancy in model domain: irreversible evaporative cooling

Anisotropy of turbulent velocities due to buoyancy production by evaporative cooling(Malinowski et al., 2008, Korczyk et al., 2012).Experimental - average for 20 different runs:
Std dev. Skewness Kurtosis (cm s−1 )u
1 5.4 −0.01 3.2
u3 8.0 −0.2 3.1
(u1)2 / (u
3)2 = 0.46 ± 0.07
Numerical (LWC 3.2 g/kg):
Std dev. Skewness Kurtosis (cm s−1 )u
1 3,19 0.01 3.3
u2
3,23 −0.03 3.2
u3 4,69 0.13 2.9
(uhor
)2 / (u3)2 = 0.52 ± 0.07
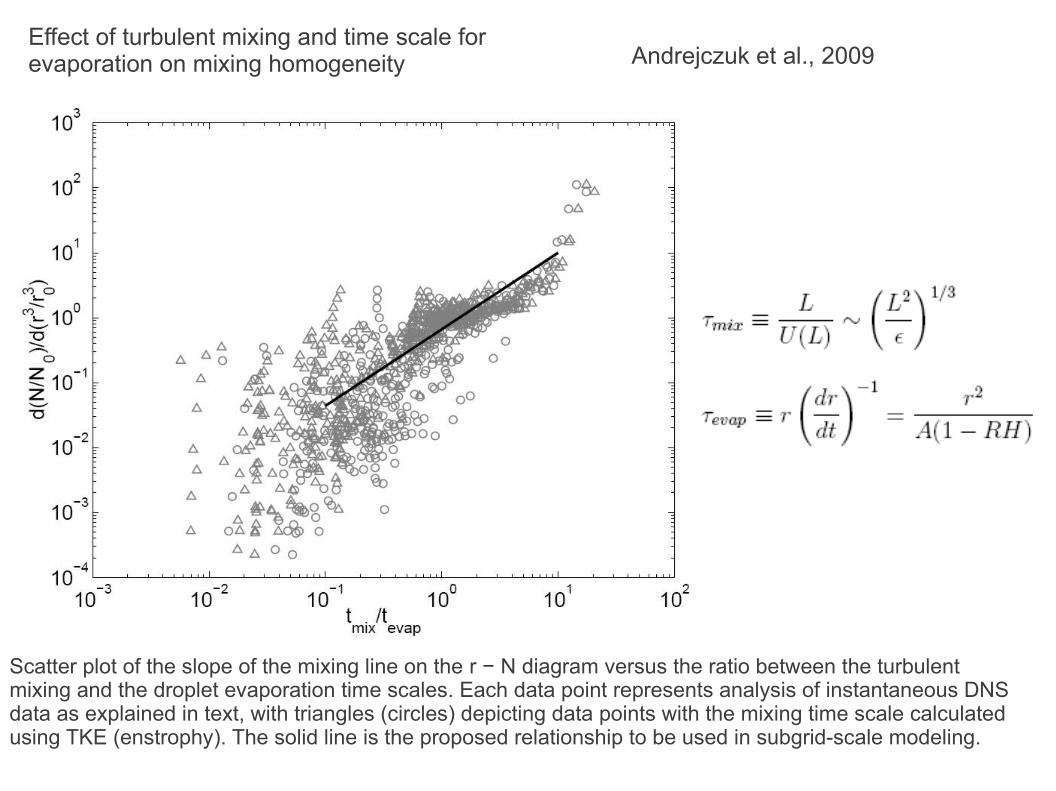
Scatter plot of the slope of the mixing line on the r − N diagram versus the ratio between the turbulent mixing and the droplet evaporation time scales. Each data point represents analysis of instantaneous DNS data as explained in text, with triangles (circles) depicting data points with the mixing time scale calculated using TKE (enstrophy). The solid line is the proposed relationship to be used in subgrid-scale modeling.
Andrejczuk et al., 2009Effect of turbulent mixing and time scale for evaporation on mixing homogeneity

Clouds are dispersions of drops and ice particles embedded in and interacting with a complex turbulent flow. They are highly nonstationary, inhomogeneous, and intermittent, and embody an enormous range of spatial and temporal scales. Strong couplings across those scales between turbulent fluid dynamics and microphysical processes are integral to cloud evolution.
Turbulence drives entrainment, stirring, and mixing in clouds, resulting in strong fluctuations in temperature, humidity, aerosol concentration, and cloud particle growth and decay. It couples to phase transition processes (such as nucleation, condensation, and freezing) as well as particle collisions and breakup. All these processes feed back on the turbulent flow by buoyancy and drag forces and affect cloud dynamical processes up to the largest scales.
Bodenschatz et al., Science, 2010.
SUMMARY AND COCLUSIONS:

The last decades have seen the emergence of new views into the “inner workings” of both clouds and turbulent flows. For example, high-resolution measurements of temperature, liquid water content, aerosol physical and chemical properties, and airflow reveal fascinating small-scale cloud structures, invisible with earlier technology. Laboratory experiments and numerical simulations are allowing us to study details of cloud microphysics, the fine structure of turbulence, turbulent Lagrangian dynamics, interactions and collisions between droplets. Scale-resolving simulations merging computational methods from both cloud and turbulence communities are yielding new insights into the wide variety of circulation regimes.
These new tools, experimental and computational, have begun to make it possible to explore the full complexity of microphysical and fluid-dynamical interactions within clouds. We can now begin to address: ➢How does turbulence influence phase transition processes like condensation, evaporation, activation, and freezing taking place inside clouds?➢How does turbulence influence particle-particle interactions like collisions, coalescence efficiencies, ice aggregation, and drop- or ice-breakup?➢How do microphysical processes feed back on the turbulence through latent-heat release, energy injection at small scales, and buoyancy reversal?➢How do small scale processes propagate to and couple to the larger scales, such as, cloud dynamics, precipitation formation, and radiative properties?

References:
Andrejczuk M, Grabowski WW, Malinowski SP, Smolarkiewicz PK. 2004. Numerical simulation of cloud-clear air interfacial mixing. J. Atmos. Sci. 61: 1726-1739.
Andrejczuk M, Grabowski WW, Malinowski SP, Smolarkiewicz PK. 2006. Numerical simulation of cloud-clear air interfacial mixing: e ects of cloud microphysicsff . J. Atmos. Sci. 63: 3204-3225.
Andrejczuk M, Grabowski WW, Malinowski SP, Smolarkiewicz PK. 2009. Numerical simulation of cloud-clear air interfacial mixing: homogeneous versus inhomogeneous mixing. J. Atmos. Sci. 66:2493-2500.
Ayala O, Rosa B, Wang L-P, Grabowski WW. 2008a. E ects of turbulence on the geometric collision rate of sedimenting droplets. Part 1. Results from direct numerical simulationff New J.Phys. 10:075015.
Ayala O, Rosa B, Wang L-P. 2008b. E ects of turbulence on the geometric collision rate of sedimenting droplets. Part 2. Theory and parameterizationff . NewJ.Phys. 10:075015.
Beard KV. 1976. Terminal velocity and shape of cloud and precipitation drops aloft. J. Atmos. Sci. 33:851-864.
Blyth AM, Cooper WA, Jensen JB. 1988. A study of the source of entrained air in Montana cumuli. J. Atmos. Sci. 45:3944-3964.
Blyth AM. 1993. Entrainment in cumulus clouds. J. Appl. Meteorol. 32:626-641.
Bodenschatz E, Malinowski SP, Shaw RA, Stratmann F. 2010. Can we understand clouds without turbulence? Science 327:970-971.
Brenguier J-L, Chaumat L. 2001a. Droplet spectra broadening in cumulus clouds. Part I: broadening in adiabatic cores. J. Atmos. Sci. 58:628-641.
Celani A, Falkovich G, Mazzino A, Seminara A. 2005. Droplet condensation in turbulent flows. Europhys. Lett. 70:775-781.
Devenish BJ, Bartello P, Brenguier J-L, Collins LR, Grabowski WW, Ijzermans RHA, Malinowski SP, Reeks MW, Vassilicos JC, Wang L-P, Warhaft Z, 2012: Droplet growth in warm turbulent clouds, QJRMS, DOI:10.1002/qj.1897
Falkovich G, Fouxon A, Stepanov MG. 2002. Acceleration of rain initiation by cloud turbulence. Nature 419:151-154.
Gerber H, Frick G, Malinowski SP, Brenguier J-L, Burnet F. 2005. Holes and entrainment in stratocumulus. J. Atmos. Sci. 62:443-459.
Gerber HE, Frick GM, Jensen JB, Hudson JG. 2008. Entrainment, mixing, and microphysics in trade-wind cumulus. J. Met. Soc. Japan 86A:87-106.

Grabowski WW, Clark TL. 1991. Cloud-environment interface instability: rising thermal calculations in two spatial dimensions. J. Atmos. Sci. 48:527-546.
Grabowski WW, Clark TL. 1993a: Cloud-environment interface instability. Part II: extension to three spatial dimensions. J. Atmos. Sci. 50:555-573.
Grabowski WW, Vaillancourt P. 1999. Comments on “Preferential concentration of cloud droplets by turbulence: e ects on the early evolution of cumulus cloud droplet spectra”ff. J. Atmos. Sci. 56:1433-1436.
Haman KE, Malinowski SP, Kurowski MJ, Gerber H, Brenguier J-L. 2007. Small-scale mixing processes at the top of a marine stratocumulus – a case-study. Q. J. R. Meteorol. Soc. 133:213-226.
Jaczewski A, Malinowski SP. 2005. Spatial distribution of cloud droplets in a turbulent cloud-chamber flow. Q.J.R. Meteorol. Soc. 131:2047-2062.
Je ery CA. 2007.ff Inhomogeneous cloud evaporation, invariance and Damkohler number. J. Geophys. Res. 112:D24S21.
Jonas PR. 1990. Observations of cumulus cloud entrainment. Atmos. Res. 25:105-127.
Kurowski MJ, Malinowski SP, Grabowski WW. 2009. A numerical investigation of entrain ment and transport within a stratocumulus-topped boundary layer. Q.J.R. Meteorol. Soc. 135:77-92.
Lanotte AS, Seminara A, Toschi F. 2009. Cloud droplet growth by condensation in homogeneous isotropic turbulence. J. Atmos. Sci. 66:1685-1697.
Malinowski SP, Andrejczuk M, Grabowski WW, Korczyk P, Kowalewski TA, Smolarkiewicz PK. 2008. Laboratory and modeling studies of cloud-clear air interfacial mixing: anisotropy of small-scale turbulence due to evaporative cooling. New J. Phys. 10:075020.
Pawlowska H, Grabowski WW, Brenguier J-L: 2006: Observations of the width of cloud droplet spectra in stratocumulus. Geophys. Res. Lett., 33, L19810
Rauber RM, and Coauthors 2007: Rain in Shallow Cumulus Over the Ocean: The RICO Campaign. Bull. Amer. Meteor. Soc., 88, 1912–1928.
Shaw RA. 2003. Particle-turbulence interactions in atmospheric clouds. Ann. Rev. Fluid.Mech. 35:183-227.
Siebert H, Lehmann K, Wendisch M. 2006. Observations of small-scale turbulence and energy dissipation rates in the cloudy boundary layer. J. Atmos. Sci. 63:1451-1466.
Siebert H, Shaw RA, Warhaft Z. 2010. Statistics of small-scale velocity fluctuations and internal intermittency in marine stratocumulus clouds. J. Atmos. Sci. 67:262-273.
Siebert H, S. Gerashchenko, A. Gylfason, K. Lehmann, L.R. Collins, R.A. Shaw, Z. Warhaft, 2010: Towards understanding the role of turbulence on droplets in clouds: In situ and laboratory measurements, Atmos.Res. 97- 4: 426-437.
Stevens B. 2002. Entrainment in stratocumulus-topper mixed layers. Q.J.R. Meteorol. Soc. 128:2663-2690.
Stevens B, Lenschow DH, Vali G, Gerber H, Bandy A, Blomquist B, Brenguier J-L, Bretherton CS, Burnet F, Campos T, Chai S, Faloona I, Friesen D, Haimov S, Laursen K, Lilly DK, Loehrer SM, Malinowski SP, Morley B, Petters MD, Rogers DC, Russell L, Savic-Jovcic V, Snider JR, Straub D, Szumowski MJ, Takagi H, Thornton DC, Tschudi M, Twohy C, Wetzel M, van Zanten MC. 2003. Dynamics and chemistry of marine stratocumulus – DYCOMS-II. Bull. Am. Meteorol. Soc. 84: 579–593.
Stevens B, Moeng C-H, Ackerman AS, Bretherson CS, Chlond A, de Roode S, Edwards J, Golaz J-C, Jiang H, Khairoutdinov M, Kirkpatrick MP, Lewellen DC, Lock A, Mueller F, Stevens DE, Whelan E, Zhu P. 2005. Evaluation of large-eddy simulations via observations of nocturnal marine stratocumulus. Mon. Wea. Rev. 133:1443-1462.
Stevens B, Vali G, Comstock K, Wood R, Van Zanten MC, Austin PH, Bretherton CS, Lenschow DH, 2005: Pockets of open cells and drizzle in marine stratocumulus. Bull. Amer. Meteor. Soc., 86: 51–57.
Stevens B. 2005: Atmospheric moist convection. Annu. Rev. Earth Planet. Sci. 33: 605–643
Stevens, B, Feingold, G. 2009: Untangling aerosol effects on clouds and precipitation in a buffered system, Nature, 461, no. 7264, 607-613.
Vaillancourt PA, Yau MK. 2000. Review of particle-turbulence interactions and consequences for cloud physics. Bull. Am. Meteorol. Soc. 81:285-298.
Vaillancourt PA, Yau MK, Bartello P, Grabowski WW. 2002. Microscopic approach to cloud droplet growth by condensation. Part II: turbulence, clustering and condensational growth. J. Atmos. Sci. 59:3421-3435.
Villermaux E, Bossa B, 2009: Single-drop fragmentation determines size distribution of raindrops, Narure-Physics, 5, 697 - 702Wang L-P, Grabowski WW. 2009. The role of air turbulence in warm rain initiation. Atmos. Sci. Lett. 10:1-8.
Warhaft Z. 2009. Laboratory studies of droplets in turbulence: towards understanding the formation of clouds. Fluid Dyn. Res. 41:011201.
Warner J. 1970. On steady-state one-dimensional models of cumulus convections. J. Atmos. Sci. 27:1035-1040.
COLOR CODE: Active links Reviews papers Key field campaigns and results from in-situ measurements


![,QWURGXFWLRQ - Szymon Szott · ô ^ ] } v î. cadwan.pdf](https://img.dokumen.tips/doc/110x75/5f05d0a97e708231d414d866/qwurgxfwlrq-szymon-szott-v-cadwanpdf.jpg)