Embed Size (px)
Citation preview
184 Chapter 4 Solving Systems of Linear Equations
Systems of Linear Inequalities4.5
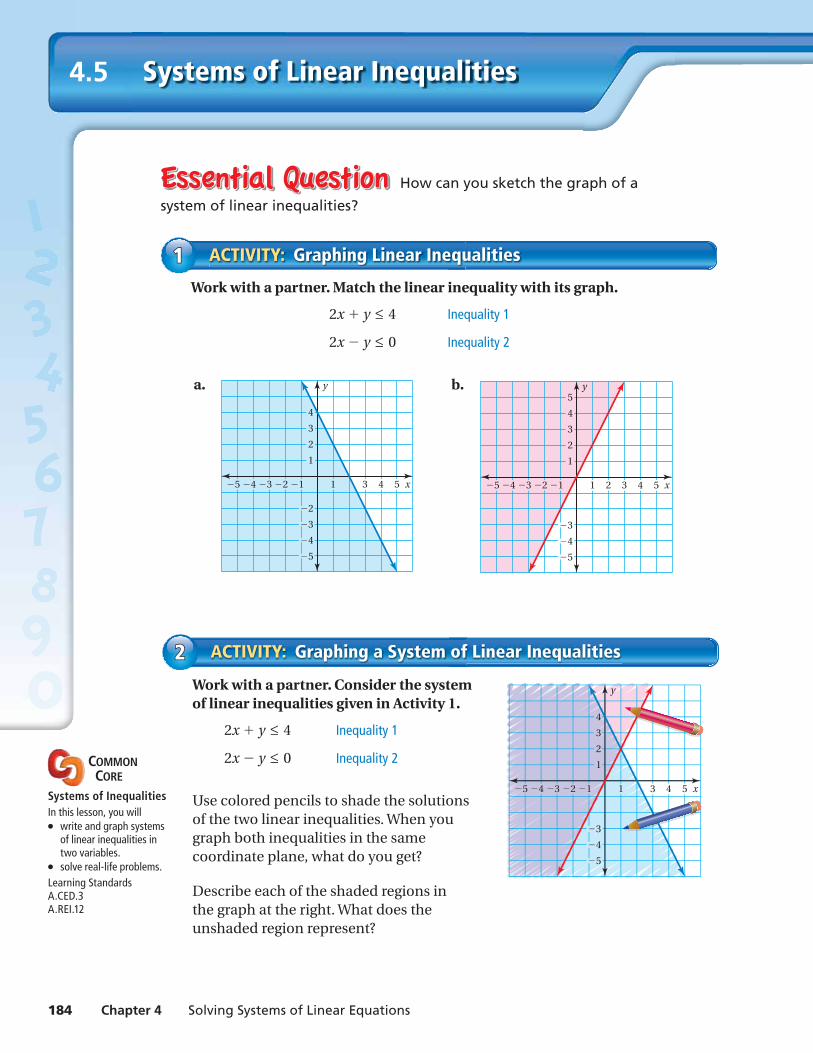
Work with a partner. Match the linear inequality with its graph.
2x + y ≤ 4 Inequality 1
2x − y ≤ 0 Inequality 2
a.
x
y
3
4
2
1
3
4
5
2
4 5312 1345
b.
x
y
3
4
5
2
1
3
4
5
4 53212 1345
ACTIVITY: Graphing Linear Inequalities11
How can you sketch the graph of a
system of linear inequalities?
Work with a partner. Consider the system
x
y
3
4
2
1
3
4
5
4 5313 2 145
of linear inequalities given in Activity 1.
2x + y ≤ 4 Inequality 1
2x − y ≤ 0 Inequality 2
Use colored pencils to shade the solutions of the two linear inequalities. When you graph both inequalities in the same coordinate plane, what do you get?
Describe each of the shaded regions in the graph at the right. What does the unshaded region represent?
ACTIVITY: Graphing a System of Linear Inequalities22
COMMON CORE
Systems of Inequalities In this lesson, you will● write and graph systems
of linear inequalities in two variables.
● solve real-life problems.Learning StandardsA.CED.3A.REI.12

Section 4.5 Systems of Linear Inequalities 185
Work with a partner. Write a system of 4 linear inequalities whose solution is the traffi c sign at the right.
(1) x + y ≤
(2) x + y ≥
(3) x − y ≤
(4) x − y ≥
ACTIVITY: Writing a System of Linear Inequalities33
5. IN YOUR OWN WORDS How can you sketch the graph of a system of linear inequalities?
6. When graphing a system of linear inequalities, which region represents the solution of the system? Do you think all systems have a solution? Explain.
Use what you learned about systems of linear inequalitiesto complete Exercises 7–9 on page 189.
Two states can be represented as the graph of a system of linear inequalities. Identify the two states. Explain your reasoning.
ACTIVITY: Representing a State by a Linear System44
x
y
3
5
2
1
3
2
5
4 53212 1345
Use Clear Defi nitionsWhat is a system of linear inequalities? How can this defi nition help you identify the states?
Math Practice

186 Chapter 4 Solving Systems of Linear Equations
Lesson4.5Lesson Tutorials
EXAMPLE Checking Solutions11Tell whether each ordered pair is a solution of the system.
y < 2x Inequality 1
y ≥ x + 1 Inequality 2
a. (3, 5) b. (− 2, 0)
Inequality 1 Inequality 2 Inequality 1 Inequality 2
y < 2x y ≥ x + 1 y < 2x y ≥ x + 1
5 <?
2(3) 5 ≥?
3 + 1 0 <?
2(− 2) 0 ≥?
− 2 + 1
5 < 6 ✓ 5 ≥ 4 ✓ 0 < − 4 ✗ 0 ≥ − 1 ✓ (3, 5) is a solution of both
inequalities. So, it is a solution of the system.
(− 2, 0) is not a solution of both inequalities. So, it is not a solution of the system.
Tell whether the ordered pair is a solution of the system of linear inequalities.
1. y < 5 2. y ≤ − 2x + 5
y > x − 4; (− 1, 5) y < x + 3; (0, − 1)
Exercises 4 – 6
A system of linear inequalities is a set of two or more linear inequalities in the same variables. An example is shown below.
y < x + 2 Inequality 1
y ≥ 2x − 1 Inequality 2
A solution of a system of linear inequalities in two variables is an ordered pair that is a solution of each inequality in the system.
The graph of a system of linear inequalities is the graph of all of the solutions of the system.
Graphing a System of Linear Inequalities
Step 1 Graph each inequality in the same coordinate plane.
Step 2 Find the intersection of the half-planes. This intersection is the graph of the system.
Key Vocabularysystem of linear inequalities, p. 186solution of a system of linear
inequalities, p. 186graph of a system of linear
inequalities, p. 186
x
y
4
5
6
1
43213 51
y 2x 1
y x 2

Section 4.5 Systems of Linear Inequalities 187
EXAMPLE Graphing a System of Linear Inequalities22Graph the system.
y ≤ 3 Inequality 1
y > x + 2 Inequality 2
Step 1: Graph each inequality.
Step 2: Find the intersection of the half-planes. One solution is (− 3, 1).
Exercises 7 –15
EXAMPLE Graphing a System of Linear Inequalities: No Solution33Graph the system.
2x + y < −1 Inequality 1
2x + y > 3 Inequality 2
Step 1: Graph each inequality.
Step 2: Find the intersection of the half-planes.
So, the system has no solution.
Graph the system of linear inequalities.
3. y ≥ − x + 4 4. y > 2x − 3 5. − 2x + y < 4
x + y ≤ 0 y ≥ 1
— 2
x + 1 2x + y > 4
Study TipFor help with graphing linear inequalities, see Section 3.5.
Check
Verify that (− 3, 1) is a solution of each inequality.
Inequality 1 Inequality 2
y ≤ 3 y > x + 2
1 ≤ 3 ✓ 1 >?
− 3 + 2
1 > − 1 ✓
x
y
4
5
1
321345 1
2
3
( 3, 1)
The solution is thepurple shaded region.
x
y
3
2
1
3
4
2
4312 134
The lines are paralleland the half-planesdo not intersect.
188 Chapter 4 Solving Systems of Linear Equations
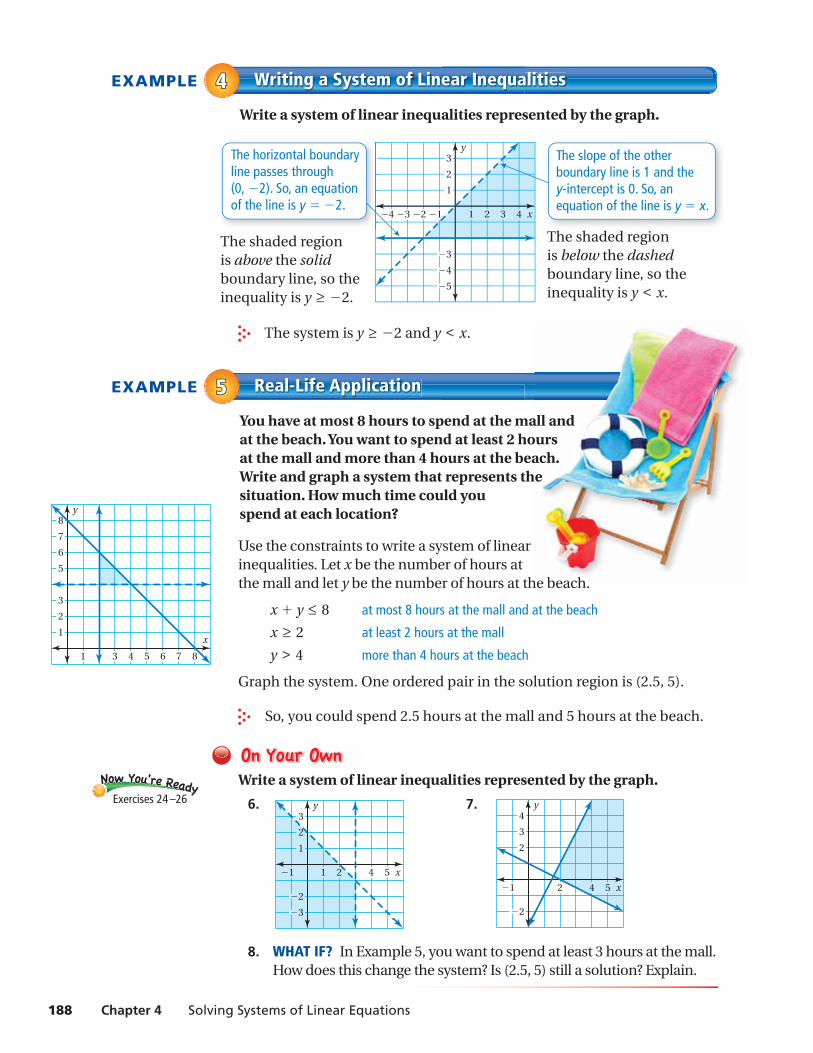
EXAMPLE Writing a System of Linear Inequalities44Write a system of linear inequalities represented by the graph.
The system is y ≥ − 2 and y < x.
Exercises 24 –26
EXAMPLE Real-Life Application55You have at most 8 hours to spend at the mall and at the beach. You want to spend at least 2 hours at the mall and more than 4 hours at the beach. Write and graph a system that represents the situation. How much time could you spend at each location?
Use the constraints to write a system of linear inequalities. Let x be the number of hours at the mall and let y be the number of hours at the beach.
x + y ≤ 8 at most 8 hours at the mall and at the beach
x ≥ 2 at least 2 hours at the mall
y > 4 more than 4 hours at the beach
Graph the system. One ordered pair in the solution region is (2.5, 5).
So, you could spend 2.5 hours at the mall and 5 hours at the beach.
Write a system of linear inequalities represented by the graph.
6.
x
y3
2
1
3
2
41 521
7.
x
y
3
4
2
2
4 521
8. WHAT IF? In Example 5, you want to spend at least 3 hours at the mall. How does this change the system? Is (2.5, 5) still a solution? Explain.
x
y3
2
1
3
4
5
431 22 134
The horizontal boundaryline passes through(0, 2). So, an equationof the line is y 2.
The slope of the otherboundary line is 1 and they-intercept is 0. So, anequation of the line is y x.
The shaded region is above the solid boundary line, so the inequality is y ≥ − 2.
The shaded region is below the dashed boundary line, so the inequality is y < x.
x
y
3
5
6
7
8
2
1
4 5 6 7 831
all andours ach.
he
he beach

Section 4.5 Systems of Linear Inequalities 189
9+(-6)=3
3+(-3)=
4+(-9)=
9+(-1)=
1. VOCABULARY How can you verify that an ordered pair is a solution of a system of linear inequalities?
2. WRITING How are solving systems of linear inequalities and systems of linear equations similar? How are they different?
3. REASONING Is the point shown a solution of the system of linear inequalities? Explain.
Tell whether the ordered pair is a solution of the system of linear inequalities.
4. y < 4 5. y > − 2 6. y ≤ x + 7
y > x + 3; (− 5, 2) y ≤ x − 5 ; (1, − 1) y ≥ 2x + 3; (0, 0)
Graph the system of linear inequalities.
7. y < − 3 8. y > − x + 3 9. x + y > 1
y ≥ 5x − 2x + y ≥ 0 − x − y < − 3
10. y < − 2 11. y ≥ − 5 12. x + y > 4
y > 2 y < 3x + 1 y > 3
— 2
x − 9
13. − x + y < − 1 14. 2x + y ≤ 5 15. − 2x − 5y < 15
− x − 1 ≥ − y y + 2 ≥ − 2x − 4x > 10y + 60
16. MUFFINS You can spend at most $21 on fruit. Blueberries cost $4 per pound and strawberries cost $3 per pound. You need at least 3 pounds to make muffi ns.
a. Defi ne the variables.
b. Write a system of linear inequalities that represents this situation.
c. Graph the system of linear inequalities.
d. Is it possible to buy 4 pounds of blueberries and 1 pound of strawberries in this situation? Justify your answer.
Help with Homework
11
33
Exercises4.5 Exercises
22
x
y
21 3 4 51
3
2
4
5
(2, 3)
alities
qualitieieess.s.s.s.s.ssss
f blueberrieiess this situation?

190 Chapter 4 Solving Systems of Linear Equations
ERROR ANALYSIS Describe and correct the error in graphing the system of linear inequalities.
17. y ≥ x + 3 18. y ≤ 3x + 4
y < − x − 2 y > 1
— 2
x + 2
✗
✗
Match the graph with the corresponding system of linear inequalities.
19.
x
y
21134
4
5
1 20.
x
y
2 312 13
2
1
3 21.
x
y
2 312 13
2
1
3
A. y < 4x + 1 B. − x + y ≥ − 1 C. − 1
— 2
x + y < 2
y ≥ − 3x − 2 2x + y > − 4 − 2x + 4y > − 12
22. REASONING Describe the intersection of the half-planes of the system shown.
x − y ≤ 4
x − y ≥ 4
23. JOBS You earn $12 per hour working as a manager at a grocery store. You also coach a soccer team for $10 per hour. You need to earn at least $110 per week, but you do not want to work more than 20 hours per week.
a. Write and graph a system of linear inequalities that represents this situation.
b. Identify and interpret one solution of the system.
x
y
2456
3
2
2
1
3
x
y
21234
1
4
5

Section 4.5 Systems of Linear Inequalities 191
Write a system of linear inequalities represented by the graph.
24.
x
y
2 3 4 51
2
1
3
5
6 25.
x
y
2 3123
3
2
1
3 26.
x
y
3 42 1
3
2
1
Graph the system of linear inequalities.
27. y > 1 28. y ≤ 5x − 6 29. − 4x + 2y < 12
x ≥ 2 y > 0.5x − 4 6x + y ≤ 9
y > x − 1 y < − x + 7 − 9x + 3y ≥ − 15
30. STRUCTURE Write a system of linear inequalities that is equivalent to ∣ y ∣ < x where x > 0. Graph the system.
31. REPEATED REASONING One inequality in a system is − 4x + 2y > 6. Write another inequality so the system has (a) no solution and (b) infi nitely many solutions.
32. AMUSEMENT PARK You have at most 8 hours to spend at an amusement park. You want to spend less than 3 hours playing games and at least 4 hours on rides. How much time can you spend on each activity?
33. ROAD TRIP On a road trip, you drive about 70 miles per hour and your friend drives about 60 miles per hour. The plan is to drive less than 15 hours and at least 600 miles each day. Your friend will drive more hours than you. Identify and interpret one solution of this situation.
34. The following points are the vertices of a triangle.
(2, 5), (6, − 3), (− 2, − 3)
a. Write a system of linear inequalities that represents the triangle.
b. Find the area of the triangle.
Evaluate the expression when a = −2, b = 3, and c = –1. (Skills Review Handbook)
35. 4a − bc 36. ab + c 2 37. − 3c − ac
38. MULTIPLE CHOICE What is the solution of 2(x − 4) = − (− x + 3)? (Section 1.3)
○A x = − 5 ○B x = 2 ○C x = 5 ○D x = 7
44