Embed Size (px)
Citation preview
Systems of Inequalities in Two Variables
Sec. 7.5a

Graph of an Inequality
An ordered pair (a, b) of real numbers is a solution of aninequality in x and y if the substitution x = a and y = bsatisfies the inequality.
Example Which of the given points is a solution to the given inequality?2 3y x
2,5 2,8

Graph of an Inequality
An ordered pair (a, b) of real numbers is a solution of aninequality in x and y if the substitution x = a and y = bsatisfies the inequality.
When we have found all the solutions, we have solved theinequality.
The graph of an inequality in x and y consists of all pairs(x, y) that are solutions of the inequality.

Steps for Drawing the Graph of anInequality in Two Variables
1. Draw the graph of the equation obtained by replacing the inequality sign by an equal sign. Use a dashed line if the inequality is < or >. Use a solid line if the inequality is < or >.
2. Check a point in each of the two regions of the plane determined by the graph of the equation. If the point satisfies the inequality, then shade the region containing the point.

Practice ProblemsDraw the graph of the given inequality. State the boundary ofthe region.
2 3y x
(0, 3)
1. Graph the line y = 2x + 3
(–1.5, 0)
(solid or dashed line?)
2. Choose a point not on the line plug into the original inequality
3. Shade the appropriate region

Practice ProblemsDraw the graph of the given inequality. State the boundary ofthe region.
2 3y x
(0, 3)
The graph of a linear inequalityin any of the following forms:
(–1.5, 0)
is a half-plane
The graph of the line y = ax + bis the boundary of the region.
y ax b y ax b
y ax b y ax b
Boundary line: y = 2x + 3is included

Practice ProblemsDraw the graph of the given inequality. State the boundary ofthe region.
2x
(2, 0)
Boundary line x = 2is included
(0, –3)
Boundary line y = –3is excluded
3y

Practice ProblemsDraw the graph of the given inequality. State the boundary ofthe region. 2 3y x
Boundary curve y = x – 3is included
2
(0, –3)

Systems of Inequalities
A solution of a system of inequalities in x and y is anordered pair (x, y) that satisfies each inequality in the system.
When we have found all the common solutions, we havesolved the system of inequalities.
Graphically, we use the same techniques as when we were working with single inequalities!!!

Practice ProblemsSolve the given system. 2y x
Corners: (–1.535, 2.357),(0.869, 0.754)
2 3 4x y
Boundaries are excluded
The solution is the set ofall ordered pairs in the
shaded region

Practice ProblemsSolve the given system. 3 12x y
3 4 18x y 0x0y
Corners: (0, 0), (4, 0),(0, 9/2), (10/3, 2)
Boundaries are included
The solution is the set ofall ordered pairs in the
shaded region
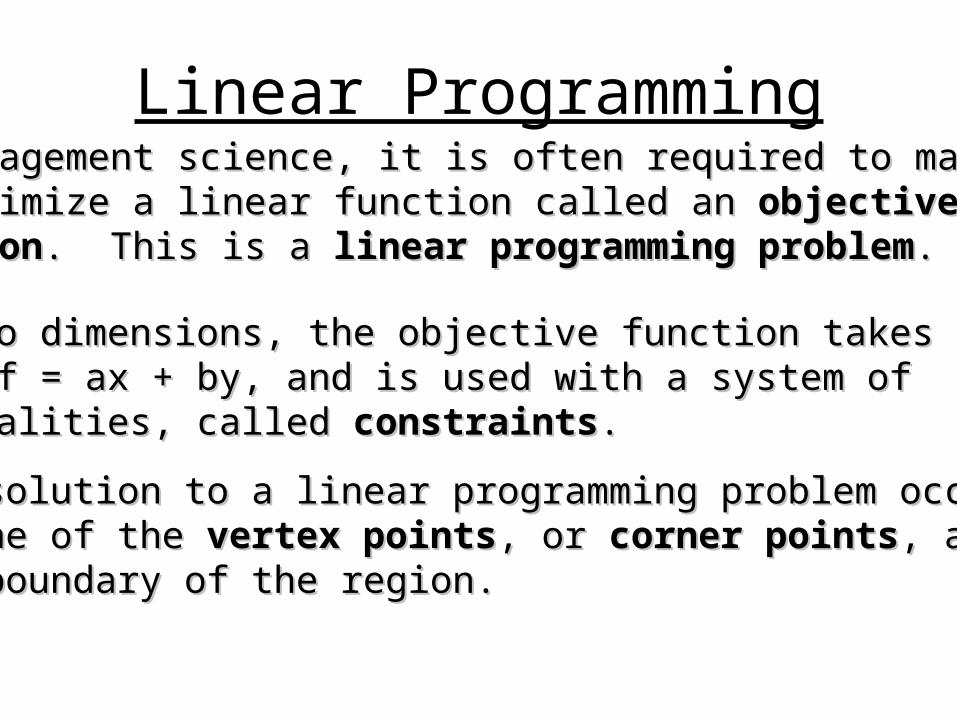
Linear ProgrammingIn management science, it is often required to maximizeIn management science, it is often required to maximizeor minimize a linear function called an or minimize a linear function called an objectiveobjectivefunctionfunction. This is a . This is a linear programming problemlinear programming problem..
In two dimensions, the objective function takes theIn two dimensions, the objective function takes theform f = ax + by, and is used with a system ofform f = ax + by, and is used with a system ofinequalities, called inequalities, called constraintsconstraints..
The solution to a linear programming problem occursThe solution to a linear programming problem occursat one of the at one of the vertex pointsvertex points, or , or corner pointscorner points, along, alongthe boundary of the region.the boundary of the region.

Linear Programming Practice Problems
2 8x y 0x
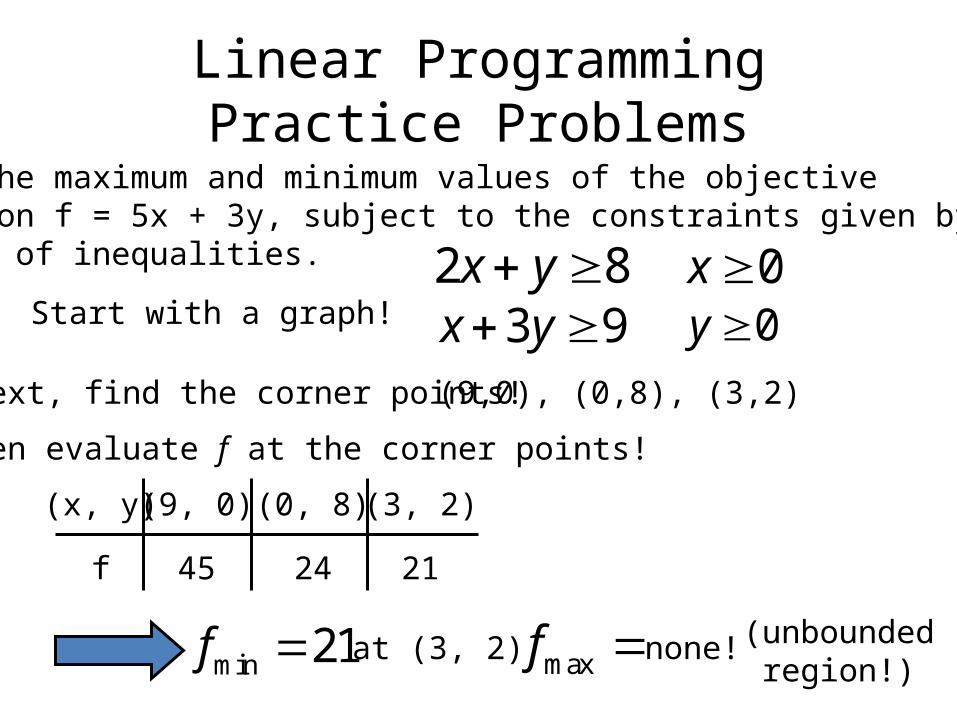
Find the maximum and minimum values of the objectivefunction f = 5x + 3y, subject to the constraints given by thesystem of inequalities.
3 9x y 0y Start with a graph!
(0,8)
(0,3)
(4,0) (9,0)
Linear Programming Practice Problems
2 8x y 0x
Find the maximum and minimum values of the objectivefunction f = 5x + 3y, subject to the constraints given by thesystem of inequalities.
3 9x y 0y Start with a graph!
Next, find the corner points!
Then evaluate f at the corner points!
(9,0), (0,8), (3,2)
(x, y)
f
(9, 0)
45
(0, 8)
24
(3, 2)
21
min 21f maxf at (3, 2) none! (unboundedregion!)

Linear Programming Practice Problems
2 10x y 0x
Find the maximum and minimum values of the objectivefunction f = 5x + 8y, subject to the constraints given by thesystem of inequalities.
2 3 14x y 0y Where’s the graph?
(0,10)
(0,14/3)
(5,0) (7,0)

Linear Programming Practice Problems
2 10x y 0x
Find the maximum and minimum values of the objectivefunction f = 5x + 8y, subject to the constraints given by thesystem of inequalities.
2 3 14x y 0y Where’s the graph?
Corner points?
Evaluation of f ?
(0,0), (0,14/3), (5,0), (4,2)
(x, y)
f
(0, 0)
0
(0, 14/3)
112/3
(5, 0)
25
(4, 2)
36
min 0f max
112
3f at (0, 0) at (0, 14/3)

Linear Programming Practice Problems
2 6x y 8y
Find the maximum and minimum values of the objectivefunction f = 3x – 2y, subject to the constraints given by thesystem of inequalities.
10 10x y 5 10x y Where’s the graph?
(0,8)
(0,1)
(0,10)
(2,0) (3,0) (10,0)

Linear Programming Practice Problems
2 6x y 8y
Find the maximum and minimum values of the objectivefunction f = 3x – 2y, subject to the constraints given by thesystem of inequalities.
10 10x y 5 10x y Where’s the graph?
Corner points?
Evaluation of f ?
(2/5,8), (7,8), (90/49,40/49), (10/3,2/3)
(x, y)
f
(2/5, 8)
–14.8
(7, 8)
5
(90/49, 40/49) (10/3, 2/3)
min 14.8f max
26
3f at (2/5,8) at (10/3,2/3)
3.878190/49 8.66726/3