Embed Size (px)
Citation preview
Systems Biology Graphical Notation:Process Diagram Level 1
Release 1.0
Date: 15 August, 2008
Editors:
Nicolas Le Novere EMBL European Bioinformatics Institute, UKStuart Moodie CSBE, University of Edinburgh, UKAnatoly Sorokin University of Edinburgh, UKMichael Hucka California Institute of Technology, USA
Principal Authors:
Nicolas Le Novere EMBL European Bioinformatics Institute, UKStuart Moodie CSBE, University of Edinburgh, UKAnatoly Sorokin University of Edinburgh, UKMichael Hucka California Institute of Technology, USAFalk Schreiber IPK Gatersleben & MLU Halle, GermanyEmek Demir MSKCC Computational Biology Center, USAHuaiyu Mi SRI International, USAYukiko Matsuoka The Systems Biology Institute, JapanKatja Wegner University of Hertfordshire, UKandHiroaki Kitano The Systems Biology Institute, Japan
To discuss any aspect of SBGN, please send your messages to the mailing [email protected]. To get subscribed to the mailing list or to contactus directly, please write to [email protected]. Bug reports and specificcomments about the specification should be entered in the issue tracker http://sourceforge.net/tracker/?group_id=178553&atid=1082245.
Nat
ure
Pre
cedi
ngs
: hdl
:101
01/n
pre.
2008
.232
0.1
: Pos
ted
22 S
ep 2
008
Preface
AcknowledgementsThe authors are grateful to all the attendees of the SBGN meetings, as well as to the subscribersof the [email protected] mailing list. The authors would like to acknowledge especiallythe help of Frank Bergmann, Sarala Dissanayake, Ralph Gauges, Peter Ghazal, and Lu Li. SMand AS would also like to acknowledge Igor Goryanin whose financial support and encourage-ment enabled us to commit the necessary time to the development of this specification. A morecomprehensive list of people involved in SBGN development is available in the appendix D.
The development of SBGN was mainly supported by a grant from the Japanese New En-ergy and Industrial Technology Development Organization (NEDO, http://www.nedo.go.jp/).The Okinawa Institute of Science and Technology (OIST, http://www.oist.jp/), the AISTComputational Biology Research Center (AIST CBRC, http://www.cbrc.jp/index.eng.html)the British Biotechnology and Biological Sciences Research Council (BBSRC, http://www.bbsrc.ac.uk/) through a Japan Partnering Award, the European Media Laboratory (EMLResearch gGmbH, http://www.eml-r.org/), and the Beckman Institute at the California Insti-tute of Technology (http://bnmc.caltech.edu) provided additional support for SBGN work-shops. Some help was provided by the Japan Science and Technology Agency (JST, http://www.jst.go.jp/) and the Genome Network Project of the Japanese Ministry of Education,Sports, Culture, Science, and Technology (MEXT, http://www.mext.go.jp/) for the develop-ment of the gene regulation network aspect of SBGN, and from the Engineering and PhysicalSciences Research Council (EPSRC, http://www.epsrc.ac.uk) during the redaction of thespecification.
Notes on typographical conventionsThe concept represented by a glyph is written using a normal font, while a glyph means theSBGN visual representation of the concept.
ii
Nat
ure
Pre
cedi
ngs
: hdl
:101
01/n
pre.
2008
.232
0.1
: Pos
ted
22 S
ep 2
008
Contents
Preface ii
1 What is the Systems Biology Graphical Nota-tion? 11.1 History of SBGN development . . . . . . 11.2 The three languages of SBGN . . . . . . 21.3 SBGN levels . . . . . . . . . . . . . . . 31.4 Developments, discussions, and notifica-
tions of updates . . . . . . . . . . . . . . 3
2 Process Diagram glyphs 52.1 Overview . . . . . . . . . . . . . . . . . 52.2 Controlled vocabularies used in SBGN Pro-
cess Diagram Level 1 . . . . . . . . . . . 72.2.1 Entity pool node material types . . 72.2.2 Entity pool node conceptual types . 82.2.3 Macromolecule covalent modifications 82.2.4 Physical characteristics of compart-
ments . . . . . . . . . . . . . . . 82.2.5 Cardinality . . . . . . . . . . . . . 9
2.3 Entity pool nodes . . . . . . . . . . . . . 92.3.1 Glyph: Unspecified entity . . . . . 102.3.2 Glyph: Simple chemical . . . . . . 102.3.3 Glyph: Macromolecule . . . . . . . 112.3.4 Glyph: Nucleic acid feature . . . . 122.3.5 Glyph: Multimer . . . . . . . . . . 122.3.6 Glyph: Source/sink . . . . . . . . 142.3.7 Glyph: Perturbation . . . . . . . . 142.3.8 Glyph: Observable . . . . . . . . 152.3.9 Glyph: Tag . . . . . . . . . . . . . 152.3.10 Glyph: Unit of information . . . . . 162.3.11 Glyph: State variable . . . . . . . 172.3.12 Glyph: Clone marker . . . . . . . 182.3.13 Examples of complex EPNs . . . . 20
2.4 Container nodes . . . . . . . . . . . . . 212.4.1 Glyph: Complex . . . . . . . . . . 212.4.2 Glyph: Compartment . . . . . . . 222.4.3 Glyph: Submap . . . . . . . . . . 24
2.5 Process nodes . . . . . . . . . . . . . . 262.5.1 Glyph: Transition . . . . . . . . . 262.5.2 Glyph: Omitted process . . . . . . 282.5.3 Glyph: Uncertain process . . . . . 292.5.4 Glyph: Association . . . . . . . . 292.5.5 Glyph: Dissociation . . . . . . . . 31
2.6 Connecting arcs . . . . . . . . . . . . . . 312.6.1 Glyph: Consumption . . . . . . . . 312.6.2 Glyph: Production . . . . . . . . . 322.6.3 Glyph: Modulation . . . . . . . . . 332.6.4 Glyph: Stimulation . . . . . . . . . 34
2.6.5 Glyph: Catalysis . . . . . . . . . . 342.6.6 Glyph: Inhibition . . . . . . . . . . 352.6.7 Glyph: Trigger . . . . . . . . . . . 352.6.8 Glyph: Logic arc . . . . . . . . . 362.6.9 Glyph: Equivalence arc . . . . . . 37
2.7 Logical operators . . . . . . . . . . . . . 372.7.1 Glyph: And . . . . . . . . . . . . 372.7.2 Glyph: Or . . . . . . . . . . . . . 382.7.3 Glyph: Not . . . . . . . . . . . . . 38
3 Process Diagram grammar 403.1 Overview . . . . . . . . . . . . . . . . . 403.2 Concepts . . . . . . . . . . . . . . . . . 403.3 The conceptual model . . . . . . . . . . . 403.4 Syntax . . . . . . . . . . . . . . . . . . 51
3.4.1 Entity Pool Nodes connectivity defi-nition . . . . . . . . . . . . . . . 51
3.4.2 Process Nodes connectivity definition 513.4.3 Containment definition . . . . . . . 513.4.4 Syntactic rules . . . . . . . . . . . 52
3.5 Semantic rules . . . . . . . . . . . . . . 533.5.1 Namespaces . . . . . . . . . . . 533.5.2 Cloning . . . . . . . . . . . . . . 543.5.3 State variables . . . . . . . . . . . 543.5.4 Compartment spanning . . . . . . 543.5.5 Compartments . . . . . . . . . . . 553.5.6 Modulation . . . . . . . . . . . . . 553.5.7 Submaps . . . . . . . . . . . . . 55
4 Layout Guidelines for a Process Diagram 574.1 Introduction . . . . . . . . . . . . . . . . 574.2 Layout guidelines . . . . . . . . . . . . . 58
4.2.1 Requirements . . . . . . . . . . . 584.2.2 Recommendations . . . . . . . . . 604.2.3 Additional suggestions . . . . . . . 61
A Complete examples of SBGN Process DiagramLevel 1 graphs 62
B Reference card 66
C Issues postponed to future levels 68C.1 Multicompartment entities . . . . . . . . . 68C.2 Logical combination of state variable values 68C.3 Non-chemical entity nodes . . . . . . . . 68C.4 Generics . . . . . . . . . . . . . . . . . 68C.5 State and transformation of compartments 69
D Extended list of people involved in SBGN Pro-cess Diagram Level 1 developement 70
iii
Nat
ure
Pre
cedi
ngs
: hdl
:101
01/n
pre.
2008
.232
0.1
: Pos
ted
22 S
ep 2
008
Chapter 1
What is the Systems Biology GraphicalNotation?
The goal of the Systems Biology Graphical Notation (SBGN) is to standardize the graph-ical/visual representation of essential biochemical and cellular processes studied in systemsbiology. SBGN defines a comprehensive set of symbols with precise semantics, together withdetailed syntactic rules defining their use. It also describes the manner in which such graphicalinformation should be interpreted.
Standardizing graphical notations for describing biological interactions is an important steptowards the efficient and accurate transmission of biological knowledge between different com-munities. Traditionally, diagrams representing interactions among genes and molecules havebeen drawn in an informal manner, using simple unconstrained shapes and edges such as ar-rows. Until the development of SBGN, no standard agreed-upon convention existed definingexactly how to draw such diagrams in a way that helps readers interpret them consistently, cor-rectly, and unambiguously. By standardizing the visual notation, SBGN can serve as a bridgebetween different communities such as computational and experimental biologists, and evenmore broadly in education, publishing, and more.
For SBGN to be successful, it must satisfy a majority of technical and practical needs, andmust be embraced by the community of researchers in biology. With regards to the technicaland practical aspects, a successful visual language must meet at least the following goals:
1. Allow the representation of diverse biological objects and interactions;
2. Be semantically and visually unambiguous;
3. Allow implementation in software that can aid the drawing and verification of diagrams;
4. Have semantics that are sufficiently well defined that software tools can convert graphicalmodels into formal models, suitable for analysis if not for simulation;
5. Be unrestricted in use and distribution, so that the entire community can freely use thenotation without encumbrance or fear of intellectual property infractions.
This document defines the Process Diagram visual language of SBGN. As explained morefully in Section 1.2, Process Diagrams are one of three views of a model offered by SBGN. Itis the product of many hours of discussion and development by many individuals and groups.In the following sections, we describe the background, motivations, and context of ProcessDiagrams.
1.1 History of SBGN developmentAlthough problems surrounding the representation of biological pathways has been discussed fora long time, see for instance [1], the effort to create a well-defined visual notation was pioneered
1
Nat
ure
Pre
cedi
ngs
: hdl
:101
01/n
pre.
2008
.232
0.1
: Pos
ted
22 S
ep 2
008

CHAPTER 1. WHAT IS THE SYSTEMS BIOLOGY GRAPHICAL NOTATION? 2
by Kurt Kohn with his Molecular Interaction Map (MIM), a notation defining symbols andsyntax to describe the interactions of molecules [2]. MIM is essentially a variation of the entity-relationship diagrams [3]. Kohn’s work was followed by numerous other attempts to defineboth alternative notations for diagramming cellular processes (e.g., the work of Pirson andcolleagues [4], BioD [5], Patika [6, 7], and others), as well as extensions of Kohn’s notation (e.g.,the Diagrammatic Cell Language of Maimon and Browning [8]).
Kitano originated the idea of having multiple views of the same model. This addressestwo problems: no single view can satisfy the needs of all users, and a given view can onlyrepresent a subset of the semantics necessary to express biological knowledge. Kitano proposedthe development of process diagrams, entity-relationship diagrams, timing charts (to describetemporal changes in a system), and abstract flow charts [9]. The Process Diagram notation wasthe first to be fully defined using a well-delineated set of symbols and syntax [10]. It led to adesire to establish a unified standard for graphical representation of biochemical entities, andfrom this arose the current SBGN effort. Separately and roughly concurrently, other groupsdesigned similar notations, for example the Edinburgh Pathway Notation [11] or Patika [6, 7].All of these efforts began to attract attention as more emphasis in biological research was placedon networks of interactions and not just characterization of individual entities.
In 2005, thanks to funding from the Japanese agency The New Energy and Industrial Tech-nology Development Organization (NEDO, http://www.nedo.go.jp/), Kitano initiated the Sys-tems Biology Graphical Notation (SBGN) project as a community effort. The first SBGN work-shop was held in February 2006 in Tokyo, with over 30 participants from major organizationsinterested in this effort. From the in-depth discussions held during that meeting emerged a setof decisions that are the basis of the current SBGN specification. These decisions are:
• SBGN should be made up of two different visual grammars, describing Entity Relation-ship and Process Diagram diagrams (called State Transition diagrams at the time). SeeSection 1.2.
• In order to promote wide acceptance, the initial version(s) of SBGN should stick to atmost a few dozens symbols that non-specialists could easily learn.
The second SBGN workshop was held in October, 2006, in Yokohama, Japan. This meetingfeatured the first technical discussions about which symbols to include in SBGN Level 1, as wellas discussions about the syntax, semantics, and layout of graphs. A follow-up technical meetingwas held in March, 2007, in Heidelberg, Germany; the participants of that meeting fleshed outmost of the design of SBGN. The third SBGN workshop, held in Long Beach in October, 2007,was dedicated to reaching agreement on the final outstanding issues of notation and syntax.The participants of that meeting collectively realized that a third language would be necessary:the Activity Flow diagrams. The specification for the Process Diagram language was finalizedand largely completed during a follow-up technical meeting held in Okinawa, Japan, in January,2008. At this last meeting, attendees also held the first in-depth discussions about the syntaxof the Entity Relationship language.
SBGN workshops are an opportunity for public discussions about SBGN, allowing interestedpersons to learn more about SBGN and help identify needs and issues. More meetings areexpected to be held in the future, long after this specification document has been issued.
1.2 The three languages of SBGNReaders may well wonder, why are there three languages in SBGN? The reason is that thisapproach solves a problem that was found insurmountable any other way: attempting to includeall relevant facets of a biological system in a single diagram causes the diagram to becomehopelessly complicated and incomprehensible to human readers.
The three different notations in SBGN correspond to three different views of the same model.These views are representations of different classes of information, as follows:
Nat
ure
Pre
cedi
ngs
: hdl
:101
01/n
pre.
2008
.232
0.1
: Pos
ted
22 S
ep 2
008
CHAPTER 1. WHAT IS THE SYSTEMS BIOLOGY GRAPHICAL NOTATION? 3
1. Process Diagram: the causal sequences of molecular processes and their results
2. Entity Relationship: the interactions between entities irrespective of sequence
3. Activity Flow : the flux of information going from one entity to another
In the Process Diagram view, each node in the diagram represents a given state of a species,and therefore a given species may appear multiple times in the same diagram if it representsthe same entity in different states. Conversely, in the Entity Relationship view, a given speciesappears only once in a diagram. Process Diagrams are suitable for following the temporalaspects of interactions, and are easy to understand. The drawback of the Process Diagram,however, is that because the same entity appears multiple times in one diagram, it is difficultto understand which interactions actually exist for the entity. Conversely, Entity Relationshipdiagrams are suitable for understanding relationships involving each molecule, but the temporalcourse of events is difficult or impossible to follow because Entity Relationship diagrams do notdescribe the sequence of events.
Process Diagrams can quickly become very complex. Moreover, when diagramming a bio-chemical network, one often wants to ignore the biochemical basis underlying the action ofone entity on the activity of another. A common desire is to represent only the flow of ac-tivity between nodes, without representing the transitions in the states of the nodes. This isthe motivation for the creation of the Activity Flow view. Activity Flow diagrams permit theuse of modulation, stimulation and inhibition and allow them to point to State/Entity nodesrather than process nodes. The Activity Flow view is thus a hybrid between Process Diagramand Entity Relationship diagrams. It is particularly convenient for representing the effect ofperturbations, whether genetic or environmental in nature.
A recurring argument in SBGN development is that these these three types of diagramsshould be merged into one. Unfortunately, each view has such different meanings that mergingthem would compromise the robustness of the representation and destroy the mathematicalintegrity of the notation system. While having three different notations makes the overallsystem more complex, much of the complexity and increase in burden on learning is mitigatedby reusing most of the same symbols in all three notations. It is primarily the syntax andsemantics that change between the different views, reflecting fundamental differences in theunderlying mathematics of what is being described.
1.3 SBGN levelsIt was clear at the outset of SBGN development that it would be impossible to design a perfectand complete notation right from the beginning. Apart from the prescience this would require(which, sadly, none of the authors possess), it also would likely require a vast language thatmost newcomers would shun as being too complex. Thus, the SBGN community followed anidea used in the development of the Systems Biology Markup Language (SBML; [12]): stratifylanguage development into levels.
A level of SBGN represents a set of features deemed to fit together cohesively, constitutinga usable set of functionality that the user community agrees is sufficient for a reasonable setof tasks and goals. Capabilities and features that cannot be agreed upon and are judgedinsufficiently critical to require inclusion in a given level, are postponed to a higher level. Inthis way, SBGN development is envisioned to proceed in stages, with each higher SBGN leveladding richness compared to the levels below it.
1.4 Developments, discussions, and notifications of updatesThe SBGN website (http://sbgn.org) is a portal for all things related to SBGN. It providesa web forum interface to the SBGN discussion list ([email protected]) and informationabout how anyone may subscribe to it. The easiest and best way to get involved in SBGNdiscussions is to join the mailing list and participate.
Nat
ure
Pre
cedi
ngs
: hdl
:101
01/n
pre.
2008
.232
0.1
: Pos
ted
22 S
ep 2
008

CHAPTER 1. WHAT IS THE SYSTEMS BIOLOGY GRAPHICAL NOTATION? 4
Face-to-face meetings of the SBGN community are announced on the website as well asthe mailing list. Although no set schedule currently exists for workshops and other meetings,we envision holding at least one public workshop per year. As with other similar efforts, theworkshops are likely to be held as satellite workshops of larger conferences, enabling attendeesto use their international travel time and money more efficiently.
Notifications of updates to the SBGN specification are also broadcast on the mailing listand announced on the SBGN website.
Nat
ure
Pre
cedi
ngs
: hdl
:101
01/n
pre.
2008
.232
0.1
: Pos
ted
22 S
ep 2
008
Chapter 2
Process Diagram glyphs
This chapter provides a catalog of the graphical symbols available for representing entities inProcess Diagrams. There are different classes of glyphs corresponding to different classes ofmaterial or conceptual entities, containers, processes, connecting arcs, and logical operators. InChapter 3 beginning on page 40, we describe the rules for combining these glyphs into a legalSBGN Process Diagram, and in Chapter 4 beginning on page 57, we describe requirements andguidelines for the way that diagrams are visually organized.
2.1 OverviewTo set the stage for what follows in this chapter, we first give a brief overview of some of theconcepts in the Process Diagram notation with the help of an example shown in Figure 2.1 onthe next page.
5
Nat
ure
Pre
cedi
ngs
: hdl
:101
01/n
pre.
2008
.232
0.1
: Pos
ted
22 S
ep 2
008
CHAPTER 2. PROCESS DIAGRAM GLYPHS 6
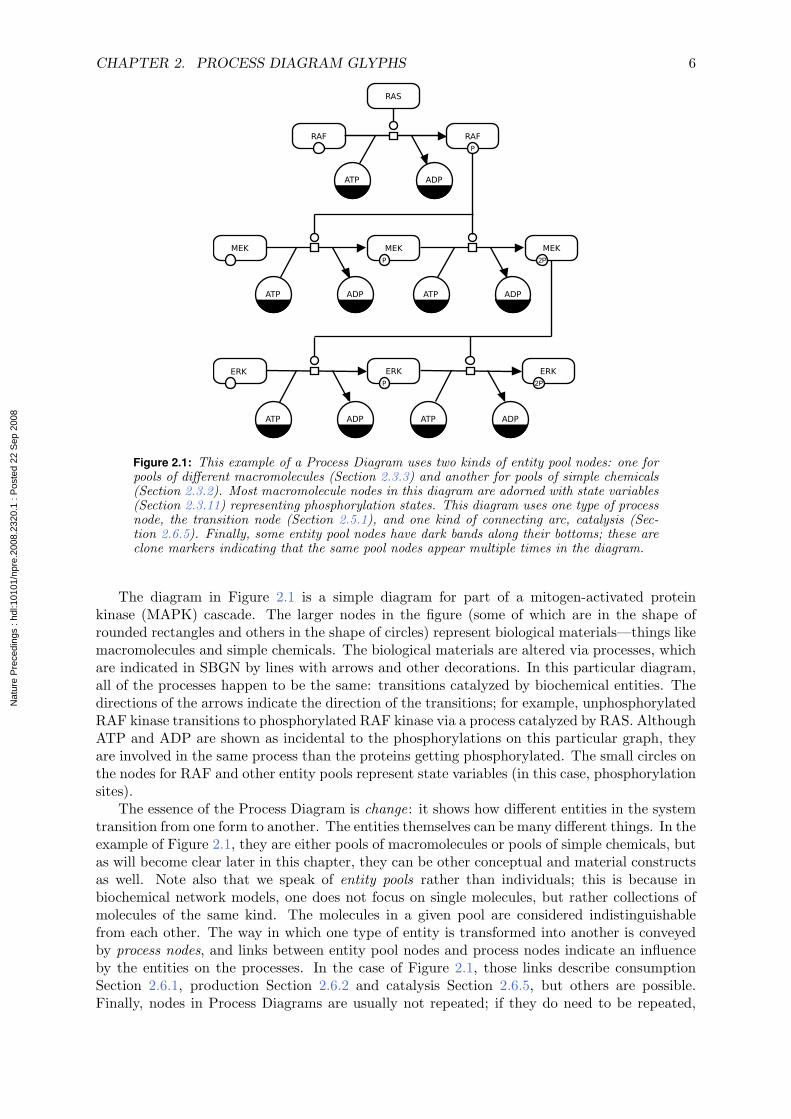
Figure 2.1: This example of a Process Diagram uses two kinds of entity pool nodes: one forpools of different macromolecules (Section 2.3.3) and another for pools of simple chemicals(Section 2.3.2). Most macromolecule nodes in this diagram are adorned with state variables(Section 2.3.11) representing phosphorylation states. This diagram uses one type of processnode, the transition node (Section 2.5.1), and one kind of connecting arc, catalysis (Sec-tion 2.6.5). Finally, some entity pool nodes have dark bands along their bottoms; these areclone markers indicating that the same pool nodes appear multiple times in the diagram.
The diagram in Figure 2.1 is a simple diagram for part of a mitogen-activated proteinkinase (MAPK) cascade. The larger nodes in the figure (some of which are in the shape ofrounded rectangles and others in the shape of circles) represent biological materials—things likemacromolecules and simple chemicals. The biological materials are altered via processes, whichare indicated in SBGN by lines with arrows and other decorations. In this particular diagram,all of the processes happen to be the same: transitions catalyzed by biochemical entities. Thedirections of the arrows indicate the direction of the transitions; for example, unphosphorylatedRAF kinase transitions to phosphorylated RAF kinase via a process catalyzed by RAS. AlthoughATP and ADP are shown as incidental to the phosphorylations on this particular graph, theyare involved in the same process than the proteins getting phosphorylated. The small circles onthe nodes for RAF and other entity pools represent state variables (in this case, phosphorylationsites).
The essence of the Process Diagram is change: it shows how different entities in the systemtransition from one form to another. The entities themselves can be many different things. In theexample of Figure 2.1, they are either pools of macromolecules or pools of simple chemicals, butas will become clear later in this chapter, they can be other conceptual and material constructsas well. Note also that we speak of entity pools rather than individuals; this is because inbiochemical network models, one does not focus on single molecules, but rather collections ofmolecules of the same kind. The molecules in a given pool are considered indistinguishablefrom each other. The way in which one type of entity is transformed into another is conveyedby process nodes, and links between entity pool nodes and process nodes indicate an influenceby the entities on the processes. In the case of Figure 2.1, those links describe consumptionSection 2.6.1, production Section 2.6.2 and catalysis Section 2.6.5, but others are possible.Finally, nodes in Process Diagrams are usually not repeated; if they do need to be repeated,
Nat
ure
Pre
cedi
ngs
: hdl
:101
01/n
pre.
2008
.232
0.1
: Pos
ted
22 S
ep 2
008
CHAPTER 2. PROCESS DIAGRAM GLYPHS 7
they are marked with clone markers—specific modifications to the appearance of the node(Section 2.3.12). The details of this and other aspects of Process Diagram notation are explainedin the rest of this chapter.
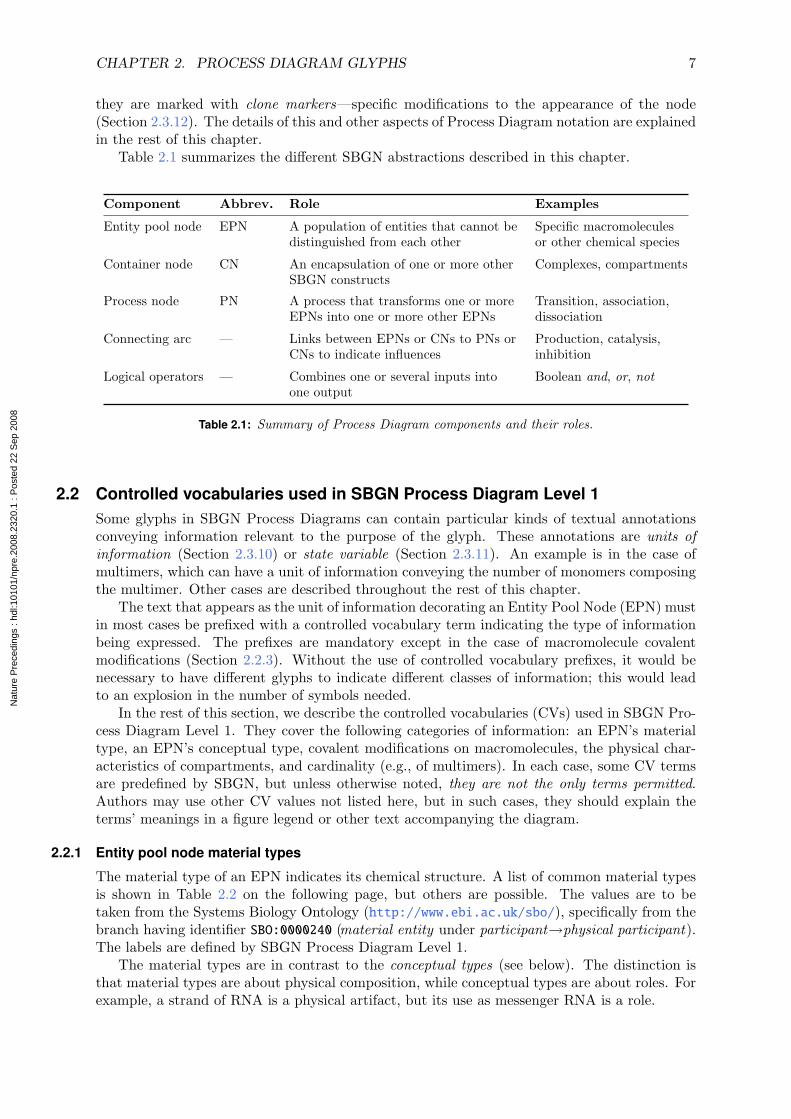
Table 2.1 summarizes the different SBGN abstractions described in this chapter.
Component Abbrev. Role Examples
Entity pool node EPN A population of entities that cannot bedistinguished from each other
Specific macromoleculesor other chemical species
Container node CN An encapsulation of one or more otherSBGN constructs
Complexes, compartments
Process node PN A process that transforms one or moreEPNs into one or more other EPNs
Transition, association,dissociation
Connecting arc — Links between EPNs or CNs to PNs orCNs to indicate influences
Production, catalysis,inhibition
Logical operators — Combines one or several inputs intoone output
Boolean and, or, not
Table 2.1: Summary of Process Diagram components and their roles.
2.2 Controlled vocabularies used in SBGN Process Diagram Level 1Some glyphs in SBGN Process Diagrams can contain particular kinds of textual annotationsconveying information relevant to the purpose of the glyph. These annotations are units ofinformation (Section 2.3.10) or state variable (Section 2.3.11). An example is in the case ofmultimers, which can have a unit of information conveying the number of monomers composingthe multimer. Other cases are described throughout the rest of this chapter.
The text that appears as the unit of information decorating an Entity Pool Node (EPN) mustin most cases be prefixed with a controlled vocabulary term indicating the type of informationbeing expressed. The prefixes are mandatory except in the case of macromolecule covalentmodifications (Section 2.2.3). Without the use of controlled vocabulary prefixes, it would benecessary to have different glyphs to indicate different classes of information; this would leadto an explosion in the number of symbols needed.
In the rest of this section, we describe the controlled vocabularies (CVs) used in SBGN Pro-cess Diagram Level 1. They cover the following categories of information: an EPN’s materialtype, an EPN’s conceptual type, covalent modifications on macromolecules, the physical char-acteristics of compartments, and cardinality (e.g., of multimers). In each case, some CV termsare predefined by SBGN, but unless otherwise noted, they are not the only terms permitted.Authors may use other CV values not listed here, but in such cases, they should explain theterms’ meanings in a figure legend or other text accompanying the diagram.
2.2.1 Entity pool node material types
The material type of an EPN indicates its chemical structure. A list of common material typesis shown in Table 2.2 on the following page, but others are possible. The values are to betaken from the Systems Biology Ontology (http://www.ebi.ac.uk/sbo/), specifically from thebranch having identifier SBO:0000240 (material entity under participant→physical participant).The labels are defined by SBGN Process Diagram Level 1.
The material types are in contrast to the conceptual types (see below). The distinction isthat material types are about physical composition, while conceptual types are about roles. Forexample, a strand of RNA is a physical artifact, but its use as messenger RNA is a role.
Nat
ure
Pre
cedi
ngs
: hdl
:101
01/n
pre.
2008
.232
0.1
: Pos
ted
22 S
ep 2
008
CHAPTER 2. PROCESS DIAGRAM GLYPHS 8
Name Label SBO term
Non-macromolecular ion mt:ion SBO:0000327
Non-macromolecular radical mt:rad SBO:0000328
Ribonucleic acid mt:rna SBO:0000250
Deoxribonucleic acid mt:dna SBO:0000251
Protein mt:prot SBO:0000297
Polysaccharide mt:psac SBO:0000249
Table 2.2: A sample of values from the material types controlled vocabulary (Section 2.2.1).
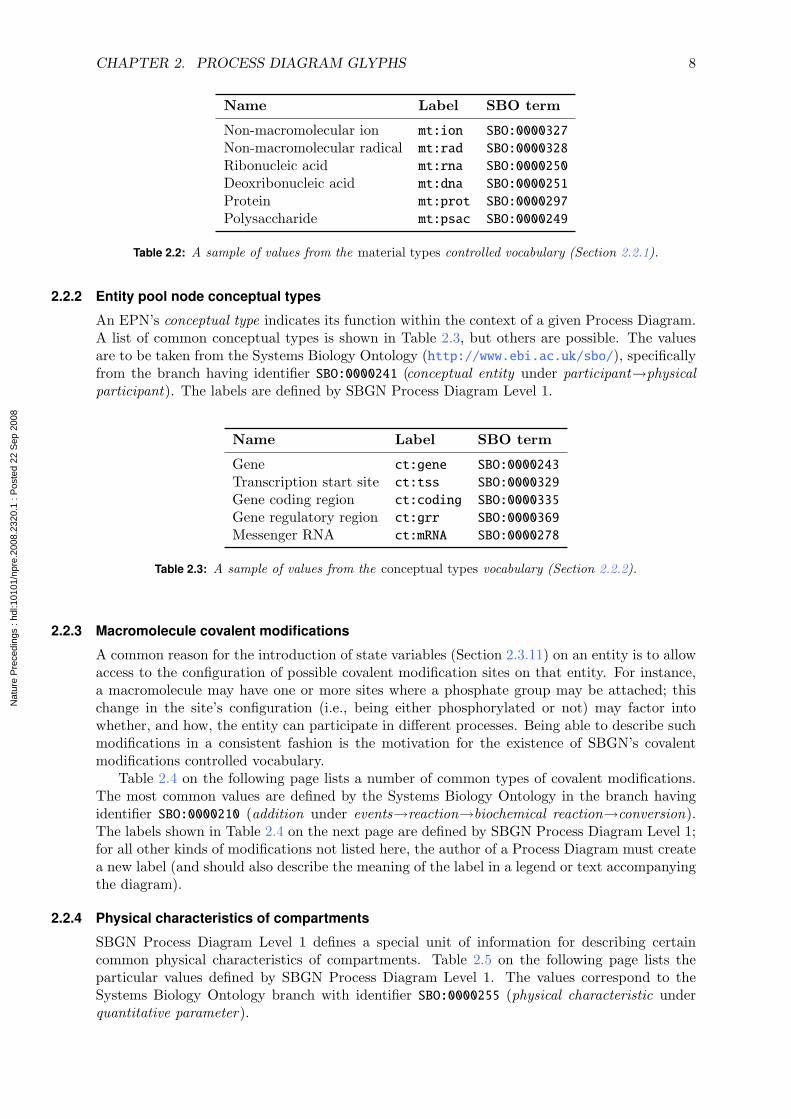
2.2.2 Entity pool node conceptual types
An EPN’s conceptual type indicates its function within the context of a given Process Diagram.A list of common conceptual types is shown in Table 2.3, but others are possible. The valuesare to be taken from the Systems Biology Ontology (http://www.ebi.ac.uk/sbo/), specificallyfrom the branch having identifier SBO:0000241 (conceptual entity under participant→physicalparticipant). The labels are defined by SBGN Process Diagram Level 1.
Name Label SBO term
Gene ct:gene SBO:0000243
Transcription start site ct:tss SBO:0000329
Gene coding region ct:coding SBO:0000335
Gene regulatory region ct:grr SBO:0000369
Messenger RNA ct:mRNA SBO:0000278
Table 2.3: A sample of values from the conceptual types vocabulary (Section 2.2.2).
2.2.3 Macromolecule covalent modifications
A common reason for the introduction of state variables (Section 2.3.11) on an entity is to allowaccess to the configuration of possible covalent modification sites on that entity. For instance,a macromolecule may have one or more sites where a phosphate group may be attached; thischange in the site’s configuration (i.e., being either phosphorylated or not) may factor intowhether, and how, the entity can participate in different processes. Being able to describe suchmodifications in a consistent fashion is the motivation for the existence of SBGN’s covalentmodifications controlled vocabulary.
Table 2.4 on the following page lists a number of common types of covalent modifications.The most common values are defined by the Systems Biology Ontology in the branch havingidentifier SBO:0000210 (addition under events→reaction→biochemical reaction→conversion).The labels shown in Table 2.4 on the next page are defined by SBGN Process Diagram Level 1;for all other kinds of modifications not listed here, the author of a Process Diagram must createa new label (and should also describe the meaning of the label in a legend or text accompanyingthe diagram).
2.2.4 Physical characteristics of compartments
SBGN Process Diagram Level 1 defines a special unit of information for describing certaincommon physical characteristics of compartments. Table 2.5 on the following page lists theparticular values defined by SBGN Process Diagram Level 1. The values correspond to theSystems Biology Ontology branch with identifier SBO:0000255 (physical characteristic underquantitative parameter).
Nat
ure
Pre
cedi
ngs
: hdl
:101
01/n
pre.
2008
.232
0.1
: Pos
ted
22 S
ep 2
008
CHAPTER 2. PROCESS DIAGRAM GLYPHS 9
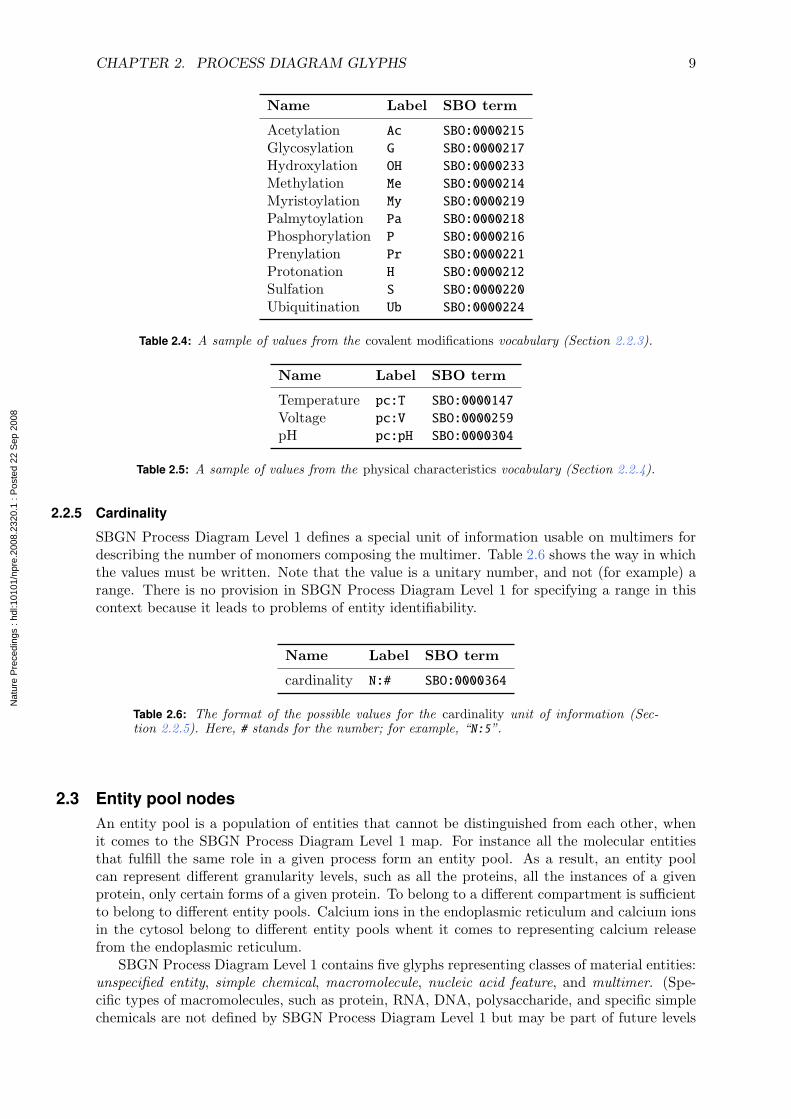
Name Label SBO term
Acetylation Ac SBO:0000215
Glycosylation G SBO:0000217
Hydroxylation OH SBO:0000233
Methylation Me SBO:0000214
Myristoylation My SBO:0000219
Palmytoylation Pa SBO:0000218
Phosphorylation P SBO:0000216
Prenylation Pr SBO:0000221
Protonation H SBO:0000212
Sulfation S SBO:0000220
Ubiquitination Ub SBO:0000224
Table 2.4: A sample of values from the covalent modifications vocabulary (Section 2.2.3).
Name Label SBO term
Temperature pc:T SBO:0000147
Voltage pc:V SBO:0000259
pH pc:pH SBO:0000304
Table 2.5: A sample of values from the physical characteristics vocabulary (Section 2.2.4).
2.2.5 Cardinality
SBGN Process Diagram Level 1 defines a special unit of information usable on multimers fordescribing the number of monomers composing the multimer. Table 2.6 shows the way in whichthe values must be written. Note that the value is a unitary number, and not (for example) arange. There is no provision in SBGN Process Diagram Level 1 for specifying a range in thiscontext because it leads to problems of entity identifiability.
Name Label SBO term
cardinality N:# SBO:0000364
Table 2.6: The format of the possible values for the cardinality unit of information (Sec-tion 2.2.5). Here, # stands for the number; for example, “N:5”.
2.3 Entity pool nodesAn entity pool is a population of entities that cannot be distinguished from each other, whenit comes to the SBGN Process Diagram Level 1 map. For instance all the molecular entitiesthat fulfill the same role in a given process form an entity pool. As a result, an entity poolcan represent different granularity levels, such as all the proteins, all the instances of a givenprotein, only certain forms of a given protein. To belong to a different compartment is sufficientto belong to different entity pools. Calcium ions in the endoplasmic reticulum and calcium ionsin the cytosol belong to different entity pools whent it comes to representing calcium releasefrom the endoplasmic reticulum.
SBGN Process Diagram Level 1 contains five glyphs representing classes of material entities:unspecified entity, simple chemical, macromolecule, nucleic acid feature, and multimer. (Spe-cific types of macromolecules, such as protein, RNA, DNA, polysaccharide, and specific simplechemicals are not defined by SBGN Process Diagram Level 1 but may be part of future levels
Nat
ure
Pre
cedi
ngs
: hdl
:101
01/n
pre.
2008
.232
0.1
: Pos
ted
22 S
ep 2
008
CHAPTER 2. PROCESS DIAGRAM GLYPHS 10
of SBGN.) In addition to the material entities, SBGN Process Diagram Level 1 represents fourconceptual entities: source/sink, perturbation, observable, and tag. Material and conceptualentities can optionally carry auxiliary units such as units of information, state variables andclone markers.
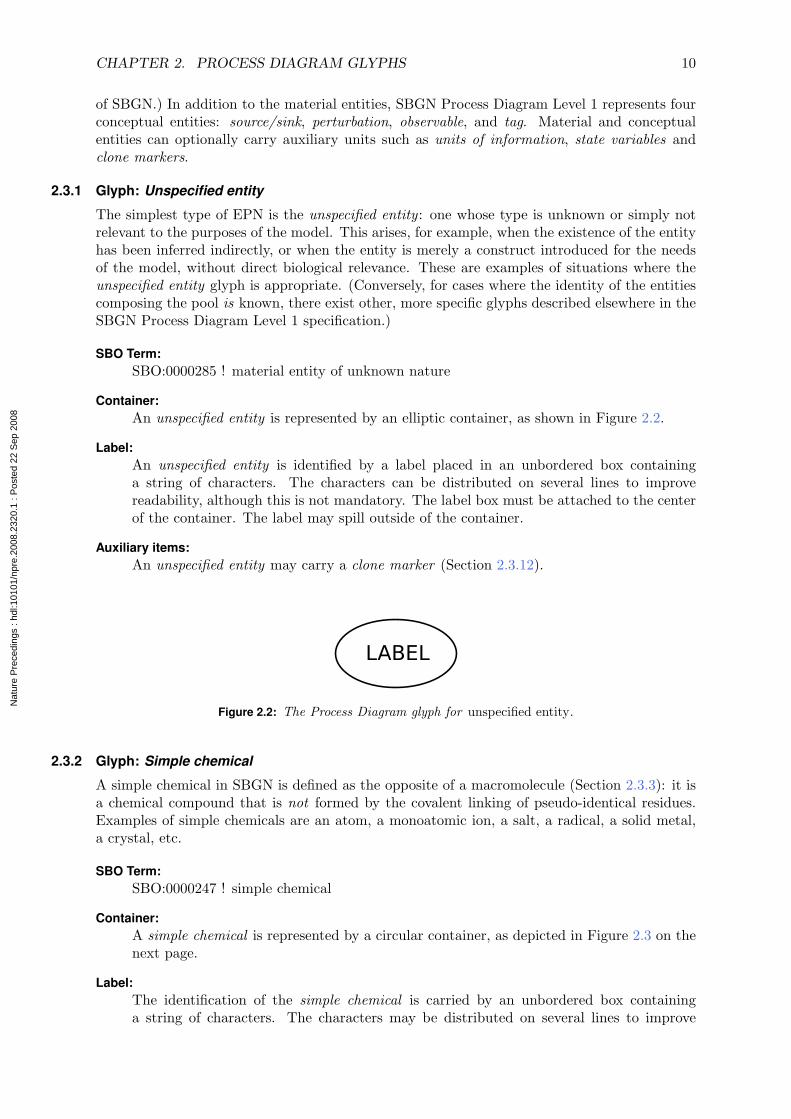
2.3.1 Glyph: Unspecified entity
The simplest type of EPN is the unspecified entity : one whose type is unknown or simply notrelevant to the purposes of the model. This arises, for example, when the existence of the entityhas been inferred indirectly, or when the entity is merely a construct introduced for the needsof the model, without direct biological relevance. These are examples of situations where theunspecified entity glyph is appropriate. (Conversely, for cases where the identity of the entitiescomposing the pool is known, there exist other, more specific glyphs described elsewhere in theSBGN Process Diagram Level 1 specification.)
SBO Term:SBO:0000285 ! material entity of unknown nature
Container:An unspecified entity is represented by an elliptic container, as shown in Figure 2.2.
Label:An unspecified entity is identified by a label placed in an unbordered box containinga string of characters. The characters can be distributed on several lines to improvereadability, although this is not mandatory. The label box must be attached to the centerof the container. The label may spill outside of the container.
Auxiliary items:An unspecified entity may carry a clone marker (Section 2.3.12).
Figure 2.2: The Process Diagram glyph for unspecified entity.
2.3.2 Glyph: Simple chemical
A simple chemical in SBGN is defined as the opposite of a macromolecule (Section 2.3.3): it isa chemical compound that is not formed by the covalent linking of pseudo-identical residues.Examples of simple chemicals are an atom, a monoatomic ion, a salt, a radical, a solid metal,a crystal, etc.
SBO Term:SBO:0000247 ! simple chemical
Container:A simple chemical is represented by a circular container, as depicted in Figure 2.3 on thenext page.
Label:The identification of the simple chemical is carried by an unbordered box containinga string of characters. The characters may be distributed on several lines to improve
Nat
ure
Pre
cedi
ngs
: hdl
:101
01/n
pre.
2008
.232
0.1
: Pos
ted
22 S
ep 2
008

CHAPTER 2. PROCESS DIAGRAM GLYPHS 11
readability, although this is not mandatory. The label box has to be attached to thecenter of the circular container. The label is permitted to spill outside the container.
Auxiliary items:A simple chemical may be decorated with one or more units of information (Section 2.3.10).A particular unit of information describes the material type. A simple chemical may alsocarry a clone marker (Section 2.3.12).
Figure 2.3: The Process Diagram glyph for simple chemical.
2.3.3 Glyph: Macromolecule
Many biological processes involve macromolecules: biochemical substances that are built upfrom the covalent linking of pseudo-identical units. Examples of macromolecules include pro-teins, nucleic acids (RNA, DNA), and polysaccharides (glycogen, cellulose, starch, etc.). At-tempting to define a separate glyph for all of these different molecules would lead to an explosionof symbols in SBGN, so instead, SBGN Process Diagram Level 1 defines only one glyph for allmacromolecules. The same glyph is to be used for a protein, a nucleic acid, a complex sugar,and so on. The exact nature of a particular macromolecule in a diagram is then clarified usingits label and decorations, as will become clear below. (Future levels of SBGN may subclass themacromolecule and introduce different glyphs to differentiate macromolecules.)
SBO Term:SBO:0000245 ! macromolecule
Container:A macromolecule is represented by a rectangular container with rounded corners, as illus-trated in Figure 2.4 on the following page.
Label:A macromolecule is identified by a label placed in an unbordered box containing a stringof characters. The characters can be distributed on several lines to improve readability,although this is not mandatory. The label box must be attached to the center of thecontainer. The label may spill outside of the container.
Auxiliary items:A macromolecule can carry state variables that can add information about its state (Sec-tion 2.3.11). The state of a macromolecule is therefore defined as the vector of all its statevariables.
A macromolecule can also carry one or several units of information (Section 2.3.10).The units of information can characterize a domain, such as a binding site. Particularunits of information are available for describing the material type (Section 2.2.1) and theconceptual type (Section 2.2.2) of a macromolecule.
A macromolecule may also carry a clone marker (see Section 2.3.12)
Nat
ure
Pre
cedi
ngs
: hdl
:101
01/n
pre.
2008
.232
0.1
: Pos
ted
22 S
ep 2
008
CHAPTER 2. PROCESS DIAGRAM GLYPHS 12
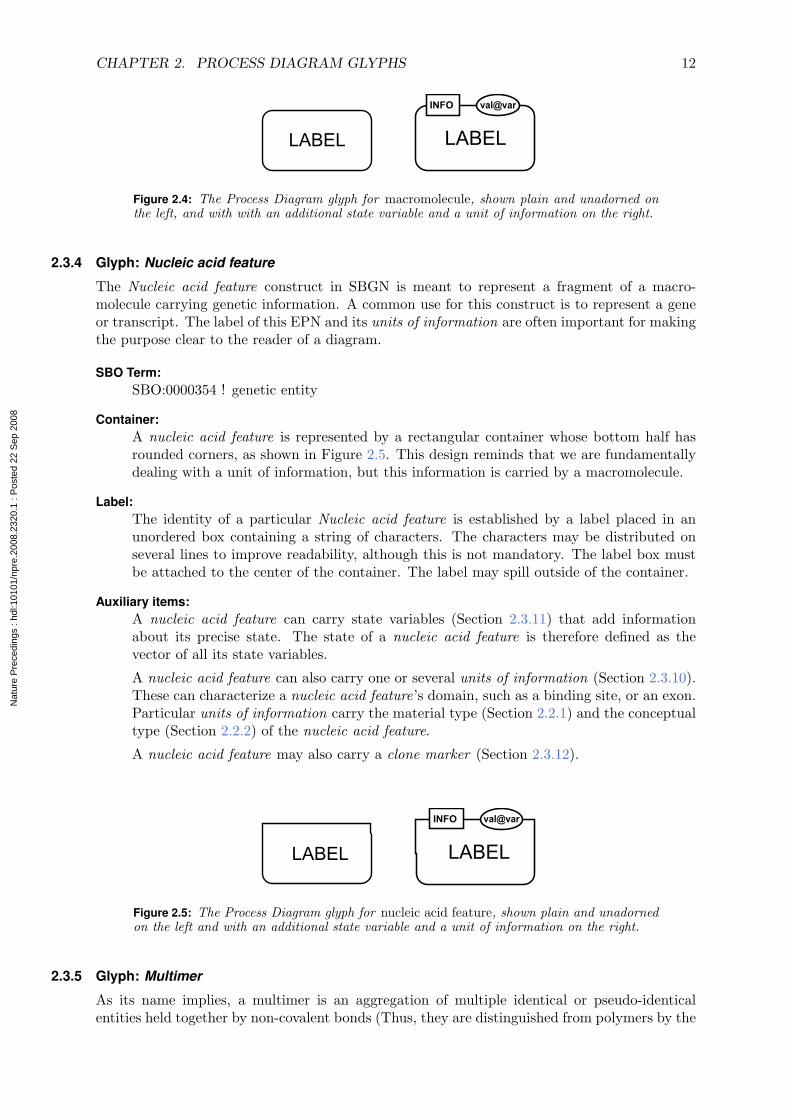
Figure 2.4: The Process Diagram glyph for macromolecule, shown plain and unadorned onthe left, and with with an additional state variable and a unit of information on the right.
2.3.4 Glyph: Nucleic acid feature
The Nucleic acid feature construct in SBGN is meant to represent a fragment of a macro-molecule carrying genetic information. A common use for this construct is to represent a geneor transcript. The label of this EPN and its units of information are often important for makingthe purpose clear to the reader of a diagram.
SBO Term:SBO:0000354 ! genetic entity
Container:A nucleic acid feature is represented by a rectangular container whose bottom half hasrounded corners, as shown in Figure 2.5. This design reminds that we are fundamentallydealing with a unit of information, but this information is carried by a macromolecule.
Label:The identity of a particular Nucleic acid feature is established by a label placed in anunordered box containing a string of characters. The characters may be distributed onseveral lines to improve readability, although this is not mandatory. The label box mustbe attached to the center of the container. The label may spill outside of the container.
Auxiliary items:A nucleic acid feature can carry state variables (Section 2.3.11) that add informationabout its precise state. The state of a nucleic acid feature is therefore defined as thevector of all its state variables.
A nucleic acid feature can also carry one or several units of information (Section 2.3.10).These can characterize a nucleic acid feature’s domain, such as a binding site, or an exon.Particular units of information carry the material type (Section 2.2.1) and the conceptualtype (Section 2.2.2) of the nucleic acid feature.
A nucleic acid feature may also carry a clone marker (Section 2.3.12).
Figure 2.5: The Process Diagram glyph for nucleic acid feature, shown plain and unadornedon the left and with an additional state variable and a unit of information on the right.
2.3.5 Glyph: Multimer
As its name implies, a multimer is an aggregation of multiple identical or pseudo-identicalentities held together by non-covalent bonds (Thus, they are distinguished from polymers by the
Nat
ure
Pre
cedi
ngs
: hdl
:101
01/n
pre.
2008
.232
0.1
: Pos
ted
22 S
ep 2
008
CHAPTER 2. PROCESS DIAGRAM GLYPHS 13
fact that the later involve covalent bonds). Here, sseudo-identical refers to the possibility thatthe entities differ chemically but retain some common global characteristic, such as a structureor function, and so can be considered identical within the context of the SBGN Process Diagram.An example of this are the homologous subunits in a hetero-oligomeric receptor. SBGN ProcessDiagram accepts multimers of simple chemical (Section 2.3.2), macromolecule (Section 2.3.3)and genetic entities (Section 2.3.4).
SBO Term:SBO:0000286 ! multimer
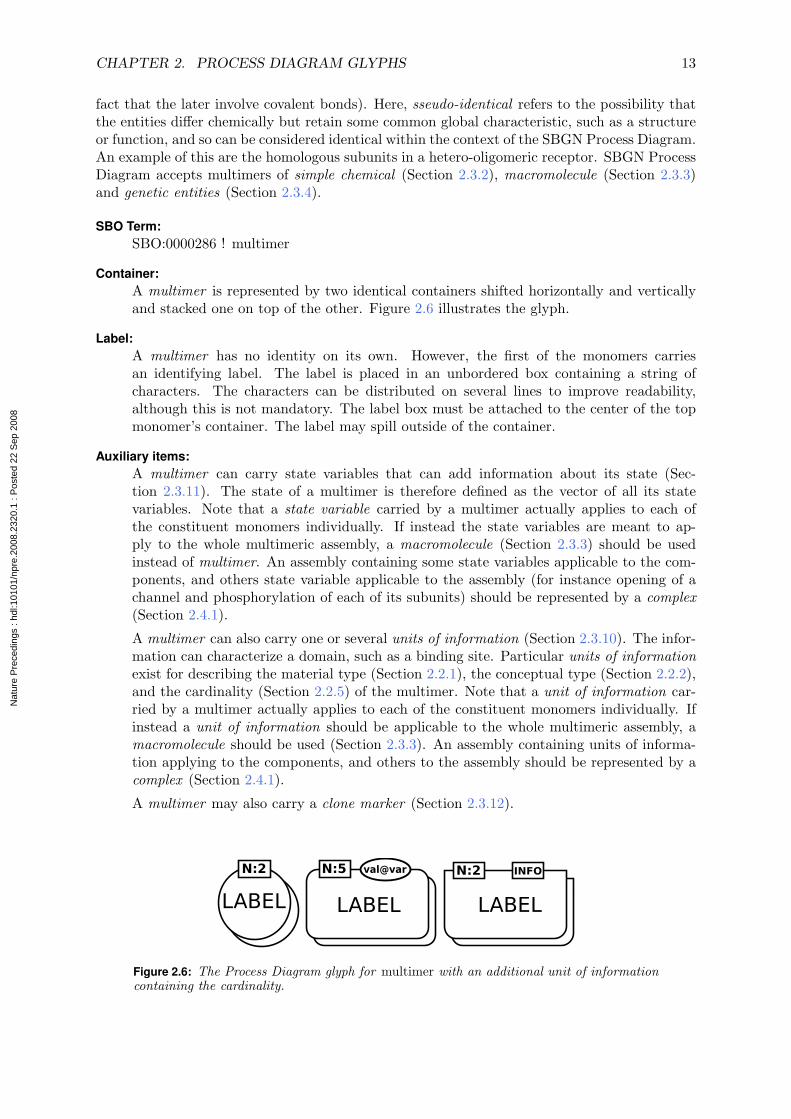
Container:A multimer is represented by two identical containers shifted horizontally and verticallyand stacked one on top of the other. Figure 2.6 illustrates the glyph.
Label:A multimer has no identity on its own. However, the first of the monomers carriesan identifying label. The label is placed in an unbordered box containing a string ofcharacters. The characters can be distributed on several lines to improve readability,although this is not mandatory. The label box must be attached to the center of the topmonomer’s container. The label may spill outside of the container.
Auxiliary items:A multimer can carry state variables that can add information about its state (Sec-tion 2.3.11). The state of a multimer is therefore defined as the vector of all its statevariables. Note that a state variable carried by a multimer actually applies to each ofthe constituent monomers individually. If instead the state variables are meant to ap-ply to the whole multimeric assembly, a macromolecule (Section 2.3.3) should be usedinstead of multimer. An assembly containing some state variables applicable to the com-ponents, and others state variable applicable to the assembly (for instance opening of achannel and phosphorylation of each of its subunits) should be represented by a complex(Section 2.4.1).
A multimer can also carry one or several units of information (Section 2.3.10). The infor-mation can characterize a domain, such as a binding site. Particular units of informationexist for describing the material type (Section 2.2.1), the conceptual type (Section 2.2.2),and the cardinality (Section 2.2.5) of the multimer. Note that a unit of information car-ried by a multimer actually applies to each of the constituent monomers individually. Ifinstead a unit of information should be applicable to the whole multimeric assembly, amacromolecule should be used (Section 2.3.3). An assembly containing units of informa-tion applying to the components, and others to the assembly should be represented by acomplex (Section 2.4.1).
A multimer may also carry a clone marker (Section 2.3.12).
Figure 2.6: The Process Diagram glyph for multimer with an additional unit of informationcontaining the cardinality.
Nat
ure
Pre
cedi
ngs
: hdl
:101
01/n
pre.
2008
.232
0.1
: Pos
ted
22 S
ep 2
008
CHAPTER 2. PROCESS DIAGRAM GLYPHS 14
2.3.6 Glyph: Source/sink
It is useful to have the ability to represent the creation of an entity or a state from an unspecifiedsource, that is, from something that one does not need or wish to make precise. For instance, ina model where the production of a protein is represented, it may not be desirable to represent allof the amino acids, sugars and other metabolites used, or the energy involved in the protein’screation. Similarly, we may not wish to bother representing the details of the destructionor decomposition of some biochemical species into a large number of more primitive entities,preferring instead to simply say that the species “disappears into a sink”. Yet another example isthat one may need to represent an input (respectively, output) into (resp. from) a compartmentwithout explicitly representing a transport process from a source (resp. to a target).
For these and other situations, SBGN defines a symbol for explicitly representing the in-volvement of an unspecified source or sink. The symbol used in SBGN is borrowed from themathematical symbol for “empty set”, but it is important to note that it does not actuallyrepresent a true absence of everything or a physical void—it represents the absence of the cor-responding structures in the model, that is, the fact that these sources or sinks are conceptuallyoutside the scope of the diagram.
A frequently asked question is, why bother having an explicit symbol at all? The reason isthat one cannot simply use an arc that does not terminate on a node, because the dangling endcould be mistaken to be pointing to another node in the diagram. This is specially true if thediagram is rescaled, causing the spacing of elements in the diagram to change. The availabilityand use of an explicit symbol for sources and sinks is critical.
SBO Term:SBO:0000291 ! empty set
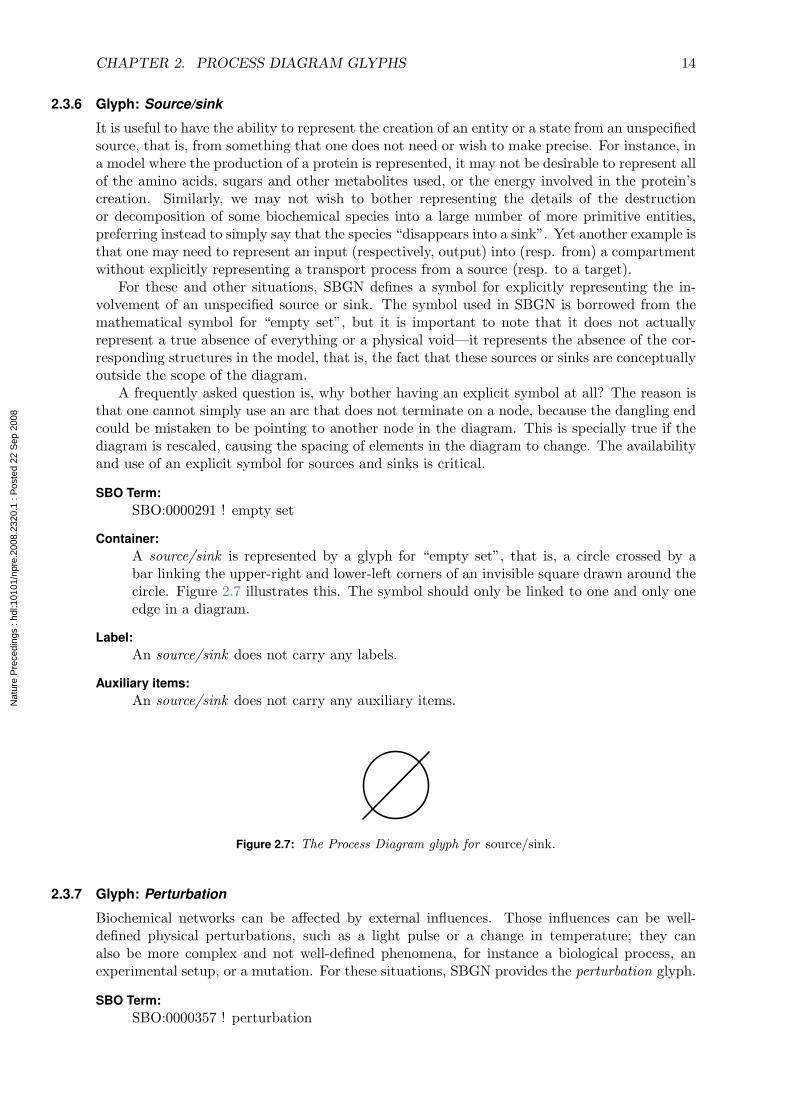
Container:A source/sink is represented by a glyph for “empty set”, that is, a circle crossed by abar linking the upper-right and lower-left corners of an invisible square drawn around thecircle. Figure 2.7 illustrates this. The symbol should only be linked to one and only oneedge in a diagram.
Label:An source/sink does not carry any labels.
Auxiliary items:An source/sink does not carry any auxiliary items.
Figure 2.7: The Process Diagram glyph for source/sink.
2.3.7 Glyph: Perturbation
Biochemical networks can be affected by external influences. Those influences can be well-defined physical perturbations, such as a light pulse or a change in temperature; they canalso be more complex and not well-defined phenomena, for instance a biological process, anexperimental setup, or a mutation. For these situations, SBGN provides the perturbation glyph.
SBO Term:SBO:0000357 ! perturbation
Nat
ure
Pre
cedi
ngs
: hdl
:101
01/n
pre.
2008
.232
0.1
: Pos
ted
22 S
ep 2
008
CHAPTER 2. PROCESS DIAGRAM GLYPHS 15
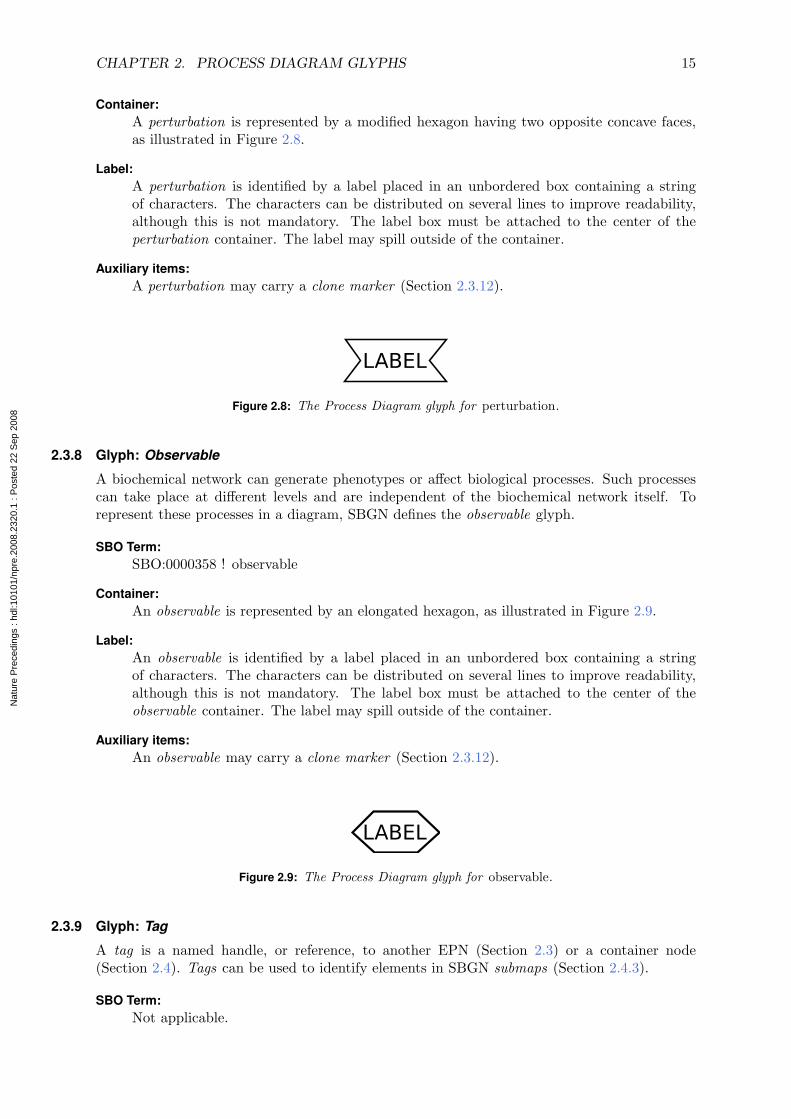
Container:A perturbation is represented by a modified hexagon having two opposite concave faces,as illustrated in Figure 2.8.
Label:A perturbation is identified by a label placed in an unbordered box containing a stringof characters. The characters can be distributed on several lines to improve readability,although this is not mandatory. The label box must be attached to the center of theperturbation container. The label may spill outside of the container.
Auxiliary items:A perturbation may carry a clone marker (Section 2.3.12).
Figure 2.8: The Process Diagram glyph for perturbation.
2.3.8 Glyph: Observable
A biochemical network can generate phenotypes or affect biological processes. Such processescan take place at different levels and are independent of the biochemical network itself. Torepresent these processes in a diagram, SBGN defines the observable glyph.
SBO Term:SBO:0000358 ! observable
Container:An observable is represented by an elongated hexagon, as illustrated in Figure 2.9.
Label:An observable is identified by a label placed in an unbordered box containing a stringof characters. The characters can be distributed on several lines to improve readability,although this is not mandatory. The label box must be attached to the center of theobservable container. The label may spill outside of the container.
Auxiliary items:An observable may carry a clone marker (Section 2.3.12).
Figure 2.9: The Process Diagram glyph for observable.
2.3.9 Glyph: Tag
A tag is a named handle, or reference, to another EPN (Section 2.3) or a container node(Section 2.4). Tags can be used to identify elements in SBGN submaps (Section 2.4.3).
SBO Term:Not applicable.
Nat
ure
Pre
cedi
ngs
: hdl
:101
01/n
pre.
2008
.232
0.1
: Pos
ted
22 S
ep 2
008
CHAPTER 2. PROCESS DIAGRAM GLYPHS 16
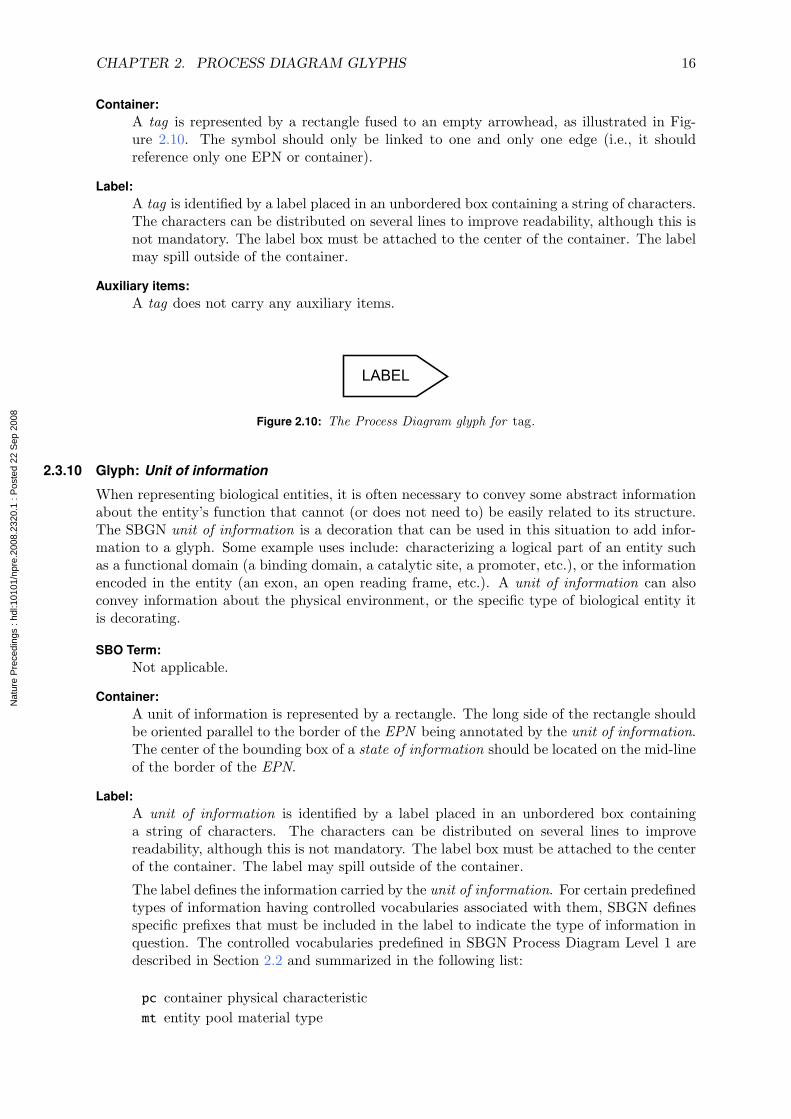
Container:A tag is represented by a rectangle fused to an empty arrowhead, as illustrated in Fig-ure 2.10. The symbol should only be linked to one and only one edge (i.e., it shouldreference only one EPN or container).
Label:A tag is identified by a label placed in an unbordered box containing a string of characters.The characters can be distributed on several lines to improve readability, although this isnot mandatory. The label box must be attached to the center of the container. The labelmay spill outside of the container.
Auxiliary items:A tag does not carry any auxiliary items.
Figure 2.10: The Process Diagram glyph for tag.
2.3.10 Glyph: Unit of information
When representing biological entities, it is often necessary to convey some abstract informationabout the entity’s function that cannot (or does not need to) be easily related to its structure.The SBGN unit of information is a decoration that can be used in this situation to add infor-mation to a glyph. Some example uses include: characterizing a logical part of an entity suchas a functional domain (a binding domain, a catalytic site, a promoter, etc.), or the informationencoded in the entity (an exon, an open reading frame, etc.). A unit of information can alsoconvey information about the physical environment, or the specific type of biological entity itis decorating.
SBO Term:Not applicable.
Container:A unit of information is represented by a rectangle. The long side of the rectangle shouldbe oriented parallel to the border of the EPN being annotated by the unit of information.The center of the bounding box of a state of information should be located on the mid-lineof the border of the EPN.
Label:A unit of information is identified by a label placed in an unbordered box containinga string of characters. The characters can be distributed on several lines to improvereadability, although this is not mandatory. The label box must be attached to the centerof the container. The label may spill outside of the container.
The label defines the information carried by the unit of information. For certain predefinedtypes of information having controlled vocabularies associated with them, SBGN definesspecific prefixes that must be included in the label to indicate the type of information inquestion. The controlled vocabularies predefined in SBGN Process Diagram Level 1 aredescribed in Section 2.2 and summarized in the following list:
pc container physical characteristicmt entity pool material type
Nat
ure
Pre
cedi
ngs
: hdl
:101
01/n
pre.
2008
.232
0.1
: Pos
ted
22 S
ep 2
008
CHAPTER 2. PROCESS DIAGRAM GLYPHS 17
ct entity pool conceptual typeN multimer cardinality
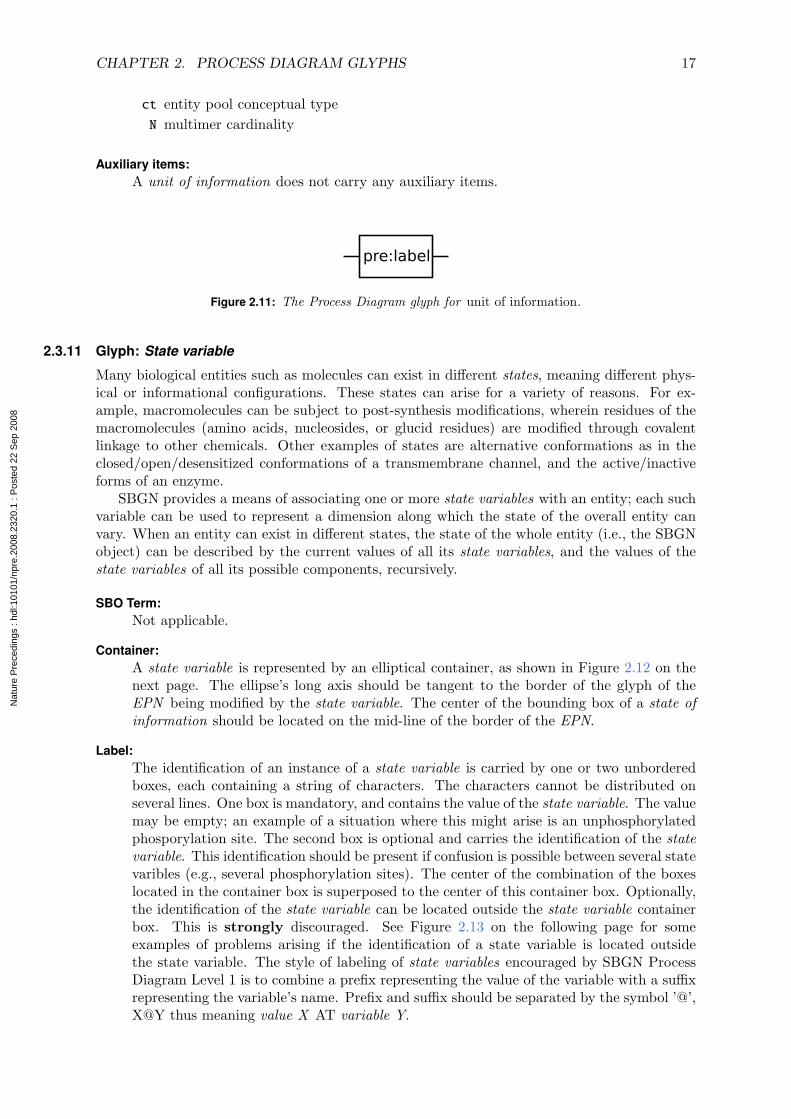
Auxiliary items:A unit of information does not carry any auxiliary items.
Figure 2.11: The Process Diagram glyph for unit of information.
2.3.11 Glyph: State variable
Many biological entities such as molecules can exist in different states, meaning different phys-ical or informational configurations. These states can arise for a variety of reasons. For ex-ample, macromolecules can be subject to post-synthesis modifications, wherein residues of themacromolecules (amino acids, nucleosides, or glucid residues) are modified through covalentlinkage to other chemicals. Other examples of states are alternative conformations as in theclosed/open/desensitized conformations of a transmembrane channel, and the active/inactiveforms of an enzyme.
SBGN provides a means of associating one or more state variables with an entity; each suchvariable can be used to represent a dimension along which the state of the overall entity canvary. When an entity can exist in different states, the state of the whole entity (i.e., the SBGNobject) can be described by the current values of all its state variables, and the values of thestate variables of all its possible components, recursively.
SBO Term:Not applicable.
Container:A state variable is represented by an elliptical container, as shown in Figure 2.12 on thenext page. The ellipse’s long axis should be tangent to the border of the glyph of theEPN being modified by the state variable. The center of the bounding box of a state ofinformation should be located on the mid-line of the border of the EPN.
Label:The identification of an instance of a state variable is carried by one or two unborderedboxes, each containing a string of characters. The characters cannot be distributed onseveral lines. One box is mandatory, and contains the value of the state variable. The valuemay be empty; an example of a situation where this might arise is an unphosphorylatedphosporylation site. The second box is optional and carries the identification of the statevariable. This identification should be present if confusion is possible between several statevaribles (e.g., several phosphorylation sites). The center of the combination of the boxeslocated in the container box is superposed to the center of this container box. Optionally,the identification of the state variable can be located outside the state variable containerbox. This is strongly discouraged. See Figure 2.13 on the following page for someexamples of problems arising if the identification of a state variable is located outsidethe state variable. The style of labeling of state variables encouraged by SBGN ProcessDiagram Level 1 is to combine a prefix representing the value of the variable with a suffixrepresenting the variable’s name. Prefix and suffix should be separated by the symbol ’@’,X@Y thus meaning value X AT variable Y.
Nat
ure
Pre
cedi
ngs
: hdl
:101
01/n
pre.
2008
.232
0.1
: Pos
ted
22 S
ep 2
008
CHAPTER 2. PROCESS DIAGRAM GLYPHS 18
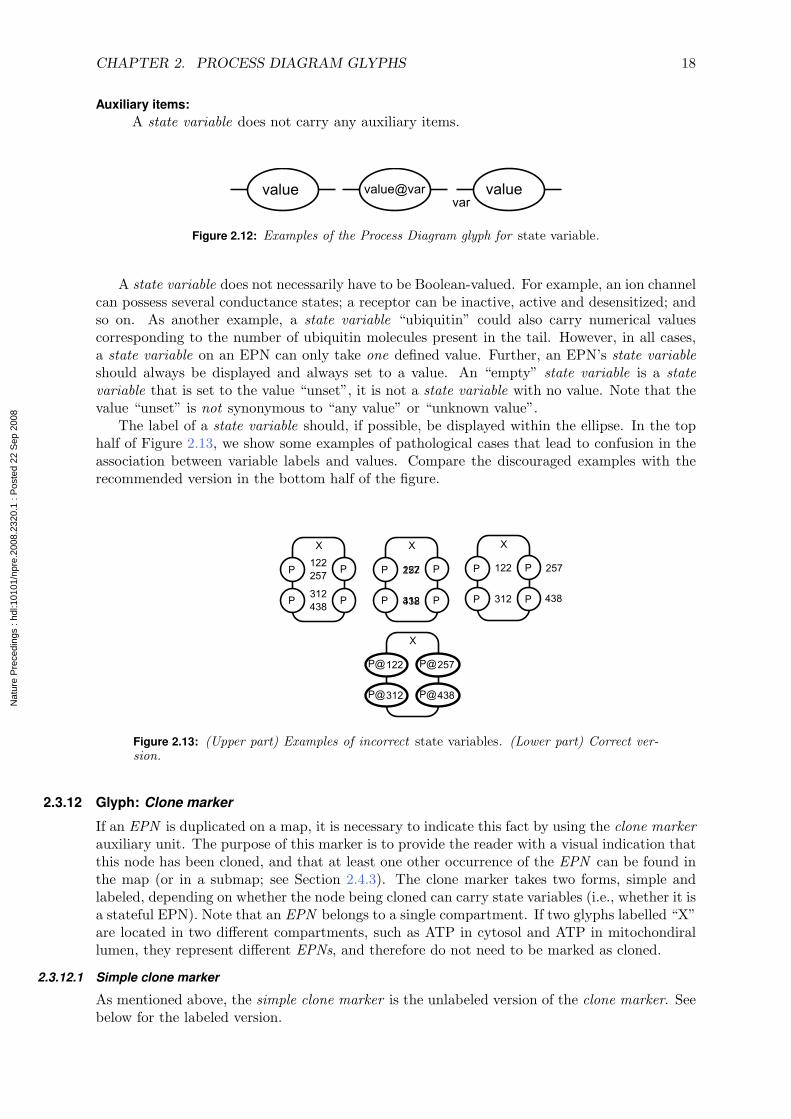
Auxiliary items:A state variable does not carry any auxiliary items.
Figure 2.12: Examples of the Process Diagram glyph for state variable.
A state variable does not necessarily have to be Boolean-valued. For example, an ion channelcan possess several conductance states; a receptor can be inactive, active and desensitized; andso on. As another example, a state variable “ubiquitin” could also carry numerical valuescorresponding to the number of ubiquitin molecules present in the tail. However, in all cases,a state variable on an EPN can only take one defined value. Further, an EPN’s state variableshould always be displayed and always set to a value. An “empty” state variable is a statevariable that is set to the value “unset”, it is not a state variable with no value. Note that thevalue “unset” is not synonymous to “any value” or “unknown value”.
The label of a state variable should, if possible, be displayed within the ellipse. In the tophalf of Figure 2.13, we show some examples of pathological cases that lead to confusion in theassociation between variable labels and values. Compare the discouraged examples with therecommended version in the bottom half of the figure.
Figure 2.13: (Upper part) Examples of incorrect state variables. (Lower part) Correct ver-sion.
2.3.12 Glyph: Clone marker
If an EPN is duplicated on a map, it is necessary to indicate this fact by using the clone markerauxiliary unit. The purpose of this marker is to provide the reader with a visual indication thatthis node has been cloned, and that at least one other occurrence of the EPN can be found inthe map (or in a submap; see Section 2.4.3). The clone marker takes two forms, simple andlabeled, depending on whether the node being cloned can carry state variables (i.e., whether it isa stateful EPN). Note that an EPN belongs to a single compartment. If two glyphs labelled “X”are located in two different compartments, such as ATP in cytosol and ATP in mitochondirallumen, they represent different EPNs, and therefore do not need to be marked as cloned.
2.3.12.1 Simple clone marker
As mentioned above, the simple clone marker is the unlabeled version of the clone marker. Seebelow for the labeled version.
Nat
ure
Pre
cedi
ngs
: hdl
:101
01/n
pre.
2008
.232
0.1
: Pos
ted
22 S
ep 2
008
CHAPTER 2. PROCESS DIAGRAM GLYPHS 19
SBO Term:Not applicable.
Container:The simple (unlabeled) clone marker is a portion of the surface of an EPN that hasbeen modified visually through the use of a different shade, texture, or color. Figure 2.14illustrates this. The clone marker occupies the lower part of the EPN. The filled areamust be significantly smaller than the unfilled one. A marker’s surface must not exceed30% of the EPN ’s surface. A value in the range 15 and 25% is advised.
Label:Not applicable.
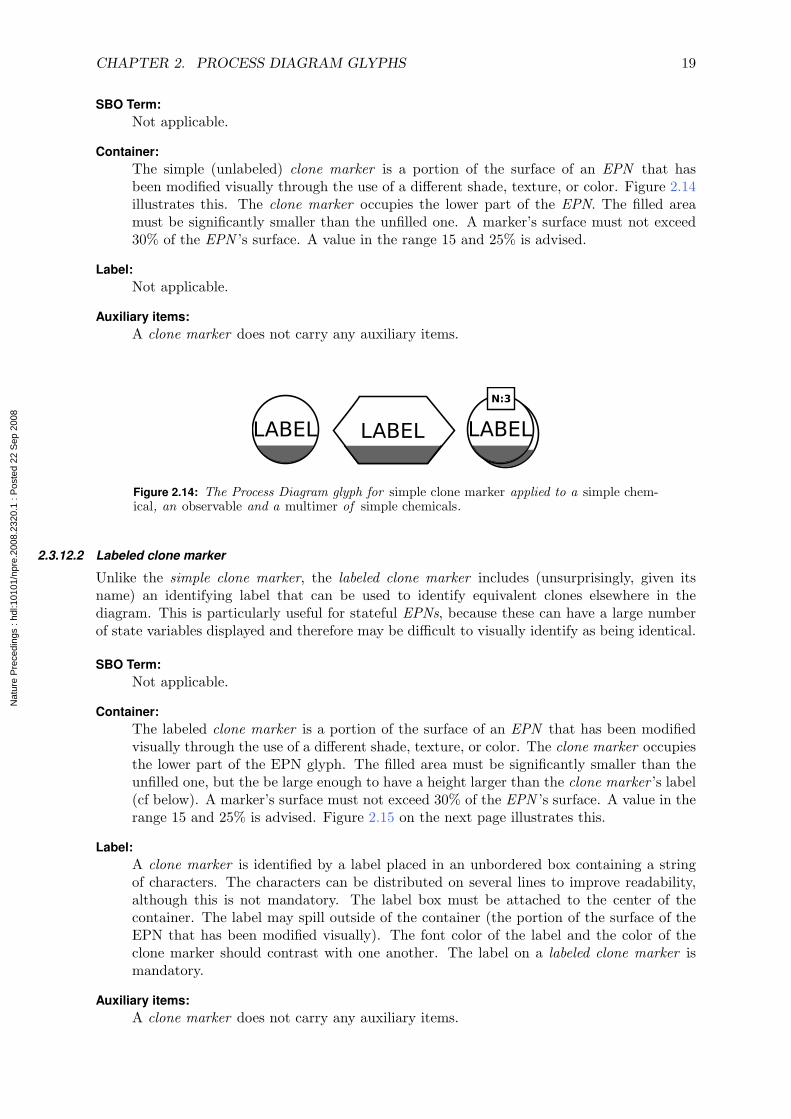
Auxiliary items:A clone marker does not carry any auxiliary items.
Figure 2.14: The Process Diagram glyph for simple clone marker applied to a simple chem-ical, an observable and a multimer of simple chemicals.
2.3.12.2 Labeled clone marker
Unlike the simple clone marker, the labeled clone marker includes (unsurprisingly, given itsname) an identifying label that can be used to identify equivalent clones elsewhere in thediagram. This is particularly useful for stateful EPNs, because these can have a large numberof state variables displayed and therefore may be difficult to visually identify as being identical.
SBO Term:Not applicable.
Container:The labeled clone marker is a portion of the surface of an EPN that has been modifiedvisually through the use of a different shade, texture, or color. The clone marker occupiesthe lower part of the EPN glyph. The filled area must be significantly smaller than theunfilled one, but the be large enough to have a height larger than the clone marker ’s label(cf below). A marker’s surface must not exceed 30% of the EPN ’s surface. A value in therange 15 and 25% is advised. Figure 2.15 on the next page illustrates this.
Label:A clone marker is identified by a label placed in an unbordered box containing a stringof characters. The characters can be distributed on several lines to improve readability,although this is not mandatory. The label box must be attached to the center of thecontainer. The label may spill outside of the container (the portion of the surface of theEPN that has been modified visually). The font color of the label and the color of theclone marker should contrast with one another. The label on a labeled clone marker ismandatory.
Auxiliary items:A clone marker does not carry any auxiliary items.
Nat
ure
Pre
cedi
ngs
: hdl
:101
01/n
pre.
2008
.232
0.1
: Pos
ted
22 S
ep 2
008
CHAPTER 2. PROCESS DIAGRAM GLYPHS 20
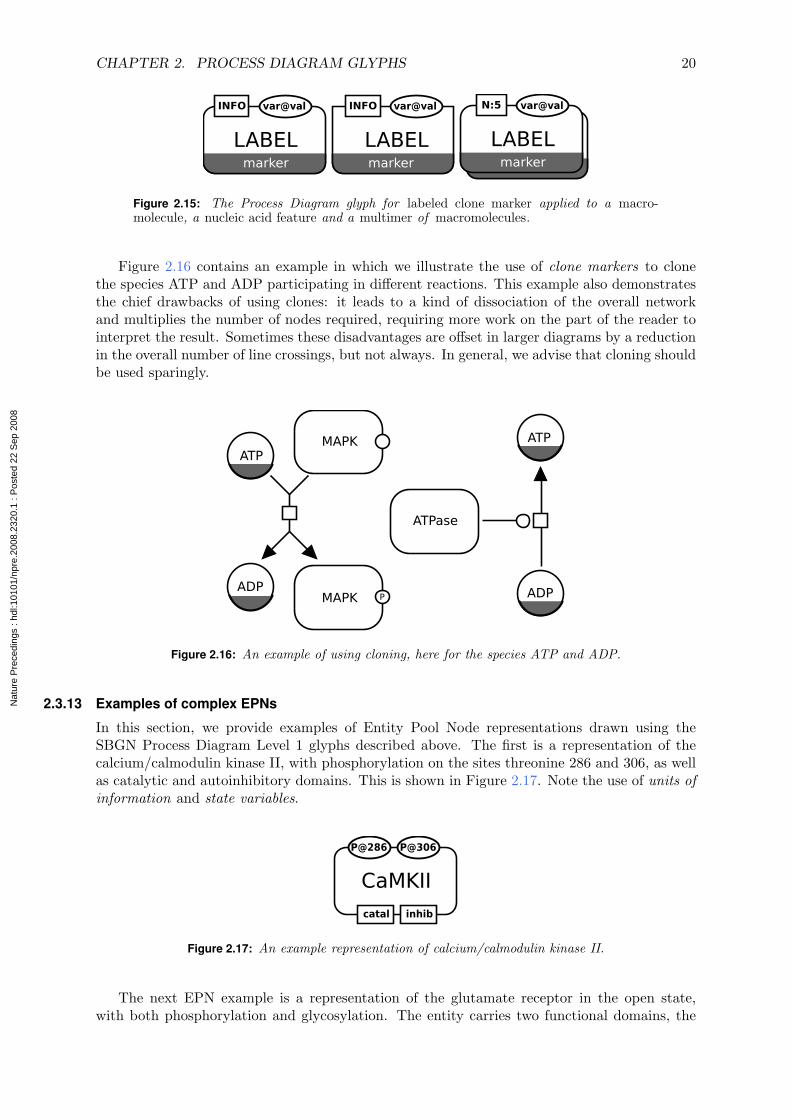
Figure 2.15: The Process Diagram glyph for labeled clone marker applied to a macro-molecule, a nucleic acid feature and a multimer of macromolecules.
Figure 2.16 contains an example in which we illustrate the use of clone markers to clonethe species ATP and ADP participating in different reactions. This example also demonstratesthe chief drawbacks of using clones: it leads to a kind of dissociation of the overall networkand multiplies the number of nodes required, requiring more work on the part of the reader tointerpret the result. Sometimes these disadvantages are offset in larger diagrams by a reductionin the overall number of line crossings, but not always. In general, we advise that cloning shouldbe used sparingly.
Figure 2.16: An example of using cloning, here for the species ATP and ADP.
2.3.13 Examples of complex EPNs
In this section, we provide examples of Entity Pool Node representations drawn using theSBGN Process Diagram Level 1 glyphs described above. The first is a representation of thecalcium/calmodulin kinase II, with phosphorylation on the sites threonine 286 and 306, as wellas catalytic and autoinhibitory domains. This is shown in Figure 2.17. Note the use of units ofinformation and state variables.
Figure 2.17: An example representation of calcium/calmodulin kinase II.
The next EPN example is a representation of the glutamate receptor in the open state,with both phosphorylation and glycosylation. The entity carries two functional domains, the
Nat
ure
Pre
cedi
ngs
: hdl
:101
01/n
pre.
2008
.232
0.1
: Pos
ted
22 S
ep 2
008
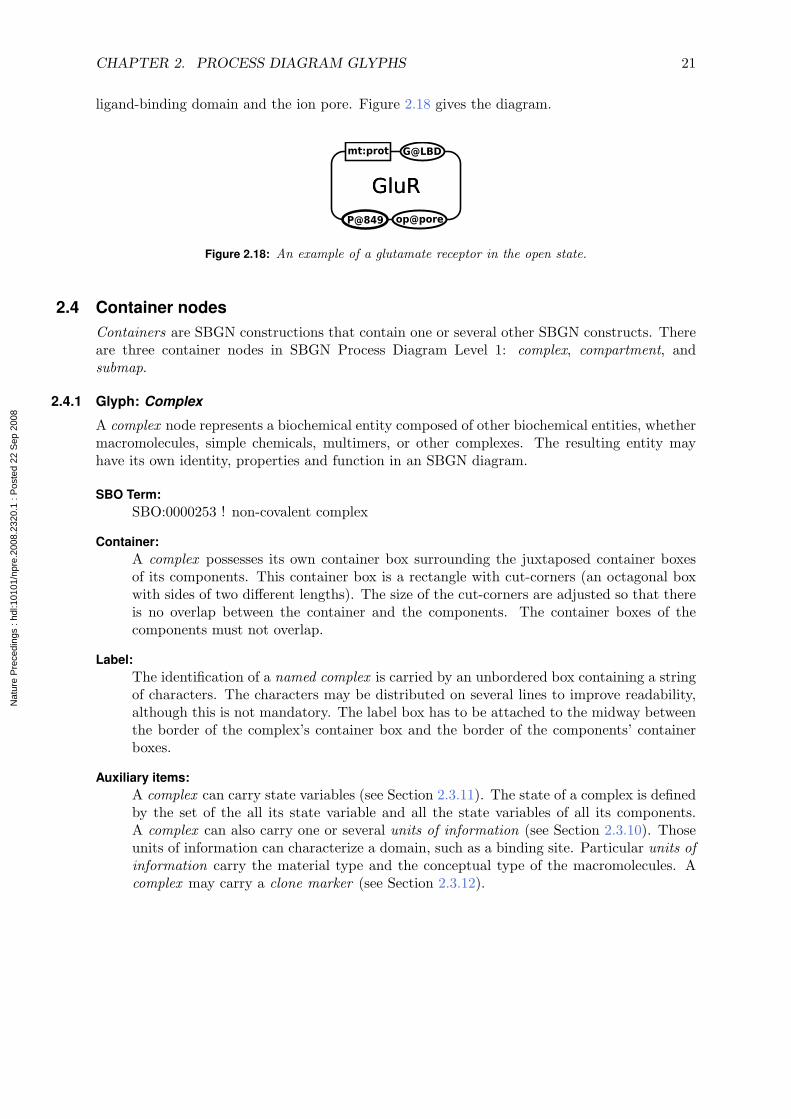
CHAPTER 2. PROCESS DIAGRAM GLYPHS 21
ligand-binding domain and the ion pore. Figure 2.18 gives the diagram.
Figure 2.18: An example of a glutamate receptor in the open state.
2.4 Container nodesContainers are SBGN constructions that contain one or several other SBGN constructs. Thereare three container nodes in SBGN Process Diagram Level 1: complex, compartment, andsubmap.
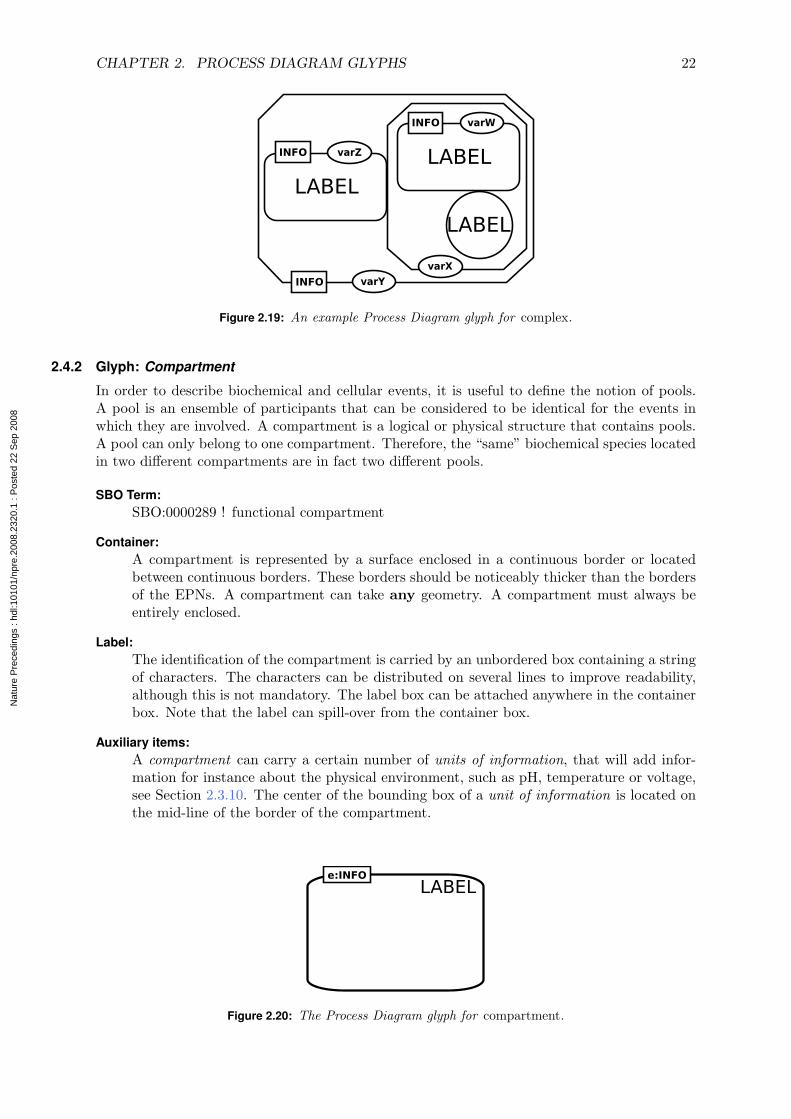
2.4.1 Glyph: Complex
A complex node represents a biochemical entity composed of other biochemical entities, whethermacromolecules, simple chemicals, multimers, or other complexes. The resulting entity mayhave its own identity, properties and function in an SBGN diagram.
SBO Term:SBO:0000253 ! non-covalent complex
Container:A complex possesses its own container box surrounding the juxtaposed container boxesof its components. This container box is a rectangle with cut-corners (an octagonal boxwith sides of two different lengths). The size of the cut-corners are adjusted so that thereis no overlap between the container and the components. The container boxes of thecomponents must not overlap.
Label:The identification of a named complex is carried by an unbordered box containing a stringof characters. The characters may be distributed on several lines to improve readability,although this is not mandatory. The label box has to be attached to the midway betweenthe border of the complex’s container box and the border of the components’ containerboxes.
Auxiliary items:A complex can carry state variables (see Section 2.3.11). The state of a complex is definedby the set of the all its state variable and all the state variables of all its components.A complex can also carry one or several units of information (see Section 2.3.10). Thoseunits of information can characterize a domain, such as a binding site. Particular units ofinformation carry the material type and the conceptual type of the macromolecules. Acomplex may carry a clone marker (see Section 2.3.12).
Nat
ure
Pre
cedi
ngs
: hdl
:101
01/n
pre.
2008
.232
0.1
: Pos
ted
22 S
ep 2
008
CHAPTER 2. PROCESS DIAGRAM GLYPHS 22
Figure 2.19: An example Process Diagram glyph for complex.
2.4.2 Glyph: Compartment
In order to describe biochemical and cellular events, it is useful to define the notion of pools.A pool is an ensemble of participants that can be considered to be identical for the events inwhich they are involved. A compartment is a logical or physical structure that contains pools.A pool can only belong to one compartment. Therefore, the “same” biochemical species locatedin two different compartments are in fact two different pools.
SBO Term:SBO:0000289 ! functional compartment
Container:A compartment is represented by a surface enclosed in a continuous border or locatedbetween continuous borders. These borders should be noticeably thicker than the bordersof the EPNs. A compartment can take any geometry. A compartment must always beentirely enclosed.
Label:The identification of the compartment is carried by an unbordered box containing a stringof characters. The characters can be distributed on several lines to improve readability,although this is not mandatory. The label box can be attached anywhere in the containerbox. Note that the label can spill-over from the container box.
Auxiliary items:A compartment can carry a certain number of units of information, that will add infor-mation for instance about the physical environment, such as pH, temperature or voltage,see Section 2.3.10. The center of the bounding box of a unit of information is located onthe mid-line of the border of the compartment.
Figure 2.20: The Process Diagram glyph for compartment.
Nat
ure
Pre
cedi
ngs
: hdl
:101
01/n
pre.
2008
.232
0.1
: Pos
ted
22 S
ep 2
008
CHAPTER 2. PROCESS DIAGRAM GLYPHS 23
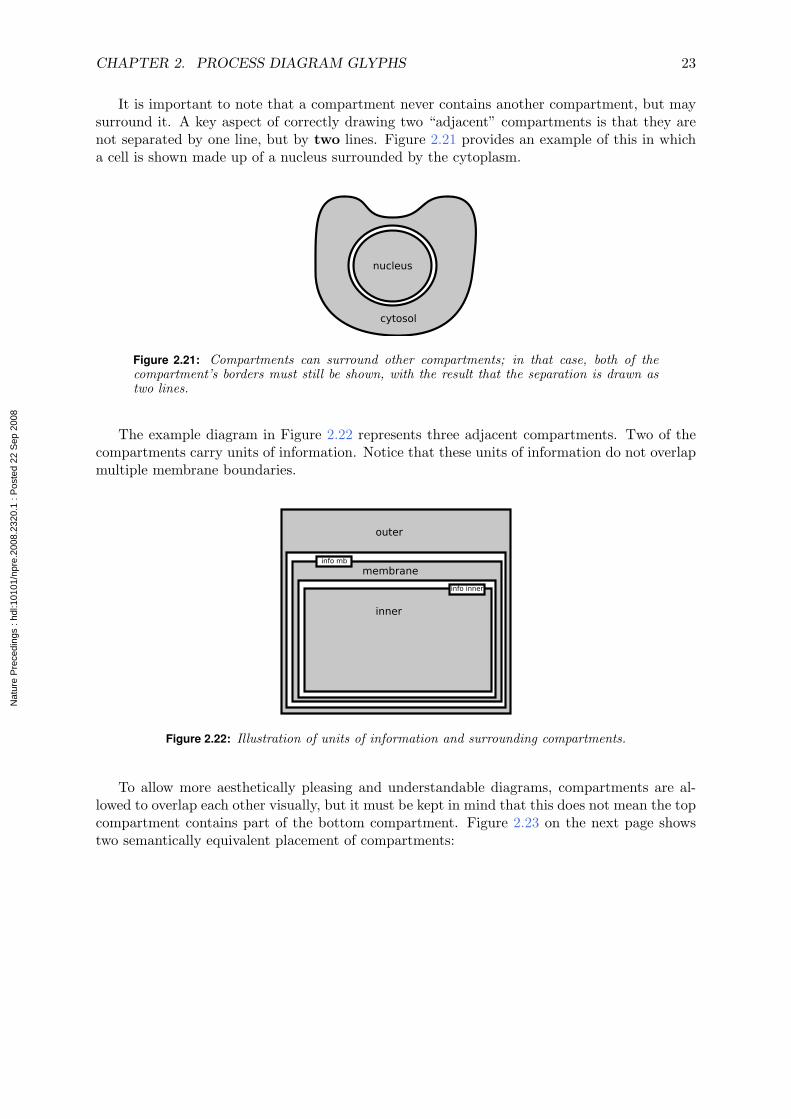
It is important to note that a compartment never contains another compartment, but maysurround it. A key aspect of correctly drawing two “adjacent” compartments is that they arenot separated by one line, but by two lines. Figure 2.21 provides an example of this in whicha cell is shown made up of a nucleus surrounded by the cytoplasm.
Figure 2.21: Compartments can surround other compartments; in that case, both of thecompartment’s borders must still be shown, with the result that the separation is drawn astwo lines.
The example diagram in Figure 2.22 represents three adjacent compartments. Two of thecompartments carry units of information. Notice that these units of information do not overlapmultiple membrane boundaries.
Figure 2.22: Illustration of units of information and surrounding compartments.
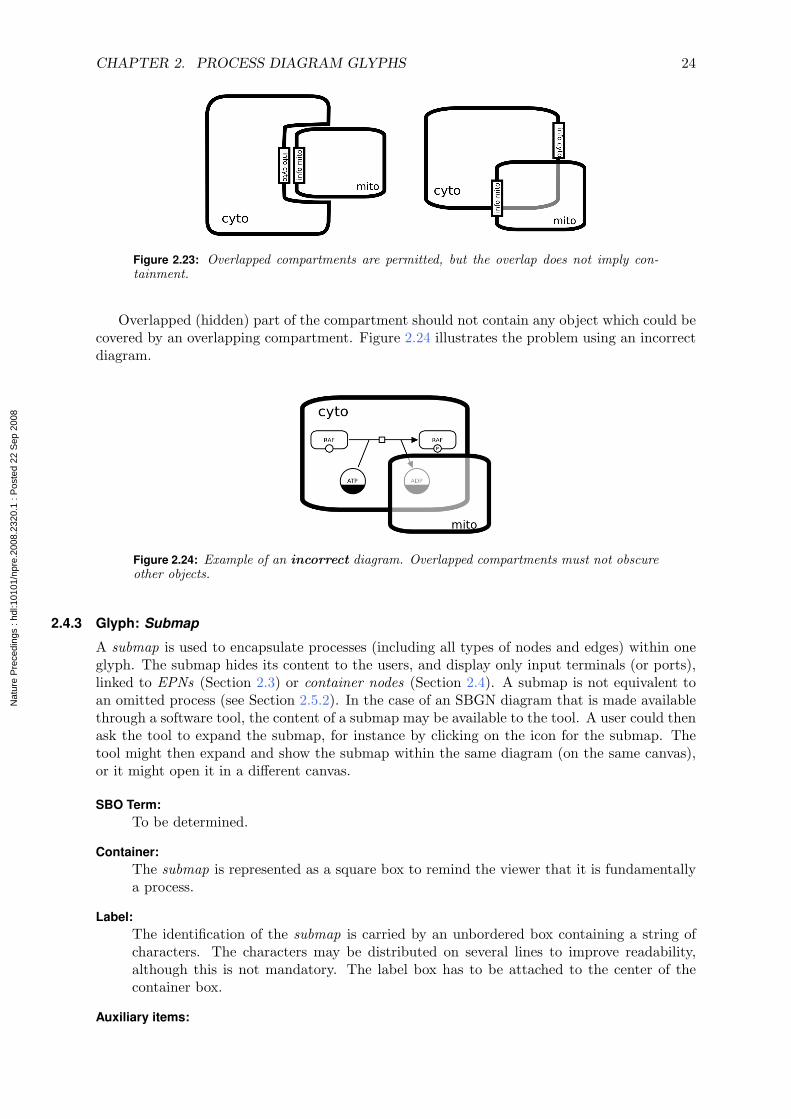
To allow more aesthetically pleasing and understandable diagrams, compartments are al-lowed to overlap each other visually, but it must be kept in mind that this does not mean the topcompartment contains part of the bottom compartment. Figure 2.23 on the next page showstwo semantically equivalent placement of compartments:
Nat
ure
Pre
cedi
ngs
: hdl
:101
01/n
pre.
2008
.232
0.1
: Pos
ted
22 S
ep 2
008
CHAPTER 2. PROCESS DIAGRAM GLYPHS 24
Figure 2.23: Overlapped compartments are permitted, but the overlap does not imply con-tainment.
Overlapped (hidden) part of the compartment should not contain any object which could becovered by an overlapping compartment. Figure 2.24 illustrates the problem using an incorrectdiagram.
Figure 2.24: Example of an incorrect diagram. Overlapped compartments must not obscureother objects.
2.4.3 Glyph: Submap
A submap is used to encapsulate processes (including all types of nodes and edges) within oneglyph. The submap hides its content to the users, and display only input terminals (or ports),linked to EPNs (Section 2.3) or container nodes (Section 2.4). A submap is not equivalent toan omitted process (see Section 2.5.2). In the case of an SBGN diagram that is made availablethrough a software tool, the content of a submap may be available to the tool. A user could thenask the tool to expand the submap, for instance by clicking on the icon for the submap. Thetool might then expand and show the submap within the same diagram (on the same canvas),or it might open it in a different canvas.
SBO Term:To be determined.
Container:The submap is represented as a square box to remind the viewer that it is fundamentallya process.
Label:The identification of the submap is carried by an unbordered box containing a string ofcharacters. The characters may be distributed on several lines to improve readability,although this is not mandatory. The label box has to be attached to the center of thecontainer box.
Auxiliary items:
Nat
ure
Pre
cedi
ngs
: hdl
:101
01/n
pre.
2008
.232
0.1
: Pos
ted
22 S
ep 2
008

CHAPTER 2. PROCESS DIAGRAM GLYPHS 25
A submap carries labeled terminals. When the submap is represented folded, those ter-minals are linked to external EPNs (Section 2.3) or containers (Section 2.4). In theunfolded view, exposing the internal structure of the submap, a set of tags point to thecorresponding internal EPNs Section 2.3 or containers (Section 2.4).
Figure 2.25: The Process Diagram glyph for submap. (Upper part) folded submap. (Lowerpart) content of the submap.
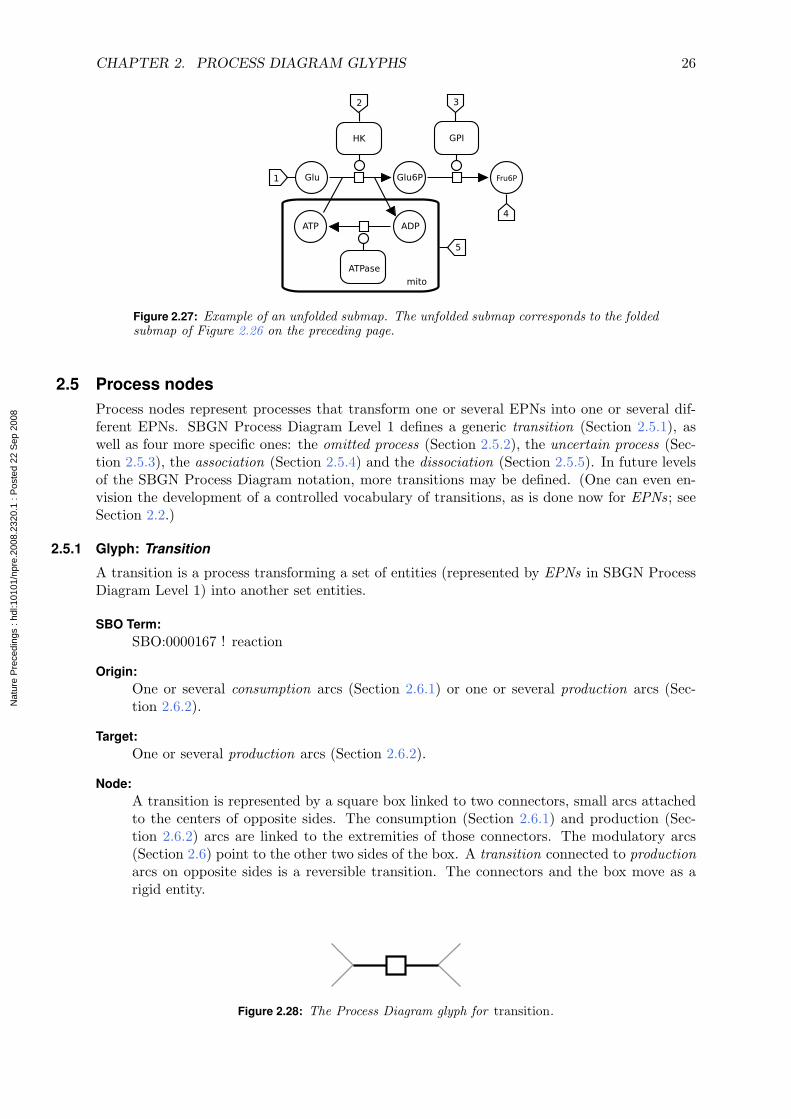
Figure 2.26 represents a submap that transforms glucose into fructose-6-phosphate. Thesubmap carries five terminals, four linked to EPNs and one linked to a compartment. The latteris particularly important in the case of EPNs present only in a compartment enclosed in asubmap, and that are not linked to terminals themselves. Note that the terminals do not definea “direction”, such as input or output. The flux of the reactions is determined by the context.
Figure 2.26: Example of a submap with contents elided.
The diagram in Figure 2.27 on the following page represents an unfolded version of a submap.Here, anything outside the submap has disappeared, and the internal tags are not linked to thecorresponding external terminals. Note the tag 5, linking the compartment “mito” of thesubmap to the compartment “mito” outside the submap. The compartment containing Glu6Pis implicitly defined as the same as the compartment containing Glu and Fru6P. There is noambiguity because if Glu and Fru6P were in different compartments, one of them should havebeen defined within the submap.
Nat
ure
Pre
cedi
ngs
: hdl
:101
01/n
pre.
2008
.232
0.1
: Pos
ted
22 S
ep 2
008
CHAPTER 2. PROCESS DIAGRAM GLYPHS 26
Figure 2.27: Example of an unfolded submap. The unfolded submap corresponds to the foldedsubmap of Figure 2.26 on the preceding page.
2.5 Process nodesProcess nodes represent processes that transform one or several EPNs into one or several dif-ferent EPNs. SBGN Process Diagram Level 1 defines a generic transition (Section 2.5.1), aswell as four more specific ones: the omitted process (Section 2.5.2), the uncertain process (Sec-tion 2.5.3), the association (Section 2.5.4) and the dissociation (Section 2.5.5). In future levelsof the SBGN Process Diagram notation, more transitions may be defined. (One can even en-vision the development of a controlled vocabulary of transitions, as is done now for EPNs; seeSection 2.2.)
2.5.1 Glyph: Transition
A transition is a process transforming a set of entities (represented by EPNs in SBGN ProcessDiagram Level 1) into another set entities.
SBO Term:SBO:0000167 ! reaction
Origin:One or several consumption arcs (Section 2.6.1) or one or several production arcs (Sec-tion 2.6.2).
Target:One or several production arcs (Section 2.6.2).
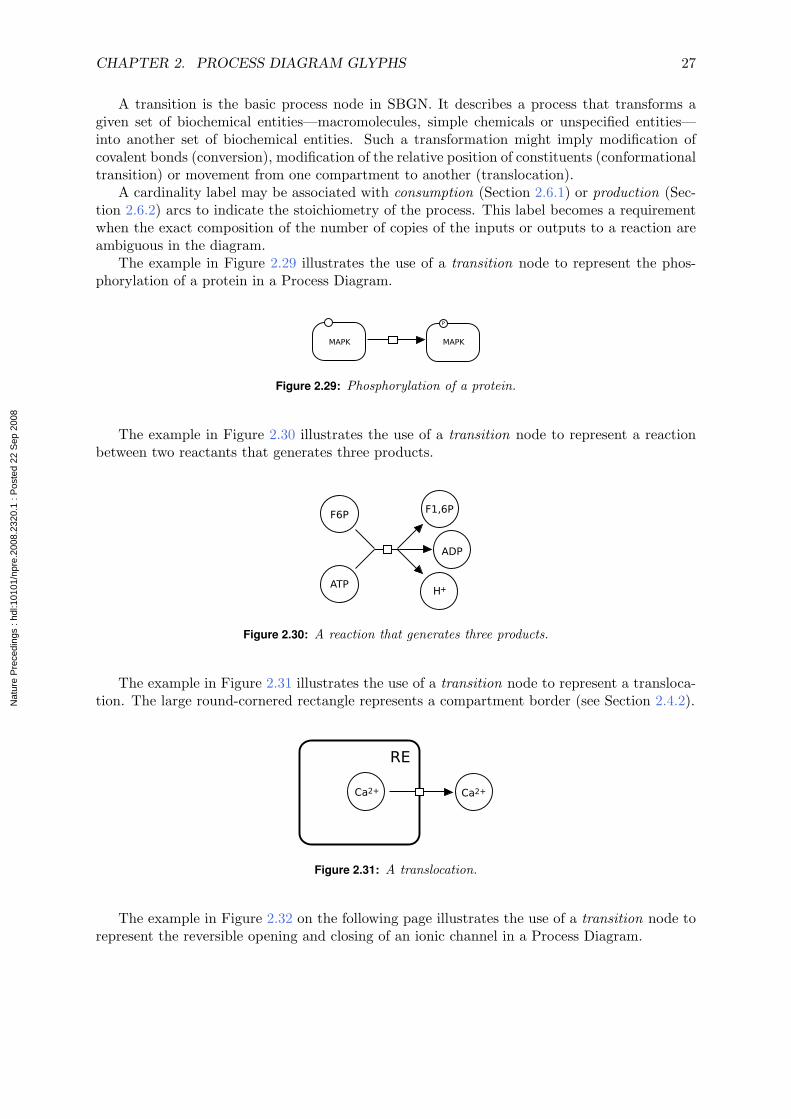
Node:A transition is represented by a square box linked to two connectors, small arcs attachedto the centers of opposite sides. The consumption (Section 2.6.1) and production (Sec-tion 2.6.2) arcs are linked to the extremities of those connectors. The modulatory arcs(Section 2.6) point to the other two sides of the box. A transition connected to productionarcs on opposite sides is a reversible transition. The connectors and the box move as arigid entity.
Figure 2.28: The Process Diagram glyph for transition.
Nat
ure
Pre
cedi
ngs
: hdl
:101
01/n
pre.
2008
.232
0.1
: Pos
ted
22 S
ep 2
008
CHAPTER 2. PROCESS DIAGRAM GLYPHS 27
A transition is the basic process node in SBGN. It describes a process that transforms agiven set of biochemical entities—macromolecules, simple chemicals or unspecified entities—into another set of biochemical entities. Such a transformation might imply modification ofcovalent bonds (conversion), modification of the relative position of constituents (conformationaltransition) or movement from one compartment to another (translocation).
A cardinality label may be associated with consumption (Section 2.6.1) or production (Sec-tion 2.6.2) arcs to indicate the stoichiometry of the process. This label becomes a requirementwhen the exact composition of the number of copies of the inputs or outputs to a reaction areambiguous in the diagram.
The example in Figure 2.29 illustrates the use of a transition node to represent the phos-phorylation of a protein in a Process Diagram.
Figure 2.29: Phosphorylation of a protein.
The example in Figure 2.30 illustrates the use of a transition node to represent a reactionbetween two reactants that generates three products.
Figure 2.30: A reaction that generates three products.
The example in Figure 2.31 illustrates the use of a transition node to represent a transloca-tion. The large round-cornered rectangle represents a compartment border (see Section 2.4.2).
Figure 2.31: A translocation.
The example in Figure 2.32 on the following page illustrates the use of a transition node torepresent the reversible opening and closing of an ionic channel in a Process Diagram.
Nat
ure
Pre
cedi
ngs
: hdl
:101
01/n
pre.
2008
.232
0.1
: Pos
ted
22 S
ep 2
008
CHAPTER 2. PROCESS DIAGRAM GLYPHS 28
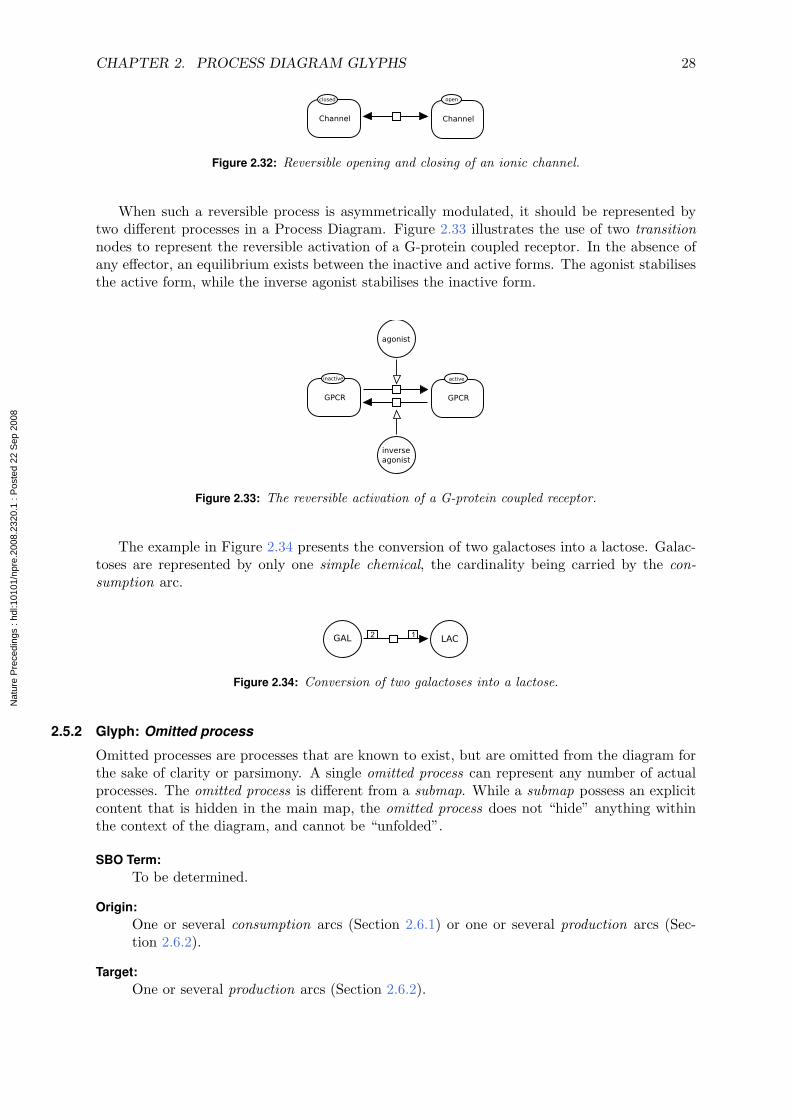
Figure 2.32: Reversible opening and closing of an ionic channel.
When such a reversible process is asymmetrically modulated, it should be represented bytwo different processes in a Process Diagram. Figure 2.33 illustrates the use of two transitionnodes to represent the reversible activation of a G-protein coupled receptor. In the absence ofany effector, an equilibrium exists between the inactive and active forms. The agonist stabilisesthe active form, while the inverse agonist stabilises the inactive form.
Figure 2.33: The reversible activation of a G-protein coupled receptor.
The example in Figure 2.34 presents the conversion of two galactoses into a lactose. Galac-toses are represented by only one simple chemical, the cardinality being carried by the con-sumption arc.
Figure 2.34: Conversion of two galactoses into a lactose.
2.5.2 Glyph: Omitted process
Omitted processes are processes that are known to exist, but are omitted from the diagram forthe sake of clarity or parsimony. A single omitted process can represent any number of actualprocesses. The omitted process is different from a submap. While a submap possess an explicitcontent that is hidden in the main map, the omitted process does not “hide” anything withinthe context of the diagram, and cannot be “unfolded”.
SBO Term:To be determined.
Origin:One or several consumption arcs (Section 2.6.1) or one or several production arcs (Sec-tion 2.6.2).
Target:One or several production arcs (Section 2.6.2).
Nat
ure
Pre
cedi
ngs
: hdl
:101
01/n
pre.
2008
.232
0.1
: Pos
ted
22 S
ep 2
008
CHAPTER 2. PROCESS DIAGRAM GLYPHS 29
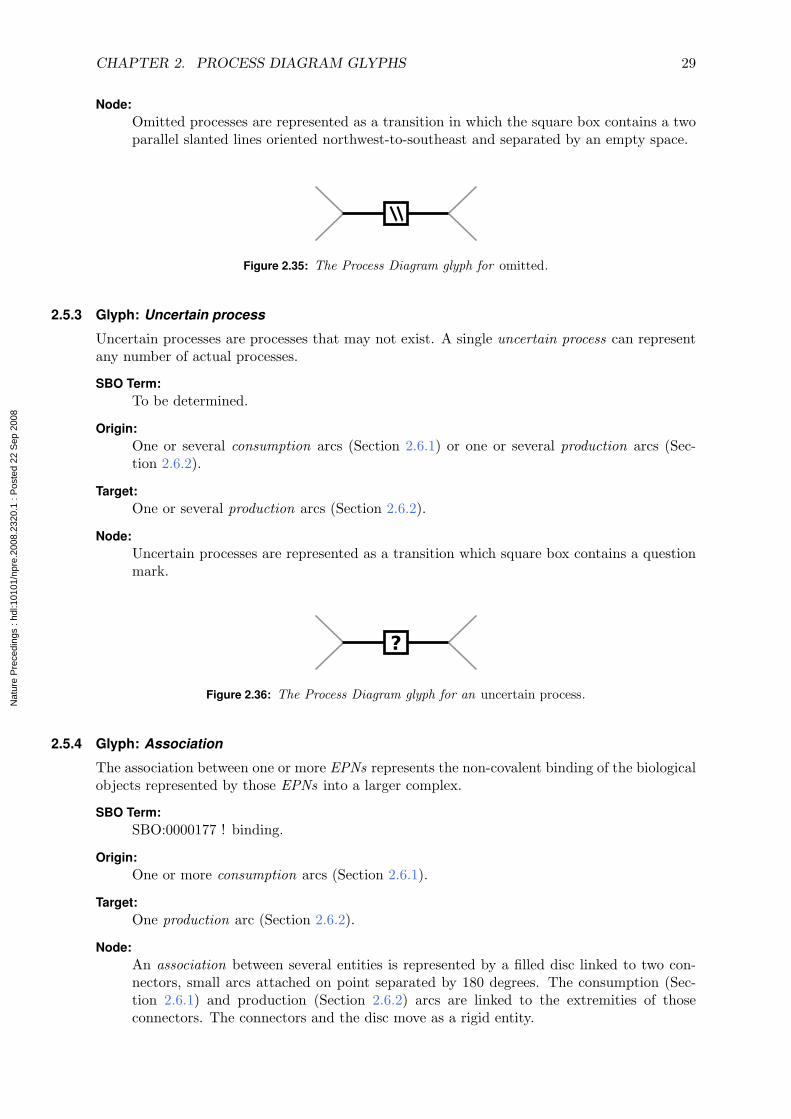
Node:Omitted processes are represented as a transition in which the square box contains a twoparallel slanted lines oriented northwest-to-southeast and separated by an empty space.
Figure 2.35: The Process Diagram glyph for omitted.
2.5.3 Glyph: Uncertain process
Uncertain processes are processes that may not exist. A single uncertain process can representany number of actual processes.
SBO Term:To be determined.
Origin:One or several consumption arcs (Section 2.6.1) or one or several production arcs (Sec-tion 2.6.2).
Target:One or several production arcs (Section 2.6.2).
Node:Uncertain processes are represented as a transition which square box contains a questionmark.
Figure 2.36: The Process Diagram glyph for an uncertain process.
2.5.4 Glyph: Association
The association between one or more EPNs represents the non-covalent binding of the biologicalobjects represented by those EPNs into a larger complex.
SBO Term:SBO:0000177 ! binding.
Origin:One or more consumption arcs (Section 2.6.1).
Target:One production arc (Section 2.6.2).
Node:An association between several entities is represented by a filled disc linked to two con-nectors, small arcs attached on point separated by 180 degrees. The consumption (Sec-tion 2.6.1) and production (Section 2.6.2) arcs are linked to the extremities of thoseconnectors. The connectors and the disc move as a rigid entity.
Nat
ure
Pre
cedi
ngs
: hdl
:101
01/n
pre.
2008
.232
0.1
: Pos
ted
22 S
ep 2
008
CHAPTER 2. PROCESS DIAGRAM GLYPHS 30
Figure 2.37: The Process Diagram glyph for association.
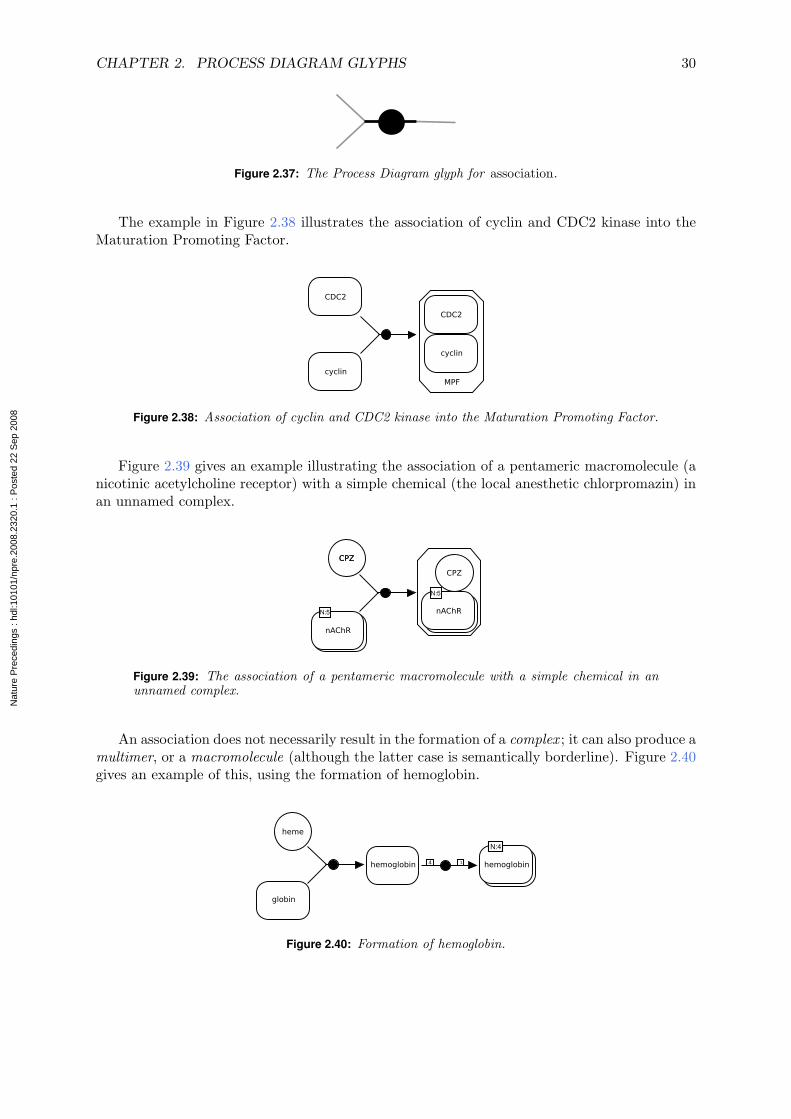
The example in Figure 2.38 illustrates the association of cyclin and CDC2 kinase into theMaturation Promoting Factor.
Figure 2.38: Association of cyclin and CDC2 kinase into the Maturation Promoting Factor.
Figure 2.39 gives an example illustrating the association of a pentameric macromolecule (anicotinic acetylcholine receptor) with a simple chemical (the local anesthetic chlorpromazin) inan unnamed complex.
Figure 2.39: The association of a pentameric macromolecule with a simple chemical in anunnamed complex.
An association does not necessarily result in the formation of a complex ; it can also produce amultimer, or a macromolecule (although the latter case is semantically borderline). Figure 2.40gives an example of this, using the formation of hemoglobin.
Figure 2.40: Formation of hemoglobin.
Nat
ure
Pre
cedi
ngs
: hdl
:101
01/n
pre.
2008
.232
0.1
: Pos
ted
22 S
ep 2
008
CHAPTER 2. PROCESS DIAGRAM GLYPHS 31
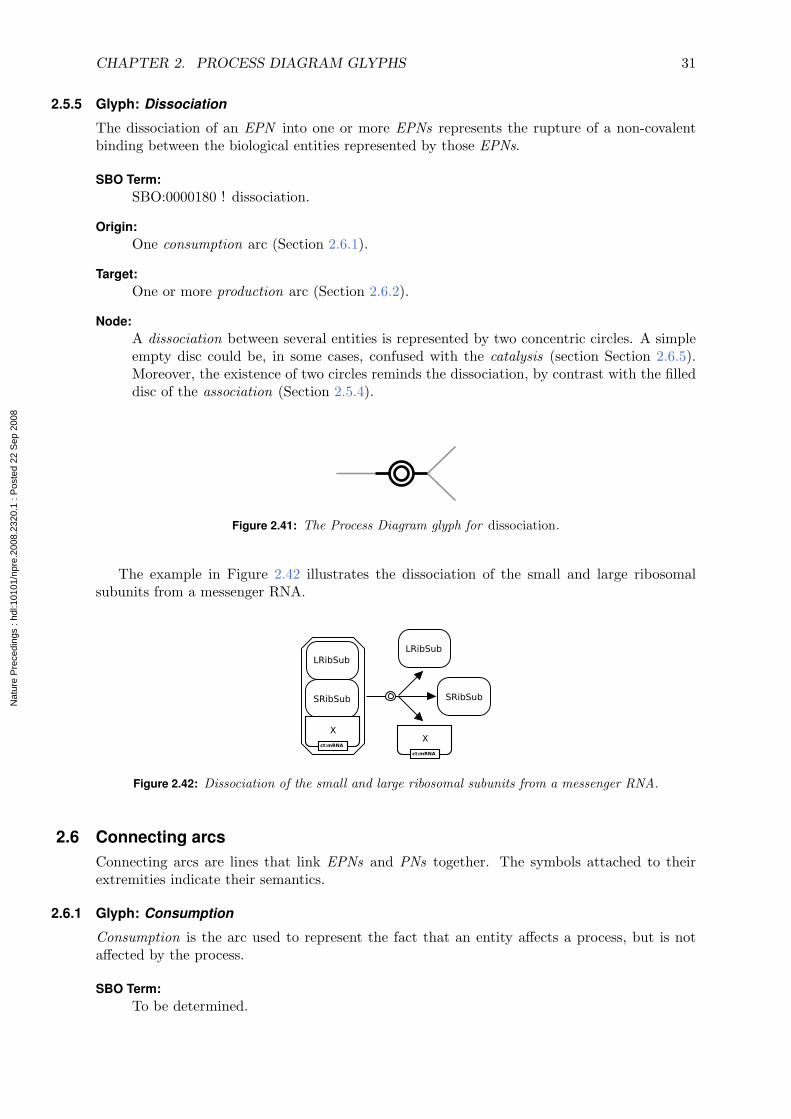
2.5.5 Glyph: Dissociation
The dissociation of an EPN into one or more EPNs represents the rupture of a non-covalentbinding between the biological entities represented by those EPNs.
SBO Term:SBO:0000180 ! dissociation.
Origin:One consumption arc (Section 2.6.1).
Target:One or more production arc (Section 2.6.2).
Node:A dissociation between several entities is represented by two concentric circles. A simpleempty disc could be, in some cases, confused with the catalysis (section Section 2.6.5).Moreover, the existence of two circles reminds the dissociation, by contrast with the filleddisc of the association (Section 2.5.4).
Figure 2.41: The Process Diagram glyph for dissociation.
The example in Figure 2.42 illustrates the dissociation of the small and large ribosomalsubunits from a messenger RNA.
Figure 2.42: Dissociation of the small and large ribosomal subunits from a messenger RNA.
2.6 Connecting arcsConnecting arcs are lines that link EPNs and PNs together. The symbols attached to theirextremities indicate their semantics.
2.6.1 Glyph: Consumption
Consumption is the arc used to represent the fact that an entity affects a process, but is notaffected by the process.
SBO Term:To be determined.
Nat
ure
Pre
cedi
ngs
: hdl
:101
01/n
pre.
2008
.232
0.1
: Pos
ted
22 S
ep 2
008
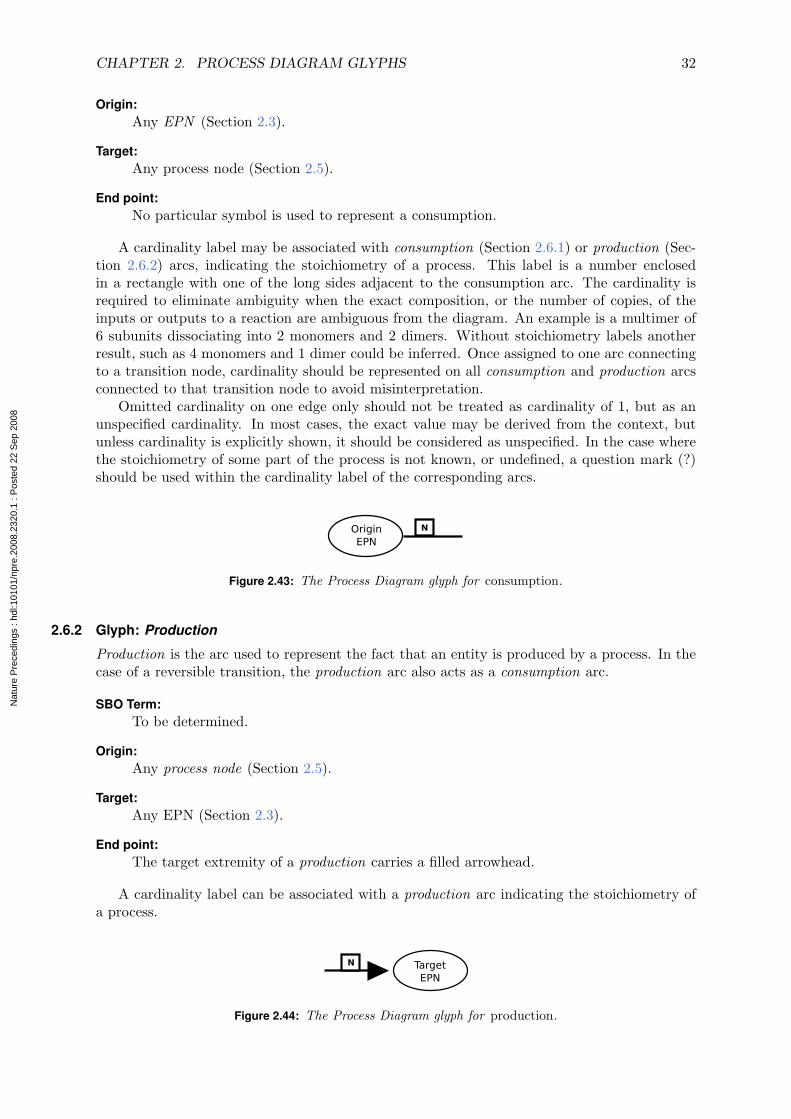
CHAPTER 2. PROCESS DIAGRAM GLYPHS 32
Origin:Any EPN (Section 2.3).
Target:Any process node (Section 2.5).
End point:No particular symbol is used to represent a consumption.
A cardinality label may be associated with consumption (Section 2.6.1) or production (Sec-tion 2.6.2) arcs, indicating the stoichiometry of a process. This label is a number enclosedin a rectangle with one of the long sides adjacent to the consumption arc. The cardinality isrequired to eliminate ambiguity when the exact composition, or the number of copies, of theinputs or outputs to a reaction are ambiguous from the diagram. An example is a multimer of6 subunits dissociating into 2 monomers and 2 dimers. Without stoichiometry labels anotherresult, such as 4 monomers and 1 dimer could be inferred. Once assigned to one arc connectingto a transition node, cardinality should be represented on all consumption and production arcsconnected to that transition node to avoid misinterpretation.
Omitted cardinality on one edge only should not be treated as cardinality of 1, but as anunspecified cardinality. In most cases, the exact value may be derived from the context, butunless cardinality is explicitly shown, it should be considered as unspecified. In the case wherethe stoichiometry of some part of the process is not known, or undefined, a question mark (?)should be used within the cardinality label of the corresponding arcs.
Figure 2.43: The Process Diagram glyph for consumption.
2.6.2 Glyph: Production
Production is the arc used to represent the fact that an entity is produced by a process. In thecase of a reversible transition, the production arc also acts as a consumption arc.
SBO Term:To be determined.
Origin:Any process node (Section 2.5).
Target:Any EPN (Section 2.3).
End point:The target extremity of a production carries a filled arrowhead.
A cardinality label can be associated with a production arc indicating the stoichiometry ofa process.
Figure 2.44: The Process Diagram glyph for production.
Nat
ure
Pre
cedi
ngs
: hdl
:101
01/n
pre.
2008
.232
0.1
: Pos
ted
22 S
ep 2
008
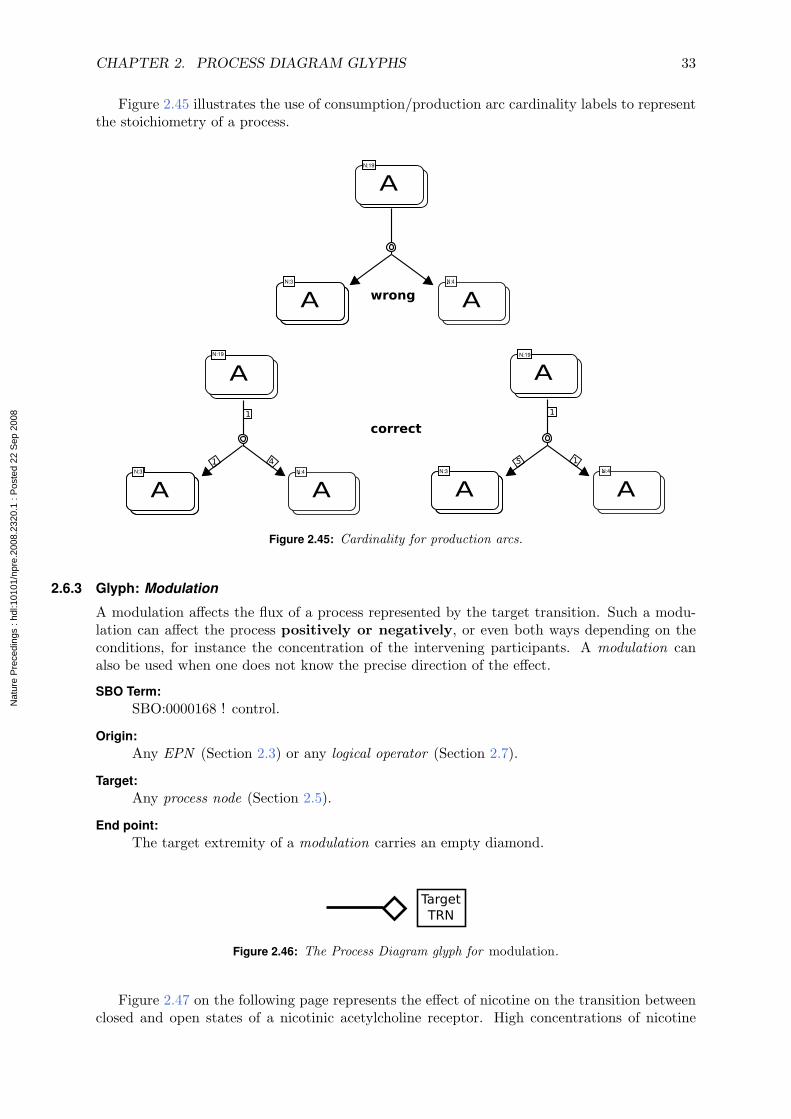
CHAPTER 2. PROCESS DIAGRAM GLYPHS 33
Figure 2.45 illustrates the use of consumption/production arc cardinality labels to representthe stoichiometry of a process.
Figure 2.45: Cardinality for production arcs.
2.6.3 Glyph: Modulation
A modulation affects the flux of a process represented by the target transition. Such a modu-lation can affect the process positively or negatively, or even both ways depending on theconditions, for instance the concentration of the intervening participants. A modulation canalso be used when one does not know the precise direction of the effect.
SBO Term:SBO:0000168 ! control.
Origin:Any EPN (Section 2.3) or any logical operator (Section 2.7).
Target:Any process node (Section 2.5).
End point:The target extremity of a modulation carries an empty diamond.
Figure 2.46: The Process Diagram glyph for modulation.
Figure 2.47 on the following page represents the effect of nicotine on the transition betweenclosed and open states of a nicotinic acetylcholine receptor. High concentrations of nicotine
Nat
ure
Pre
cedi
ngs
: hdl
:101
01/n
pre.
2008
.232
0.1
: Pos
ted
22 S
ep 2
008
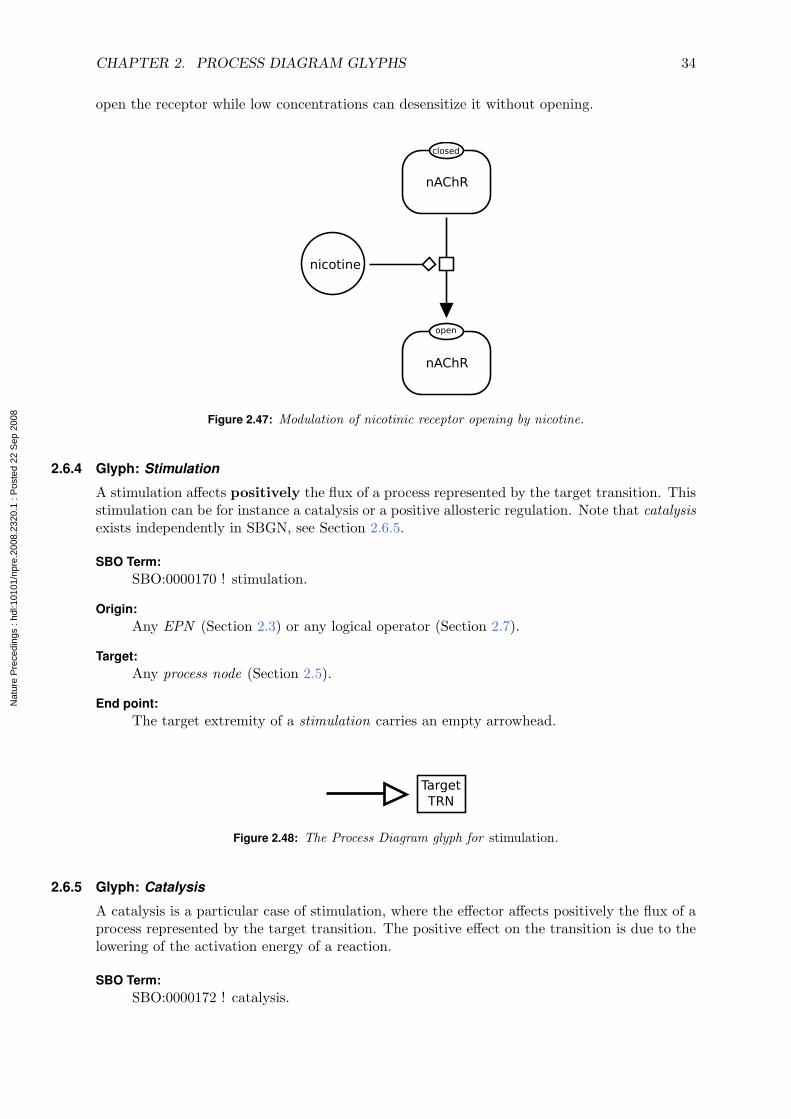
CHAPTER 2. PROCESS DIAGRAM GLYPHS 34
open the receptor while low concentrations can desensitize it without opening.
Figure 2.47: Modulation of nicotinic receptor opening by nicotine.
2.6.4 Glyph: Stimulation
A stimulation affects positively the flux of a process represented by the target transition. Thisstimulation can be for instance a catalysis or a positive allosteric regulation. Note that catalysisexists independently in SBGN, see Section 2.6.5.
SBO Term:SBO:0000170 ! stimulation.
Origin:Any EPN (Section 2.3) or any logical operator (Section 2.7).
Target:Any process node (Section 2.5).
End point:The target extremity of a stimulation carries an empty arrowhead.
Figure 2.48: The Process Diagram glyph for stimulation.
2.6.5 Glyph: Catalysis
A catalysis is a particular case of stimulation, where the effector affects positively the flux of aprocess represented by the target transition. The positive effect on the transition is due to thelowering of the activation energy of a reaction.
SBO Term:SBO:0000172 ! catalysis.
Nat
ure
Pre
cedi
ngs
: hdl
:101
01/n
pre.
2008
.232
0.1
: Pos
ted
22 S
ep 2
008
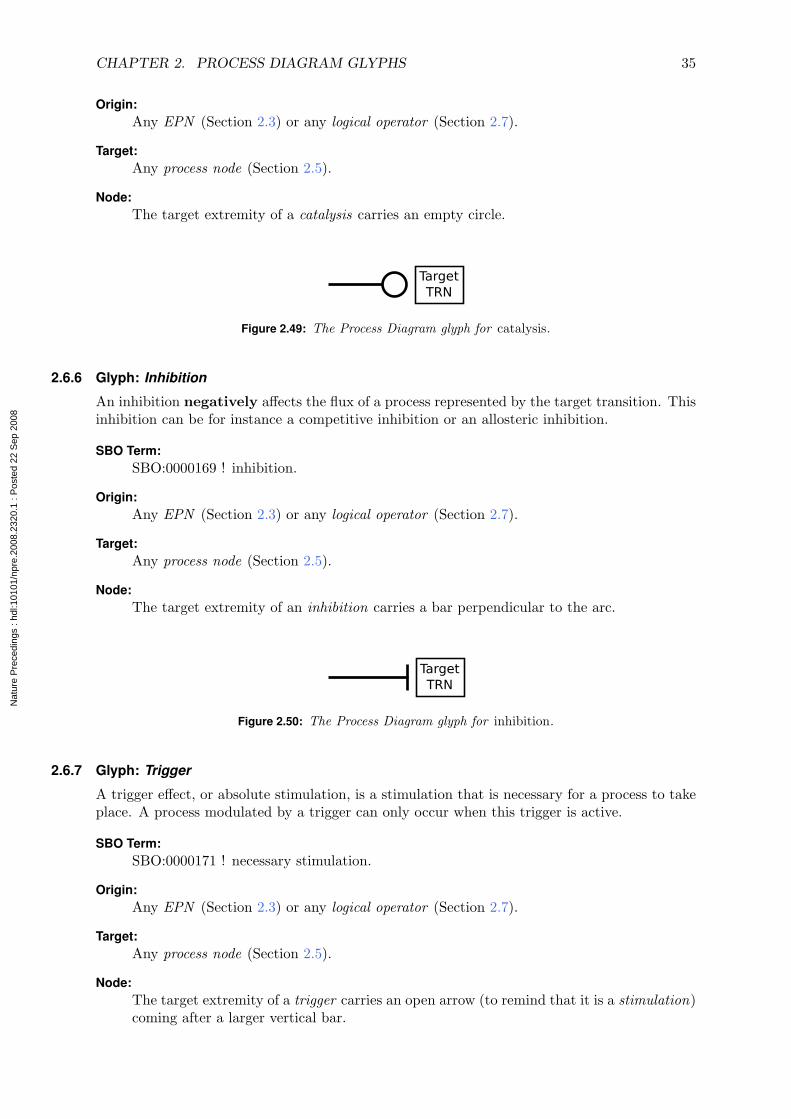
CHAPTER 2. PROCESS DIAGRAM GLYPHS 35
Origin:Any EPN (Section 2.3) or any logical operator (Section 2.7).
Target:Any process node (Section 2.5).
Node:The target extremity of a catalysis carries an empty circle.
Figure 2.49: The Process Diagram glyph for catalysis.
2.6.6 Glyph: Inhibition
An inhibition negatively affects the flux of a process represented by the target transition. Thisinhibition can be for instance a competitive inhibition or an allosteric inhibition.
SBO Term:SBO:0000169 ! inhibition.
Origin:Any EPN (Section 2.3) or any logical operator (Section 2.7).
Target:Any process node (Section 2.5).
Node:The target extremity of an inhibition carries a bar perpendicular to the arc.
Figure 2.50: The Process Diagram glyph for inhibition.
2.6.7 Glyph: Trigger
A trigger effect, or absolute stimulation, is a stimulation that is necessary for a process to takeplace. A process modulated by a trigger can only occur when this trigger is active.
SBO Term:SBO:0000171 ! necessary stimulation.
Origin:Any EPN (Section 2.3) or any logical operator (Section 2.7).
Target:Any process node (Section 2.5).
Node:The target extremity of a trigger carries an open arrow (to remind that it is a stimulation)coming after a larger vertical bar.
Nat
ure
Pre
cedi
ngs
: hdl
:101
01/n
pre.
2008
.232
0.1
: Pos
ted
22 S
ep 2
008
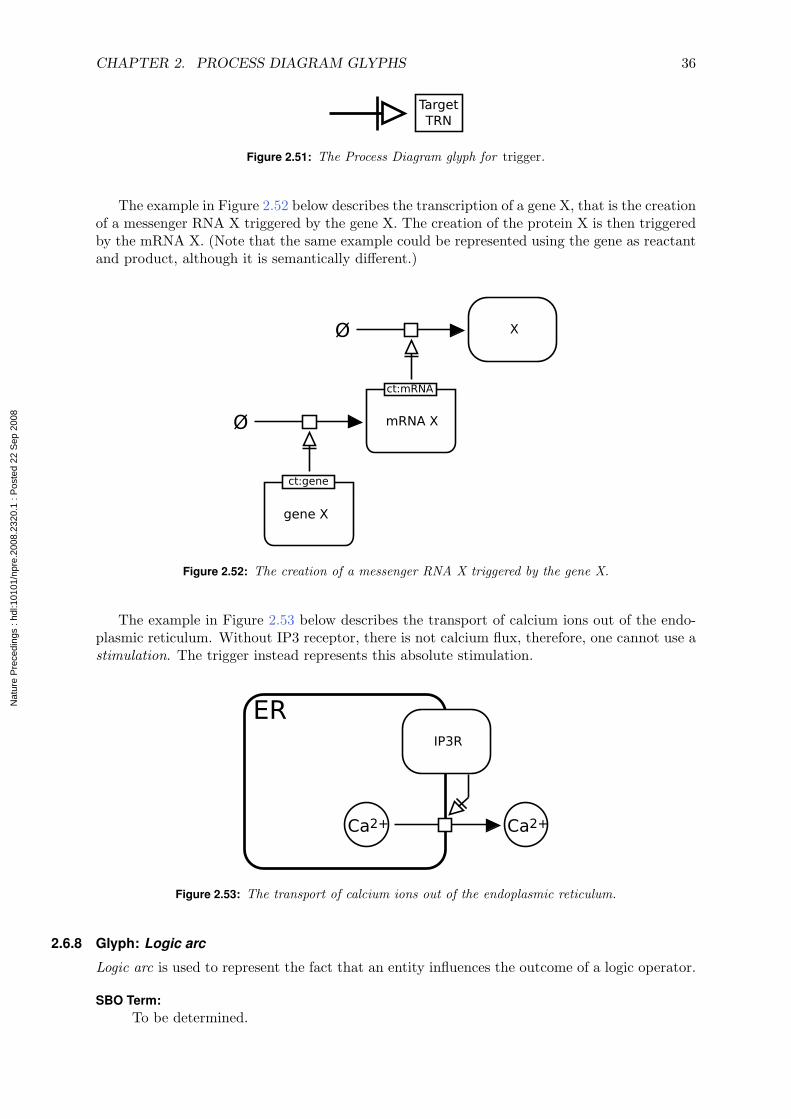
CHAPTER 2. PROCESS DIAGRAM GLYPHS 36
Figure 2.51: The Process Diagram glyph for trigger.
The example in Figure 2.52 below describes the transcription of a gene X, that is the creationof a messenger RNA X triggered by the gene X. The creation of the protein X is then triggeredby the mRNA X. (Note that the same example could be represented using the gene as reactantand product, although it is semantically different.)
Figure 2.52: The creation of a messenger RNA X triggered by the gene X.
The example in Figure 2.53 below describes the transport of calcium ions out of the endo-plasmic reticulum. Without IP3 receptor, there is not calcium flux, therefore, one cannot use astimulation. The trigger instead represents this absolute stimulation.
Figure 2.53: The transport of calcium ions out of the endoplasmic reticulum.
2.6.8 Glyph: Logic arc
Logic arc is used to represent the fact that an entity influences the outcome of a logic operator.
SBO Term:To be determined.
Nat
ure
Pre
cedi
ngs
: hdl
:101
01/n
pre.
2008
.232
0.1
: Pos
ted
22 S
ep 2
008

CHAPTER 2. PROCESS DIAGRAM GLYPHS 37
Origin:Any EPN (Section 2.3) or logical operator (Section 2.7).
Target:Any logical operator (Section 2.7).
End point:No particular symbol is used to represent a logic arc.
Figure 2.54: The Process Diagram glyph for logic arc.
2.6.9 Glyph: Equivalence arc
Equivalence Arc is the arc used to represent the fact that all entities marked by a tag areequivalent.
SBO Term:To be determined.
Origin:Any EPN (Section 2.3).
Target:Tag (Section 2.3.9).
End point:No particular symbol is used to represent an equivalence arc.
Figure 2.55: The Process Diagram glyph for Equivalence arc.
2.7 Logical operators2.7.1 Glyph: And
The glyph and is used to denote that all the EPNs linked as input are necessary to producethe output.
SBO Term:SBO:0000173 ! and.
Origin:More than one EPN (section 2.3) or logical operator (section 2.7).
Target:One modulation (section 2.6.3), stimulation (section 2.6.4), catalysis (section 2.6.5), inhi-bition (section 2.6.6) or trigger (section 2.6.7) arc.
Nat
ure
Pre
cedi
ngs
: hdl
:101
01/n
pre.
2008
.232
0.1
: Pos
ted
22 S
ep 2
008
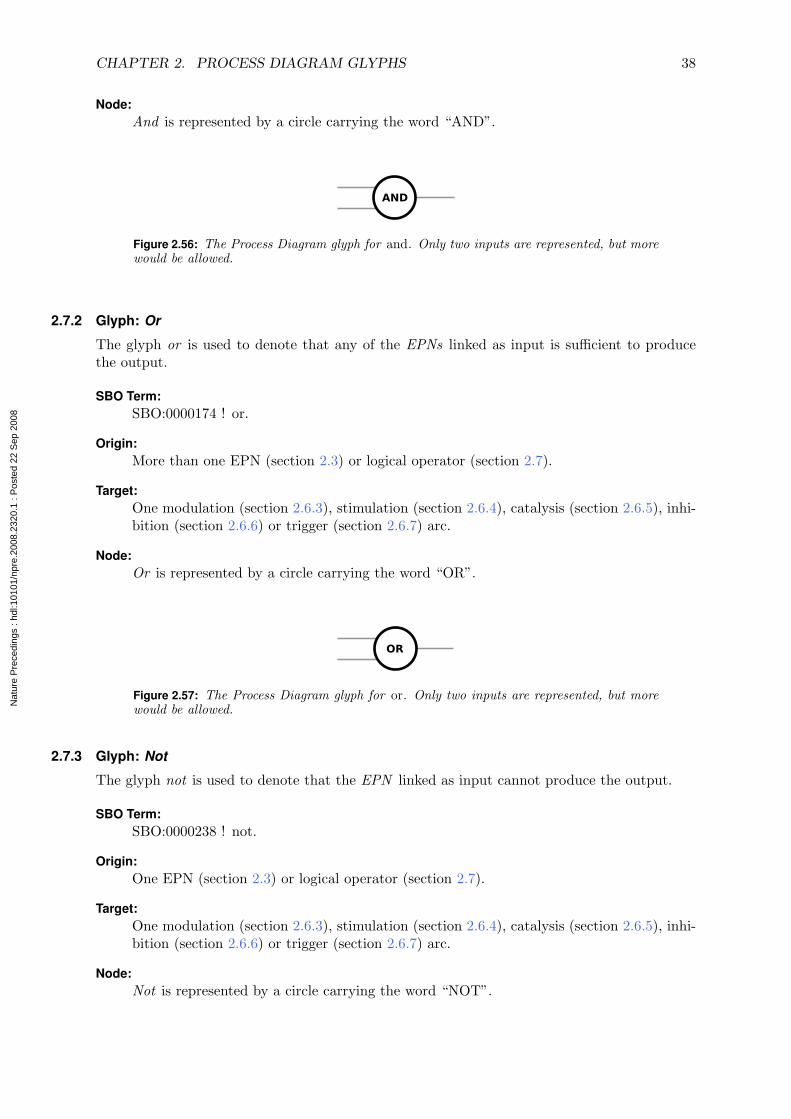
CHAPTER 2. PROCESS DIAGRAM GLYPHS 38
Node:And is represented by a circle carrying the word “AND”.
Figure 2.56: The Process Diagram glyph for and. Only two inputs are represented, but morewould be allowed.
2.7.2 Glyph: Or
The glyph or is used to denote that any of the EPNs linked as input is sufficient to producethe output.
SBO Term:SBO:0000174 ! or.
Origin:More than one EPN (section 2.3) or logical operator (section 2.7).
Target:One modulation (section 2.6.3), stimulation (section 2.6.4), catalysis (section 2.6.5), inhi-bition (section 2.6.6) or trigger (section 2.6.7) arc.
Node:Or is represented by a circle carrying the word “OR”.
Figure 2.57: The Process Diagram glyph for or. Only two inputs are represented, but morewould be allowed.
2.7.3 Glyph: Not
The glyph not is used to denote that the EPN linked as input cannot produce the output.
SBO Term:SBO:0000238 ! not.
Origin:One EPN (section 2.3) or logical operator (section 2.7).
Target:One modulation (section 2.6.3), stimulation (section 2.6.4), catalysis (section 2.6.5), inhi-bition (section 2.6.6) or trigger (section 2.6.7) arc.
Node:Not is represented by a circle carrying the word “NOT”.
Nat
ure
Pre
cedi
ngs
: hdl
:101
01/n
pre.
2008
.232
0.1
: Pos
ted
22 S
ep 2
008

CHAPTER 2. PROCESS DIAGRAM GLYPHS 39
Figure 2.58: The Process Diagram glyph for not.
Nat
ure
Pre
cedi
ngs
: hdl
:101
01/n
pre.
2008
.232
0.1
: Pos
ted
22 S
ep 2
008
Chapter 3
Process Diagram grammar
3.1 OverviewIn this chapter, we describe how the glyphs of SBGN can be combined to make a valid SBGNdiagram. To do this, we must at the very least define what glyphs can be connected to eachother. This is called syntax. Next, we must define rules over and above connection rules, suchas whether duplicate symbols are permitted. In addition, we must define what the notation“means” — how does it represent a biological pathway? This is semantics, and it is essential ifa reader is to understand a SBGN diagram without external help, and a writer is to create onethat reflects his understanding of a biological system.
In this section we start off by describing the concepts of the Process Diagram notation. Nexta detailed description of the syntax is provided followed by a description of the syntactic rulesof the notation.
3.2 ConceptsThe SBGN Process Diagram is more than a collection of symbols. It is a visual language thatuses specific abstractions to describe the biological processes that make up a quantitative model,a signalling pathway or a metabolic network. This abstraction is the semantics of SBGN, andto describe it requires more than a definition of the symbols and syntax of the language. Wefirst need to define the abstractions we are using.
The Process Diagram in SBGN describes biological processes involving biological entities.An Entity pool node (Section 2.3), such as a molecule, is converted into other EPNs via aprocess.
It may be convenient to think of a SBGN Process Diagram as describing the flow of a fluid.In this analogy, each EPN represents a tank of fluid, which may be emptied via a pipe (theconsumption arc, Section 2.6.1) that is connected to a valve (the process node, Section 2.5),which in turn is connected to other pipes (the production arcs, Section 2.6.2) that fill othertanks (EPNs). A valve can be controlled in relation to the amount of fluid in another tank.This precise nature of the relationship between valve opening and amount of fluid determinesthe nature of the modulation.
Finally, the system needs a source of fluid from one or more external sources (source, sectionSection 2.3.6) and somewhere for it to drain away (the sink).
3.3 The conceptual modelIn order to formalize the conceptual representation described above and the semantic rules thatwe will describe later, we have developed a UML Domain Object Model of SBGN. This defineswhat would otherwise be vaguely defined in the SBGN specification, and enables us to defineclearly what is a valid SBGN diagram.
40
Nat
ure
Pre
cedi
ngs
: hdl
:101
01/n
pre.
2008
.232
0.1
: Pos
ted
22 S
ep 2
008

CHAPTER 3. PROCESS DIAGRAM GRAMMAR 41
The model is separated into two layers. The Visual Layer (Figure 3.1 on the next page)directly maps to the glyphs used to visualise SBGN and reflects the syntax of the notation. TheConceptual Layer describes what is “meant” by the visual SBGN representation (Figure 3.2 onpage 43). It is important in defining concepts such as Entity types and state variables that areimplicit in the Visual Layer.
Nat
ure
Pre
cedi
ngs
: hdl
:101
01/n
pre.
2008
.232
0.1
: Pos
ted
22 S
ep 2
008
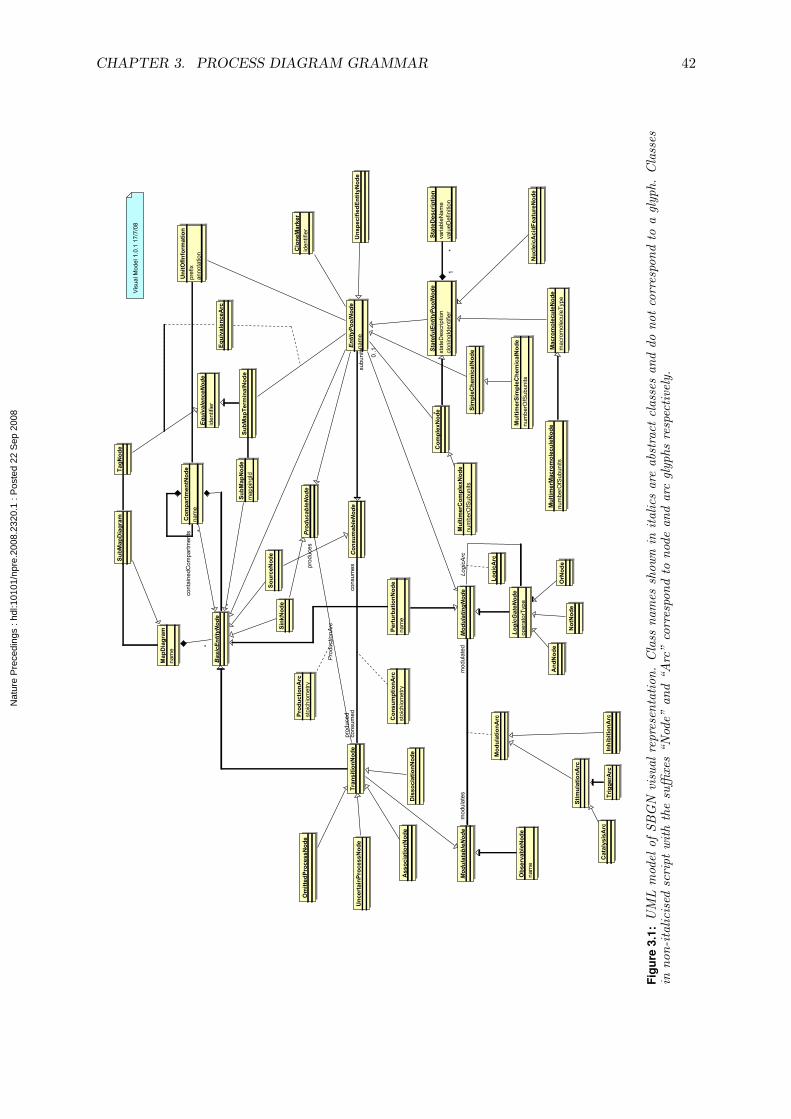
CHAPTER 3. PROCESS DIAGRAM GRAMMAR 42
Figu
re3.
1:U
ML
mod
elof
SBG
Nvi
sual
repr
esen
tati
on.
Cla
ssna
mes
show
nin
ital
ics
are
abst
ract
clas
ses
and
dono
tco
rres
pond
toa
glyp
h.C
lass
esin
non-
ital
icis
edsc
ript
wit
hth
esu
ffixe
s“N
ode”
and
“Arc
”co
rres
pond
tono
dean
dar
cgl
yphs
resp
ecti
vely
.
Nat
ure
Pre
cedi
ngs
: hdl
:101
01/n
pre.
2008
.232
0.1
: Pos
ted
22 S
ep 2
008

CHAPTER 3. PROCESS DIAGRAM GRAMMAR 43
Figu
re3.
2:U
ML
mod
elof
SBG
Nco
ncep
tual
repr
esen
tati
on.
The
mai
ndi
ffer
ence
betw
een
visu
alan
dco
ncep
tual
repr
esen
taio
nsis
that
the
conc
eptu
alm
odel
isno
n-re
dund
ant
wit
hon
lyon
ein
stan
ceof
anE
ntit
yPoo
lw
ith
agi
ven
iden
tity
.E
ach
clas
sha
sa
map
ping
back
toth
eV
isua
lLa
yer.
Nat
ure
Pre
cedi
ngs
: hdl
:101
01/n
pre.
2008
.232
0.1
: Pos
ted
22 S
ep 2
008

CHAPTER 3. PROCESS DIAGRAM GRAMMAR 44
The Classes shown in the UML model are described in more detail in the tables below. Inparticular the tables define the properties that uniquely identify each component of the notation.This is important in defining the rules for duplication and the submap interface later.
Nat
ure
Pre
cedi
ngs
: hdl
:101
01/n
pre.
2008
.232
0.1
: Pos
ted
22 S
ep 2
008
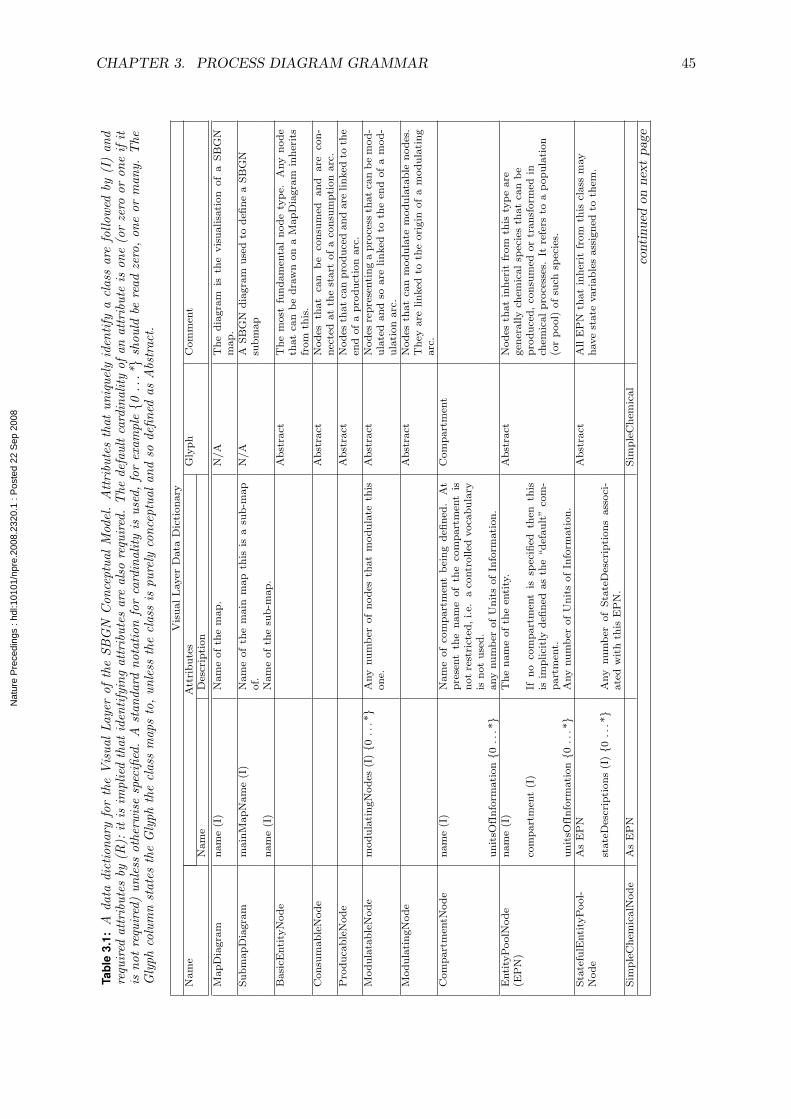
CHAPTER 3. PROCESS DIAGRAM GRAMMAR 45
Tabl
e3.
1:A
data
dict
iona
ryfo
rth
eV
isua
lLa
yer
ofth
eSB
GN
Con
cept
ual
Mod
el.
Att
ribu
tes
that
uniq
uely
iden
tify
acl
ass
are
follo
wed
by(I
)an
dre
quir
edat
trib
utes
by(R
):it
isim
plie
dth
atid
enti
fyin
gat
trib
utes
are
also
requ
ired
.T
hede
faul
tca
rdin
alit
yof
anat
trib
ute
ison
e(o
rze
roor
one
ifit
isno
tre
quir
ed)
unle
ssot
herw
ise
spec
ified
.A
stan
dard
nota
tion
for
card
inal
ity
isus
ed,
for
exam
ple{0
...*}
shou
ldbe
read
zero
,on
eor
man
y.T
heG
lyph
colu
mn
stat
esth
eG
lyph
the
clas
sm
aps
to,
unle
ssth
ecl
ass
ispu
rely
conc
eptu
alan
dso
defin
edas
Abs
trac
t.
Vis
ual
Layer
Data
Dic
tion
ary
Nam
eA
ttri
bu
tes
Gly
ph
Com
men
tN
am
eD
escr
ipti
on
Map
Dia
gra
mn
am
e(I
)N
am
eof
the
map
.N
/A
Th
ed
iagra
mis
the
vis
ualisa
tion
of
aS
BG
Nm
ap
.S
ub
map
Dia
gra
mm
ain
Map
Nam
e(I
)N
am
eof
the
main
map
this
isa
sub
-map
of.
N/A
AS
BG
Nd
iagra
mu
sed
tod
efin
ea
SB
GN
sub
map
nam
e(I
)N
am
eof
the
sub
-map
.B
asi
cEnti
tyN
od
eA
bst
ract
Th
em
ost
fun
dam
enta
ln
od
ety
pe.
Any
nod
eth
at
can
be
dra
wn
on
aM
ap
Dia
gra
min
her
its
from
this
.C
on
sum
ab
leN
od
eA
bst
ract
Nodes
that
can
be
con
sum
edan
dare
con
-n
ecte
dat
the
start
of
aco
nsu
mp
tion
arc
.P
rod
uca
ble
Nod
eA
bst
ract
Nodes
that
can
pro
du
ced
an
dare
lin
ked
toth
een
dof
ap
rod
uct
ion
arc
.M
od
ula
tab
leN
od
em
od
ula
tin
gN
od
es(I
){0
...*}
Any
nu
mb
erof
nod
esth
at
mod
ula
teth
ison
e.A
bst
ract
Nodes
rep
rese
nti
ng
ap
roce
ssth
at
can
be
mod
-u
late
dan
dso
are
lin
ked
toth
een
dof
am
od
-u
lati
on
arc
.M
od
ula
tin
gN
od
eA
bst
ract
Nodes
that
can
mod
ula
tem
od
ula
tab
len
od
es.
Th
eyare
lin
ked
toth
eori
gin
of
am
od
ula
tin
garc
.C
om
part
men
tNod
en
am
e(I
)N
am
eof
com
part
men
tb
ein
gd
efin
ed.
At
pre
sent
the
nam
eof
the
com
part
men
tis
not
rest
rict
ed,
i.e.
aco
ntr
olled
voca
bu
lary
isn
ot
use
d.
Com
part
men
t
un
itsO
fIn
form
ati
on{0
...*}
any
nu
mb
erof
Un
its
of
Info
rmati
on
.E
nti
tyP
oolN
od
e(E
PN
)n
am
e(I
)T
he
nam
eof
the
enti
ty.
Ab
stra
ctN
odes
that
inh
erit
from
this
typ
eare
gen
erally
chem
ical
spec
ies
that
can
be
pro
du
ced
,co
nsu
med
or
tran
sform
edin
chem
ical
pro
cess
es.
Itre
fers
toa
pop
ula
tion
(or
pool)
of
such
spec
ies.
com
part
men
t(I
)If
no
com
part
men
tis
spec
ified
then
this
isim
plici
tly
defi
ned
as
the
“d
efau
lt”
com
-p
art
men
t.u
nit
sOfI
nfo
rmati
on{0
...*}
Any
nu
mb
erof
Un
its
of
Info
rmati
on
.S
tate
fulE
nti
tyP
ool-
Nod
eA
sE
PN
Ab
stra
ctA
llE
PN
that
inh
erit
from
this
class
may
have
state
vari
ab
les
ass
ign
edto
them
.st
ate
Des
crip
tion
s(I
){0
...*}
Any
nu
mb
erof
Sta
teD
escr
ipti
on
sass
oci
-ate
dw
ith
this
EP
N.
Sim
ple
Ch
emic
alN
od
eA
sE
PN
Sim
ple
Ch
emic
al
conti
nued
on
nex
tpage
Nat
ure
Pre
cedi
ngs
: hdl
:101
01/n
pre.
2008
.232
0.1
: Pos
ted
22 S
ep 2
008
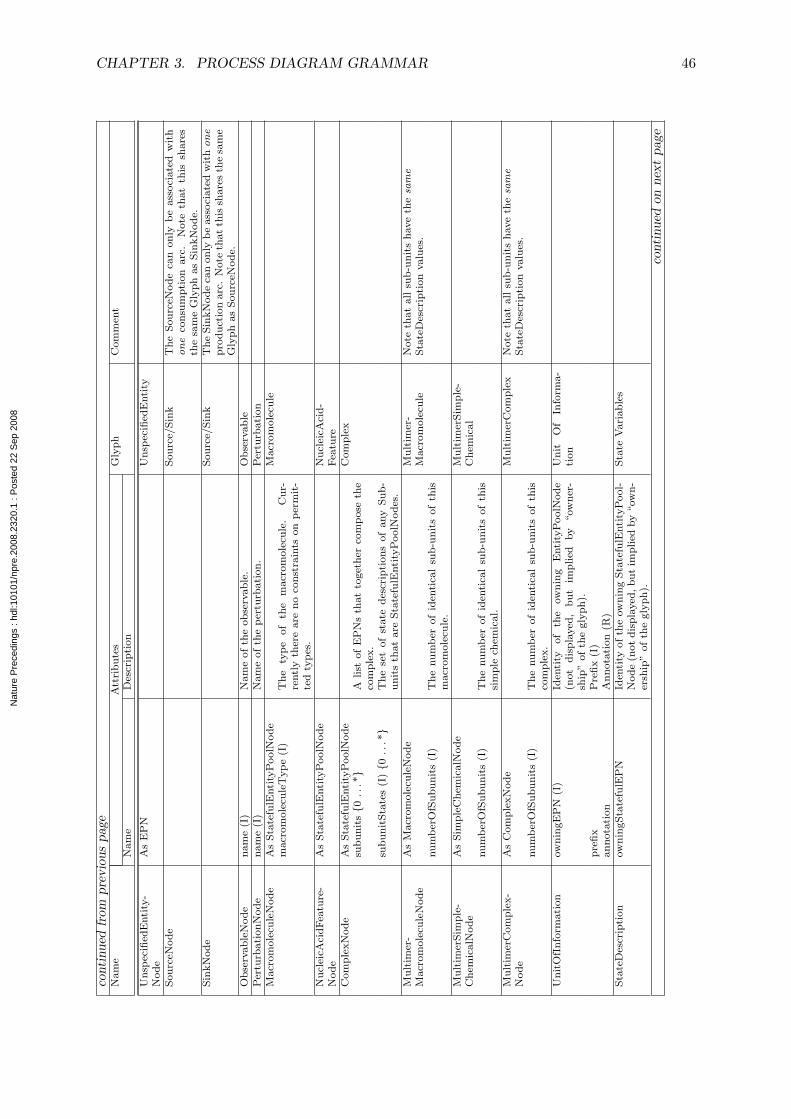
CHAPTER 3. PROCESS DIAGRAM GRAMMAR 46
conti
nued
from
pre
vio
us
pag
eN
am
eA
ttri
bu
tes
Gly
ph
Com
men
tN
am
eD
escr
ipti
on
Un
spec
ified
Enti
ty-
Nod
eA
sE
PN
Un
spec
ified
Enti
ty
Sou
rceN
od
eS
ou
rce/
Sin
kT
he
Sou
rceN
ode
can
on
lyb
eass
oci
ate
dw
ith
one
con
sum
pti
on
arc
.N
ote
that
this
share
sth
esa
me
Gly
ph
as
Sin
kN
od
e.S
inkN
od
eS
ou
rce/
Sin
kT
he
Sin
kN
od
eca
non
lyb
eass
oci
ate
dw
ith
one
pro
du
ctio
narc
.N
ote
that
this
share
sth
esa
me
Gly
ph
as
Sou
rceN
od
e.O
bse
rvab
leN
ode
nam
e(I
)N
am
eof
the
ob
serv
ab
le.
Ob
serv
ab
leP
ertu
rbati
on
Nod
en
am
e(I
)N
am
eof
the
per
turb
ati
on
.P
ertu
rbati
on
Macr
om
ole
cule
Nod
eA
sS
tate
fulE
nti
tyP
oolN
od
eM
acr
om
ole
cule
macr
om
ole
cule
Typ
e(I
)T
he
typ
eof
the
macr
om
ole
cule
.C
ur-
rentl
yth
ere
are
no
con
stra
ints
on
per
mit
-te
dty
pes
.N
ucl
eicA
cid
Fea
ture
-N
od
eA
sS
tate
fulE
nti
tyP
oolN
od
eN
ucl
eicA
cid
-F
eatu
reC
om
ple
xN
od
eA
sS
tate
fulE
nti
tyP
oolN
od
eC
om
ple
xsu
bu
nit
s{0
...*}
Alist
of
EP
Ns
that
toget
her
com
pose
the
com
ple
x.
sub
un
itS
tate
s(I
){0
...*}
Th
ese
tof
state
des
crip
tion
sof
any
Su
b-
un
its
that
are
Sta
tefu
lEnti
tyP
oolN
od
es.
Mu
ltim
er-
Macr
om
ole
cule
Nod
eA
sM
acr
om
ole
cule
Nod
eM
ult
imer
-M
acr
om
ole
cule
Note
that
all
sub-u
nit
sh
ave
the
sam
eS
tate
Des
crip
tion
valu
es.
nu
mb
erO
fSu
bu
nit
s(I
)T
he
nu
mb
erof
iden
tica
lsu
b-u
nit
sof
this
macr
om
ole
cule
.M
ult
imer
Sim
ple
-C
hem
icalN
od
eA
sS
imp
leC
hem
icalN
od
eM
ult
imer
Sim
ple
-C
hem
ical
nu
mb
erO
fSu
bu
nit
s(I
)T
he
nu
mb
erof
iden
tica
lsu
b-u
nit
sof
this
sim
ple
chem
ical.
Mu
ltim
erC
om
ple
x-
Nod
eA
sC
om
ple
xN
od
eM
ult
imer
Com
ple
xN
ote
that
all
sub-u
nit
sh
ave
the
sam
eS
tate
Des
crip
tion
valu
es.
nu
mb
erO
fSu
bu
nit
s(I
)T
he
nu
mb
erof
iden
tica
lsu
b-u
nit
sof
this
com
ple
x.
Un
itO
fIn
form
ati
on
ow
nin
gE
PN
(I)
Iden
tity
of
the
ow
nin
gE
nti
tyP
oolN
od
e(n
ot
dis
pla
yed
,b
ut
imp
lied
by
“ow
ner
-sh
ip”
of
the
gly
ph
).
Un
itO
fIn
form
a-
tion
pre
fix
Pre
fix
(I)
an
nota
tion
An
nota
tion
(R)
Sta
teD
escr
ipti
on
ow
nin
gS
tate
fulE
PN
Iden
tity
of
the
ow
nin
gS
tate
fulE
nti
tyP
ool-
Node
(not
dis
pla
yed
,b
ut
imp
lied
by
“ow
n-
ersh
ip”
of
the
gly
ph
).
Sta
teV
ari
ab
les
conti
nued
on
nex
tpage
Nat
ure
Pre
cedi
ngs
: hdl
:101
01/n
pre.
2008
.232
0.1
: Pos
ted
22 S
ep 2
008
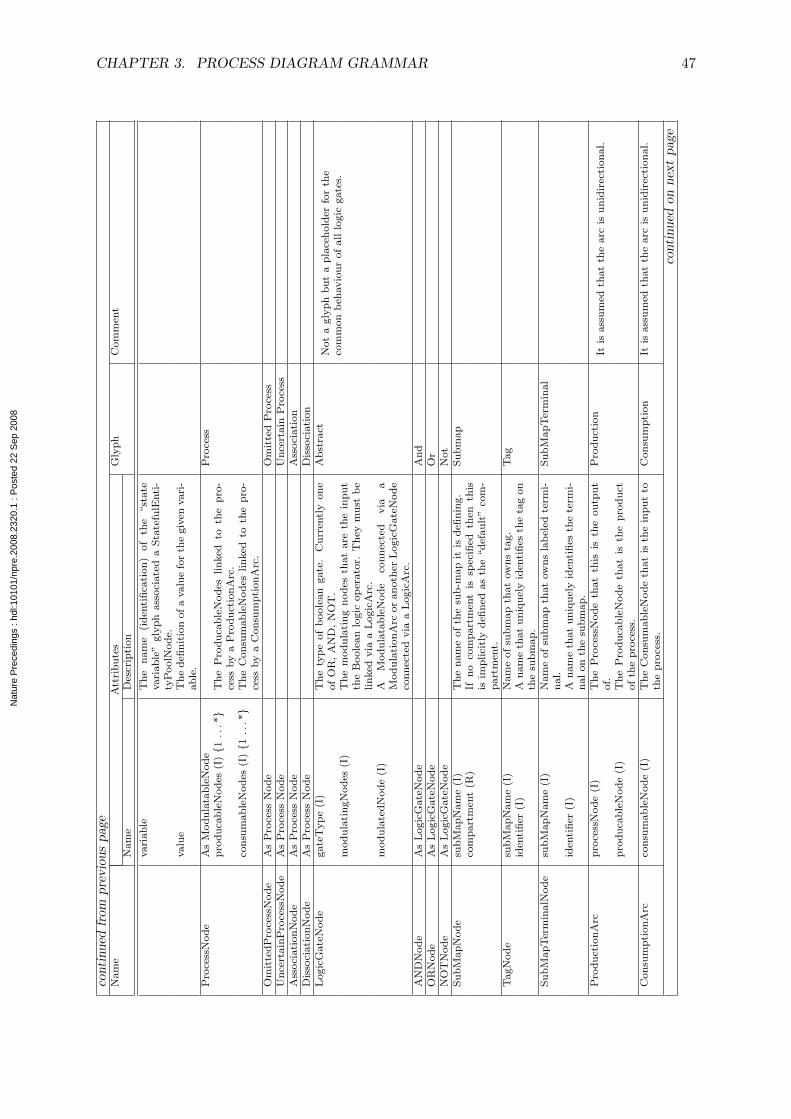
CHAPTER 3. PROCESS DIAGRAM GRAMMAR 47
conti
nued
from
pre
vio
us
pag
eN
am
eA
ttri
bu
tes
Gly
ph
Com
men
tN
am
eD
escr
ipti
on
vari
ab
leT
he
nam
e(i
den
tifi
cati
on
)of
the
“st
ate
vari
ab
le”
gly
ph
ass
oci
ate
da
Sta
tefu
lEnti
-ty
PoolN
od
e.valu
eT
he
defi
nit
ion
of
avalu
efo
rth
egiv
envari
-ab
le.
Pro
cess
Nod
eA
sM
od
ula
tab
leN
od
eP
roce
ssp
rod
uca
ble
Nod
es(I
){1
...*}
Th
eP
rod
uca
ble
Nod
eslin
ked
toth
ep
ro-
cess
by
aP
rod
uct
ion
Arc
.co
nsu
mab
leN
od
es(I
){1
...*}
Th
eC
on
sum
ab
leN
od
eslin
ked
toth
ep
ro-
cess
by
aC
on
sum
pti
on
Arc
.O
mit
ted
Pro
cess
Nod
eA
sP
roce
ssN
od
eO
mit
ted
Pro
cess
Un
cert
ain
Pro
cess
Nod
eA
sP
roce
ssN
od
eU
nce
rtain
Pro
cess
Ass
oci
ati
on
Nod
eA
sP
roce
ssN
od
eA
ssoci
ati
on
Dis
soci
ati
on
Nod
eA
sP
roce
ssN
od
eD
isso
ciati
on
Logic
Gate
Node
gate
Typ
e(I
)T
he
typ
eof
boole
an
gate
.C
urr
entl
yon
eof
OR
,A
ND
,N
OT
.A
bst
ract
Not
agly
ph
bu
ta
pla
ceh
old
erfo
rth
eco
mm
on
beh
avio
ur
of
all
logic
gate
s.m
od
ula
tin
gN
od
es(I
)T
he
mod
ula
tin
gn
od
esth
at
are
the
inp
ut
the
Boole
an
logic
op
erato
r.T
hey
mu
stb
elin
ked
via
aL
ogic
Arc
.m
od
ula
ted
Nod
e(I
)A
Mod
ula
tab
leN
od
eco
nn
ecte
dvia
aM
od
ula
tion
Arc
or
an
oth
erL
ogic
Gate
Nod
eco
nn
ecte
dvia
aL
ogic
Arc
.A
ND
Nod
eA
sL
ogic
Gate
Nod
eA
nd
OR
Nod
eA
sL
ogic
Gate
Nod
eO
rN
OT
Nod
eA
sL
ogic
Gate
Nod
eN
ot
Su
bM
ap
Nod
esu
bM
ap
Nam
e(I
)T
he
nam
eof
the
sub
-map
itis
defi
nin
g.
Su
bm
ap
com
part
men
t(R
)If
no
com
part
men
tis
spec
ified
then
this
isim
plici
tly
defi
ned
as
the
“d
efau
lt”
com
-p
art
men
t.T
agN
od
esu
bM
ap
Nam
e(I
)N
am
eof
sub
map
that
ow
ns
tag.
Tag
iden
tifi
er(I
)A
nam
eth
at
un
iqu
ely
iden
tifi
esth
eta
gon
the
sub
map
.S
ub
Map
Ter
min
alN
od
esu
bM
ap
Nam
e(I
)N
am
eof
sub
map
that
ow
ns
lab
eled
term
i-n
al.
Su
bM
ap
Ter
min
al
iden
tifi
er(I
)A
nam
eth
at
un
iqu
ely
iden
tifi
esth
ete
rmi-
nal
on
the
sub
map
.P
rod
uct
ion
Arc
pro
cess
Nod
e(I
)T
he
Pro
cess
Nod
eth
at
this
isth
eou
tpu
tof.
Pro
du
ctio
nIt
isass
um
edth
at
the
arc
isu
nid
irec
tion
al.
pro
du
cab
leN
od
e(I
)T
he
Pro
du
cab
leN
od
eth
at
isth
ep
rod
uct
of
the
pro
cess
.C
on
sum
pti
on
Arc
con
sum
ab
leN
od
e(I
)T
he
Con
sum
ab
leN
od
eth
at
isth
ein
pu
tto
the
pro
cess
.C
on
sum
pti
on
Itis
ass
um
edth
at
the
arc
isu
nid
irec
tion
al.
conti
nued
on
nex
tpage
Nat
ure
Pre
cedi
ngs
: hdl
:101
01/n
pre.
2008
.232
0.1
: Pos
ted
22 S
ep 2
008
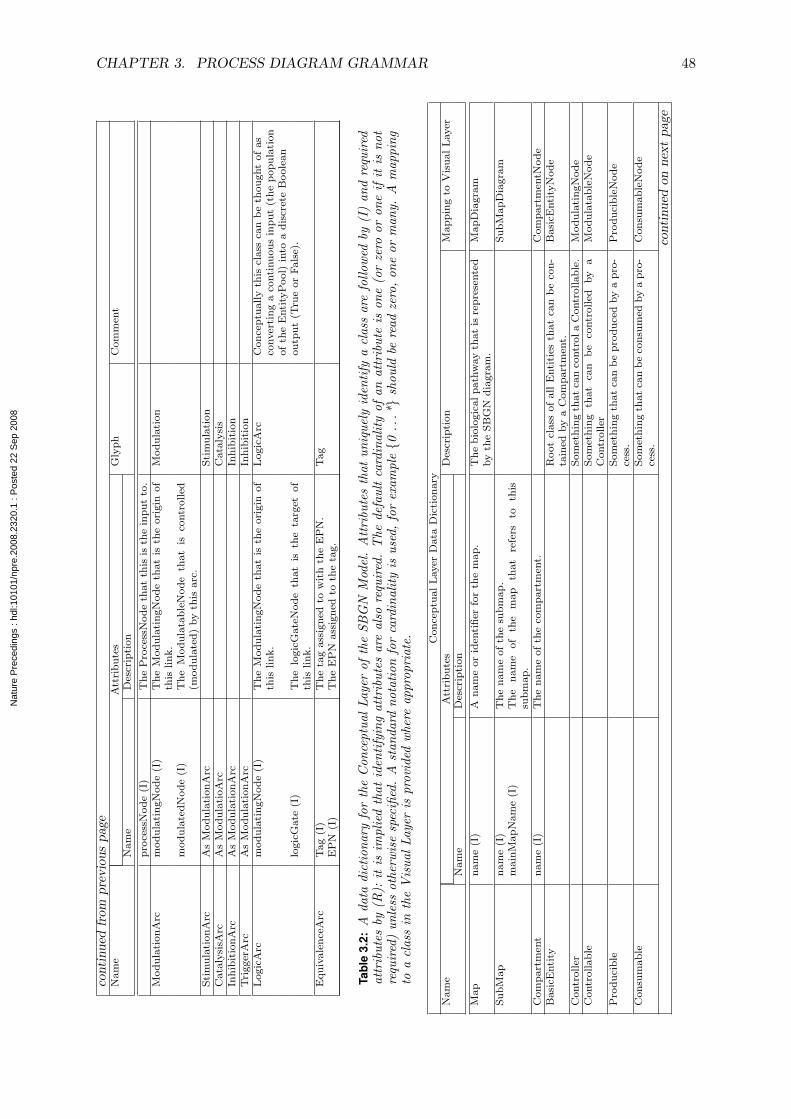
CHAPTER 3. PROCESS DIAGRAM GRAMMAR 48
conti
nued
from
pre
vio
us
pag
eN
am
eA
ttri
bu
tes
Gly
ph
Com
men
tN
am
eD
escr
ipti
on
pro
cess
Nod
e(I
)T
he
Pro
cess
Node
that
this
isth
ein
pu
tto
.M
od
ula
tion
Arc
mod
ula
tin
gN
od
e(I
)T
he
Mod
ula
tin
gN
od
eth
at
isth
eori
gin
of
this
lin
k.
Mod
ula
tion
mod
ula
ted
Nod
e(I
)T
he
Mod
ula
tab
leN
od
eth
at
isco
ntr
olled
(mod
ula
ted
)by
this
arc
.S
tim
ula
tion
Arc
As
Mod
ula
tion
Arc
Sti
mu
lati
on
Cata
lysi
sArc
As
Mod
ula
tioA
rcC
ata
lysi
sIn
hib
itio
nA
rcA
sM
od
ula
tion
Arc
Inh
ibit
ion
Tri
gger
Arc
As
Mod
ula
tion
Arc
Inh
ibit
ion
Logic
Arc
mod
ula
tin
gN
od
e(I
)T
he
Mod
ula
tin
gN
od
eth
at
isth
eori
gin
of
this
lin
k.
Logic
Arc
Con
cep
tually
this
class
can
be
thou
ght
of
as
conver
tin
ga
conti
nu
ou
sin
pu
t(t
he
pop
ula
tion
of
the
Enti
tyP
ool)
into
ad
iscr
ete
Boole
an
ou
tpu
t(T
rue
or
Fals
e).
logic
Gate
(I)
Th
elo
gic
Gate
Nod
eth
at
isth
eta
rget
of
this
lin
k.
Equ
ivale
nce
Arc
Tag
(I)
Th
eta
gass
ign
edto
wit
hth
eE
PN
.T
ag
EP
N(I
)T
he
EP
Nass
ign
edto
the
tag.
Tabl
e3.
2:A
data
dict
iona
ryfo
rth
eC
once
ptua
lLa
yer
ofth
eSB
GN
Mod
el.
Att
ribu
tes
that
uniq
uely
iden
tify
acl
ass
are
follo
wed
by(I
)an
dre
quir
edat
trib
utes
by(R
):it
isim
plie
dth
atid
enti
fyin
gat
trib
utes
are
also
requ
ired
.T
hede
faul
tca
rdin
alit
yof
anat
trib
ute
ison
e(o
rze
roor
one
ifit
isno
tre
quir
ed)
unle
ssot
herw
ise
spec
ified
.A
stan
dard
nota
tion
for
card
inal
ity
isus
ed,
for
exam
ple{0
...*}
shou
ldbe
read
zero
,on
eor
man
y.A
map
ping
toa
clas
sin
the
Vis
ual
Laye
ris
prov
ided
whe
reap
prop
riat
e. Con
cep
tual
Layer
Data
Dic
tion
ary
Nam
eA
ttri
bu
tes
Des
crip
tion
Map
pin
gto
Vis
ual
Layer
Nam
eD
escr
ipti
on
Map
nam
e(I
)A
nam
eor
iden
tifi
erfo
rth
em
ap
.T
he
bio
logic
al
path
way
that
isre
pre
sente
dby
the
SB
GN
dia
gra
m.
Map
Dia
gra
m
Su
bM
ap
nam
e(I
)T
he
nam
eof
the
sub
map
.S
ub
Map
Dia
gra
mm
ain
Map
Nam
e(I
)T
he
nam
eof
the
map
that
refe
rsto
this
sub
map
.C
om
part
men
tn
am
e(I
)T
he
nam
eof
the
com
part
men
t.C
om
part
men
tNod
eB
asi
cEnti
tyR
oot
class
of
all
Enti
ties
that
can
be
con-
tain
edby
aC
om
part
men
t.B
asi
cEnti
tyN
od
e
Contr
oller
Som
eth
ing
that
can
contr
ola
Contr
ollab
le.
Mod
ula
tin
gN
od
eC
ontr
ollab
leS
om
eth
ing
that
can
be
contr
olled
by
aC
ontr
oller
Mod
ula
tab
leN
od
e
Pro
du
cib
leS
om
eth
ing
that
can
be
pro
du
ced
by
ap
ro-
cess
.P
rod
uci
ble
Nod
e
Con
sum
ab
leS
om
eth
ing
that
can
be
con
sum
edby
ap
ro-
cess
.C
on
sum
ab
leN
od
e
conti
nued
on
nex
tpage
Nat
ure
Pre
cedi
ngs
: hdl
:101
01/n
pre.
2008
.232
0.1
: Pos
ted
22 S
ep 2
008

CHAPTER 3. PROCESS DIAGRAM GRAMMAR 49
conti
nued
from
pre
vio
us
pag
eN
am
eA
ttri
bu
tes
Des
crip
tion
Vis
ual
Map
pin
gN
am
eD
escr
ipti
on
Enti
tyT
yp
eN
am
e(I
)T
he
nam
eof
the
Enti
tyT
yp
e.T
his
isth
ety
pe
of
the
Enti
tyP
ool.
No
dir
ect
map
sto
the
vis
ual
layer
.It
isan
imp
lied
att
rib
ute
of
the
Enti
tyP
oolN
od
e.
typ
e(I
)T
yp
eof
the
Enti
ty.
On
eof:
Sim
ple
Ch
emic
al,
Un
spec
ied
Enti
ty,
Com
ple
x,
Macr
om
ole
cule
,an
dN
ucl
eicA
cid
Fea
ture
.an
nota
tion
s{0
...*}
An
nota
tion
mu
stb
eass
oci
ate
dw
ith
the
typ
ean
db
egen
eral
toall
Enti
tyP
ool
Nod
e.If
itw
ere
ass
oci
ate
dw
ith
the
Sp
ecie
sth
enth
isw
ou
ldb
esy
nonym
ou
sw
ith
ast
ate
des
crip
tion
.M
ult
imer
icE
nti
tyT
yp
eA
sE
nti
tyT
yp
eA
nE
nti
tyth
at
can
form
hom
o-m
ult
imer
icco
mp
lexes
.A
llco
pie
ssh
are
the
sam
eat-
trib
ute
s.ca
rdin
ality
(I)
Th
enu
mb
erof
sub
un
its
inth
em
on
om
er.
Sta
tefu
lEnti
tyT
yp
eA
sE
nti
tyT
yp
eA
nE
nti
tyT
yp
eth
at
can
have
state
vari
-ab
les
ass
oci
ate
dw
ith
it.
state
Vari
ab
les{
0..
.*}
Com
ple
xE
nti
tyT
yp
eA
sS
tate
fulE
nti
tyT
yp
eIm
plici
tly
defi
ned
by
aC
om
ple
xN
od
e.ca
rdin
ality
(I)
from
Mu
ltim
eric
Enti
tyT
yp
e.su
bu
nit
s{
0..
.*}
Th
ese
tof
Enti
tyT
yp
esth
at
the
com
ple
xco
m-
pose
dof.
Macr
om
ole
cule
Enti
ty-
Typ
em
acr
om
ole
cule
Typ
e(I
)T
he
typ
eof
the
macr
om
ole
cule
.T
he
per
mit
-te
dty
pe
nam
esare
not
con
stra
ined
as
yet
.S
ugges
tty
pes
are
pro
tein
,m
RN
A,
miR
NA
,tR
NA
,rR
NA
,D
NA
,p
oly
sacc
ari
de.
See
als
oco
ntr
olled
voca
bu
lari
esfo
rm
ate
rial
typ
e2.2
.1an
dco
nce
ptu
al
typ
e2.2
.2
Imp
lici
tly
defi
ned
by
aM
acr
om
ole
cule
Nod
ean
dM
ult
imer
Macr
om
ole
cule
-N
od
e
Sta
teV
ari
ab
len
am
e(I
)T
he
nam
eof
the
state
vari
ab
le.
Th
est
ate
vari
ab
leis
ass
ign
edto
aS
tate
fulE
nti
tyT
yp
ean
dca
nh
ave
on
eor
more
valu
esass
ign
edto
itw
hen
use
din
aS
tate
fulE
nti
tyP
ool.
Th
en
am
eof
aS
tate
Des
crip
tion
.
Sta
teV
alu
evalu
e(I
)T
he
valu
eof
the
state
.A
valu
eth
at
can
be
ass
ign
edto
ast
ate
vari
ab
le.
Th
evalu
est
rin
gor
“re
g-
exp
”use
din
the
Sta
te-
Des
crip
tion
.E
nti
tyP
ool
enti
tyT
yp
e(I
)T
he
Enti
tyT
yp
eof
the
pool.
An
inst
anti
ati
on
of
an
Enti
tyT
yp
e.E
nti
tyP
oolN
od
eS
tate
fulE
nti
tyP
ool
As
Enti
tyP
ool
Sta
tefu
lEnti
tyP
oolN
od
est
ate
Valu
eSet
s{1
...*
}A
set
of
state
valu
esass
ign
edto
ath
eS
tate
-V
ari
ab
les
of
the
ass
oci
ate
dS
tate
fulE
nti
ty-
Typ
e.C
om
ple
xE
nti
tyP
ool
As
Sta
tefu
lEnti
tyT
he
inst
anti
ati
on
of
aco
mp
lex
that
isd
efin
edby
it’s
ow
nst
ate
an
dth
est
ate
sof
its
sub
un
its.
Com
ple
xN
od
esu
bu
nit
Valu
es(I
){0
...*
}T
he
set
of
Sta
teV
alu
esfo
rall
sub
un
its.
conti
nued
on
nex
tpage
Nat
ure
Pre
cedi
ngs
: hdl
:101
01/n
pre.
2008
.232
0.1
: Pos
ted
22 S
ep 2
008
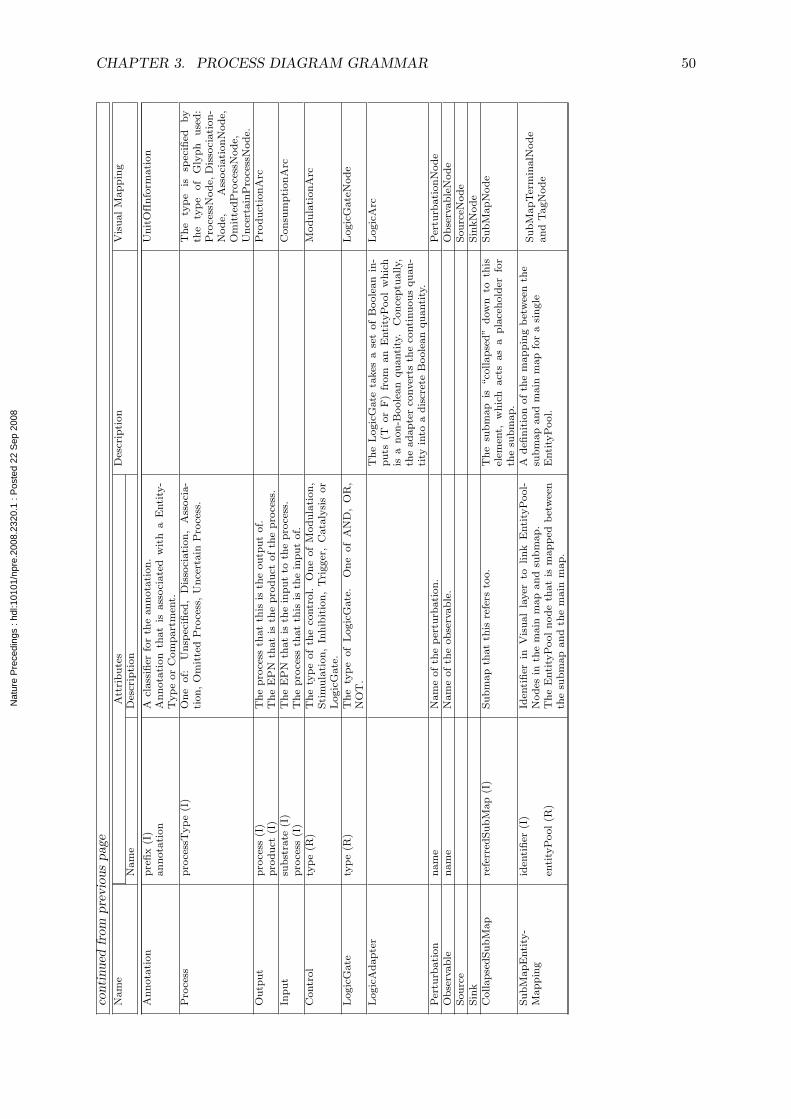
CHAPTER 3. PROCESS DIAGRAM GRAMMAR 50
conti
nued
from
pre
vio
us
pag
eN
am
eA
ttri
bu
tes
Des
crip
tion
Vis
ual
Map
pin
gN
am
eD
escr
ipti
on
An
nota
tion
pre
fix
(I)
Acl
ass
ifier
for
the
an
nota
tion.
Un
itO
fIn
form
ati
on
an
nota
tion
An
nota
tion
that
isass
oci
ate
dw
ith
aE
nti
ty-
Typ
eor
Com
part
men
t.P
roce
ssp
roce
ssT
yp
e(I
)O
ne
of:
Un
spec
ified
,D
isso
ciati
on
,A
ssoci
a-
tion
,O
mit
ted
Pro
cess
,U
nce
rtain
Pro
cess
.T
he
typ
eis
spec
ified
by
the
typ
eof
Gly
ph
use
d:
Pro
cess
Nod
e,D
isso
ciati
on
-N
od
e,A
ssoci
ati
on
Nod
e,O
mit
ted
Pro
cess
Nod
e,U
nce
rtain
Pro
cess
Nod
e.O
utp
ut
pro
cess
(I)
Th
ep
roce
ssth
at
this
isth
eou
tpu
tof.
Pro
du
ctio
nA
rcp
rod
uct
(I)
Th
eE
PN
that
isth
ep
rod
uct
of
the
pro
cess
.In
pu
tsu
bst
rate
(I)
Th
eE
PN
that
isth
ein
pu
tto
the
pro
cess
.C
on
sum
pti
on
Arc
pro
cess
(I)
Th
ep
roce
ssth
at
this
isth
ein
pu
tof.
Contr
ol
typ
e(R
)T
he
typ
eof
the
contr
ol.
On
eof
Mod
ula
tion
,S
tim
ula
tion
,In
hib
itio
n,
Tri
gger
,C
ata
lysi
sor
Logic
Gate
.
Mod
ula
tionA
rc
Logic
Gate
typ
e(R
)T
he
typ
eof
Logic
Gate
.O
ne
of
AN
D,
OR
,N
OT
.L
ogic
Gate
Nod
e
Logic
Ad
ap
ter
Th
eL
ogic
Gate
takes
ase
tof
Boole
an
in-
pu
ts(T
or
F)
from
an
Enti
tyP
ool
wh
ich
isa
non
-Boole
an
qu
anti
ty.
Con
cep
tually,
the
ad
ap
ter
conver
tsth
eco
nti
nu
ou
squ
an
-ti
tyin
toa
dis
cret
eB
oole
an
qu
anti
ty.
Logic
Arc
Per
turb
ati
on
nam
eN
am
eof
the
per
turb
ati
on
.P
ertu
rbati
on
Nod
eO
bse
rvab
len
am
eN
am
eof
the
ob
serv
ab
le.
Ob
serv
ab
leN
od
eS
ou
rce
Sou
rceN
ode
Sin
kS
inkN
od
eC
ollap
sed
Su
bM
ap
refe
rred
Su
bM
ap
(I)
Su
bm
ap
that
this
refe
rsto
o.
Th
esu
bm
ap
is“co
llap
sed
”d
ow
nto
this
elem
ent,
wh
ich
act
sas
ap
lace
hold
erfo
rth
esu
bm
ap
.
Su
bM
ap
Nod
e
Su
bM
ap
Enti
ty-
Map
pin
gid
enti
fier
(I)
Iden
tifi
erin
Vis
ual
layer
tolin
kE
nti
tyP
ool-
Nod
esin
the
main
map
an
dsu
bm
ap
.A
defi
nit
ion
of
the
map
pin
gb
etw
een
the
sub
map
an
dm
ain
map
for
asi
ngle
Enti
tyP
ool.
Su
bM
ap
Ter
min
alN
od
ean
dT
agN
od
een
tity
Pool
(R)
Th
eE
nti
tyP
ool
nod
eth
at
ism
ap
ped
bet
wee
nth
esu
bm
ap
an
dth
em
ain
map
.
Nat
ure
Pre
cedi
ngs
: hdl
:101
01/n
pre.
2008
.232
0.1
: Pos
ted
22 S
ep 2
008
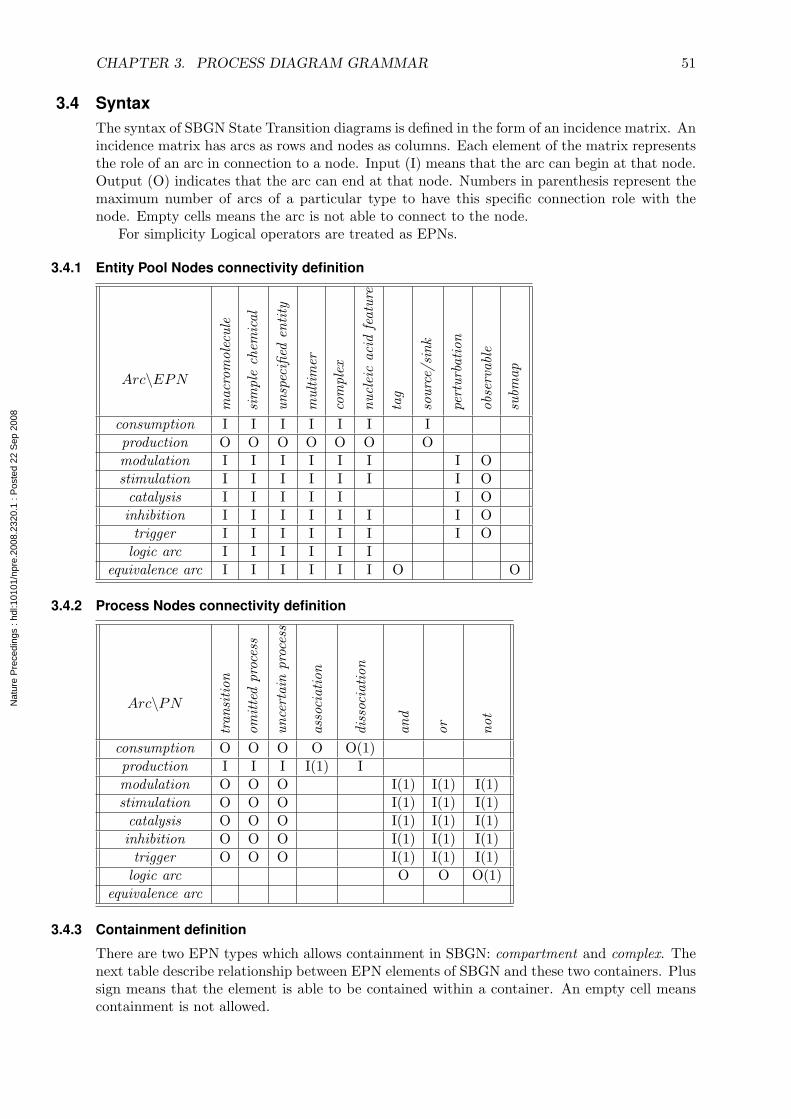
CHAPTER 3. PROCESS DIAGRAM GRAMMAR 51
3.4 SyntaxThe syntax of SBGN State Transition diagrams is defined in the form of an incidence matrix. Anincidence matrix has arcs as rows and nodes as columns. Each element of the matrix representsthe role of an arc in connection to a node. Input (I) means that the arc can begin at that node.Output (O) indicates that the arc can end at that node. Numbers in parenthesis represent themaximum number of arcs of a particular type to have this specific connection role with thenode. Empty cells means the arc is not able to connect to the node.
For simplicity Logical operators are treated as EPNs.
3.4.1 Entity Pool Nodes connectivity definition
Arc\EPN
mac
rom
olec
ule
sim
ple
chem
ical
unsp
ecifi
eden
tity
mul
tim
er
com
plex
nucl
eic
acid
feat
ure
tag
sour
ce/s
ink
pert
urba
tion
obse
rvab
le
subm
ap
consumption I I I I I I Iproduction O O O O O O Omodulation I I I I I I I Ostimulation I I I I I I I O
catalysis I I I I I I Oinhibition I I I I I I I O
trigger I I I I I I I Ologic arc I I I I I I
equivalence arc I I I I I I O O
3.4.2 Process Nodes connectivity definition
Arc\PN
tran
siti
on
omit
ted
proc
ess
unce
rtai
npr
oces
s
asso
ciat
ion
diss
ocia
tion
and
or not
consumption O O O O O(1)production I I I I(1) Imodulation O O O I(1) I(1) I(1)stimulation O O O I(1) I(1) I(1)
catalysis O O O I(1) I(1) I(1)inhibition O O O I(1) I(1) I(1)
trigger O O O I(1) I(1) I(1)logic arc O O O(1)
equivalence arc
3.4.3 Containment definition
There are two EPN types which allows containment in SBGN: compartment and complex. Thenext table describe relationship between EPN elements of SBGN and these two containers. Plussign means that the element is able to be contained within a container. An empty cell meanscontainment is not allowed.
Nat
ure
Pre
cedi
ngs
: hdl
:101
01/n
pre.
2008
.232
0.1
: Pos
ted
22 S
ep 2
008
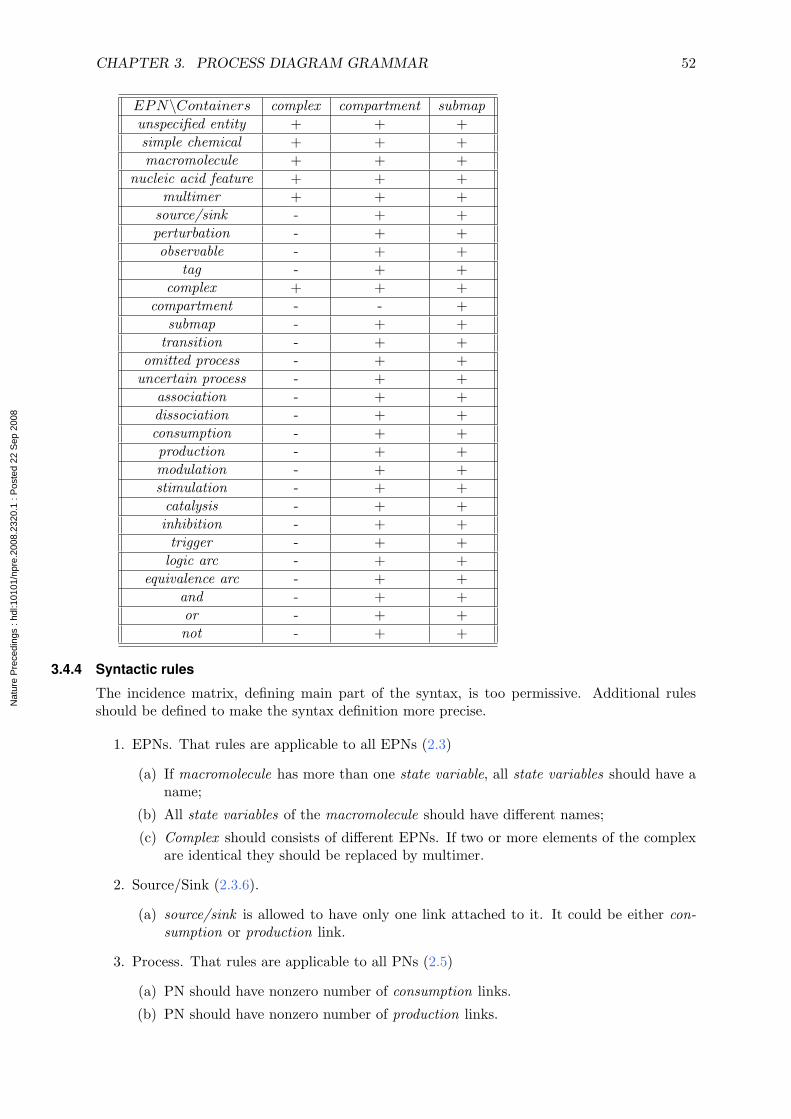
CHAPTER 3. PROCESS DIAGRAM GRAMMAR 52
EPN\Containers complex compartment submapunspecified entity + + +simple chemical + + +macromolecule + + +
nucleic acid feature + + +multimer + + +
source/sink - + +perturbation - + +observable - + +
tag - + +complex + + +
compartment - - +submap - + +
transition - + +omitted process - + +
uncertain process - + +association - + +dissociation - + +consumption - + +production - + +modulation - + +stimulation - + +
catalysis - + +inhibition - + +
trigger - + +logic arc - + +
equivalence arc - + +and - + +or - + +not - + +
3.4.4 Syntactic rules
The incidence matrix, defining main part of the syntax, is too permissive. Additional rulesshould be defined to make the syntax definition more precise.
1. EPNs. That rules are applicable to all EPNs (2.3)
(a) If macromolecule has more than one state variable, all state variables should have aname;
(b) All state variables of the macromolecule should have different names;
(c) Complex should consists of different EPNs. If two or more elements of the complexare identical they should be replaced by multimer.
2. Source/Sink (2.3.6).
(a) source/sink is allowed to have only one link attached to it. It could be either con-sumption or production link.
3. Process. That rules are applicable to all PNs (2.5)
(a) PN should have nonzero number of consumption links.
(b) PN should have nonzero number of production links.
Nat
ure
Pre
cedi
ngs
: hdl
:101
01/n
pre.
2008
.232
0.1
: Pos
ted
22 S
ep 2
008
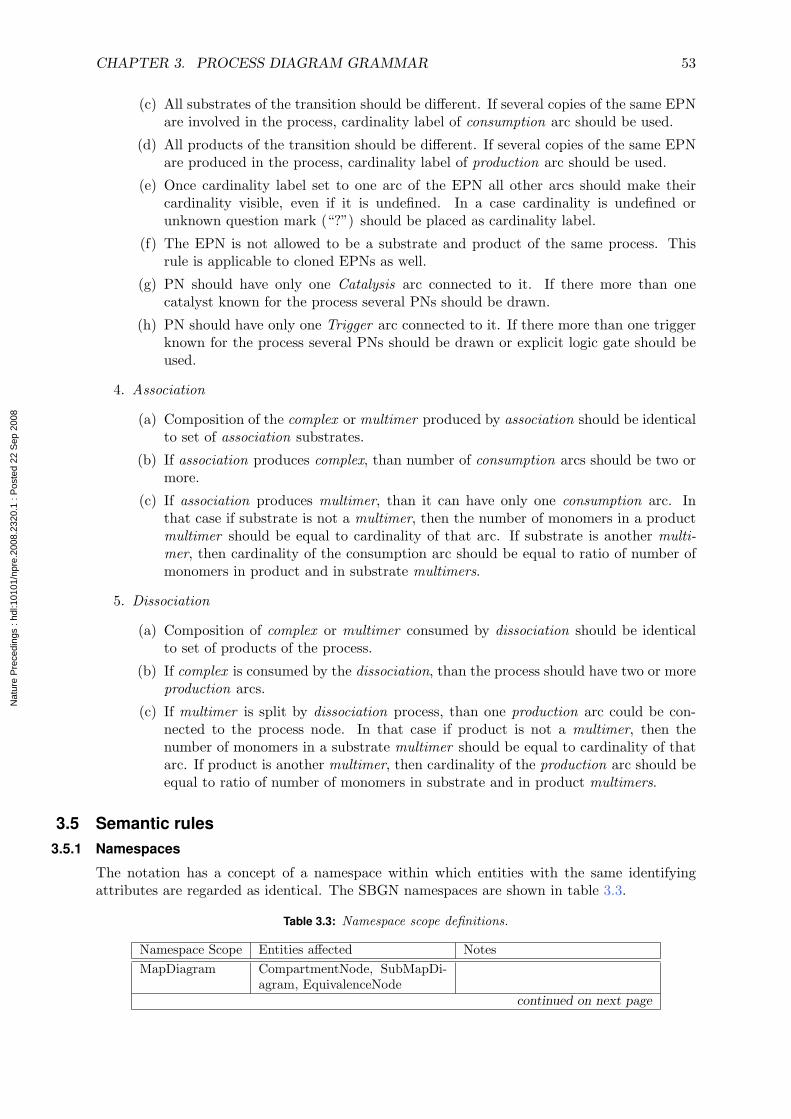
CHAPTER 3. PROCESS DIAGRAM GRAMMAR 53
(c) All substrates of the transition should be different. If several copies of the same EPNare involved in the process, cardinality label of consumption arc should be used.
(d) All products of the transition should be different. If several copies of the same EPNare produced in the process, cardinality label of production arc should be used.
(e) Once cardinality label set to one arc of the EPN all other arcs should make theircardinality visible, even if it is undefined. In a case cardinality is undefined orunknown question mark (“?”) should be placed as cardinality label.
(f) The EPN is not allowed to be a substrate and product of the same process. Thisrule is applicable to cloned EPNs as well.
(g) PN should have only one Catalysis arc connected to it. If there more than onecatalyst known for the process several PNs should be drawn.
(h) PN should have only one Trigger arc connected to it. If there more than one triggerknown for the process several PNs should be drawn or explicit logic gate should beused.
4. Association
(a) Composition of the complex or multimer produced by association should be identicalto set of association substrates.
(b) If association produces complex, than number of consumption arcs should be two ormore.
(c) If association produces multimer, than it can have only one consumption arc. Inthat case if substrate is not a multimer, then the number of monomers in a productmultimer should be equal to cardinality of that arc. If substrate is another multi-mer, then cardinality of the consumption arc should be equal to ratio of number ofmonomers in product and in substrate multimers.
5. Dissociation
(a) Composition of complex or multimer consumed by dissociation should be identicalto set of products of the process.
(b) If complex is consumed by the dissociation, than the process should have two or moreproduction arcs.
(c) If multimer is split by dissociation process, than one production arc could be con-nected to the process node. In that case if product is not a multimer, then thenumber of monomers in a substrate multimer should be equal to cardinality of thatarc. If product is another multimer, then cardinality of the production arc should beequal to ratio of number of monomers in substrate and in product multimers.
3.5 Semantic rules3.5.1 Namespaces
The notation has a concept of a namespace within which entities with the same identifyingattributes are regarded as identical. The SBGN namespaces are shown in table 3.3.
Table 3.3: Namespace scope definitions.
Namespace Scope Entities affected NotesMapDiagram CompartmentNode, SubMapDi-
agram, EquivalenceNodecontinued on next page
Nat
ure
Pre
cedi
ngs
: hdl
:101
01/n
pre.
2008
.232
0.1
: Pos
ted
22 S
ep 2
008
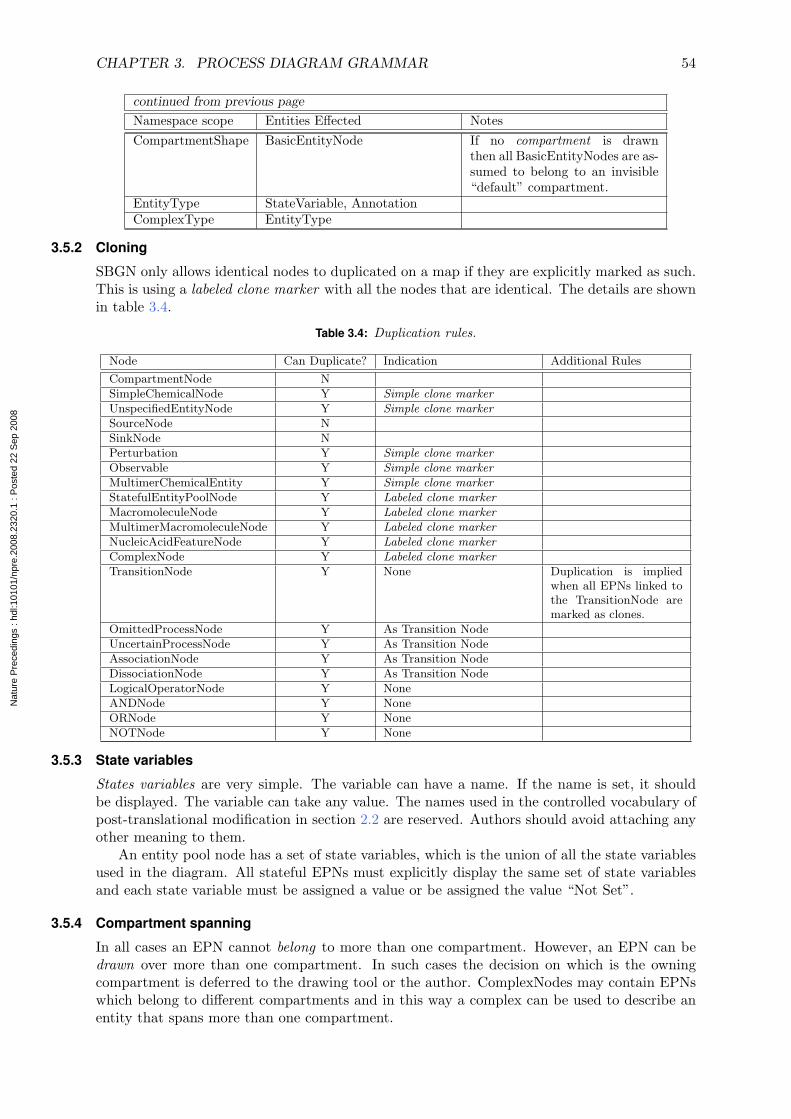
CHAPTER 3. PROCESS DIAGRAM GRAMMAR 54
continued from previous page
Namespace scope Entities Effected NotesCompartmentShape BasicEntityNode If no compartment is drawn
then all BasicEntityNodes are as-sumed to belong to an invisible“default” compartment.
EntityType StateVariable, AnnotationComplexType EntityType
3.5.2 Cloning
SBGN only allows identical nodes to duplicated on a map if they are explicitly marked as such.This is using a labeled clone marker with all the nodes that are identical. The details are shownin table 3.4.
Table 3.4: Duplication rules.
Node Can Duplicate? Indication Additional Rules
CompartmentNode NSimpleChemicalNode Y Simple clone markerUnspecifiedEntityNode Y Simple clone markerSourceNode NSinkNode NPerturbation Y Simple clone markerObservable Y Simple clone markerMultimerChemicalEntity Y Simple clone markerStatefulEntityPoolNode Y Labeled clone markerMacromoleculeNode Y Labeled clone markerMultimerMacromoleculeNode Y Labeled clone markerNucleicAcidFeatureNode Y Labeled clone markerComplexNode Y Labeled clone markerTransitionNode Y None Duplication is implied
when all EPNs linked tothe TransitionNode aremarked as clones.
OmittedProcessNode Y As Transition NodeUncertainProcessNode Y As Transition NodeAssociationNode Y As Transition NodeDissociationNode Y As Transition NodeLogicalOperatorNode Y NoneANDNode Y NoneORNode Y NoneNOTNode Y None
3.5.3 State variables
States variables are very simple. The variable can have a name. If the name is set, it shouldbe displayed. The variable can take any value. The names used in the controlled vocabulary ofpost-translational modification in section 2.2 are reserved. Authors should avoid attaching anyother meaning to them.
An entity pool node has a set of state variables, which is the union of all the state variablesused in the diagram. All stateful EPNs must explicitly display the same set of state variablesand each state variable must be assigned a value or be assigned the value “Not Set”.
3.5.4 Compartment spanning
In all cases an EPN cannot belong to more than one compartment. However, an EPN can bedrawn over more than one compartment. In such cases the decision on which is the owningcompartment is deferred to the drawing tool or the author. ComplexNodes may contain EPNswhich belong to different compartments and in this way a complex can be used to describe anentity that spans more than one compartment.
Nat
ure
Pre
cedi
ngs
: hdl
:101
01/n
pre.
2008
.232
0.1
: Pos
ted
22 S
ep 2
008
CHAPTER 3. PROCESS DIAGRAM GRAMMAR 55
This restriction makes it impossible to represent in a semantically correct way a macro-molecule that spans more then one compartment — for example a receptor protein. It isclearly desirable to be able to show a macromolecule in a manner that the biologist expects(i.e. spanning from the outside through the membrane to the inside). Therefore, the author isrecommended to draw the macromolecule across compartment boundaries, but the underlyingSBGN semantic model will assign it to only one. The assignment to a compartment may bedecided by the software drawing tool or the author. Note that this has implications for auto-layout algorithms as they will only be able to treat such entity nodes as contained within acompartment and will have no way of knowing a macromolecule spans a compartment.
The current solution is consistent with other Systems Biology representations such as SBMLand BioPAX. For more information about the problems representing membrane spanning pro-teins and the rationale behind the current solution see Section C.
3.5.5 Compartments
The layout of compartments in an SBGN diagram does not imply anything about the topologyof compartments in the cell. Compartments should be bounded and may overlap. However,adjacency and the nesting of compartments does not imply that these compartments are nextto each other physically or hat one compartment contains the other.
3.5.6 Modulation
It is implied, but not defined explicitly that a process has a rate at which it converts its inputEPNs to its output EPNs. This concept is important in understanding how SBGN describesprocess modulation.
1. A process with no modulations has an underlying “basal rate” which describes the rateat which it converts inputs to outputs.
2. Modulation changes the basal rate in an unspecified fashion.
3. Stimulation is a modulation that’s effect is to increase the basal rate.
4. Inhibition is a modulation that’s effect is to decrease the basal rate.
5. The above types of modulation, when assigned to the same process are combined and havea multiplicative effect on the basal rate of the process.
6. Modulators that do not interact with each other in the above manner should be drawn asmodulating different process nodes. Their effect is therefore additive.
7. At most one trigger can be assigned to a process. Two triggers would imply an implicitBoolean AND or OR operator. For clarity only one trigger can be assigned to a processand such combinations must be explicitly expressed as the Boolean operators.
8. At most one catalysis can be assigned to a process. A catalysis modulation implies thatthe exact biochemical mechanism underlying the process is known. In this context twocatalysis reactions cannot be assigned to the same process as they are independent reac-tions. Other EPNs that modulate the catalysis can be assigned to the same process asmodulators, stimulators, and inhibitors and will have a multiplicative modulation on thereaction rate defined by the catalysis.
3.5.7 Submaps
Submaps are a visual device that allow a map to be split into several views. They remain,however, part of the main map and share its namespace. As a test of validity it should bepossible to reintroduced a submap into the main map by eliminating the SubMapNode andmerging the equivalent EntityPoolNodes in both maps.
Nat
ure
Pre
cedi
ngs
: hdl
:101
01/n
pre.
2008
.232
0.1
: Pos
ted
22 S
ep 2
008
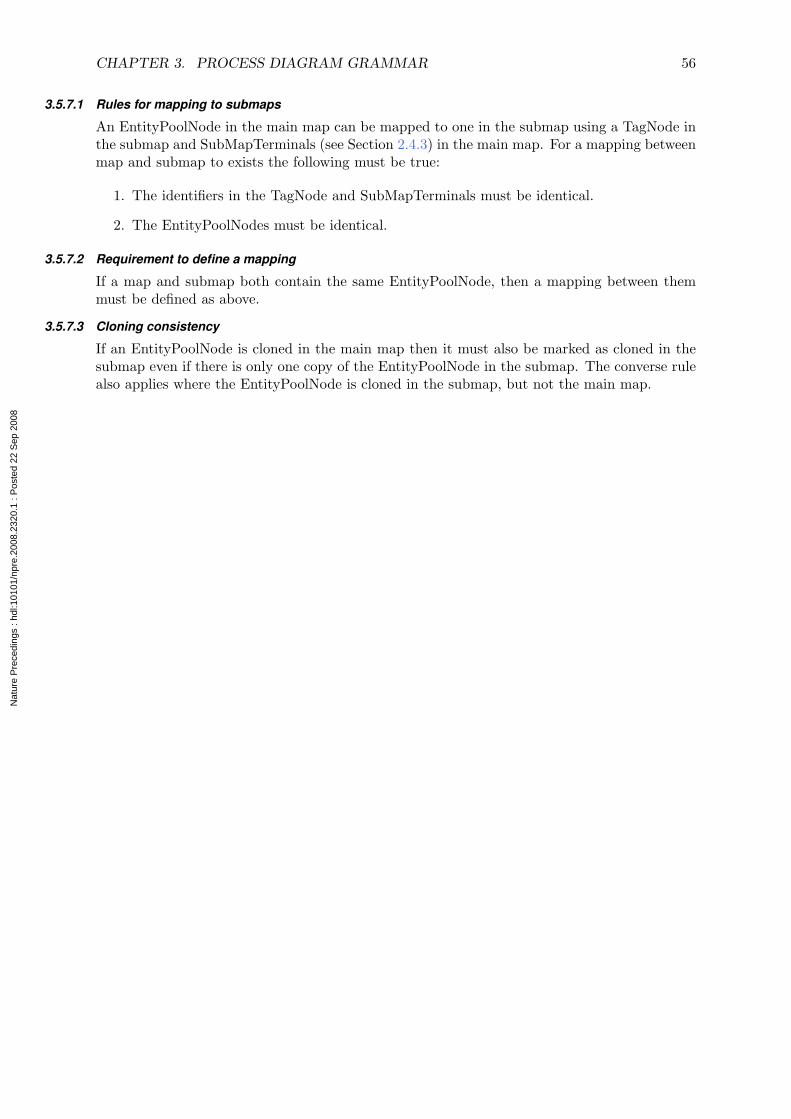
CHAPTER 3. PROCESS DIAGRAM GRAMMAR 56
3.5.7.1 Rules for mapping to submaps
An EntityPoolNode in the main map can be mapped to one in the submap using a TagNode inthe submap and SubMapTerminals (see Section 2.4.3) in the main map. For a mapping betweenmap and submap to exists the following must be true:
1. The identifiers in the TagNode and SubMapTerminals must be identical.
2. The EntityPoolNodes must be identical.
3.5.7.2 Requirement to define a mapping
If a map and submap both contain the same EntityPoolNode, then a mapping between themmust be defined as above.
3.5.7.3 Cloning consistency
If an EntityPoolNode is cloned in the main map then it must also be marked as cloned in thesubmap even if there is only one copy of the EntityPoolNode in the submap. The converse rulealso applies where the EntityPoolNode is cloned in the submap, but not the main map.
Nat
ure
Pre
cedi
ngs
: hdl
:101
01/n
pre.
2008
.232
0.1
: Pos
ted
22 S
ep 2
008

Chapter 4
Layout Guidelines for a Process Diagram
4.1 IntroductionThe previous chapters describe the appearance and meaning of SBGN Process Diagram Level 1components. Objects are EPNs, transition nodes, container nodes, logical operators as well asconnecting arcs. The components of a Process Diagram have to be placed in a meaningful way– a random distribution with spaghetti-like connections will most likely hide the informationencoded in the underlying model, whereas an elegant placement of the objects, giving a congenialappearance of the diagrams, may reveal new insights. The arrangement of components in adiagram is called a layout.
SBGN Process Diagrams should be easily recognisable not only by the glyphs used, but alsoby the general style of the layout. However, the arrangement of the components is a complexart in itself, and there is no simple rule which can be applied to all cases. Therefore this sectionprovides guidelines for the layout of process diagrams, divided into two categories:
1. requirements, i. e. rules which must be fulfilled by a layout, and
2. recommendations, i. e. rules which should be followed if possible.
In addition, we provide a list of additional suggestions which may help in producing aestheticallymore pleasant layouts, possibly easier to understand.
Those layout guidelines are independent of the method used to produce the diagram, andapply to both manually drawn diagrams as well as diagrams produced by an automatic layoutalgorithm. The guidelines do not deal with interactive aspects (e. g. the effect of zooming).Further information about automatic network layout (graph drawing) can be found, for example,in the books of Di Battista and co-authors [13] and Kaufmann and Wagner [14].
Please note that the color of objects do not carry any meaning in SBGN. Although one canuse colors to emphasize part of a diagram or encode additional information, the meaning of thediagram should not depend on the colors. Furthermore, objects can have different sizes andsize is also meaningless in SBGN. For example, a transition node may be larger than a proteinnode. Also the meaning of a graph should be conserved upon scaling as far as possible.
57
Nat
ure
Pre
cedi
ngs
: hdl
:101
01/n
pre.
2008
.232
0.1
: Pos
ted
22 S
ep 2
008
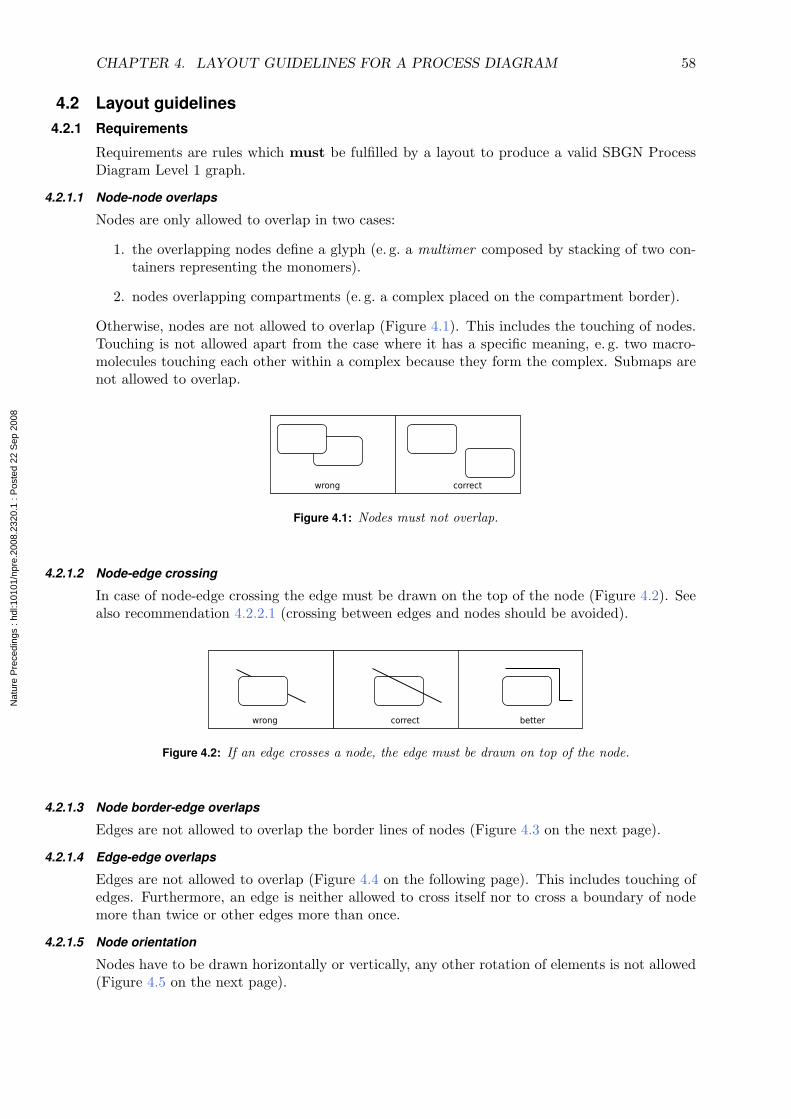
CHAPTER 4. LAYOUT GUIDELINES FOR A PROCESS DIAGRAM 58
4.2 Layout guidelines4.2.1 Requirements
Requirements are rules which must be fulfilled by a layout to produce a valid SBGN ProcessDiagram Level 1 graph.
4.2.1.1 Node-node overlaps
Nodes are only allowed to overlap in two cases:
1. the overlapping nodes define a glyph (e. g. a multimer composed by stacking of two con-tainers representing the monomers).
2. nodes overlapping compartments (e. g. a complex placed on the compartment border).
Otherwise, nodes are not allowed to overlap (Figure 4.1). This includes the touching of nodes.Touching is not allowed apart from the case where it has a specific meaning, e. g. two macro-molecules touching each other within a complex because they form the complex. Submaps arenot allowed to overlap.
Figure 4.1: Nodes must not overlap.
4.2.1.2 Node-edge crossing
In case of node-edge crossing the edge must be drawn on the top of the node (Figure 4.2). Seealso recommendation 4.2.2.1 (crossing between edges and nodes should be avoided).
Figure 4.2: If an edge crosses a node, the edge must be drawn on top of the node.
4.2.1.3 Node border-edge overlaps
Edges are not allowed to overlap the border lines of nodes (Figure 4.3 on the next page).
4.2.1.4 Edge-edge overlaps
Edges are not allowed to overlap (Figure 4.4 on the following page). This includes touching ofedges. Furthermore, an edge is neither allowed to cross itself nor to cross a boundary of nodemore than twice or other edges more than once.
4.2.1.5 Node orientation
Nodes have to be drawn horizontally or vertically, any other rotation of elements is not allowed(Figure 4.5 on the next page).
Nat
ure
Pre
cedi
ngs
: hdl
:101
01/n
pre.
2008
.232
0.1
: Pos
ted
22 S
ep 2
008
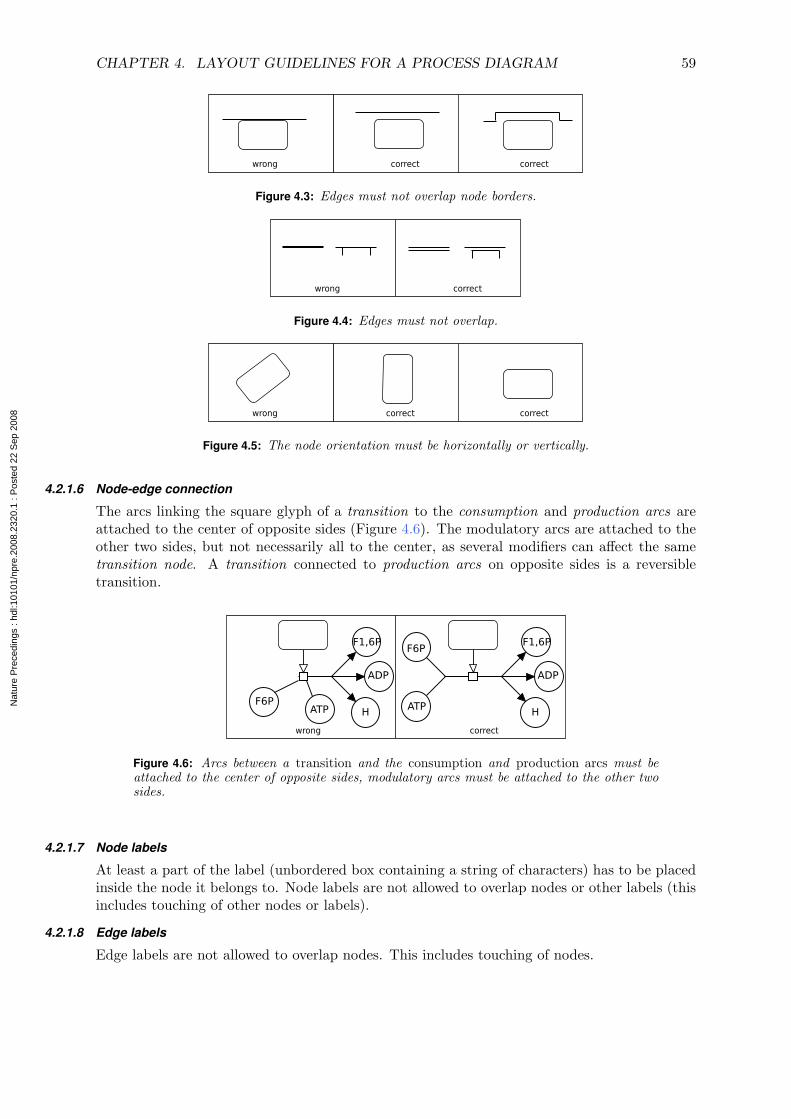
CHAPTER 4. LAYOUT GUIDELINES FOR A PROCESS DIAGRAM 59
Figure 4.3: Edges must not overlap node borders.
Figure 4.4: Edges must not overlap.
Figure 4.5: The node orientation must be horizontally or vertically.
4.2.1.6 Node-edge connection
The arcs linking the square glyph of a transition to the consumption and production arcs areattached to the center of opposite sides (Figure 4.6). The modulatory arcs are attached to theother two sides, but not necessarily all to the center, as several modifiers can affect the sametransition node. A transition connected to production arcs on opposite sides is a reversibletransition.
Figure 4.6: Arcs between a transition and the consumption and production arcs must beattached to the center of opposite sides, modulatory arcs must be attached to the other twosides.
4.2.1.7 Node labels
At least a part of the label (unbordered box containing a string of characters) has to be placedinside the node it belongs to. Node labels are not allowed to overlap nodes or other labels (thisincludes touching of other nodes or labels).
4.2.1.8 Edge labels
Edge labels are not allowed to overlap nodes. This includes touching of nodes.
Nat
ure
Pre
cedi
ngs
: hdl
:101
01/n
pre.
2008
.232
0.1
: Pos
ted
22 S
ep 2
008
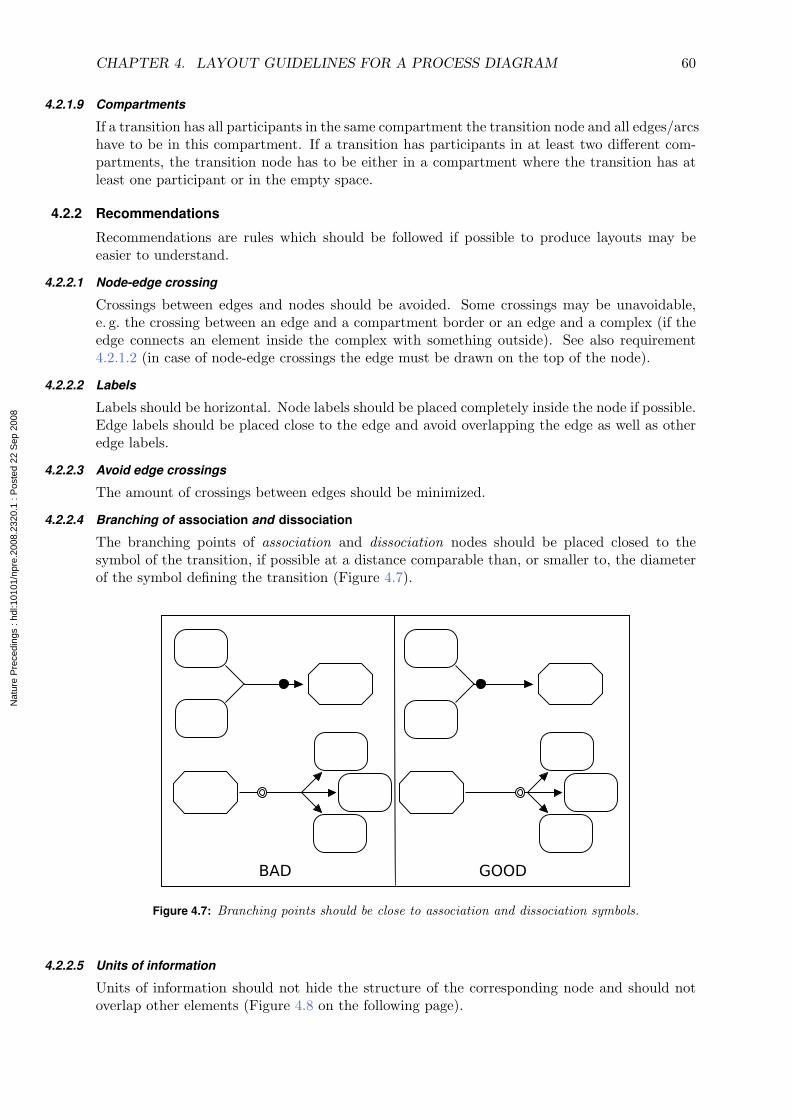
CHAPTER 4. LAYOUT GUIDELINES FOR A PROCESS DIAGRAM 60
4.2.1.9 Compartments
If a transition has all participants in the same compartment the transition node and all edges/arcshave to be in this compartment. If a transition has participants in at least two different com-partments, the transition node has to be either in a compartment where the transition has atleast one participant or in the empty space.
4.2.2 Recommendations
Recommendations are rules which should be followed if possible to produce layouts may beeasier to understand.
4.2.2.1 Node-edge crossing
Crossings between edges and nodes should be avoided. Some crossings may be unavoidable,e. g. the crossing between an edge and a compartment border or an edge and a complex (if theedge connects an element inside the complex with something outside). See also requirement4.2.1.2 (in case of node-edge crossings the edge must be drawn on the top of the node).
4.2.2.2 Labels
Labels should be horizontal. Node labels should be placed completely inside the node if possible.Edge labels should be placed close to the edge and avoid overlapping the edge as well as otheredge labels.
4.2.2.3 Avoid edge crossings
The amount of crossings between edges should be minimized.
4.2.2.4 Branching of association and dissociation
The branching points of association and dissociation nodes should be placed closed to thesymbol of the transition, if possible at a distance comparable than, or smaller to, the diameterof the symbol defining the transition (Figure 4.7).
Figure 4.7: Branching points should be close to association and dissociation symbols.
4.2.2.5 Units of information
Units of information should not hide the structure of the corresponding node and should notoverlap other elements (Figure 4.8 on the following page).
Nat
ure
Pre
cedi
ngs
: hdl
:101
01/n
pre.
2008
.232
0.1
: Pos
ted
22 S
ep 2
008
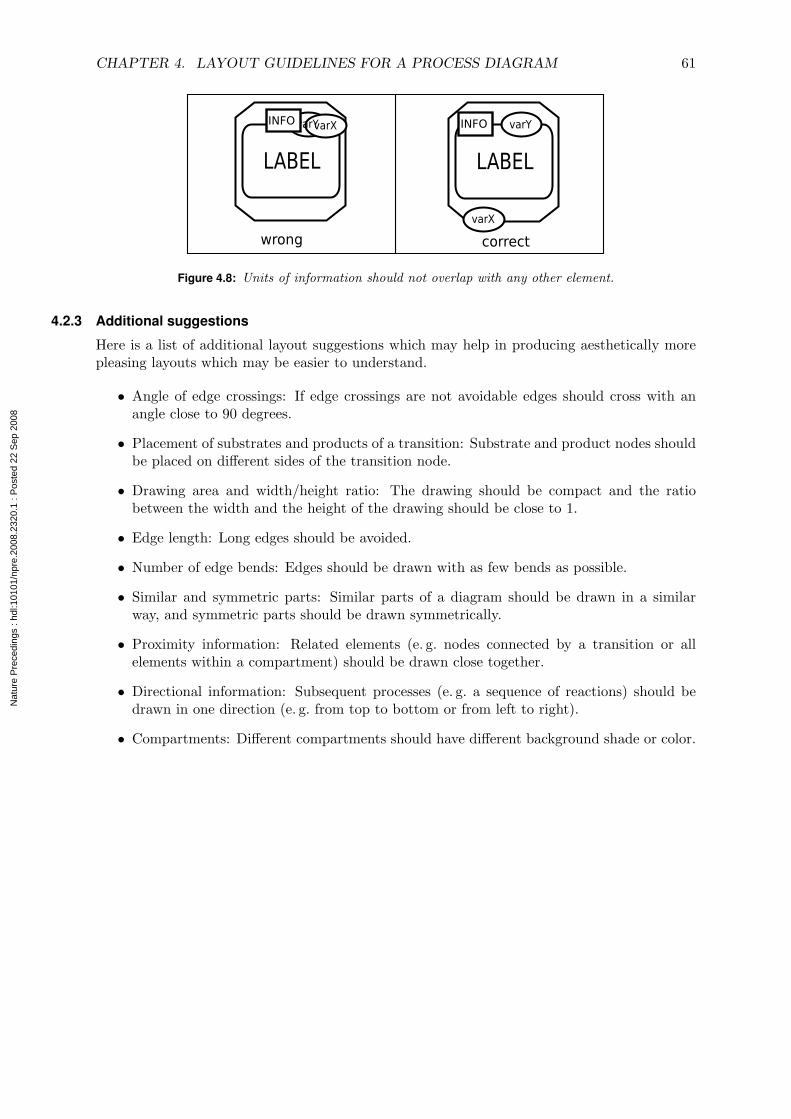
CHAPTER 4. LAYOUT GUIDELINES FOR A PROCESS DIAGRAM 61
Figure 4.8: Units of information should not overlap with any other element.
4.2.3 Additional suggestions
Here is a list of additional layout suggestions which may help in producing aesthetically morepleasing layouts which may be easier to understand.
• Angle of edge crossings: If edge crossings are not avoidable edges should cross with anangle close to 90 degrees.
• Placement of substrates and products of a transition: Substrate and product nodes shouldbe placed on different sides of the transition node.
• Drawing area and width/height ratio: The drawing should be compact and the ratiobetween the width and the height of the drawing should be close to 1.
• Edge length: Long edges should be avoided.
• Number of edge bends: Edges should be drawn with as few bends as possible.
• Similar and symmetric parts: Similar parts of a diagram should be drawn in a similarway, and symmetric parts should be drawn symmetrically.
• Proximity information: Related elements (e. g. nodes connected by a transition or allelements within a compartment) should be drawn close together.
• Directional information: Subsequent processes (e. g. a sequence of reactions) should bedrawn in one direction (e. g. from top to bottom or from left to right).
• Compartments: Different compartments should have different background shade or color.
Nat
ure
Pre
cedi
ngs
: hdl
:101
01/n
pre.
2008
.232
0.1
: Pos
ted
22 S
ep 2
008
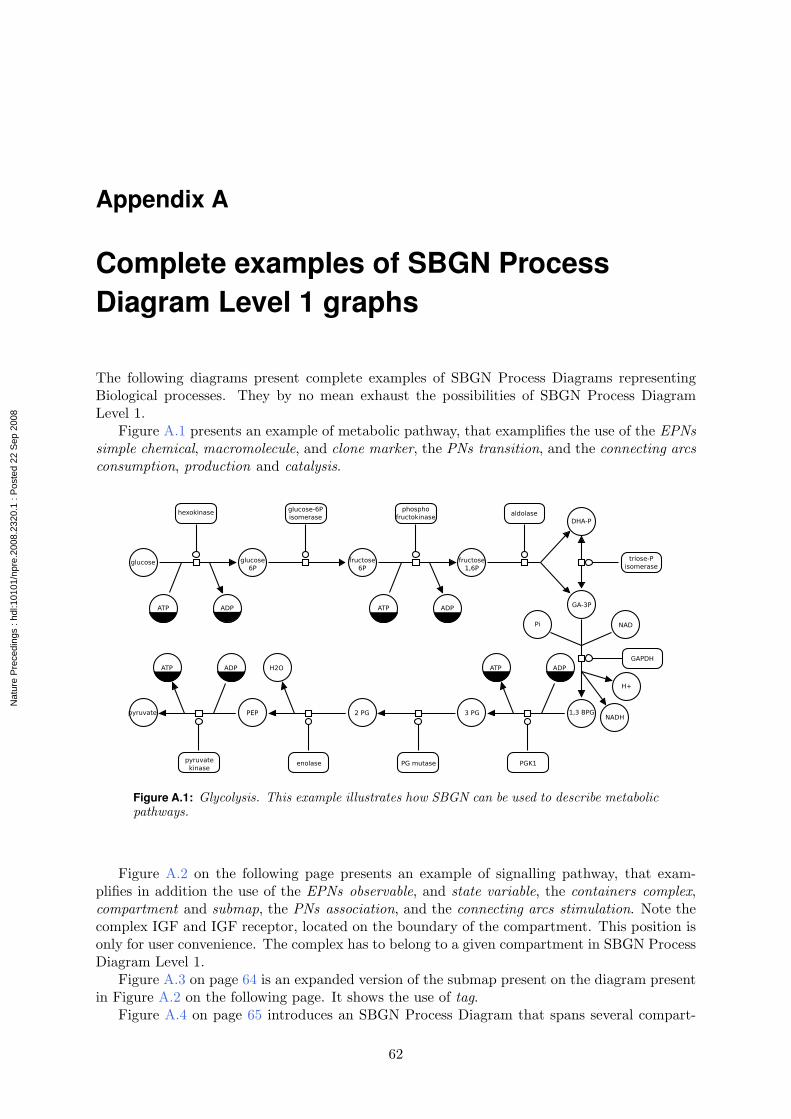
Appendix A
Complete examples of SBGN ProcessDiagram Level 1 graphs
The following diagrams present complete examples of SBGN Process Diagrams representingBiological processes. They by no mean exhaust the possibilities of SBGN Process DiagramLevel 1.
Figure A.1 presents an example of metabolic pathway, that examplifies the use of the EPNssimple chemical, macromolecule, and clone marker, the PNs transition, and the connecting arcsconsumption, production and catalysis.
Figure A.1: Glycolysis. This example illustrates how SBGN can be used to describe metabolicpathways.
Figure A.2 on the following page presents an example of signalling pathway, that exam-plifies in addition the use of the EPNs observable, and state variable, the containers complex,compartment and submap, the PNs association, and the connecting arcs stimulation. Note thecomplex IGF and IGF receptor, located on the boundary of the compartment. This position isonly for user convenience. The complex has to belong to a given compartment in SBGN ProcessDiagram Level 1.
Figure A.3 on page 64 is an expanded version of the submap present on the diagram presentin Figure A.2 on the following page. It shows the use of tag.
Figure A.4 on page 65 introduces an SBGN Process Diagram that spans several compart-
62
Nat
ure
Pre
cedi
ngs
: hdl
:101
01/n
pre.
2008
.232
0.1
: Pos
ted
22 S
ep 2
008
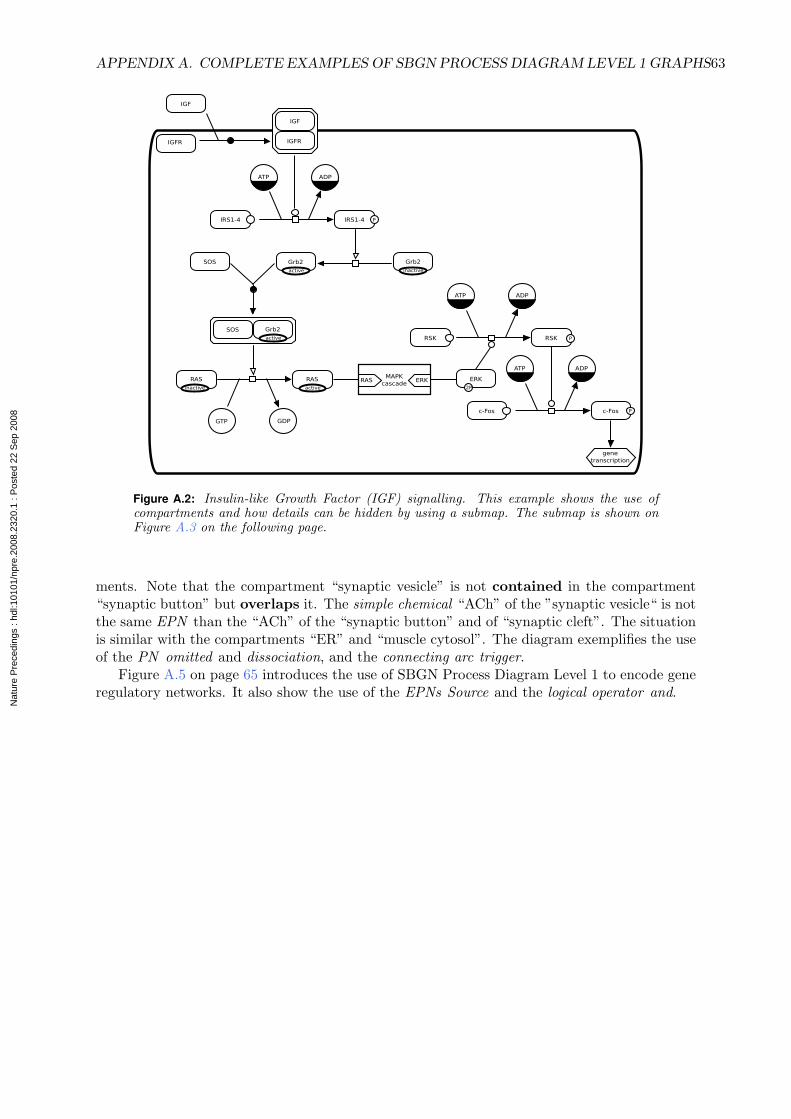
APPENDIX A. COMPLETE EXAMPLES OF SBGN PROCESS DIAGRAM LEVEL 1 GRAPHS63
Figure A.2: Insulin-like Growth Factor (IGF) signalling. This example shows the use ofcompartments and how details can be hidden by using a submap. The submap is shown onFigure A.3 on the following page.
ments. Note that the compartment “synaptic vesicle” is not contained in the compartment“synaptic button” but overlaps it. The simple chemical “ACh” of the ”synaptic vesicle“ is notthe same EPN than the “ACh” of the “synaptic button” and of “synaptic cleft”. The situationis similar with the compartments “ER” and “muscle cytosol”. The diagram exemplifies the useof the PN omitted and dissociation, and the connecting arc trigger.
Figure A.5 on page 65 introduces the use of SBGN Process Diagram Level 1 to encode generegulatory networks. It also show the use of the EPNs Source and the logical operator and.
Nat
ure
Pre
cedi
ngs
: hdl
:101
01/n
pre.
2008
.232
0.1
: Pos
ted
22 S
ep 2
008

APPENDIX A. COMPLETE EXAMPLES OF SBGN PROCESS DIAGRAM LEVEL 1 GRAPHS64
Figure A.3: A submap of the previous diagram showing the MAPK cascade.
Nat
ure
Pre
cedi
ngs
: hdl
:101
01/n
pre.
2008
.232
0.1
: Pos
ted
22 S
ep 2
008
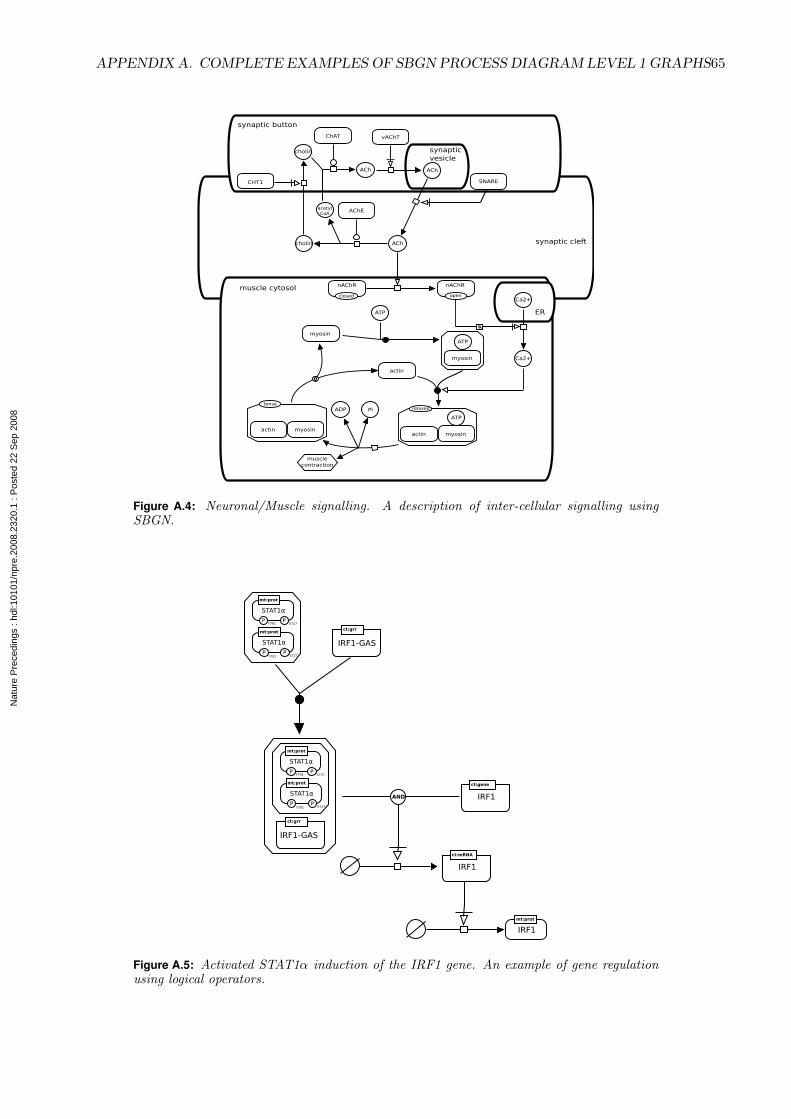
APPENDIX A. COMPLETE EXAMPLES OF SBGN PROCESS DIAGRAM LEVEL 1 GRAPHS65
Figure A.4: Neuronal/Muscle signalling. A description of inter-cellular signalling usingSBGN.
Figure A.5: Activated STAT1α induction of the IRF1 gene. An example of gene regulationusing logical operators.
Nat
ure
Pre
cedi
ngs
: hdl
:101
01/n
pre.
2008
.232
0.1
: Pos
ted
22 S
ep 2
008

Appendix B
Reference card
Print this summary of SBGN symbols for a quick reference.
66
Nat
ure
Pre
cedi
ngs
: hdl
:101
01/n
pre.
2008
.232
0.1
: Pos
ted
22 S
ep 2
008
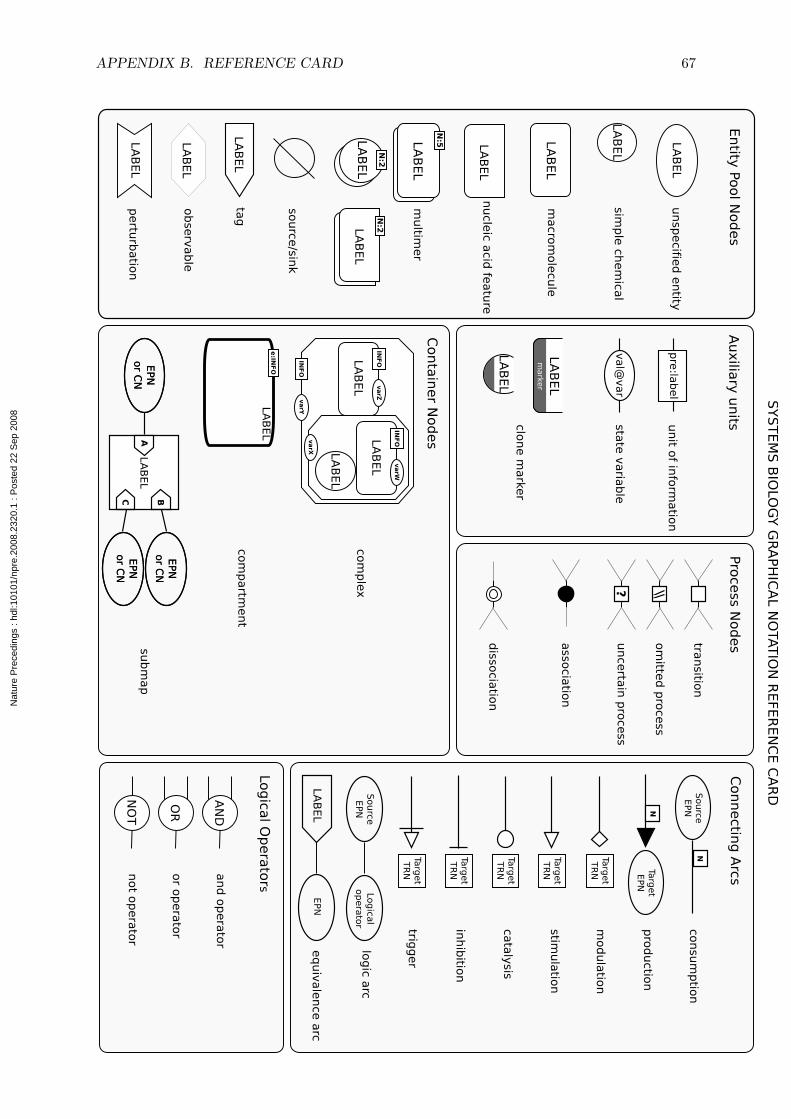
APPENDIX B. REFERENCE CARD 67
Nat
ure
Pre
cedi
ngs
: hdl
:101
01/n
pre.
2008
.232
0.1
: Pos
ted
22 S
ep 2
008
Appendix C
Issues postponed to future levels
C.1 Multicompartment entitiesThe problem of entities, such as macromolecules, spanning several compartments proved to bea challenge for the community involved in the development of SBGN Process Diagram Level 1.It was thus decided to leave it for a future Level. It turns out there is at the moment no obvioussolution satisfactory for everyone. Three broad classes of solutions have been identified so far:
• One can systematically locate an EPN in a given compartment, for instance a trans-membrane receptor in a membrane. However, the reactions of this entity with entitiesrepresented by EPN in other compartments, such as extracellular ligands and secondmessenger systems, will create artificial transport reactions.
• One can represent the domains of proteins in different compartments by macromolecules,and link all those macromolecules in a complex spanning several compartments. However,such a representation would be very confusing, implying that the domains are actuallydifferent molecules linked through non-covalent bonds.
• On can accept macromolecules that span several compartments, and represent domainsas units of information. Those units of information should then be located in givencompartments. To make a full use of such a representation, one should then start andend connecting arcs on given units of information, something prohibited by the currentspecification.
C.2 Logical combination of state variable valuesThe value of a state variable has to be perfectly defined in SBGN Process Diagram Level 1. Ifa state variable can take the alternative values ’A’, ’B’ and ’C’, one cannot attribute it valuessuch as ’non-A’, ’A or B’, ’any’ or ’none’. As a consequence some biochemical processes cannotbe easily represented because of the very large number of state to enumerate. The decision toforbid such a Boolean logic lies in the necessity of maintaining truth path all over an SBGNmap.
C.3 Non-chemical entity nodesThe current specification cannot represent combinations of events and entities. For instancea variable ”voltage” cannot be controlled by a difference of concentration between differententities, such as a given ion in both sides of a membrane.
C.4 GenericsSBGN Process Diagram Level 1 does not provide mechanisms to sub-class EPNs. There is nospecific means of specifying that macromolecules or nucleic acid features X1, X2 and X2 are
68
Nat
ure
Pre
cedi
ngs
: hdl
:101
01/n
pre.
2008
.232
0.1
: Pos
ted
22 S
ep 2
008

APPENDIX C. ISSUES POSTPONED TO FUTURE LEVELS 69
subclasses of X. Therefore, any process that applies to all the subtypes of X has to be triplicated.That situation can easily generate combinatorial explosions of the number of EPNs or PNs.
C.5 State and transformation of compartmentsIn SBGN Process Diagram Level 1 a compartment is a stateless entity. It cannot carry statevariables, and cannot be subjected to process modifying a state. As a recult, a compartmentcannot be transformed, moved, split or merged with another. If one want to represent thetransformation of a compartment, one has to create the start and end compartments, andrepresent the transport of all the EPNs from one to the other. This is not satisfactory, andshould be addressed in the future.
Nat
ure
Pre
cedi
ngs
: hdl
:101
01/n
pre.
2008
.232
0.1
: Pos
ted
22 S
ep 2
008

Appendix D
Extended list of people involved in SBGNProcess Diagram Level 1 developement
Here is a more comprehensive list of person who have been actively involved in SBGN devel-opment, either by their help designing the languages, their comments on the specification, helpwith development infrastructure or any other useful input.
Mirit Aladjemm, Frank Bergmann, Emek Demir, Sarala Dissanayake, Ugur Dogrusoz, TomFreeman, Akira Funahashi, Ralph Gauges, Peter Ghazal, Igor Goryanin, Michael Hucka, AkiyaJouraku, Sohyoung Kim, Hiroaki Kitano, Kurt Kohn, Fedor Kolpakov , Nicolas Le Novere, LuLi, Yukiko Matsuoka, Huaiyu Mi, Stuart Moodie, Sven Sahle, Falk Schreiber, Anatoly Sorokin,Jessica Stephens, Linda Taddeo, Steven Watterson, Alice Villeger, Katja Wegner.
We aim this list to be rather complete. We are very sorry if we forgot someone, and will begrateful if you notified us any omission.
70
Nat
ure
Pre
cedi
ngs
: hdl
:101
01/n
pre.
2008
.232
0.1
: Pos
ted
22 S
ep 2
008
Bibliography
[1] Gerhard Michal. On representation of metabolic pathways. BioSystems, 47:1–7, 1998.
[2] Kurt W. Kohn. Molecular interaction map of the mammalian cell cycle control and DNArepair systems. Molecular Biology of the Cell, 10(8):2703–2734, 1999.
[3] Peter Pin-Shan S. Chen. The entity-relationship model: Toward a unified view of data.ACM Transactions on Database Systems, 1(1):9–36, 1976.
[4] I. Pirson, N. Fortemaison, C. Jacobs, S. Dremier, J. E. Dumont, and C. Maenhaut. Thevisual display of regulatory information and networks. Trends in Cell Biology, 10(10):404–408, 2000.
[5] Daniel L. Cook, J. F. Farley, and S. J. Tapscott. A basis for a visual language for describing,archiving and analyzing functional models of complex biological systems. Genome Biology,2(4):research0012.1–research0012.10., 2001.
[6] E. Demir, O. Babur, U Dogrusoz., A. Gursoy, G. Nisanci, R. Cetin-Atalay, and M. Ozturk.Patika: an integrated visual environment for collaborative construction and analysis ofcellular pathways. Bioinformatics, 18(7):996–1003, 2002.
[7] E. Demir, O. Babur, U. Dogrusoz, A. Gursoy, A. Ayaz, G. Gulesir, G. Nisanci, and R. Cetin-Atalay. An ontology for collaborative construction and analysis of cellular pathways. Bioin-formatics, 20(3):349–356, 2004.
[8] Ron Maimon and Sam Browning. Diagrammatic notation and computational structure ofgene networks. In Hiroaki Kitano, editor, Proceedings of the 2nd International Conferenceon Systems Biology, pages 311–317, Madison, WI, 2001. Omnipress.
[9] Hiroaki Kitano. A graphical notation for biochemical networks. BioSilico, 1:169–176, 2003.
[10] Hiroaki Kitano, Akira Funahashi, Yukiko Matsuoka, and Kanae Oda. Using processdiagrams for the graphical representation of biological networks. Nature Biotechnology,23(8):961–966, 2005.
[11] Stuart L. Moodie, Anatoly A. Sorokin, Igor Goryanin, and Peter Ghazal. A graphicalnotation to describe the logical interactions of biological pathways. Journal of IntegrativeBioinformatics, 3:36, 2006.
[12] M. Hucka, A. Finney, H. M. Sauro, H. Bolouri, J. C. Doyle, H. Kitano, A. P. Arkin,B. J. Bornstein, D. Bray, A. Cornish-Bowden, A. A. Cuellar, S. Dronov, E. D. Gilles,M. Ginkel, V. Gor, I. I. Goryanin, W. J. Hedley, T. C. Hodgman, J.-H. Hofmeyr, P. J.Hunter, N. S. Juty, J. L. Kasberger, A. Kremling, U. Kummer, N. Le Novere, L. M.Loew, D. Lucio, P. Mendes, E. Minch, E. D. Mjolsness, Y. Nakayama, M. R. Nelson,P. F. Nielsen, T. Sakurada, J. C. Schaff, B. E. Shapiro, T. S. Shimizu, H. D. Spence,J. Stelling, K. Takahashi, M. Tomita, J. Wagner, and J. Wang. The Systems BiologyMarkup Language (SBML): A medium for representation and exchange of biochemicalnetwork models. Bioinformatics, 19(4):524–531, 2003.
71
Nat
ure
Pre
cedi
ngs
: hdl
:101
01/n
pre.
2008
.232
0.1
: Pos
ted
22 S
ep 2
008

BIBLIOGRAPHY 72
[13] G. Di Battista, P. Eades, R. Tamassia, and I.G. Tollis. Graph Drawing: Algorithms for theVisualization of Graphs. Prentice Hall, New Jersey, 1998.
[14] M. Kaufmann and D. Wagner. Drawing Graphs: Methods and Models, volume 2025 ofLecture Notes in Computer Science Tutorial. Springer, 2001.
Nat
ure
Pre
cedi
ngs
: hdl
:101
01/n
pre.
2008
.232
0.1
: Pos
ted
22 S
ep 2
008