Embed Size (px)
Citation preview
ELEN E6010 Systems Biology:Design Principles of Biological Circuits
Introductory Lecture
Prof. Predrag R. JelenkovicTime: Tuesday 4:10-6:40pm
Dept. of Electrical EngineeringColumbia University , NY 10027, USAOffice: 812 Schapiro Research Bldg.
Phone: (212) 854-8174Email: [email protected]
URL: http://www.ee.columbia.edu/∼predrag
Jelenkovic (Electrical Engineering) E6010 Systems Biology 1 / 38
E6010 Systems Biology: Brief Description
Recent successes in describing genomes of humans and modelorganisms raise a new set of challenges aimed at describing thecomplex dynamical mechanisms of gene regulation and proteininteractions.
Some of the fundamental features of these complex and large-scalesystems include: nonlinearity, transport delay, intricate feedbackmechanisms, deterministic and stochastic kinetics, randomnetworks, multiple time scales phenomena, modularity, hierarchicalorganization, robustness, increased reliability, kinetic proof readingand optimal evolutionary design.
The course provides an introduction to transcription regulationnetworks as well as other biological networks, including, developmental,signal transduction and neural networks are also discussed.
Jelenkovic (Electrical Engineering) E6010 Systems Biology 2 / 38
E6010 Systems Biology: Brief Description
The course will also focus on robustness of biological circuits to thenaturally occurring stochastic fluctuations in the components of thecircuit; this robustness principle will be illustrated on well-studiedsystems, including bacterial chemotaxis and patterning in fruit flydevelopment.
In the later part of the course, we will study how constrainedevolutionary optimization can be used to understand the optimalcircuit design, and how kinetic proofreading can minimize errors madein biological information processing.
Interestingly, these features of biological systems, reuse of a small set ofbasic building blocks (network motifs), robustness (insensitivity) tocomponent variations, modularity, hierarchical and optimal design arealso found in men made systems, suggesting a deeper connection thatcan unify our understanding of evolved and designed systems.
Jelenkovic (Electrical Engineering) E6010 Systems Biology 3 / 38
E6010 Systems Biology: Course LogisticsPrerequisites: Basic knowledge of molecular biology (E3060/E4060)and elementary concepts from calculus.Required text: Lecture notes, research papers and the followingtextbook will be used:
1. An Introduction to Systems Biology: Design Principles of BiologicalCircuits by Uri Alon, Chapman & Hall, ISBN 1-58488-642-0.
Also, we recommend (not required) the following books:
2. Systems Biology, E. Klipp, W. Liebermeister, C. Wierling, A.Kowald, H. Lehrach, and R. Herwing, ISBN 978-3-527-31874-2.
3. Physical Biology of the Cell, R. Philips, J. Kondev, J. Theriot, ISBN978-0-8153-4163-5.
4. Essential Cell Biology, by B. Alberts, D. Bray, A. Johnson, J. Lewis,M. Raff, K. Roberts, and P. Walter, ISBN 0-8153-2045-0.
Homework: Assignments will be given weekly. Quantitative homeworkassignments may require the use of mathematical software packagesMATHEMATICA or MATLAB.Grading: Hwk (15%) + Midterm (35%) + Final (50%).
Jelenkovic (Electrical Engineering) E6010 Systems Biology 4 / 38
Outline
1 Transcription Networks: Basic Concepts
2 Understanding and Simplifying the Complexity in Space and TimeSeparation of time scalesModularity of transcription networksTranscription networks: activators and repressorsSimple approximation: logical/step functionMulti-dimensional input functionsDynamics and response time of simple gene regulationNetwork motifs: discovering basic building blocks
3 More to Come
Jelenkovic (Electrical Engineering) E6010 Systems Biology 5 / 38

Transcription Networks: Basic Concepts
The cell is an integrated device made of several thousand types ofinteracting proteins (E. Coli has about 4000 types).
Cell needs different proteins for different functions. It monitors theenvironment and determines the amount of each protein needed.
E.g., when sugar is sensed, the cell produces proteins that can transportsugar into the cell and utilize it. When damaged, the cell produces repairproteins. Etc.
Information processing, which determines the rate of production of eachprotein, is primarily carried out by transcription networks.
Special proteins, called transcription factors (TFs), carry out thecontrol function.
I.e., in engineering terms, transcription network is a controller or controlnetwork.
Jelenkovic (Electrical Engineering) E6010 Systems Biology 6 / 38
Elements of transcription networks
Signal 1 Signal 2 Signal 3 Signal 4 Signal N
...
Environment
X1 X2 X3 XTranscription X1 X2 X3 XmTranscriptionfactors
...
k
genes
gene 1 gene 2 gene 3 gene 4 gene 5 gene 6 ... gene k
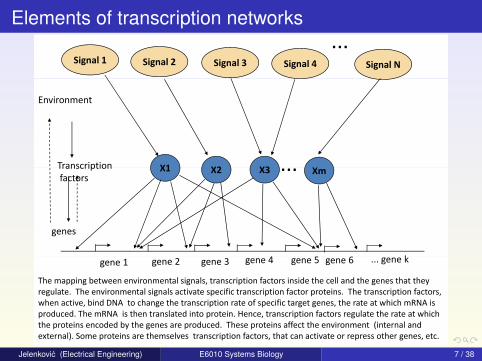
The mapping between environmental signals, transcription factors inside the cell and the genes that they regulate. The environmental signals activate specific transcription factor proteins. The transcription factors,
h ti bi d DNA t h th t i ti t f ifi t t th t t hi h RNA iwhen active, bind DNA to change the transcription rate of specific target genes, the rate at which mRNA is produced. The mRNA is then translated into protein. Hence, transcription factors regulate the rate at which the proteins encoded by the genes are produced. These proteins affect the environment (internal and external). Some proteins are themselves transcription factors, that can activate or repress other genes, etc.
Jelenkovic (Electrical Engineering) E6010 Systems Biology 7 / 38
Elements of transcription networks
Elements of transcription networks are genes and transcriptionfactors (TFs). The interaction between TFs and genes isdescribed by these networks.The rate at which the gene is transcribed is controlled by thepromoter, a regulatory region of the gene that precedes the gene.When TFs are bound to the promoter region, they change theprobability per unit time that RNAp binds the promoter andproduces an mRNA molecule.TFs can act as activators that increase the transcription rate ofthe gene, or as repressors that reduce the transcription rate.TFs are themselves encoded by genes, which are regulated by yetanother TFs, and so on. This set of interactions forms atranscription network.
Jelenkovic (Electrical Engineering) E6010 Systems Biology 8 / 38

Gene transcription regulation: basic picture
promoter
gene Y DNA
Yprotein
RNA polymerasemRNA
TRANSLATION
TRANSCRIPTION
RNA polymerase
Each gene is usually preceded by a regulatory DNA region called the promoter. The promoter contains a specific site (DNA sequence) that can bind RNA polymerase (RNAp), a complex of
l t i th t f Th t th i RNA th t i l t t
gene Y
several proteins that forms an enzyme That can synthesize mRNA that is complementary to the genes coding sequence. The process of forming the mRNA is called transcription. The mRNA is then translated into protein.
Jelenkovic (Electrical Engineering) E6010 Systems Biology 9 / 38

Gene transcription regulation: activators
ActivatorX X Y
gene Y
Y
YY
Y
X binding sitegene Y
X X*
SXY
INCREASED TRANSCRIPTIONX*
Activator X, is a transcription‐ factor protein that increases the rate of mRNA transcription when it binds the promoter. The activator transits rapidly between active and inactive forms. In its
Bound activator
p p yactive form, it has a high affinity to a specific site (or sites) on the promoter. The signal SXincreases the probability that X is in its active form X*. Thus, X* binds the promoter of gene Y to increase transcription and production of protein Y.
Jelenkovic (Electrical Engineering) E6010 Systems Biology 10 / 38
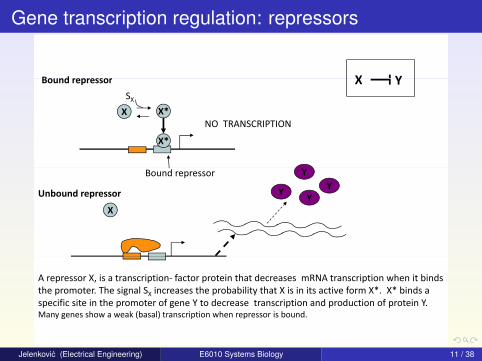
Gene transcription regulation: repressors
Bound repressor X YBound repressor X Y
X X*
SX
NO TRANSCRIPTIONNO TRANSCRIPTION
X*
Unbound repressor
X
Bound repressor Y
YY
Y
X
A repressor X, is a transcription‐ factor protein that decreases mRNA transcription when it binds the promoter. The signal SX increases the probability that X is in its active form X*. X* binds a
ifi it i th t f Y t d t i ti d d ti f t i Yspecific site in the promoter of gene Y to decrease transcription and production of protein Y.Many genes show a weak (basal) transcription when repressor is bound.
Jelenkovic (Electrical Engineering) E6010 Systems Biology 11 / 38
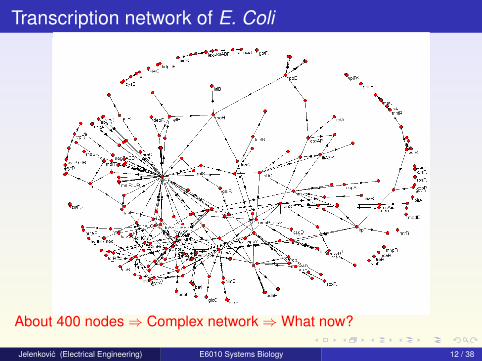
Transcription network of E. Coli
About 400 nodes⇒ Complex network⇒What now?
Jelenkovic (Electrical Engineering) E6010 Systems Biology 12 / 38
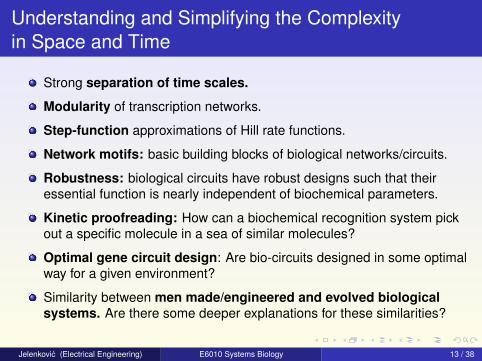
Understanding and Simplifying the Complexityin Space and Time
Strong separation of time scales.
Modularity of transcription networks.
Step-function approximations of Hill rate functions.
Network motifs: basic building blocks of biological networks/circuits.
Robustness: biological circuits have robust designs such that theiressential function is nearly independent of biochemical parameters.
Kinetic proofreading: How can a biochemical recognition system pickout a specific molecule in a sea of similar molecules?
Optimal gene circuit design: Are bio-circuits designed in some optimalway for a given environment?
Similarity between men made/engineered and evolved biologicalsystems. Are there some deeper explanations for these similarities?
Jelenkovic (Electrical Engineering) E6010 Systems Biology 13 / 38
Outline
1 Transcription Networks: Basic Concepts
2 Understanding and Simplifying the Complexity in Space and TimeSeparation of time scalesModularity of transcription networksTranscription networks: activators and repressorsSimple approximation: logical/step functionMulti-dimensional input functionsDynamics and response time of simple gene regulationNetwork motifs: discovering basic building blocks
3 More to Come
Jelenkovic (Electrical Engineering) E6010 Systems Biology 14 / 38
Separation of time scales
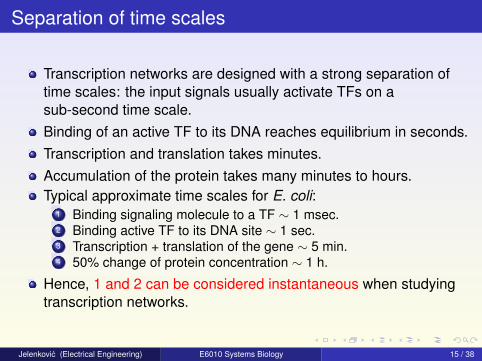
Transcription networks are designed with a strong separation oftime scales: the input signals usually activate TFs on asub-second time scale.Binding of an active TF to its DNA reaches equilibrium in seconds.Transcription and translation takes minutes.Accumulation of the protein takes many minutes to hours.Typical approximate time scales for E. coli:
1 Binding signaling molecule to a TF ∼ 1 msec.2 Binding active TF to its DNA site ∼ 1 sec.3 Transcription + translation of the gene ∼ 5 min.4 50% change of protein concentration ∼ 1 h.
Hence, 1 and 2 can be considered instantaneous when studyingtranscription networks.
Jelenkovic (Electrical Engineering) E6010 Systems Biology 15 / 38

Outline
1 Transcription Networks: Basic Concepts
2 Understanding and Simplifying the Complexity in Space and TimeSeparation of time scalesModularity of transcription networksTranscription networks: activators and repressorsSimple approximation: logical/step functionMulti-dimensional input functionsDynamics and response time of simple gene regulationNetwork motifs: discovering basic building blocks
3 More to Come
Jelenkovic (Electrical Engineering) E6010 Systems Biology 16 / 38
Modularity of transcription networks
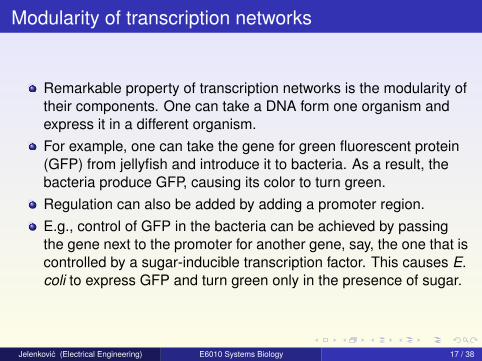
Remarkable property of transcription networks is the modularity oftheir components. One can take a DNA form one organism andexpress it in a different organism.For example, one can take the gene for green fluorescent protein(GFP) from jellyfish and introduce it to bacteria. As a result, thebacteria produce GFP, causing its color to turn green.Regulation can also be added by adding a promoter region.E.g., control of GFP in the bacteria can be achieved by passingthe gene next to the promoter for another gene, say, the one that iscontrolled by a sugar-inducible transcription factor. This causes E.coli to express GFP and turn green only in the presence of sugar.
Jelenkovic (Electrical Engineering) E6010 Systems Biology 17 / 38
Outline
1 Transcription Networks: Basic Concepts
2 Understanding and Simplifying the Complexity in Space and TimeSeparation of time scalesModularity of transcription networksTranscription networks: activators and repressorsSimple approximation: logical/step functionMulti-dimensional input functionsDynamics and response time of simple gene regulationNetwork motifs: discovering basic building blocks
3 More to Come
Jelenkovic (Electrical Engineering) E6010 Systems Biology 18 / 38
Transcription networks: activators and repressors
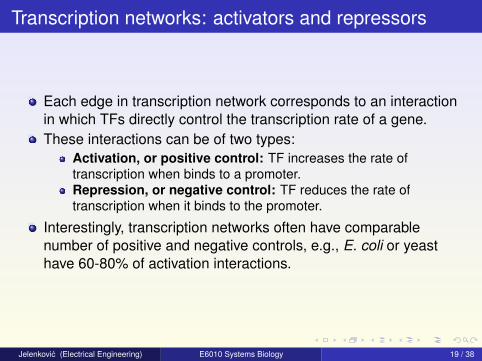
Each edge in transcription network corresponds to an interactionin which TFs directly control the transcription rate of a gene.These interactions can be of two types:
Activation, or positive control: TF increases the rate oftranscription when binds to a promoter.Repression, or negative control: TF reduces the rate oftranscription when it binds to the promoter.
Interestingly, transcription networks often have comparablenumber of positive and negative controls, e.g., E. coli or yeasthave 60-80% of activation interactions.
Jelenkovic (Electrical Engineering) E6010 Systems Biology 19 / 38
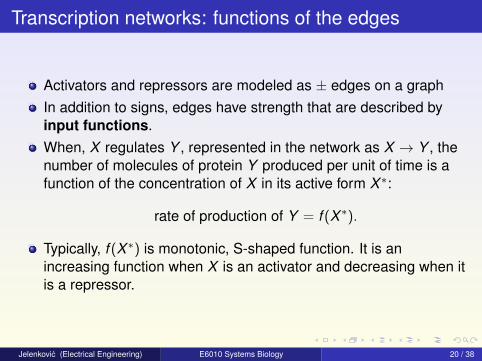
Transcription networks: functions of the edges
Activators and repressors are modeled as ± edges on a graphIn addition to signs, edges have strength that are described byinput functions.When, X regulates Y , represented in the network as X → Y , thenumber of molecules of protein Y produced per unit of time is afunction of the concentration of X in its active form X ∗:
rate of production of Y = f (X ∗).
Typically, f (X ∗) is monotonic, S-shaped function. It is anincreasing function when X is an activator and decreasing when itis a repressor.
Jelenkovic (Electrical Engineering) E6010 Systems Biology 20 / 38
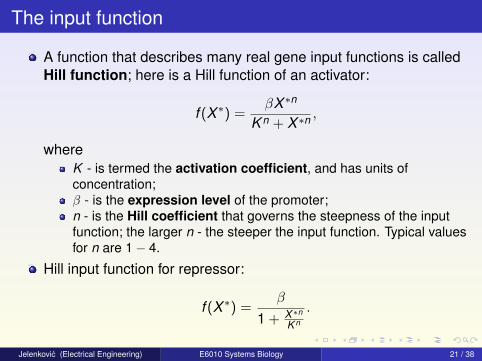
The input function
A function that describes many real gene input functions is calledHill function; here is a Hill function of an activator:
f (X ∗) =βX ∗n
K n + X ∗n ,
whereK - is termed the activation coefficient, and has units ofconcentration;β - is the expression level of the promoter;n - is the Hill coefficient that governs the steepness of the inputfunction; the larger n - the steeper the input function. Typical valuesfor n are 1− 4.
Hill input function for repressor:
f (X ∗) =β
1 + X∗n
K n
.
Jelenkovic (Electrical Engineering) E6010 Systems Biology 21 / 38

Outline
1 Transcription Networks: Basic Concepts
2 Understanding and Simplifying the Complexity in Space and TimeSeparation of time scalesModularity of transcription networksTranscription networks: activators and repressorsSimple approximation: logical/step functionMulti-dimensional input functionsDynamics and response time of simple gene regulationNetwork motifs: discovering basic building blocks
3 More to Come
Jelenkovic (Electrical Engineering) E6010 Systems Biology 22 / 38
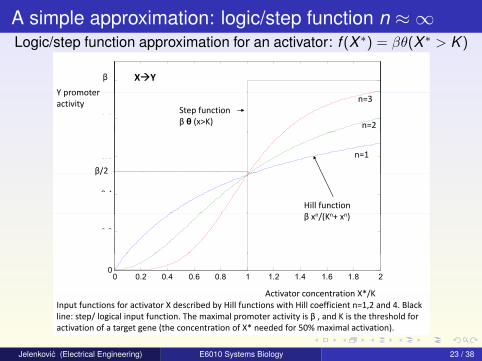
A simple approximation: logic/step function n ≈ ∞Logic/step function approximation for an activator: f (X ∗) = βθ(X ∗ > K )
1Y promoter
β X Y
0.8
Y promoteractivity
Step functionβ θ (x>K) n=2
n=3
0.6
β/2
n=1
0.4
β/2
Hill functionβ n/(Kn n)
0.2
β xn/(Kn+ xn)
0 0.2 0.4 0.6 0.8 1 1.2 1.4 1.6 1.8 20
Activator concentration X*/KActivator concentration X /K Input functions for activator X described by Hill functions with Hill coefficient n=1,2 and 4. Black line: step/ logical input function. The maximal promoter activity is β , and K is the threshold for activation of a target gene (the concentration of X* needed for 50% maximal activation).
Jelenkovic (Electrical Engineering) E6010 Systems Biology 23 / 38

Outline
1 Transcription Networks: Basic Concepts
2 Understanding and Simplifying the Complexity in Space and TimeSeparation of time scalesModularity of transcription networksTranscription networks: activators and repressorsSimple approximation: logical/step functionMulti-dimensional input functionsDynamics and response time of simple gene regulationNetwork motifs: discovering basic building blocks
3 More to Come
Jelenkovic (Electrical Engineering) E6010 Systems Biology 24 / 38
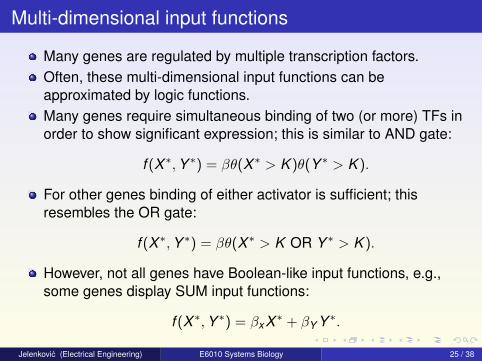
Multi-dimensional input functions
Many genes are regulated by multiple transcription factors.Often, these multi-dimensional input functions can beapproximated by logic functions.Many genes require simultaneous binding of two (or more) TFs inorder to show significant expression; this is similar to AND gate:
f (X ∗,Y ∗) = βθ(X ∗ > K )θ(Y ∗ > K ).
For other genes binding of either activator is sufficient; thisresembles the OR gate:
f (X ∗,Y ∗) = βθ(X ∗ > K OR Y ∗ > K ).
However, not all genes have Boolean-like input functions, e.g.,some genes display SUM input functions:
f (X ∗,Y ∗) = βxX ∗ + βY Y ∗.
Jelenkovic (Electrical Engineering) E6010 Systems Biology 25 / 38

Outline
1 Transcription Networks: Basic Concepts
2 Understanding and Simplifying the Complexity in Space and TimeSeparation of time scalesModularity of transcription networksTranscription networks: activators and repressorsSimple approximation: logical/step functionMulti-dimensional input functionsDynamics and response time of simple gene regulationNetwork motifs: discovering basic building blocks
3 More to Come
Jelenkovic (Electrical Engineering) E6010 Systems Biology 26 / 38
Dynamics and response time of simple regulation
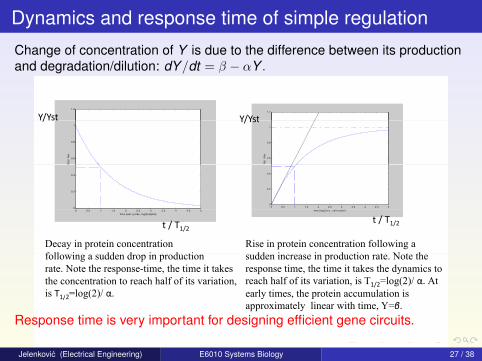
Change of concentration of Y is due to the difference between its productionand degradation/dilution: dY/dt = β − αY .
1.21.2
Y/Yst Y/Yst
0.6
0.8
1
R(t
) /
Rst
0.6
0.8
1
R(t
) /
Rst
Y/Yst Y/Yst
0
0.2
0.4
0 0.5 1 1.5 2 2.5 3 3.5 4 4.5 50
0.2
0.4
0 0.5 1 1.5 2 2.5 3 3.5 4 4.5 5time [cell cycles, log(2)/alpha]
Decay in protein concentrationf ll i dd d i d ti
Rise in protein concentration following a dd i i d ti t N t th
time [log(2) t/α , cell cycles]
t / T1/2t / T1/2
following a sudden drop in production rate. Note the response-time, the time it takesthe concentration to reach half of its variation,is T1/2=log(2)/ α.
sudden increase in production rate. Note the response time, the time it takes the dynamics to reach half of its variation, is T1/2=log(2)/ α. At early times, the protein accumulation is 1/2 g( ) y , papproximately linear with time, Y=β.
Response time is very important for designing efficient gene circuits.
Jelenkovic (Electrical Engineering) E6010 Systems Biology 27 / 38
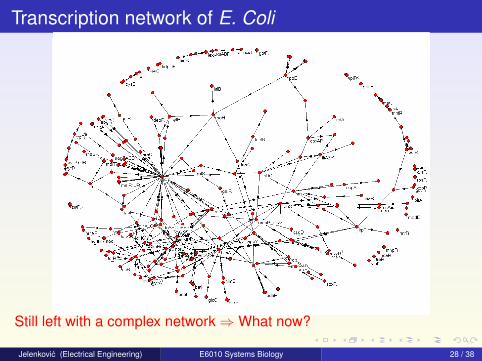
Transcription network of E. Coli
Still left with a complex network⇒What now?
Jelenkovic (Electrical Engineering) E6010 Systems Biology 28 / 38
Outline
1 Transcription Networks: Basic Concepts
2 Understanding and Simplifying the Complexity in Space and TimeSeparation of time scalesModularity of transcription networksTranscription networks: activators and repressorsSimple approximation: logical/step functionMulti-dimensional input functionsDynamics and response time of simple gene regulationNetwork motifs: discovering basic building blocks
3 More to Come
Jelenkovic (Electrical Engineering) E6010 Systems Biology 29 / 38
Network motifs: discovering basic building blocks
Our goal will be to define understandable patterns of connectionsthat serve as building blocks of the network.Ideally, we would like to understand the dynamics of the entirenetwork based on the dynamics of the individual building blocks.Now, we will:
1 Define a way to detect building-block patterns in complex networks,called network motifs.
2 Examine the simplest network motif in transcription networks,negative autoregulation.
3 Show that this motif has useful functions: speeding up theresponse time of transcription interactions and stabilizing them.
Jelenkovic (Electrical Engineering) E6010 Systems Biology 30 / 38
Autoregulation: a network motif
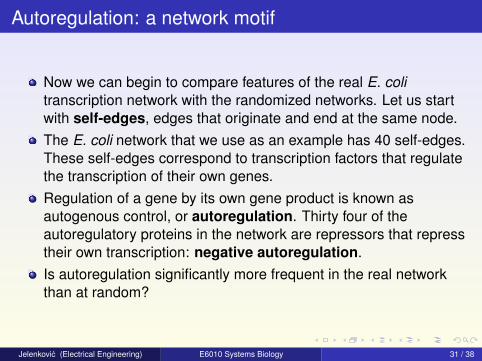
Now we can begin to compare features of the real E. colitranscription network with the randomized networks. Let us startwith self-edges, edges that originate and end at the same node.The E. coli network that we use as an example has 40 self-edges.These self-edges correspond to transcription factors that regulatethe transcription of their own genes.Regulation of a gene by its own gene product is known asautogenous control, or autoregulation. Thirty four of theautoregulatory proteins in the network are repressors that represstheir own transcription: negative autoregulation.Is autoregulation significantly more frequent in the real networkthan at random?
Jelenkovic (Electrical Engineering) E6010 Systems Biology 31 / 38
Autoregulation: a network motif
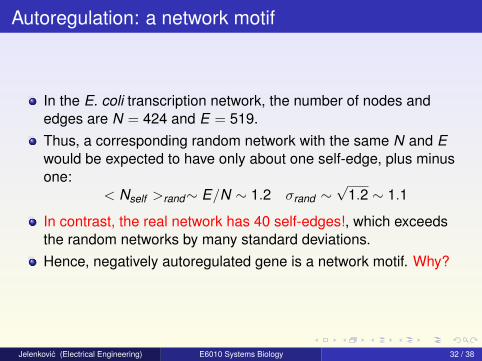
In the E. coli transcription network, the number of nodes andedges are N = 424 and E = 519.Thus, a corresponding random network with the same N and Ewould be expected to have only about one self-edge, plus minusone:
< Nself >rand∼ E/N ∼ 1.2 σrand ∼√
1.2 ∼ 1.1
In contrast, the real network has 40 self-edges!, which exceedsthe random networks by many standard deviations.Hence, negatively autoregulated gene is a network motif. Why?
Jelenkovic (Electrical Engineering) E6010 Systems Biology 32 / 38
Negative autoregulation speeds up the response time1.5
X/Xst 1X/Xst 1
0.5
0 0.2 0.4 0.6 0.8 1 1.2 1.4 1.6 1.8 20
T1/2(nar) T1/2
(simple) time α t
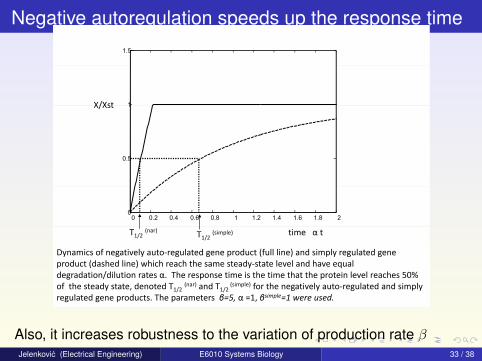
Dynamics of negatively auto‐regulated gene product (full line) and simply regulated gene product (dashed line) which reach the same steady‐state level and have equal p ( ) y qdegradation/dilution rates α. The response time is the time that the protein level reaches 50% of the steady state, denoted T1/2
(nar) and T1/2 (simple) for the negatively auto‐regulated and simply
regulated gene products. The parameters β=5, α =1, βsimple=1 were used.
Also, it increases robustness to the variation of production rate βJelenkovic (Electrical Engineering) E6010 Systems Biology 33 / 38
What about positive autoregulation?
1X / Xst
0.8
1X / XstNegativeAuto‐regulation Simple
regulation
0.6 PositiveAuto‐regulation
0.2
0.4
0 0.5 1 1.5 2 2.5 3 3.5 4 4.5 50
ll ti [l (2)/ ]
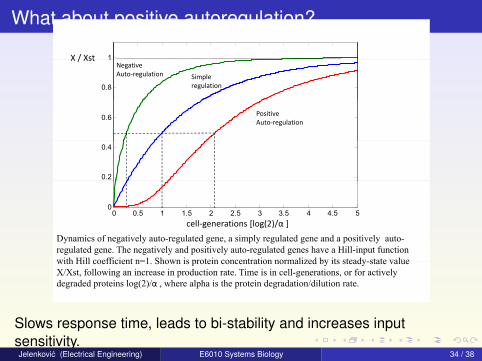
Dynamics of negatively auto-regulated gene, a simply regulated gene and a positively auto-regulated gene. The negatively and positively auto-regulated genes have a Hill-input function with Hill coefficient n=1 Shown is protein concentration normalized by its steady state value
cell‐generations [log(2)/α ]
with Hill coefficient n=1. Shown is protein concentration normalized by its steady-state value X/Xst, following an increase in production rate. Time is in cell-generations, or for actively degraded proteins log(2)/α , where alpha is the protein degradation/dilution rate.
Slows response time, leads to bi-stability and increases inputsensitivity.Jelenkovic (Electrical Engineering) E6010 Systems Biology 34 / 38
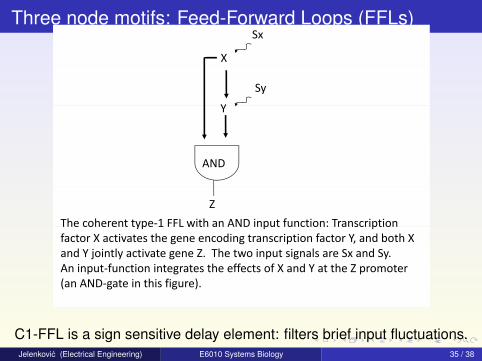
Three node motifs: Feed-Forward Loops (FFLs)
X
Sx
Y
Sy
Y
AND
Z
The coherent type‐1 FFL with an AND input function: TranscriptionThe coherent type 1 FFL with an AND input function: Transcription factor X activates the gene encoding transcription factor Y, and both X and Y jointly activate gene Z. The two input signals are Sx and Sy.An input function integrates the effects of X and Y at the Z promoterAn input‐function integrates the effects of X and Y at the Z promoter (an AND‐gate in this figure).
C1-FFL is a sign sensitive delay element: filters brief input fluctuations.Jelenkovic (Electrical Engineering) E6010 Systems Biology 35 / 38
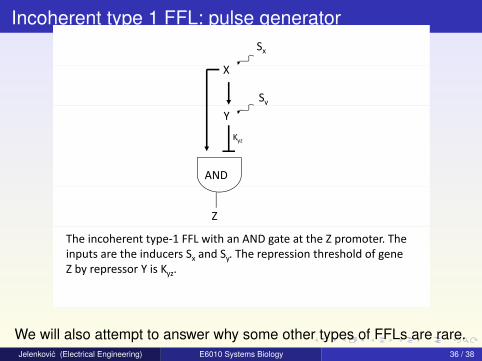
Incoherent type 1 FFL: pulse generatorSx
X
Sy
Y
Kyz
AND
Z
The incoherent type‐1 FFL with an AND gate at the Z promoter. The inputs are the inducers Sx and Sy. The repression threshold of gene Z by repressor Y is KZ by repressor Y is Kyz.
We will also attempt to answer why some other types of FFLs are rare.Jelenkovic (Electrical Engineering) E6010 Systems Biology 36 / 38
More to comeTemporal programs and the global structure of transcription networks
Network motifs in:
DevelopmentalSignal TransductionNeuronal Networks
Robustness of protein circuits: the example of bacterial chemotaxis
Robust patterning in development
Kinetic proof reading
Optimal gene circuit design
Demand rules for gene regulation: activators or repressors?
Deeper underlying questions:
Simplicity in biology: bio nets evolved to function, not to beunderstandable?Why are men made/engineered and evolved biological systemssimilar? Are they?
Jelenkovic (Electrical Engineering) E6010 Systems Biology 37 / 38
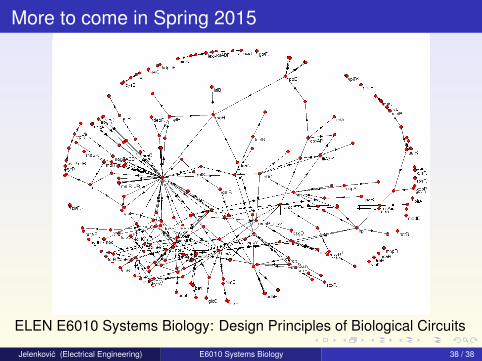
More to come in Spring 2015
ELEN E6010 Systems Biology: Design Principles of Biological Circuits
Jelenkovic (Electrical Engineering) E6010 Systems Biology 38 / 38


![synthetic biological circuits - arXivarXiv:1306.4493v1 [cs.LO] 19 Jun 2013 A temporal logic approach to modular design of synthetic biological circuits Ezio Bartocci1, Luca Bortolussi2,3,](https://img.dokumen.tips/doc/110x75/5f0ab9fa7e708231d42d0a99/synthetic-biological-circuits-arxiv-arxiv13064493v1-cslo-19-jun-2013-a-temporal.jpg)