Embed Size (px)
Citation preview

Kevin Bowman
Systems AnalysisA Beginner’s Guide

Systems Analysis


SystemsAnalysis
A Beginner’s Guide
Kevin BowmanSheffield Hallam University

© Kevin Bowman 2004
All rights reserved. No reproduction, copy or transmission ofthis publication may be made without written permission.
No paragraph of this publication may be reproduced, copied ortransmitted save with written permission or in accordance withthe provisions of the Copyright, Designs and Patents Act 1988,or under the terms of any licence permitting limited copyingissued by the Copyright Licensing Agency, 90 Tottenham CourtRoad, London W1T 4LP.
Any person who does any unauthorised act in relation to thispublication may be liable to criminal prosecution and civilclaims for damages.
The author has asserted his right to be identifiedas the author of this work in accordance with theCopyright, Designs and Patents Act 1988.
First published 2004 byPALGRAVE MACMILLANHoundmills, Basingstoke, Hampshire RG21 6XS and175 Fifth Avenue, New York, N. Y. 10010Companies and representatives throughout the world
PALGRAVE MACMILLAN is the global academic imprint of the PalgraveMacmillan division of St. Martin’s Press, LLC and of Palgrave Macmillan Ltd.Macmillan® is a registered trademark in the United States, United Kingdomand other countries. Palgrave is a registered trademark in the EuropeanUnion and other countries.
ISBN 0–333–98630–X paperback
This book is printed on paper suitable for recycling and made from fullymanaged and sustained forest sources.
A catalogue record for this book is available from the British Library.
10 9 8 7 6 5 4 3 2 113 12 11 10 09 08 07 06 05 04
Printed and bound in China

To Mum and Dad


Contents
Preface xi
Acknowledgements xiii
1 Introduction to systems analysis 1
1.1 What is a system? 1
1.2 Information systems 2
1.3 What is systems analysis? 2
1.4 Systems Methodologies 3
1.5 SSADM – Structured Systems Analysis and Design Method 4
1.6 The structure of SSADM 5
1.7 SSADM and the Systems Development Life Cycle 7
Summary 7
Exercises 8
2 The current system 9
2.1 The approach in this book 9
2.2 The case studies 9
2.2.1 Swillbuckets Country Club 9
2.2.2 The Medical Centre at the University of Life 11
2.3 Investigation of the current environment 14
2.3.1 Investigate and define requirements 14
2.3.2 Fact-finding techniques 16
2.3.3 Investigate current processing 17
2.3.4 Simple steps in data flow modelling 22
Summary 34
Exercises 40
vii

3 Modelling the data structure 42
3.1 Entity modelling 42
3.1.1 Entities 42
3.1.2 Attributes 43
3.1.3 Keys 43
3.1.4 Relationships 44
3.1.5 Resolving many-to-many relationships 46
3.2 Simple steps in entity modelling 48
3.3 Entity modelling at Swillbuckets 49
3.4 Physical data store/entity cross-reference 59
Summary 61
Exercises 65
4 The logical view 66
4.1 Logicalization 66
4.2 Simple steps in logicalization 67
4.3 Logicalization at Swillbuckets 73
4.4 Problem and requirements catalogue 75
4.4.1 The Medical Centre 76
4.4.2 The problem and requirements catalogue forSwillbuckets 81
Summary 82
Exercises 83
5 Business system options 85
5.1 Business system options 85
5.2 Simple steps in creating business system options 85
5.3 BSOs at the Medical Centre 86
5.4 BSOs at Swillbuckets 89
Summary 91
6 Requirements specification 92
6.1 Requirements specification 92
6.2 Required logical models 92
6.3 Elementary process descriptions 94
6.3.1 Structured English and decision trees 97
6.3.2 Decision tables 98
6.3.3 Simple steps in decision tables 99
viii Contents

6.4 Input/output design 101
6.4.1 Output design 102
6.4.2 Simple steps in output design 105
6.4.3 Input design 105
6.4.4 Simple steps in input design 108
6.4.5 User interface design 108
Summary 109
Exercises 109
7 Normalization 110
7.1 Normalization 110
7.1.1 What happens if data isn’t normalized 110
7.1.2 (Not so) simple tasks in normalization 115
7.2 Rationalization 133
7.3 Rebuild the entity model 135
7.4 Entity/function matrix 136
7.4.1 Simple steps in creating an entity/function matrix 137
Summary 138
Exercises 138
8 Technical and Physical Design 140
8.1 Technical design and physical design 140
8.1.1 Design detailed user interface 141
8.1.2 Prototyping 142
8.1.3 Simple steps in prototyping 143
8.1.4 Interface flow diagrams 143
8.2 Database design 144
8.2.1 Indexes 145
8.3 Access and security 145
8.4 Volumetrics 146
8.5 Documentation 147
8.6 CASE tools 149
Summary 150
Exercise 150
And finally... 151
Contents ix

Appendix: Teaching case study – North Sea Ferries 152
TITLE: NSF Project Information Document 152
Project Background 152
Project Team – Terms of Reference 153
NSF Project Briefing Document 153
Company Overview – Crossing Bookings 153
Transcript of Interview with Booking Office Manager 155
Transcript of Interview with Port Desk Staff 158
Examples of Documents used by North Sea Ferries 160
Bibliography 169
Index 171
x Contents

Preface
This book teaches the key techniques used in SSADM and is an idealstarting text for first-year undergraduate computing students or those atFoundation or HND level. It is not intended to be an SSADM manual;instead, it strips SSADM down to the key techniques and explains these insimple terms without the common repetition and over-elaboration foundin other books in this area. Most real-world systems use such a cut-downversion, and this book provides the reader with a sound awareness of thefundamental skills required for successful systems analysis and design.
The book uses a step-by-step approach, assuming no previous knowledgeand avoiding jargon. Chapter 1 provides an overview of systems analysis,and Chapter 2 goes on to introduce the approach of this book and the twocase studies that will develop throughout the text. Chapters 3–8 then detaileach key stage in systems analysis and design. A complete teaching casestudy is provided in the Appendix.
The book contains an abundance of examples, end of chapter exercises,and two case studies: the Swillbuckets Country Club and the MedicalCentre at the University of Life. The use of humour is central and the casestudies have been designed to give ample opportunity to make the textamusing while demonstrating the key points. The book is also accompa-nied by a dedicated lecturer and student web site which features solutionsto all the exercises and working versions of the case studies.
xi


Acknowledgements
Special thanks to Liz for support and giving me precious time. Thanks toDanny, Holly, Tom and Jack for giving me the incentive. Someone’s got topay those university fees.
Thanks also to Steve Wade for the inspiration.
xiii


C H A P T E R 1
Introduction tosystems analysis
1.1 What is a system?It is sometimes assumed that a system always refers to a computer system,but of course there are many other types of system. The human body, forexample, is a complex system made up of many smaller systems: the respi-ratory system, the digestive system etc.
We could loosely define a system as anything with a purpose. A systemmust do something. If you put something into it, you should get somethingdifferent out of it. So this book is a system for learning about systems anal-ysis. If you input the time and effort required to read it, as indeed you aredoing, you will gain unparalleled insights into systems analysis tech-niques, Swillbuckets Club, normalization and all manner of joys.
But nearly everything has a purpose. It’s hard to think of something thathas no purpose. Morning television, perhaps. Or museum attendants,maybe. Generally, though, we could take the view that everything is asystem.
It certainly seems to be true that every system is made up of smaller sys-tems, and also that every system is part of a larger system. The college oruniversity you attend is a system, though it might not always seem like it.It is made up of departments, classes and students, all of which are systemsthemselves. Expanding upwards, the college or university is a part of theeducation system of the country, which in turn is part of the public services,and so on.
Sometimes, it’s hard to know when one system stops and another onestarts. The systems analyst has to make this decision early on: exactly whatis the scope of the system being analysed? Otherwise, the analyst could beanalysing away for ever.
1

1.2 Information systemsMost, if not all, organizations have an information system. It might bequite primitive, like a list of names and addresses stuffed into a shoebox, orit might be hugely sophisticated. Either way, the aims will be pretty muchthe same: to help provide an effective customer service and to help man-agement make the best decisions.
In order to understand how information systems can help organizations,you need to understand the difference between data and information. Datais raw facts or figures such as: 42, 12, 45, 13, 9 and 34. These numbers haveno meaning until you know the context. They might be lottery numbers,map coordinates or a secret code. They need to be processed in some way toturn them into something useful. When this has been done, you haveinformation.
Information is useful to somebody. It tells you something you didn’tknow before. Sometimes it’s not that important and can be ignored; some-times it’s priceless. How much would advance information about the Sep-tember 11th 2001 terrorist attacks have been worth? Of course,information systems in businesses won’t provide that type of information,but they might make the difference between success and failure. Figure 1.1shows how information systems work in essence.
The raw data needs to be processed in some way to produce information.The data might be sorted into alphabetical order. Or key elements of thedata might be filtered out. Or the data might just be presented in a moreunderstandable way. It’s your job as the systems analyst, in conjunctionwith the user, to decide what processing of data takes place and how ithappens.
1.3 What is systems analysis?There’s a lot more to building an information system than sitting down at aPC and starting to type. In the past, before systems analysis existed, pro-grammers went into organizations, spoke to a couple of senior managers,went away and came back a few months later with a new system. But thiswasn’t a very successful approach. It assumed that users knew whatsystem they wanted. That’s like an aeroplane engine manufacturer askingpassengers what sort of engine they want. They just want one that works!
2 Systems analysis: a beginner’s guide
Data Process InformationCollected Presented
Storage
Figure 1.1Information systems.
Equally, users of computer systems usually don’t know what sort ofsystem they want; they just want one that works. Some of them don’t evenwant a new system. They just know that there are a few problems here andthere.
So the job of the systems analyst is to find out what is good and what isbad about the system they currently have, and then design a new systemthat keeps the good things and gets rid of the bad things. Sounds simple,but it’s not.
To begin with, there are always gaps between the user and the systemsanalyst. The user understands the current system, but the analyst doesn’t.The analyst understands the new system, but the user doesn’t. How wellthe analyst and user work together to bridge these gaps will determine howsuccessful the new system is.
Effective communication between user and analyst is therefore vital. Theanalyst must involve the user in all stages of the systems analysis process.This will help bridge the gaps. But how will the user understand the com-plexities of systems analysis? After all, the user might not know muchmore about computers than how to type a memo or play golf.
That’s one problem. Here’s another. Can you believe what users tell you?Alice in Sales might have all kinds of reasons for telling you that she needsa new interactive, web-enabled, real-time, dynamic Orders system, but thereal problem might be that nobody wants to buy their products.
Then again, Alice’s boss might have a very different view of what anOrders system should look like (and cost!). There might be lots of ‘poli-tics’ going on which causes requirements to change. The systems analystneeds a method of avoiding these pitfalls. This brings us on tomethodologies.
1.4 Systems MethodologiesThe other thing to be aware of about systems is that they are all very com-plicated. Usually, they are too complicated for anyone to understandwithout tools and techniques to help them. This is where methodologiescome in. They’re there to help. If they don’t help, there’s no point in both-ering with them.
A methodology is a strategy for overcoming the problems faced by thesystems analyst. It’s made up of techniques, tools, conventions and docu-ments, and it lays down the tasks to be done.
It’s like cooking a meal. If you follow the recipe, you might end up withsomething edible. If you make it up as you go along, you usually end upwith a brown mess.
One type of methodology is called structured. Structured methodologiesare very popular with systems analysts. They are just like recipes forbuilding computer systems. They lay down steps that the analyst shouldfollow in a clear order. If the analyst follows these steps, then eventually aquality information systems design should be the outcome. Structured
Introduction to systems analysis 3

methodologies also allow the analyst to break down complex systems intosmaller, well-defined and well-documented chunks.
The most widely used structured methodology is SSADM.
1.5 SSADM – Structured Systems Analysis andDesign Method
SSADM contains in it some basic principles that should help overcome theproblems we’ve mentioned:
1 The first principle is the one just mentioned, about breaking downcomplex systems into chunks. This is called top down functionaldecomposition. It means that the analyst starts off just thinking aboutthe system as a whole. Small details are ignored to begin with until theanalyst has a grasp of the key features of the system. Later on, the ana-lyst will think about the more detailed lower levels of the system.
2 The scope of SSADM is clearly defined. The analyst starts off by lookingat the physical aspects of the current system. This means looking athow things are currently done and who does them. The analyst thenmoves on to look at what is currently done from a logical point of view.This completes the analysis phase, and then it’s on to design. The ana-lyst will consider what the new system should do and finally how itshould do it. This is as far as SSADM goes. This approach might be rep-resented as in Figure 1.2.
3 SSADM requires users to get involved from the start. This makes themmore committed to the process and more likely to be happy with thenew system. The analyst must meet the users regularly to sort out prob-lems and check understanding. Incidentally, this means that the ana-lyst should possess highly developed communication skills. These arepossibly the most important skills of all in systems analysis.
4 Systems analysis: a beginner’s guide
Physical
How? Who?
Physical
How? Who?
Logical
What?
Logical
What?
Current system New system
Analysis Design
Figure 1.2SSADM approach.

4 SSADM makes effective use of diagrams to help both the analyst andthe user understand the system. These diagrams should be simple andeasy to follow, like a map of the system.
5 SSADM allows the analyst to see the system from different views. Youcan then check to see if the different views match up. This is calledcross-checking.
6 SSADM has been around for a good many years. It’s an industry standard,so most analysts have used it. If your life depended on a system being suc-cessful, you might well use SSADM as the best bet to save your skin.
1.6 The structure of SSADMSSADM is made up of a number of Stages. These Stages are then divided upinto Steps. Figure 1.3 shows an overview of the Stages.
Introduction to systems analysis 5
SSADM Version 4+
Feasibility
Stage 0
Investigationof current
environment
Stage 1
Businesssystemoptions
Stage 2
Definition ofrequirements
Stage 3
Technicalsystemoptions
Stage 4
Logical design
Stage 5
Physical design
Stage 6
Figure 1.3SSADM Stages.

Stage 0: FeasibilityThis is where the analyst and users decide if the entire project is worth pur-suing. It involves the analyst considering the problems faced by the organi-zation and producing a set of options to resolve them. The users must thendecide whether the costs involved in resolving the problem are worth it. Itmay be that the problems are so severe that the organization simply has toresolve them. In this case, the feasibility study might be left out.
Stage 1: Investigation of the current environmentThis needs to be done so that the analyst and the users fully understandwhat the current system does. They need to be clear what problems theyhave and what they want from the new system.
Stage 2: Business system optionsThis Stage allows the analyst and users to come up with some ideas aboutwhat the new system might do. Usually, a range of options, with differentcosts and benefits, are considered. Users will need to be clear about theobjectives of the business before they can choose the option to proceedwith.
Stage 3: Definition of requirementsThis involves specifying the required system. During this Stage, the analystwill want to move away from the constraints of the current system andtowards a more logical, data-driven design. An overview of the underlyingdata structures for the required system is created.
Stage 4: Selection of technical system optionsBy now, the analyst and users will have a reasonable idea of what the newsystem will be expected to do. This allows them to consider the technicaloptions. For example, the key hardware components will need to be identi-fied and costed. The users will, eventually, choose from a range of options.
Stage 5: Logical designThis involves specifying the new system. What will the new system do?What might it look like from a user perspective?
Stage 6: Physical designThis Stage concentrates on the environment within which the new systemwill be running. It involves looking at storage requirements and perfor-mance issues.
At the end of each of these Stages, the analyst and users must decidewhether to press on to the next Stage, abandon the project, or redo one ormore Stages. All of these cost money.
6 Systems analysis: a beginner’s guide

1.7 SSADM and the Systems Development LifeCycle
SSADM isn’t the end of the story – it’s just part of it. The whole process ofsystems development goes further still. SSADM stops with the design ofthe new system, but systems development goes on. Most projects gothrough the stages outlined in Figure 1.4. This is the Systems DevelopmentLife Cycle.
However, even this may not be the end of the process, as organizationschange and it may soon be time to start the whole process again.
SummaryWe have described what systems analysis is and the need for a method-ology to help the analyst. We have described the most popular methodology– SSADM – and considered its advantages and how it fits into the SystemsDevelopment Life Cycle.
Introduction to systems analysis 7
Objectives
Feasibility
Analysis
Implementation
Design
Maintenance
SSADM
Figure 1.4The SystemsDevelopment LifeCycle.

Exercises1.1 What functions does the systems analyst perform during the SystemsDevelopment Life Cycle (SDLC)?
1.2 The SDLC is just one model for systems development. Find at least onemore and describe the differences.
1.3 Why has SSADM become an industry standard?
8 Systems analysis: a beginner’s guide

C H A P T E R 2
The current system
2.1 The approach in this bookIt is not the approach of this book to go through each SSADM Stage andStep in detail. Rather, the book focuses on the key techniques used at eachStage and applies them to a case study or two. Each technique will beexplained in simple steps using the case studies as examples.
The approach is to present a cut-down version of SSADM. This versionhas all the techniques and steps necessary for a successful systems analysisand design, but cuts out some of the repetition and over elaboration. Mostreal-world systems analysts use such a cut-down version.
2.2 The case studiesThere are two main case studies in this book. They are central to the bookand should be read carefully. The case studies concern the SwillbucketsCountry Club and the Medical Centre at the University of Life.
2.2.1 Swillbuckets Country Club
GeneralSwillbuckets Country Club is a club for the people of West Yorkshire. Eachweekend, the members roll up eager for refreshment and keenly antici-pating the entertainment booked by Jack Trout, the Swillbuckets Secretary.Some of the more popular acts include ‘Chucky Egg the Chicken Hypno-tist’, ‘Sharon Twain Entertains’ and ‘Jade Green and her DancingChihuahuas’.
Jack has a number of tasks to perform at Swillbuckets. As well asbooking the artistes, he also has to enrol new members, produce payslips topay the acts, advertise future events and chase up subscriptions. He also
9

prides himself on his choice of meat dishes at the events, though the chef,Freddo Smith, should take some credit. Not much, though.
The problem backgroundJack has always used a card-based data storage system to keep informationabout members and artistes – essentially two or three shoeboxes full ofdog-eared cards. Given the current popularity of Swillbuckets, thisshoebox system (SS) is no longer adequate. Jack has the option of openingup yet more shoeboxes or going computerized. These are the issues he isgrappling with.
A key problem that Jack is currently encountering revolves around mem-bers’ subscriptions. Amanda Stote (Assistant Subscriptions Supervisor –ASS) helps Jack collect the subscriptions. Amanda is not a patient person.She asked Jack two weeks ago for a list of all the members with overduesubscriptions. Jack has been unable to provide it, since it entails workingthrough the entire shoebox, checking all the expiry dates of members’ sub-scriptions and then writing out the list.
A second headache for Jack has been amending members’ records. Hehas favoured the White Fluid Approach To Amendment (WFATA). But theproblems are legion: applying the correction fluid, making a drink while itdries, forgetting to make the correction etc.
Jack also produces a monthly Forthcoming Events list, which he sendsoff to local media such as Farm to Table News and Trucks and Tractors.
Jack prides himself on the imaginative range of foodstuffs available atSwillbuckets. Jack is a connoisseur of meat, or, more specifically, offal. Helikes nothing better than tucking in to a sweetmeat or two of an afternoon.But the catering side of things is a real problem. Jack acquires his meatthrough a variety of suppliers. One of his main suppliers, TommyChillmore, often turns up round the back of the club with a bag of skinnedrabbits, or ducks. You never quite know what you’re going to get withTommy. Jack has to negotiate a price using techniques such as pointing outthat poaching is illegal. He pays Tommy in cash and stuffs the ‘fresh pro-duce’ in the freezer. None of this is ever recorded. The result is that Jack hasno real idea what is in stock at any given time.
This makes life difficult for Freddo Smitho, the chef. He comes in with arecipe in mind, specifically targeting the clientele for that evening’s event.For example, when Gypsy Ky-Lee performs, scrag end of mutton hashseems to be the meal of choice. Imagine Freddo’s horror when he discoversthat Jack has not ordered any mutton, but has a pigeon mountain instead.Often the menu has to be rewritten at the last minute.
Fortunately, some suppliers are more reliable and prefer to do thingsby the book. The local brewery, Cooper’s, is particularly diligent whenit comes to paperwork and deliveries are always punctual. However, Jackgets confused when trying to operate proper business arrangements withsome suppliers and a more relaxed approach to legal requirements withothers.
10 Systems analysis: a beginner’s guide

2.2.2 The Medical Centre at the University of Life
GeneralThe Medical Centre caters mainly for students and staff at the University ofLife. Registration takes place each year when new students take theirenrolment numbers to the Centre and register as patients. The Universitysends the Medical Centre a list of all students enrolled each year so thatthey can double check that a prospective patient is enrolled.
It is also possible for local residents to enrol if they live within the catch-ment area and if there is room on a doctor’s list.
Once a patient is enrolled, the Medical Centre sends details to the Gen-eral Practitioners’ Council (GPC). The GPC will then issue a new MedicalCard directly to the patient. If a patient leaves the Centre, the GPC must beinformed. The GPC will fund the Centre and pay salaries depending uponthe number of patients enrolled.
Patients can attempt to make an appointment at the Centre, though usu-ally their condition will have cleared up by the time the appointmentoccurs. Patients must then cancel their appointments or be open to publicridicule. A ‘name and shame’ list of patients who forgot to cancel appoint-ments is on display in the waiting room. If they do get to see a doctor, theywill be prescribed paracetamol or penicillin. This works fine in most cases,but the head lice epidemic shows no sign of abating.
In the rare cases where the doctors admit defeat, they will refer patients(if still breathing) to the local hospital. Alternatively, they might ask for asecond opinion. However, this will rarely be useful as they will already havetried paracetamol.
StaffThere are four doctors and a nurse. The nurse, Constance Payne, dealsmainly with vaccinations and repeat prescriptions. She is also responsiblefor ordering supplies when they get low. Supplies might be anything fromplasters to syringes.
Each doctor has a list of patients for whom he or she is the GP. However, itis possible for patients to see other doctors if their own doctor is not onduty.
There are two receptionists, George and Betty, and a trainee receptionist,Chelsea, who are responsible for dealing with patient queries and main-taining the Appointments Book. This is a very hit and miss affair, as the fol-lowing transcript shows:
ReceptionGeorge: I’ve got a girl on the phone, Betty. She wants to go on Doctor
Spock’s list.Betty: We haven’t got a Doctor Spock, George. He was on the telly,
funny ears, from outer space I think dear.George: That’s what I told her, she must mean Doctor Spackman.Betty: Ask her where she lives.
The current system 11

George: 47 Thomson Road.Betty: Never heard of it. Where’s the street map?George: Chelsea had it when she was looking for that boy’s address,
Dean was it?Betty: Oh yes, didn’t exist though did it. Shame for her. Still, she’ll
learn. Where is Chelsea?George: Eh?Betty: Where’s Chelsea?George: London, I think.Betty: Really? What’s she doing there? Has that Dean upset her
again?George: No that was last week. I’ll put her on Dr McLean’s list. He’s a
bit low, what with the court case and the flu jab mix-up.Betty: What’s this say in the Appointment Book? Mr Enkab Rolow?George: Looks like Nek Bralow to me.Betty: Hold on, this name’s been crossed out. There’s another one
squashed underneath – Conquest. That’s it Norman Conquest– daft name. Eh, George, look at this, Norman Conquest. Oh,hello Mr Conquest. Looks like you and Mr Bralow have gotthe same appointment. Would you mind waiting? You too MrsStote? Well I’m sure Dr. McLean will be here soon. Just take aseat. George, Mrs Stote’s records: where are they? She’s noteven down for an appointment but I daren’t tell her. She putthe butcher in hospital when he told her he had no trottersand would ribs do?
George: Don’t worry Betty love, I’m sure they’re here somewhere. Iremember seeing them. The cat had hold of them... where isit? Under the stairs, I think.
Betty: Mrs Stote’s records under the stairs!George: No the cat. I think Dr McLean had Mrs Stote’s records, or was
that the cat? I can’t remember. I can’t remember anythingthese days. Where am I?
Betty: Here they are, under the street map.George: The street map. Didn’t I want that? There’s a girl still on the
phone. Where’s the phone gone?
Problem backgroundThe problem areas can be summed up as:
� Appointments: chaotic, with double bookings, no room for urgentcases, and changes not made. A foolproof system of appointments is thetop priority for the Centre.
� Patient processing: the filing of records is haphazard. They can gomissing, or be misfiled. With such a high turnover of patients, therecords are not always maintained accurately. Much information isduplicated and often disparities appear. The doctors require a way of
12 Systems analysis: a beginner’s guide

viewing patient records without having to keep going backwards andforwards to see Betty and George. Prescriptions are normally illegible,which results in Heather in the chemists having to pop in regularly tohave them decrypted.
� management information: the GPC requires regular informationabout the hours doctors have worked, new patients, supplies used etc.Currently, Nurse Payne attempts to produce these, but mathematics isnot her strong point. The staff time sheets are a mess and staff often getpaid for hours they haven’t worked. The accountant is not happy aboutthis. Neither is the GPC.
The GPC also needs regular updates on currently enrolled patients. It isthe responsibility of the receptionists to record when patients leave andkeep a list of patients for each doctor. However, the University does nottell them when a student withdraws, and patients rarely think to informthem when they move away. The only information it gets is from the GPCwhen it issues a new Medical Card for another practice, or from the Reg-istrar of Deaths. Betty gets quite queasy when she has to tear up some-one’s medical records and throw them in the bin.
The Prescription Monitoring Agency also requires information aboutwhat prescriptions have been issued so that it can compare differentpractices and see who is out of line. It sends a report every six months tothe Centre. This is shredded and used as a home for the hamster.
The accountant requires regular financial information about outgo-ings. This is the bane of Nurse Payne’s life. A proper accounting system isrequired.
� Ordering supplies: on a more mundane note, Nurse Payne has no infor-mation about potential suppliers, other than the catalogues she keepsunder her desk. She may be paying too much for bandages etc. She iskeen to find out more about some recycled Crimean War bandages thather friend, Nurse Blunt mentioned to her.
� Registration: it has been known for the receptionists to take downdetails wrongly (e.g. ‘blood group’), or to omit key words such as‘haemophiliac’. These typing errors have had unnerving results. Also,George and Betty have had problems trying to determine who is eligibleto join the practice. A street map with felt tip lines on it has proven to be aless than adequate tool. Ideally, they want to be able to say instantantly ifa postcode is within their catchment area.
The remainder of this chapter will consist of an analysis of the two casestudies using structured systems analysis techniques. This chapter willfocus on the Medical Centre, though there will be some examples fromSwillbuckets also. We will assume that the feasibility study (Stage 0) hasgiven us the green light to go ahead. We are about to start Stage 1: Investi-gation of the Current Environment, as shown in Figure 2.1.
The current system 13

2.3 Investigation of the current environmentRemember that we are investigating the current environment so that wecan identify problems, record requirements and generally understandwhat the organization does. We will focus on the Steps needed to accom-plish this. Not all of the formal SSADM Steps will be covered.
2.3.1 Investigate and define requirements
As we work through the analysis of the current system, we need to be teasingout problems and requirements. Sometimes, these will be thrust in the ana-lyst’s face. On other occasions, they will be well hidden and only appearwhen it’s too late. All these problems and requirements need to be writtendown in the Requirements Catalogue. The Requirements Catalogue mightconsist of a collection of forms like the blank one shown in Figure 2.2.
14 Systems analysis: a beginner’s guide
SSADM Version 4+
Feasibility
Stage 0
Investigationof current
environment
Stage 1
Businesssystemoptions
Stage 2
Definition ofrequirements
Stage 3
Technicalsystemoptions
Stage 4
Logical design
Stage 5
Physical design
Stage 6
Figure 2.1SSADM Stage 1.

If we were to consider the Medical Centre case study, the first entry inour Requirements Catalogue might look like the one in Figure 2.3.
The P/R option requires the analyst to enter whether this is a problem (P)or a requirement (R). The Priority section requires a quick decision to bemade on the priority of the requirement. It may be that only the top priori-ties can be implemented, for example. Normally, these range from top pri-ority (1) to low priority (5).
The final section allows the analyst to link together problems andrequirements, if appropriate. So the problem in Figure 2.3 might well belinked to a requirement to introduce a computerized appointments systemwhich prevents double booking.
Typical problems that the analyst might look for are:
� The current system is unreliable in some way.
� The current system lacks integrity: it can’t be trusted to give accurateinformation.
The current system 15
System:
Author:
Date: Page of Draft/final
P/R No: Source: Priority:
Description:
Benefits if action taken:
Comments/suggested solutions:
Related probs/reqts/documents:
Problems/requirementscatalogue
Figure 2.2RequirementsCatalogue.

� The current system is easy to break into.
� The current system has no proper backup procedures in place.
� The current system does not perform adequately at peak times.
� The current system cannot be adapted to meet current and future needs.
Improvements in these areas might well be requirements of the new system.
2.3.2 Fact-finding techniques
It is worth considering what the best ways are for getting informationabout the system from users. Interviews are the main technique, but theanalyst has to be well prepared for these. It is no use turning up with ablank piece of paper and no plan. The analyst should set up interviews withone person at a time, at a specific time and date. The time and date must beat the user’s convenience. It is normally best to start with top management,as they have more of an overview of the organization.
16 Systems analysis: a beginner’s guide
System: Medical Centre
Author: Kevin Bowman
Date: 30/10/03 Page 1 of 1 Draft/final
P/R P No: 1 Source: Betty Priority: 1
Description:Double booking is occurring as a result of the Appointments Bookbeing hard to maintain accurately.
Benefits if action taken:No more arguments with Amanda Stote. Patients seen on time.Fewer complaints.
Comments/suggested solutions:Computerised Appointments Data Entry Form to include Patientscombo box and pre-formatted appointment slots.
Related probs/reqts/documents:Requirement 1DFD Appointments
Problems/requirementscatalogue
Figure 2.3RequirementsCatalogue entry.

It is very difficult to follow what someone is saying about their role in asystem when you are trying to write notes at the same time. It is mucheasier to record the interview and listen to it later, as long as the inter-viewee doesn’t mind. This allows the analyst to think about the user’s com-ments and pursue different lines of enquiry more effectively.
It is preferable to have a few key questions prepared in advance, though itis important that users are allowed to talk about what is important to them.
The analyst must be careful not to create conflict and mistrust by dis-cussing with users what other users have said. Similarly, the analyst mustnot prejudge the issue and tell users what sort of system they might be get-ting. Interviewing users is a difficult skill, acquired mainly by experience.Beginners should keep it simple and not be afraid to go back forclarification.
It is also useful to be able to consider the current system by looking at theexisting paperwork. This can give many insights into the problems of thecurrent system, as well as indicating what data flows around the system.Forms and files have the advantage of being unbiased and they do not har-bour grievances against colleagues – unlike users.
So, grab as many forms, files and scraps of paper as you possibly can onyour visits to the organization – with the users’ agreement, of course.
2.3.3 Investigate current processing
This Step also involves fact-finding, but focuses on producing models ordiagrams of the processing in the current system. The key technique here isData Flow Modelling.
Data Flow ModellingData Flow Modelling allows the analyst to get a picture of the currentsystem and think about the required system. It involves producing anumber of diagrams which show how the current system works and whatthe required system might do. Figure 2.4 models this process.
At this stage of SSADM, the diagrams include: context diagrams, docu-ment flow diagrams and Data Flow Diagrams (DFDs). Of these, DFDs arethe most important, so we’ll start with those.
The current system 17
Currentphysical
Requiredphysical
Requiredlogical
Currentlogical
Physicalview
Logicalview
Currentview
Requiredview
Figure 2.4Data modelling inSSADM.

Data flow diagramsData flow diagrams are central to SSADM. They show the processesinvolved in the current (and required) system, what data is involved, andwhere the data goes to. DFDs are about processes, primarily things that aredone – activities. If someone asked you to list the activities involved in, say,getting out of the house in a morning, you might produce these: getting outof bed, washing, shaving (optional), getting dressed, eating breakfast,checking the time, leaving the house. Notice that these all contain verbs,because they are activities. If you put this list into the form of a diagram,you might end up with something like Figure 2.5.
This has much in common with a DFD. It includes the activities andany data which is needed to perform the activities. For example, the cor-rect time is needed in order to know when to ‘leave the house’. This kindof data flow, into and out of activities, is very common in DFDs. So DFDsare nothing to fear: they are a tool to help the analyst understand thesystem.
DFDs show how information is created, altered or moved around by thesystem. They also show how it is received into the system and stored.
Data flow diagram conventionsThere are four elements to a DFD. These are:
� Processes (or activities)
� Data flows
� External entities
� Data stores
18 Systems analysis: a beginner’s guide
Get upGet washed
Shave
Dress yourself
Eat breakfast
Leave thehouse
Check the time
Figure 2.5Morning activities.

ProcessesThe processes show an activity carried out by someone in the organizationwhich involves data in some way. They take the form of a box with theactivity inside. The activity always starts with a verb, such as ‘Pay artistes’at Swillbuckets. The processes are numbered in the top left-hand corner.This is just to identify the process: it does not mean that process number 1must be done first. The person, or department, who does the activity,appears in the top right section of the box, as in Figure 2.6.
Data flowsData flows show the movement of data around the system. They take theform of an arrow which shows the direction of the data. Data flows shouldbe labelled to show exactly what data is flowing. For example, ‘medicalcard’ might be the label attached to a data flow in the Medical Centre.
External entitiesThese are people or organizations outside of the system being investigated.They will send data into the system or receive data from it. At Swillbuckets,‘artiste’ would be an external entity, as would ‘brewery’. They are shown inthe form of ovals with a label inside. If the same entity appears more thanonce on a diagram, it has a line through it. Figure 2.7 shows the entity‘member’.
Data storesThese are places where data is stored. For example, an Orders file would bea data store. Jack Trout’s members’ shoebox at Swillbuckets is a data store,and so is Betty and George’s Appointment Book at the Medical Centre.Data stores are represented by open-ended rectangles with a unique refer-ence and a label. Normally, at this stage, the reference will begin with ‘M’for ‘Manual’. Figure 2.8 shows how Jack’s members’ shoebox might look.
The current system 19
1 Secretary
Enrol newmember
Identifier Who?
Activity
Figure 2.6Process box.
MEMBER MEMBER
Entity appears once Entity appears more than once
Figure 2.7External entities.

So, now we know the components of a DFD, let’s see what they look likewhen we put them together. Figure 2.9 shows part of a DFD forSwillbuckets and Figure 2.10 shows part of one for the Medical Centre.Note that these are not yet complete DFDs.
Data flow diagram rulesThe analyst needs to be aware of some rules which apply to DFDs. Theserules exist not to make life difficult, but to ensure consistency indiagramming.
Process rules� Processes must have both inputs and outputs. If there is no input, but
there is an output, then the output has been created from thin air. Sadly,this does not happen. If there is an input but no output, then the processis a waste of everyone’s time and should be scrapped.
Data flow rules� Data flows must go through a process box. It is not allowed to have a data
flow going directly from an external entity to a data store, for example.
20 Systems analysis: a beginner’s guide
M1 Members’ detailsFigure 2.8Data store – Jack’sshoebox.
1 Secretary
Enrol newmember
MEMBER
mem
bershipform
M1 Members’ details
mem
bers
hip
form
Figure 2.9Partial DFD –Swillbuckets.

External entity rules� The label must be a noun, e.g. SUPPLIER.
Data store rules� A data flow into a data store means update the data store.
� A data flow from a data store means retrieve data from the data store.
Context diagramThis is the first diagram we draw. We only need to draw one of thesebecause it shows the entire system. In order to prevent it looking too com-plicated, we might summarize the key data flows. All the processes in thesystem are contained in one process box. The aim is to get an overview ofwhich external entities send or receive data from our system at present. Inother words, a context diagram is a tool to establish the scope of the systemunder investigation. It is similar to a DFD, but does not obey the rulesoutlined above.
Document flow diagramThis follows on from the context diagram. It looks inside the one processbox in the context diagram and breaks it up into departments or areas ofwork. It also allows us to show exactly which parts of the overall system weare going to investigate. Some parts might not need looking at.
The current system 21
1 Receptionist
Create newappointment
PATIENT
appointment request
M4 Appointments Book
appointm
ent
available appointments
appointment
Figure 2.10Partial DFD – MedicalCentre.

2.3.4 Simple steps in data flow modelling
The main tasks to be completed, in order, are:
1 Draw a context diagram.
2 Draw a document flow diagram.
3 Draw a top-level data flow diagram.
4 Draw lower level data flow diagrams.
These main tasks will be split up into a number of smaller, simple tasks. Anexample from the Medical Centre will be given at each stage.
1 List of external entitiesMake a list of all the things (entities) external to our organization which senddata to us or receive data from us. The Medical Centre list might consist of:
� Patient: the Centre will receive all kinds of data from patients, such asappointment requests.
� University: the Centre receives a list of new students.
� General Practitioners Council: the Centre sends to the GPCtimesheets for the work done by the receptionists and the Nurse. Doctorsare paid according to the number of patients on their list. The Centrereceives pay slips from the GPC.
� Supplier: Nurse Payne will send orders for supplies and receive invoices.
� Hospital: the Centre sends referrals to the hospital and receives reportson treatment at the hospital.
� Prescription Monitoring Agency: the Centre sends the PMA data onprescriptions and receives reports on the practice for prescribing drugsnationally.
� Accountant: the Centre sends regular financial information andreceives reports.
You may wish to draw a table like that in Table 2.1. Remember to draw itfrom the point of view of the system under investigation.
2 Draw the context diagramThis follows easily from the table: see Figure 2.11.
Notice that a dashed line has been drawn between GPC and the Patient,to show the Medical Card. A dashed line can be used in this way to showdata flows between external entities which are felt to be important enoughto show.
3 Identify internal areas/departmentsHaving considered the external data flows, we move on to the internal oneswhich will appear in the document flow diagram. We need to identify the
22 Systems analysis: a beginner’s guide

internal areas which might send data between themselves. For example, ina college or university the areas might be: Department, Student, Tutor,Admin, Support and so on. In the Medical Centre, the areas might be:Reception, Doctor and Nurse. We need to separate Doctor and Nursebecause they perform different tasks for the Centre. We also need to iden-tify the data flows between these areas, as we did with the Context Dia-gram. You could draw a table as in the previous section, but in this case it’sfairly simple, so we’ll draw the diagram.
4 Draw the document flow diagramThe document flow diagram need not just consist of documents. Confus-ingly, it can include any type of data flow – electronic, word of mouth, or, inGeorge’s case, arm-waving histrionics which communicate very little.Nurse Payne, on the other hand, can sometimes communicate a hugeamount of information with just one look. It differs from a data flow dia-gram in that it does not include any processes, as shown in Figure 2.12.
The system boundary has been added to show exactly what areas we areconcerned with in the Medical Centre. All entities outside of the dashedline are external entities. It should be obvious from the Context Diagramwhich areas are outside our system. With the user’s agreement, it is theanalyst’s role to investigate the internal entities. In this case, they areRECEPTIONIST, DOCTOR and NURSE.
The current system 23
External entity Data flow Sends (S) or Receives (R)
Patient Registration form R
Appointment request R
Appointment S
Prescription S
GPC Payslips R
Patient lists S
Timesheets S
University Student lists R
Hospital Referral S
Referral results R
PMA Prescriptions S
Prescription reports R
Suppliers Catalogues R
Orders S
Invoices R
Accountant Financial details S
Finance reports R
Table 2.1 Data flows and entities.

5 Convert the document flow diagram into a top-level data flow diagram� Start with the document flow diagram.
� Focus on the sources/recipients (ellipses) inside the boundary. In ourexample (Figure 2.12), these are: Doctor, Nurse and Reception. Now lookat the data flows coming into and going out of these ellipses.
� What processes generate these data flows? What are the main processescarried out by Doctor, Nurse and Reception?
� Let’s take Reception – we might start with the data flow ‘appointment’.What process generates this ‘appointment’? Remember that we’re tryingto be general at the moment, so we could identify a process called ‘Pro-cess Appointment’. This would cover a number of our data flows.
� Another data flow is ‘registration form’. What process generates ‘regis-tration form’? Being general again, we might call it ‘Register Patient’.
� Other data flows are ‘prescription’ and ‘referral’. What processes gen-erate these? They could be brought together under the process ‘ProcessPatient Requirements’.
24 Systems analysis: a beginner’s guide
Medical CentrePatients
AppointmentsPay staff
Make prescriptions
PATIENT
SUPPLIER
GPC PMA
UNIVERSITY
ACCOUNTANT
registration form
appointment request
appointment
prescription
payslip
patient list
studen
t list
prescriptionreport
prescription
finan
cial re
port
finan
cial d
etails
order
catalogue
invoice
medicalcard
HOSPITAL
refe
rral
resu
lt
refe
rral
Figure 2.11Context diagram forthe Medical Centre.

� Many of the other data flows concerning Reception are sending orreceiving information to or from external organizations like the GPC.These could all come under the umbrella of a process called ‘ProcessManagement Information’. That covers Reception. In fact, the only dataflows not covered by these general process headings are the Nurse’s deal-ings with suppliers. We could put these data flows into a process called,say, ‘Maintain Supplies’.
� Put these general processes together in one diagram and we have ourDFD. For the sake of simplicity, data stores can be left out of this top-leveldiagram. They will appear in the lower level diagrams.
We now have an overview DFD. This is normally called a Level 1 DFD.Figure 2.13 shows the complete Level 1 DFD.
Notice that the GPC entity has a line through it to indicate that it appearsat least twice in the diagram. The label ‘Current Physical DFD’ indicates thatthe diagram shows the current state of affairs and that we are looking at the
The current system 25
registrationform
appointment req.
medical card
PATIENT
GPC
PMA
UNIVERSITY
ACCOUNTANT
appointment
prescription
prescriptionfinan
cial
repo
rtfin
anci
alde
tails
HOSPITAL
refe
rral SUPPLIER
orde
r
cata
logu
e
invo
ice
NURSE
RECEPTION
stud
ent
list
DOCTOR
PMA rep
ort
refe
rral
resu
lt
PMA
report
referral result
financial report
prescription
paysliptim
esheet
paysliptimesheet
patient list
financial details
Figure 2.12Document flowdiagram for theMedical Centre.
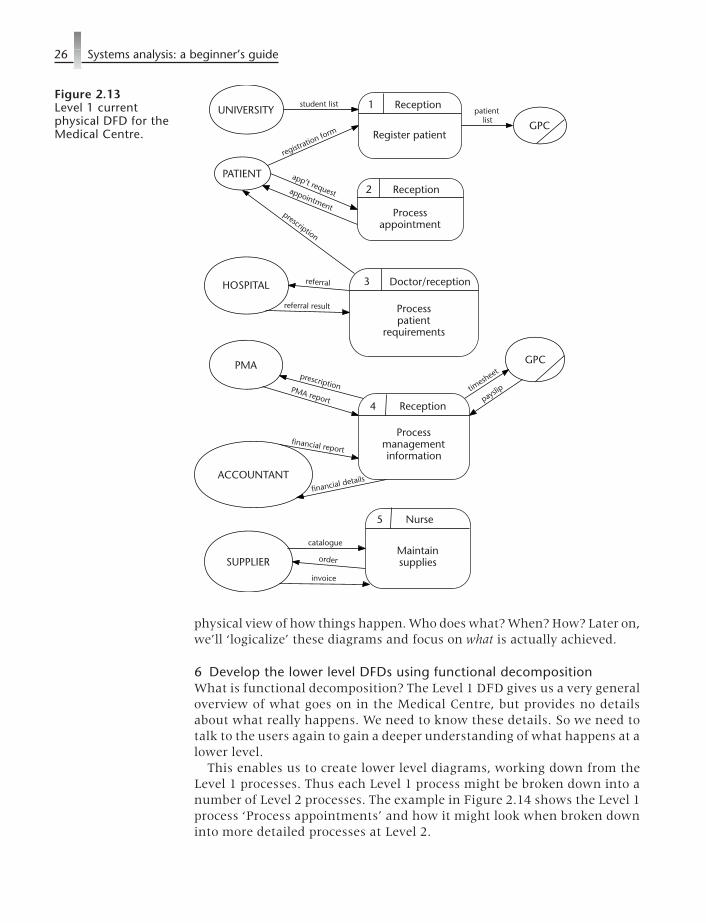
physical view of how things happen. Who does what? When? How? Later on,we’ll ‘logicalize’ these diagrams and focus on what is actually achieved.
6 Develop the lower level DFDs using functional decompositionWhat is functional decomposition? The Level 1 DFD gives us a very generaloverview of what goes on in the Medical Centre, but provides no detailsabout what really happens. We need to know these details. So we need totalk to the users again to gain a deeper understanding of what happens at alower level.
This enables us to create lower level diagrams, working down from theLevel 1 processes. Thus each Level 1 process might be broken down into anumber of Level 2 processes. The example in Figure 2.14 shows the Level 1process ‘Process appointments’ and how it might look when broken downinto more detailed processes at Level 2.
26 Systems analysis: a beginner’s guide
1 Reception
Register patient
2 Reception
Processappointment
PATIENT app’t requestappointment
registration form
UNIVERSITYstudent list
GPCpatient
list
3 Doctor/reception
Processpatient
requirements
prescription
HOSPITAL referral
referral result
PMA
4 Reception
Processmanagementinformation
prescriptionPMA report
GPC
timesh
eet
payslip
ACCOUNTANT
financial report
financial details
5 Nurse
MaintainsuppliesSUPPLIER
catalogue
invoice
order
Figure 2.13Level 1 currentphysical DFD for theMedical Centre.

These Level 2 processes must now be incorporated into a full DFD foreach Level 1 process. So, in our example, we will need five Level 2 DFDs,because there are five Level 1 processes to decompose.
This decomposition process can continue to even lower levels. It may bethe case that some processes are still not fully broken down even at Level 2.For example, in Figure 2.14 there is a Level 2 process called ‘Receiveappointment request’. This is a little vague. We could make this processclearer by breaking it up as shown in Figure 2.15.
And so on. We may even want to break down one or two of these pro-cesses to make them absolutely clear. It is unlikely, even in the most com-plex systems, that we would ever go below Level 4. The lowest levelprocesses are known as elementary processes.
When drawing the lower level DFDs, we must now incorporate the datastores. These were omitted from the Level 1 DFD, simply to avoid over-loading the diagram. We must also ensure that every data flow and entityon the Level 1 diagram appears somewhere on the lower level ones.
So, let’s draw the Level 2 DFDs for the Medical Centre at the University ofLife. The first one we’ll do is for the Level 1 process ‘Register Patient’. Thiswill contain in it four sub-processes numbered 1.1 through to 1.4 (Figure2.16).
Notice that in Figure 2.16 a numbering system is used. This is necessaryso that each process has a unique identifier. The system is easy to follow:the Level 1 number comes first, then the Level 2 number and so on.
The current system 27
Processappointments
Create newappointment
Receiveappointment
request
Checkappointment
book
Functional decomposition
Changeappointment
Level 1
Level 2
Figure 2.14Decomposition ofDFDs – Levels 1 and2.
Processappointments
Create newappointment
Receiveappointment
request
Checkappointment
book
Functional decomposition
Changeappointment
Check urgencyof condition
Take patient’sname
Check if patientregistered
Level 1
Level 2
Level 3
Figure 2.15Decomposition ofDFDs – Levels 1, 2and 3.

A couple of things may need explaining in Figure 2.16. Process 1.1 – ‘Filestudent list’ – has a data flow from the University. The data flow is the listof new students who have enrolled that year. All Process 1.1 does is to takethe list and file it. Even Betty and George can manage that. The list is filedin a data store. In this case it is ‘M1 – Student Lists’. ‘M’ stands for ‘man-ual’. It’s a manual store, not an electronic one. It’s the first data store we’veidentified, so that’s why it’s ‘M1’.
Data stores can take many forms. Normally, they will be files or ledgers,that kind of thing. But they could also be forms, catalogues, noticeboards,or anywhere data is held.
This DFD is very simple; none of the processes have more than two orthree inputs and outputs, so there is no need to break it down further.These four processes can now be described as elementary processes, i.e.they don’t need simplifying.
28 Systems analysis: a beginner’s guide
1.1 Reception
File student list
1.2 Reception
Processregistration form
PATIENTregistration form
UNIVERSITYstudent list
1.3 Reception
Add patient todoctors’ list andpatient records
1.4 Reception
Inform GPC
GPCpatient details
medical history
M1 Student lists
student list
student list
M2 Catchment area
doctor name
M4 Doctors’ list
patient
M5 Patient records
patient details
med
ical
card
M6 Medical records
medical history
M3 Registration forms
registration form
patient details
registration form
Figure 2.16Level 2 DFD ‘RegisterPatient’.
TEAM FLY
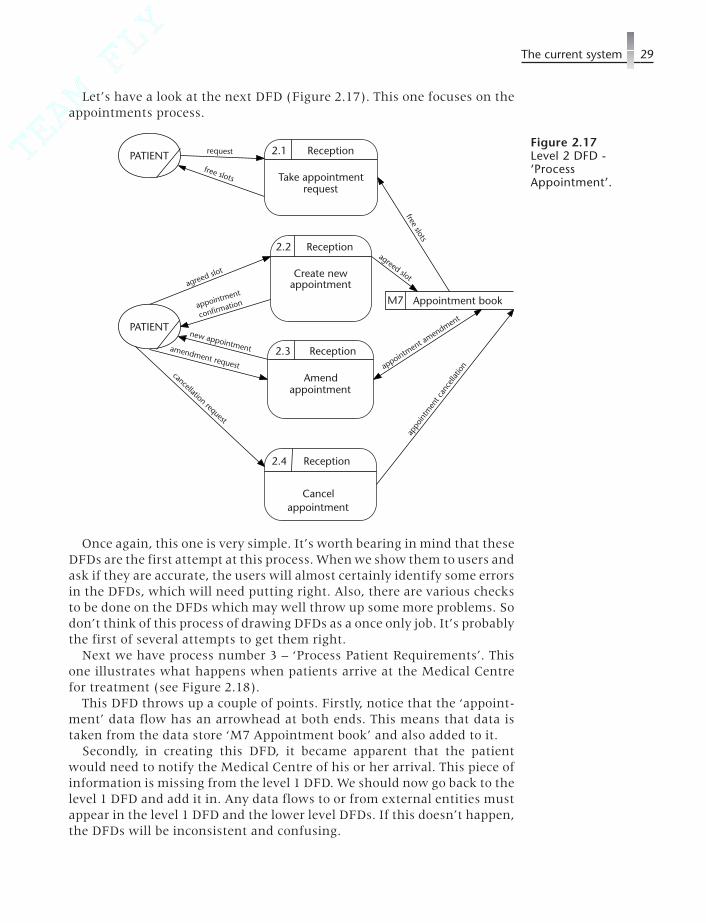
Let’s have a look at the next DFD (Figure 2.17). This one focuses on theappointments process.
Once again, this one is very simple. It’s worth bearing in mind that theseDFDs are the first attempt at this process. When we show them to users andask if they are accurate, the users will almost certainly identify some errorsin the DFDs, which will need putting right. Also, there are various checksto be done on the DFDs which may well throw up some more problems. Sodon’t think of this process of drawing DFDs as a once only job. It’s probablythe first of several attempts to get them right.
Next we have process number 3 – ‘Process Patient Requirements’. Thisone illustrates what happens when patients arrive at the Medical Centrefor treatment (see Figure 2.18).
This DFD throws up a couple of points. Firstly, notice that the ‘appoint-ment’ data flow has an arrowhead at both ends. This means that data istaken from the data store ‘M7 Appointment book’ and also added to it.
Secondly, in creating this DFD, it became apparent that the patientwould need to notify the Medical Centre of his or her arrival. This piece ofinformation is missing from the level 1 DFD. We should now go back to thelevel 1 DFD and add it in. Any data flows to or from external entities mustappear in the level 1 DFD and the lower level DFDs. If this doesn’t happen,the DFDs will be inconsistent and confusing.
The current system 29
2.1 Reception
Take appointmentrequest
PATIENT
agreed slot
PATIENT request
2.3 Reception
Amendappointment
2.4 Reception
Cancelappointment
M7 Appointment bookfree
slots
agreed slot
appointment
confirmation
appo
intm
ent c
ance
llatio
n
free slots
2.2 Reception
Create newappointment
amendment request appointment am
endment
cancellation request
new appointment
Figure 2.17Level 2 DFD -‘ProcessAppointment’.

Sometimes the level 2 DFD contains a process which is quite complexand may have several data flows into it and out of it. The next DFD (Figure2.19) contains such a process.
Process 4.3 – ‘Process staff income/expenses’ – has three data flows intoit and two coming from it. This is a little complex, though some analystswould be happy to leave it alone. However, we will draw a Level 3 DFD toclarify the process.
There is another issue with this DFD. We have a data flow called ‘form’coming from ‘M11 Expenses forms’. However, nowhere in our DFDs isthere a data flow into this data store. So we are taking something from itwithout ever putting anything into it. Sadly, that kind of thing can’thappen. We may therefore need to invent a new process called somethinglike ‘Update staff expenses’, where we add the expenses forms to the datastore. Or we could amend Process 4.2 so that it becomes ‘Update stafftimesheets and expenses’.
30 Systems analysis: a beginner’s guide
3.1 Reception
Process patientarrival
HOSPITAL
notification
3.3 Doctor
Prescribetreatment
M7 Appointment book
appointment
3.2 Doctor
Diagnoseillness or refer
M6 Medical records
records
symptoms
referral diagnosis
diagnosisreferral result
PATIENT
PATIENT
prescription
M8 Prescriptions
prescription
treatment
3.4 Nurse
Create repeatprescription
requestpres
criptio
n
repeat
prescri
ption
repeat prescription
Figure 2.18Level 2 DFD –‘Process PatientRequirements’.

Anyway, Figure 2.20 shows how Process 4.3 might look when decom-posed to Level 3.
Once again the creation of the DFD reveals something missing. This timeit’s a data store to store copies of the pay claims sent to the GPC. This wouldbe necessary in case of queries about the pay claims. For example, the GPCmight wonder why they are paying the doctors so handsomely when allthey do is dispense paracetamol.
The current system 31
M12
expenses
M11 Expenses forms
form
ACCOUNTANT
4.4 Nurse
Compileincome/expense
data
Budget
financial details
report
4.5 Reception
Compileprescription
dataPMA
prescriptiondetails
M8 Prescriptions
prescrip
tion
report
4.3 Reception
Process staffincome/expenses
payslip
GPC pay claim
M9 Timesheets
timesheet
4.2 Reception
Collate stafftimesheets
M10 Work rota
rota
timesheet
4.1 Nurse
Create workrota
rota
previous rotaconstraint
Figure 2.19Level 2 DFD –‘Process ManagementInformation’.

The final Level 2 DFD (Figure 2.21) focuses on Nurse Payne’s role as con-troller of supplies for the Medical Centre.
Our current physical DFDs are now complete. They should give us a pic-ture of what the Medical Centre currently does. They should be under-standable and be useful as a communications tool with the user. However,there are limitations with DFDs. They don’t do everything (which is whywe need other techniques). Here are a few limitations:
32 Systems analysis: a beginner’s guide
4.3.2 Reception
Compile payclaim
M14 Pay cabinet
4.3.1 Reception
Check timesheet
M9 Timesheets
M10 Rota
timesheet
rota
checkedtimesheet
GPC
pay claim
payslip
4.3.5 Reception
Compile monthlyexpenses
M11 Expenses forms
form
M12 Budget
expenses
4.3.3 Reception
Post pay claim
paycla
im
pay claim
4.3.4 Reception
Receive anddistribute payslip
pays
lip
Figure 2.20Level 3 DFD.

� They don’t show us how the data is structured.
� They don’t show the effect of time or sequence.
� They may not help communicate with the user – they may be toocomplex.
� They take a long time to draw and redraw.
� They may never be complete
While these limitations are real enough, the experienced analyst can useDFDs as a useful tool and not allow the limitations to become a problem.
The set of DFDs for the Swillbuckets Case Study are shown in Figures2.22–2.29.
The current system 33
5.2 Nurse
Order newsupplies
SUPPLIER
5.4 Nurse
Pay invoice
5.3 Nurse
Receive deliveryand invoice
SUPPLIER
M12 Budget
product details
invoice
5.1 Nurse
Update suppliersfile
M13 Suppliers file
catalogue catalogue
order
order
order
budget info
expenditure
invoice
paymentreceipt
receipt
M13 Supplier’s file
Figure 2.21Level 2 DFD.

SummaryIn this chapter, we have considered the techniques required to analyse asystem. Communications skills and data flow modelling have been thefocus. The two case studies have been introduced. In the next chapter welook at modelling the data structure.
34 Systems analysis: a beginner’s guide
MEMBER
MEDIA
BREWERY
ARTISTE
deliv
ery
note
orde
r
SUPPLIER
order
invoice
invo
ice
paym
ent
payment
rece
ipt
book
ing
conf
irmat
ion
pays
lip
enrolment form
enrolment form
events list
events list
subscription
overduerem
inder
SwillbucketsManage events
MembersBook artistes
Prepare meals
Figure 2.22DFDs for theSwillbuckets casestudy (1).

The current system 35
MEMBER
MEDIA
BREWERY
ARTISTEde
liver
yno
te
orde
r
SUPPLIER
order
invoiceSECRETARY
(JACK)
invo
ice
paym
ent
payment
rece
ipt
book
ing
conf
irmat
ion
pays
lip
enrolment form
enrolment form
events list
events list
subscription
overduerem
inder
Figure 2.23DFDs for theSwillbuckets casestudy (2).

36 Systems analysis: a beginner’s guide
1 Secretary
Processmembership
ARTISTE
MEMBER
enrolment form
3 Secretary
Order drinksand supplies
4 Secretary
Processpayments
M1 Members’ shoebox
subscription
enrolment form
2 Secretary
Book artistes
5 Secretary
Manage events
enrolment formoverdue reminder
booking form
booking form
M2 Artiste shoebox
SUPPLIER
M3 Supplier shoebox
order
invoice
delivery note
payment
delivery
note
MEDIA
MEMBER
events list
events list
M2 Artiste shoebox
delivery note
M4 Events folder
M5 Recipe book
dish details
cancellation
booking form
artiste details
cancellation
ARTISTEpayment
booking form
M4 Events folder
event
artiste
supplier
event
requirements
Figure 2.24DFDs for theSwillbuckets casestudy (3).

The current system 37
1.1 Secretary
Issueenrolment form
MEMBER
enrolment form
1.3 Secretary
Issue overduesubscription
reminder
1.4 Secretary
Closemembership
M1 Members’ shoebox
enrolment form
1.2 Secretary
Processsubscriptions
enrolment form
overdue reminder
subscription
overdue member details
subscriptionrequest
subscr
iption
member
details
MEMBER
M1 Members’ shoebox
subscriptionsubscription
member
details
notice of closure
Figure 2.25DFDs for theSwillbuckets casestudy (4).

38 Systems analysis: a beginner’s guide
2.1 Secretary
Select artistefor event
ARTISTE
2.3 Secretary
Issue bookingform
2.4 Secretary
Write letter ofconfirmation
M2 Artiste shoebox2.2 Secretary
Contactpossibleartistes
booking form
booking form
event details
ARTISTEM4 Event shoebox
booking form
booking form
booking formletter
M4 Event folder
event details
artiste details
2.5 Secretary
Processcancellation
cancellation
cance
llatio
n
Figure 2.26DFDs for theSwillbuckets casestudy (5).

The current system 39
3.1 Secretary
Check food anddrink supplies
KITCHEN
3.3 Secretary
Place orderwith supplier
3.4 Secretary
Processdelivery
M4 Event folder
3.2 Secretary
Evaluatesuppliers
order
supplier details
SUPPLIER
delivery note
M3 Supplier shoebox
BARrequirements
requirements
supplies information
M3 Supplier shoebox
delivery note
order
Figure 2.27DFDs for theSwillbuckets casestudy (6).
4.1 Secretary
Pay supplierSUPPLIER
M3 Supplier shoebox
supplier detailsdelivery note
payment
4.2 Secretary
Pay artiste
M2 Artiste shoebox
artiste detailsbooking form
paymentARTISTE
Figure 2.28DFDs for theSwillbuckets casestudy (7).

Exercises2.1 Draw DFDs for each of these scenarios:
(a) A customer goes into a bookshop and asks for this book. The member ofstaff looks for the book in the online stock catalogue and reports thatthe book is sold out.
(b) Every month, the Medical Centre receives a list of current drugs avail-able from the drug companies. These lists are collated into a catalogueof drugs which is copied and given to each doctor.
(c) Swillbuckets orders a crate of Babycham from the brewery. Jack Troutfills in an order form and sends copies to the brewery and the barman.The original is kept in the Orders shoebox. When the order arrives, thedelivery note is checked against the order form by the barman. If the
40 Systems analysis: a beginner’s guide
MEMBERM2 Artiste shoebox
list
5.2 Secretary
Choose dish
M5 Recipe book
booking form
MEDIA
5.1 Secretary
Createforthcomingevents list
M4 Events folderlist
5.3 Chef
Record dishdetails
M4 Events folder
5.4 Secretary
Check artisterequirements
ARTISTE
M2 Artiste shoebox
requirementsrequirements
event
artiste
recipedish
dish
Figure 2.29DFDs for theSwillbuckets casestudy (8).

delivery matches the order, the barman signs the delivery note andattaches it to the order. He sends this to Jack.
(d) Decompose the diagram for part (c) into two lower level DFDs, oneshowing the order process and one showing the delivery process. Com-pare them with the top-level DFD in (c).
2.2 Draw a physical DFD to model this vet practice scenario.Hallam Vets consists of two vets plus a receptionist. Both vets maintainrecords of treatment sessions. In addition, they maintain detailed animalrecords held in reception. When an owner arrives with an animal, thereceptionist enters new animal details if the animal has not been seenbefore. The receptionist also reminds owners if their account needs paying,and receives payments where offered. She records details of payments.
Patients may send payments by cheque in the mail, or pay by cheque orcash at reception. Payments are banked daily. Once a week the receptionistchecks the payments. She updates the ledgers and records the updated bal-ance on the owner’s records. She sends reminders to owners with out-standing balances. Once a year, a breakdown of treatment has to beprepared by each vet and despatched to the Department of Animal Welfare.
The current system 41

C H A P T E R 3Modelling thedata structure
3.1 Entity modellingEntity modelling is another technique used in Stage 1 of SSADM. As justmentioned in Chapter 2, DFDs show the processes, or functions, involvedin a system. They don’t tell us much about the structure of the data: whatcategories of data, for example, there might be in the system. For thisaspect of the system, we need to produce an entity model (or Logical DataModel). This model shows the actual data used by an organization and howit links together. Before we look in more detail at entity modelling, let’s beclear what we mean by certain terms.
3.1.1 Entities
Entities are things we might want to keep information about. They are usu-ally types of people like CUSTOMER, or objects like PRODUCT. Jack Troutcan’t move for all the entities at Swillbuckets Club. They’re everywhere. Heneeds to keep information about MEMBERS, RECIPES, EVENTS,ARTISTES and so on. These are all entities. There are four tests we coulduse to decide whether or not something is an entity:
1 An entity must be important to the organization.
2 An entity must have at least one attribute (see below).
3 An entity must occur more than once – so if MEMBER is to be classedas an entity, there must be more than one member of Swillbuckets. For-tunately, there is more than one, though this could change when theHealth Inspectors visit next month.
4 Each entity occurrence must be uniquely identifiable – so we must beable to uniquely identify each member if MEMBER is an entity. Thiscan be done through a Membership Number, for example. Similarly, we
42

could identify a RECIPE through its unique Recipe Name or RecipeNumber if there are many of them.
Entities are represented by rectangles with rounded corners in EntityModels, as shown in Figure 3.1. The name of the entity is always singular.
3.1.2 Attributes
Each entity has a number of attributes. These are bits of data associated withthe entity. If we take the entity MEMBER at Swillbuckets, we might identifyMember Name as an attribute of MEMBER. Other attributes might be:
� Membership Number
� Member Address
� Date of Birth
� Type
� Seconder
� Renewal Date
So the full record for a member, when we add in all the data, might look likethat in Table 3.1.
3.1.3 Keys
A key is a way of identifying something – an entity or form or whatever.Your key is your name, usually. It’s how other people identify you. But it’snot a brilliant key, because there will be lots of people with the same nameas you (unless you’re called Amanda Stote). A better key to identify youwould be your National Insurance Number (if you live in the UK). It’sunique. There are never two the same. That’s why you have it. Similar keyscan be identified for people living in other countries.
Modelling the data structure 43
MEMBERFigure 3.1The MEMBER entity.
Attribute Data
Member Name Malcolm Sprotdale
Membership Number 3421
Member Address 1 Cemetery Road, Wigginton
Date of Birth 5 October 1912
Type Free
Seconder Herbert Woodcock
Renewal Date 6 May 2003
Table 3.1 A full membership record.

Alternatively, your key could be your name combined with your addressas a way of identifying who you are. After all, there are not likely to be twoWill Winterbottoms living at Hag End Farm, though it’s not impossible.The problem is that people move house, whereas a National InsuranceNumber always stays the same.
We’ve just seen that an entity is made up of a number of attributes. Toidentify that entity, we need a key. Let’s think of the entity MEMBER. Itmay be that Member Name could be the key, but, as we’ve seen, names ontheir own are not enough. So we could combine it with Member Addressand that would do the trick. This would be a composite key, which meansthat there is more than one attribute involved in the key.
However, a better key would be Membership Number. This uniquelyidentifies all the MEMBERs. Indeed, that is it’s only purpose. This thenwould be the primary key. It’s a simple key, which means it’s made up ofjust one attribute.
3.1.4 Relationships
Entities do not exist in isolation in most systems. They have relationshipswith other entities. If we think about Swillbuckets, we can see thatMEMBER, EVENT and ARTISTE are all linked together. For example,
� Artistes entertain Members
� Members attend Events
� Artistes perform at Events
Similarly,
� Students attend Classes
� Students have Tutors
� Tutors give Classes
� Doctors treat Patients
� Patients make Appointments
� Doctors attend Appointments
The entities are all related in these examples. They are joined together bya verb which describes the relationship between them.
In an entity model, related entities are joined by a line, as in Figure 3.2.
Relationship typeUnfortunately, there are three different types of relationship. These are:
44 Systems analysis: a beginner’s guide
MEMBER EVENTFigure 3.2Related entities.

� one-to-one (1:1)
� one-to-many (1:M)
� many-to-many (M:N)
A one-to-one relationship is fairly unusual. An example might be CARand DRIVER. This would be one-to-one if a car only had one driver and thedriver only drove one car. But if a car could have more than one driver, itwould be one-to-many; and if the same driver could also drive more thanone car, it would be many-to-many. Notice in Figure 3.3 how the entitymodel changes, depending upon the type of relationship.
One-to-many relationships are very common:
� A PATIENT can only have one DOCTOR, but a DOCTOR can treat manyPATIENTs.
� At Swillbuckets, an EVENT presents only one ARTISTE, but an ARTISTEcan appear at many EVENTs.
This could change, of course. Jack Trout might decide to put on morethan one ARTISTE at some EVENTs. Then the relationship would becomemany-to-many. So it is the policies of the organization which determine thetype of relationship. (Remember: more than one = many.)
Modelling the data structure 45
CAR DRIVER
A car can have only one driver; a driver can haveonly one car
CAR DRIVER
A car can have more than one driver; a driver can haveonly one car
CAR DRIVER
A car can have only one driver; a driver can have morethan one car
CAR DRIVER
A car can have more than one driver; a driver can havemore than one car
1:1
1:M
1:M
M N:
Figure 3.3Relationship types.

Many-to-many relationships are also quite common:
� A MEMBER might attend many EVENTs and each EVENT could havemany MEMBERs.
� A STUDENT might take many COURSES and each COURSE might havemany STUDENTS.
� A CUSTOMER might buy many PRODUCTs and a PRODUCT might bebought by many CUSTOMERs.
Sadly, many-to-many relationships are not good for databases. Theycannot be implemented effectively. So many-to-many relationships have tobe resolved.
3.1.5 Resolving many-to-many relationships
In effect, this means we have to split many-to-many relationships into twoone-to-many relationships. This requires us to find a link entity which is asingle occurrence of the many-to-many relationship.
1 Find a link entityHere’s an example: let’s look at the CUSTOMER:PRODUCT relationship.We’ve already said it’s a many-to-many relationship, so let’s think of a linkentity. A single occurrence of this relationship might be a TRANSACTION.That is one CUSTOMER buying one PRODUCT. In diagrammatic form, wesee how this might work. Each occurrence of TRANSACTION representsone occurrence of the CUSTOMER:PRODUCT relationship. The many-to-many relationship changes to two one-to-many relationships in Figure 3.4.
Each CUSTOMER can make many transactions, but eachTRANSACTION is made by only one CUSTOMER. Similarly, EachPRODUCT can be part of many transactions, but each TRANSACTION onlyinvolves one PRODUCT.
46 Systems analysis: a beginner’s guide
CUSTOMER PRODUCT
CUSTOMER PRODUCT
TRANSACTION
Figure 3.4Resolution of many-to-manyrelationships.

Here’s another example from an analysis of the Probation Service. Pre-liminary investigation reveals the entities: COURT and DEFENDANT. Butthe relationship is many-to-many. Each COURT may have many DEFEN-DANTs and each DEFENDANT can come before many COURTs. To resolvethis relationship, we need to think of a single instance of the relationship.What is the term for the coming together of COURT and DEFENDANT at aparticular moment in time? The answer is TRIAL. TRIAL is the link entitywhich resolves the many-to-many relationship. For simplicity’s sake, wewill assume there is only one defendant at a trial, as modelled in Figure 3.5.
2 Consider the attributesWhen we create a new link entity in this way, we need to consider whichattributes will make up the new entity. There will be one or two from theoriginal two entities, but there may be some completely new ones. TheCOURT and DEFENDANT entities might have had these attributes (Keysare underlined):
COURT DEFENDANTCourt Number Defendant NumberCourt Name Defendant NameCourt Address Defendant AddressPostcode PostcodeCourt Type Date of BirthCourt Clerk Current status
But when we introduce the new link entity, TRIAL, it will normally be thecase that the keys from the two original entities will need to be in theTRIAL entity. In order to identify a TRIAL, we need to know the CourtNumber and the Defendant Number.
So TRIAL might look something like this:
Modelling the data structure 47
COURT DEFENDANT
COURT DEFENDANT
TRIAL
A single instance of the COURT and DEFENDANTrelationship is a TRIAL
Figure 3.5The COURT andDEFENDANTrelationship.

TRIALCourt Number *Defendant Number *Trial NumberTrial DateJudgeChargeDefence LawyerProsecutorSecretary
In this example, Trial Number would be the key. The two keys taken fromthe COURT and DEFENDANT entities are called foreign keys and are usu-ally marked with an asterisk. They could have been used as a key for TRIAL,along with Trial Date, but Trial Number is simpler.
Foreign keys, then, are primary keys in other related entities and areused as a means of linking the entities together.
3.2 Simple steps in entity modellingNow that the terms are reasonably clear, let’s summarize the steps involvedin entity modelling.
1 List the possible entities.As we’ve seen, this will be done by talking to the users. It is also necessaryto check the DFDs, as we must ensure that we hold information about theexternal entities identified there, such as ARTISTE.
2 Check that the entities listed are really entities.This can be done by applying the four rules outlined earlier.
3 Draw a basic entity model, with boxes around the entities.
4 Identify which entities are related.Draw a line between them.
5 Give the relationship a name in each direction.This can be quite difficult, as the analyst is attempting to summarize whatmay be a complex relationship in a short phrase or word. Try to avoid vaguenames if possible and specify what exactly the relationship is. Figure 3.6gives a couple of examples.
6 Identify the relationship type.
(1:1, 1:M or M:N)
7 Resolve any one-to-one relationships.
8 Resolve any many-to-many relationships.Add in link entities.
9 Add the attributes, including primary keys and foreign keys.
48 Systems analysis: a beginner’s guide

The systems analyst will need to communicate regularly with the userduring this process in order to check that all necessary entities have beenidentified and that the relationships are accurate.
3.3 Entity modelling at SwillbucketsLet’s go through the simple steps using the Swillbuckets case study. Just as areminder, Swillbuckets puts on events on a weekly basis for the entertainmentof members. These events feature artistes of various types and all manner ofbarely legal activities – the annual six-legged pig race being a case in point. Inaddition, Swillbuckets offers certain dishes based on local recipes and a rangeof local beers and sundry items. One can hardly stress enough the importanceof Cooper’s ‘Old Firtle Ale’ to the local economy and social mix.
1 List the possible entities.One method is to pick out the nouns in the interview transcripts. We arelooking for anything which might be important to Jack and other users atSwillbuckets – things they might need to hold information about.
A quick run through might identify the following candidate entities:
� ARTISTE
� EVENT
� MEMBER
� DISH
� BREWERY
� DRINK
� RECIPE
Modelling the data structure 49
COURT DEFENDANT
TRIAL
hosts appears at
DOCTOR PATIENT
APPOINTMENT
makestakes
occurs at tries
is taken by is made by
Figure 3.6Naming therelationships.

A glance at the DFDs drawn in the previous chapter reveals that theexternal entity SUPPLIER needs adding to our list – the suppliers of food-stuffs. Similarly, MEDIA needs considering – information about the localmedia.
2 Check that the entities are really entities.The next step is to check that each of these is a real entity. All the candidateentities are important to Swillbuckets, so they all pass test one. Similarly,they all have attributes, so they pass test two. However, test three throwsup a problem – do they occur more than once? Since Jack gets all his beersfrom the same brewery – Cooper’s – BREWERY will only occur once. It maybe that we can dispense with this one. This is particularly sensible giventhat we have identified SUPPLIER as an entity. The brewery could berecorded as a supplier. So BREWERY fails the test. They all pass the last test– can they be uniquely identified?
3 Draw the basic entity model.Now we can draw an entity model showing the eight entities identified sofar (Figure 3.7). Bear in mind that there may be more entities to comewhen we show the user our entity model.
At the moment, all we’ve done is put boxes around the entities.
4 Identify the relationships.We’ll start with ARTISTE. ARTISTEs attend EVENTs, so there is a relation-ship between ARTISTE and EVENT. Similarly:
50 Systems analysis: a beginner’s guide
ARTISTE EVENT
MEMBERDISH
DRINK
SUPPLIER
RECIPE
MEDIA
Figure 3.7Swillbuckets entitymodel – boxes.
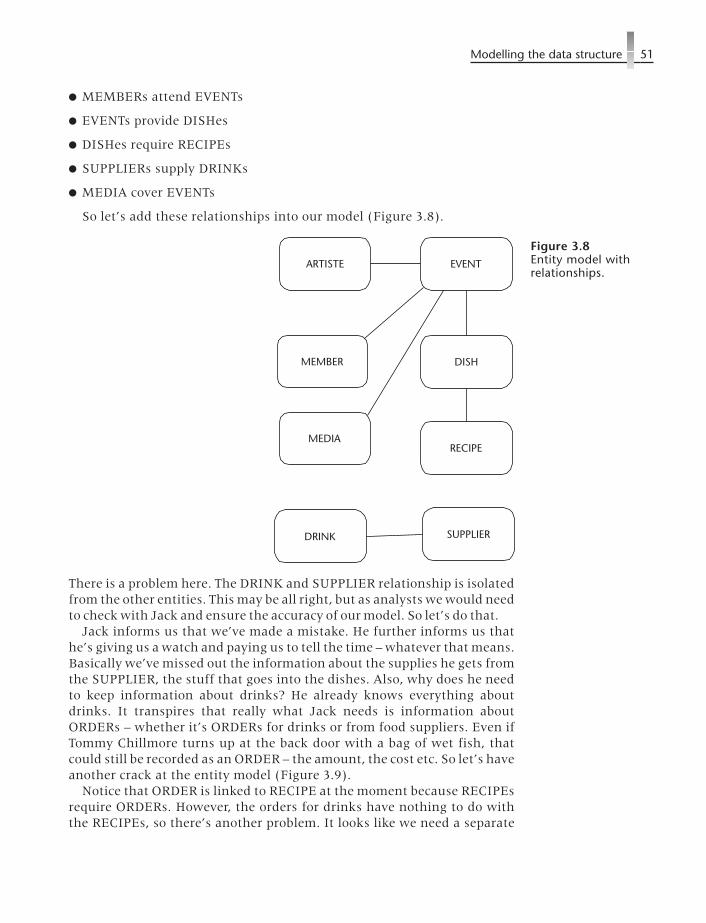
� MEMBERs attend EVENTs
� EVENTs provide DISHes
� DISHes require RECIPEs
� SUPPLIERs supply DRINKs
� MEDIA cover EVENTs
So let’s add these relationships into our model (Figure 3.8).
There is a problem here. The DRINK and SUPPLIER relationship is isolatedfrom the other entities. This may be all right, but as analysts we would needto check with Jack and ensure the accuracy of our model. So let’s do that.
Jack informs us that we’ve made a mistake. He further informs us thathe’s giving us a watch and paying us to tell the time – whatever that means.Basically we’ve missed out the information about the supplies he gets fromthe SUPPLIER, the stuff that goes into the dishes. Also, why does he needto keep information about drinks? He already knows everything aboutdrinks. It transpires that really what Jack needs is information aboutORDERs – whether it’s ORDERs for drinks or from food suppliers. Even ifTommy Chillmore turns up at the back door with a bag of wet fish, thatcould still be recorded as an ORDER – the amount, the cost etc. So let’s haveanother crack at the entity model (Figure 3.9).
Notice that ORDER is linked to RECIPE at the moment because RECIPEsrequire ORDERs. However, the orders for drinks have nothing to do withthe RECIPEs, so there’s another problem. It looks like we need a separate
Modelling the data structure 51
ARTISTE EVENT
MEMBER DISH
DRINK SUPPLIER
RECIPEMEDIA
Figure 3.8Entity model withrelationships.
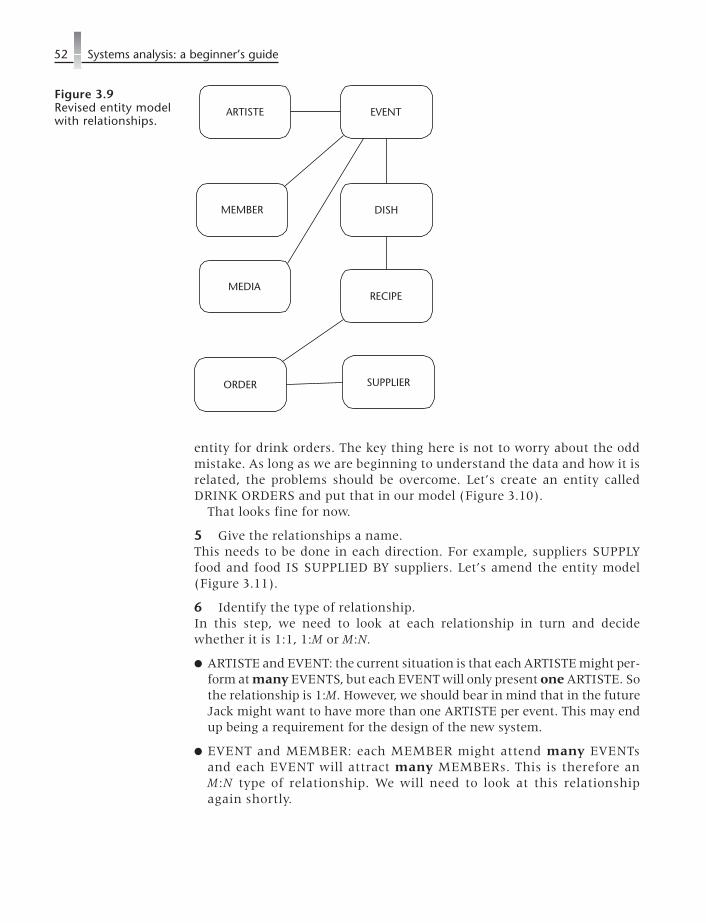
entity for drink orders. The key thing here is not to worry about the oddmistake. As long as we are beginning to understand the data and how it isrelated, the problems should be overcome. Let’s create an entity calledDRINK ORDERS and put that in our model (Figure 3.10).
That looks fine for now.
5 Give the relationships a name.This needs to be done in each direction. For example, suppliers SUPPLYfood and food IS SUPPLIED BY suppliers. Let’s amend the entity model(Figure 3.11).
6 Identify the type of relationship.In this step, we need to look at each relationship in turn and decidewhether it is 1:1, 1:M or M:N.
� ARTISTE and EVENT: the current situation is that each ARTISTE might per-form at many EVENTS, but each EVENT will only present one ARTISTE. Sothe relationship is 1:M. However, we should bear in mind that in the futureJack might want to have more than one ARTISTE per event. This may endup being a requirement for the design of the new system.
� EVENT and MEMBER: each MEMBER might attend many EVENTsand each EVENT will attract many MEMBERs. This is therefore anM:N type of relationship. We will need to look at this relationshipagain shortly.
52 Systems analysis: a beginner’s guide
ARTISTE EVENT
MEMBER DISH
ORDER SUPPLIER
RECIPEMEDIA
Figure 3.9Revised entity modelwith relationships.

� EVENT and DISH: each EVENT will only ever offer one dish (in order tokeep Freddo Smitho just the right side of sane) and each dish will beoffered at many EVENTs. So it’s a 1:M relationship.
� DISH and RECIPE: each DISH is produced from one RECIPE and eachRECIPE prescribes one DISH. This is a 1:1 relationship. In this circum-stance, it is usually possible to combine the entities into one. In this case wecould keep the entity DISH, but make Recipe Number an attribute of DISH.We would need to check if this attribute is needed with Jack or Freddo.
� EVENT and MEDIA: each MEDIA branch (or MEDIUM) will cover manyEVENTs and each EVENT may be covered by many MEDIA branches.This is an M:N relationship in its current form and will need furtherconsideration.
� RECIPE and FOOD ORDER: each RECIPE could require many FOODORDERs and each FOOD ORDER could be required for many RECIPES.This is clearly a many-to-many relationship and will also need looking atagain.
� SUPPLIER and FOOD ORDER: each SUPPLER might deal with manyFOOD ORDERS but each FOOD ORDER will only be placed with oneSUPPLIER. It’s a one-to-many relationship.
Modelling the data structure 53
ARTISTE EVENT
MEMBER DISH
FOODORDER
SUPPLIER
RECIPEMEDIA
DRINKORDER
Figure 3.10Revised entity model.

� SUPPLIER and DRINK ORDER: same as for SUPPLIER and FOODORDER.
Let’s see how this step affects our entity model (Figure 3.12).
7 Resolve any one-to-one relationships.We do have one such relationship, between DISH and RECIPE. We will needto discuss this with Jack and Freddo. Freddo informs us, to no one’s greatsurprise, that he doesn’t bother much with recipes. He makes it up as he goesalong. So there’s very little point in storing information about recipes.
However, Jack would like to know how much meat is in stock, so that hedoesn’t order more than he needs. Only the other week, Jack had ordered 50kg of beef in preparation for Freddo’s ‘Industrial strength chilli’. Imagine hissurprise when he discovered that there was already 35 kg in the freezer!
What Jack needs is information about the ingredients and how much thereis in stock. It seems that we have lost one entity (RECIPE), but found another(INGREDIENT). Let’s make these changes in the entity model (Figure 3.13).
The relationship between INGREDIENT and DISH turns out to be many-to-many. This is because each DISH contains many INGREDIENTs andeach INGREDIENT is contained in many DISHes. For example, theINGREDIENT ‘beef flavouring’ appears in most of Freddo’s dishes,including even ‘Omelette Carbonari’.
54 Systems analysis: a beginner’s guide
ARTISTE EVENT
MEMBER
DISH
FOODORDER SUPPLIER
RECIPE
MEDIA
DRINKORDER
performs atpresents
attends
attractsoffers
is offered at
is produced from
prescribes
covers
is covered by
requiresis required for
is placed withdeals with
is placed with deals with
Figure 3.11Entity model withrelationship names.

Similarly, INGREDIENT and FOOD ORDER is many-to-many, since eachINGREDIENT can appear on many FOOD ORDERS and each FOODORDER can be have many INGREDIENTS on it. Clearly, we have somework to do in the next step.
8 Resolve any many-to-many relationships.We have a few of these, so let’s take them one at a time: firstly, theEVENT–MEMBER relationship. In order to resolve many-to-many rela-tionships, we need to find a link entity. It’s often useful to try to think of asingle instance of the relationship. In this case, it will be something alongthe lines of a member’s attendance at an event. If, for example, Jack wereto issue a ticket for an event, the information on the ticket would be just thesort of information we’re looking for. So we might call the link entityEVENT TICKET. The information associated with this entity (its attributes)might be: the title of the event, the date of the event, the member numberand the ticket number. So we have some information about the EVENT,some information about the MEMBER and a unique identifier (ticketnumber).
However, Jack does not currently do this. We must check with Jack that he ishappy collecting and storing this information. It should be noted in theProblem/Requirement List and considered in Stage 2 (Chapter 4). We must
Modelling the data structure 55
ARTISTE EVENT
MEMBER
DISH
FOODORDER SUPPLIER
RECIPE
MEDIA
DRINKORDER
performs atpresents
attends
attractsoffers
is offered at
is produced from
prescribes
covers
is covered by
requiresis required for
is placed with
deals with
is placed with deals with
Figure 3.12Entity model withtype of relationship.

bear in mind that we are modelling the current system at this stage. Inresolving many-to-many relationships, we may be making assumptionsabout the new system. We must be careful not to do this without verifyingthese assumptions. These assumptions will have to be examined againwhen we consider the Problem/Requirement List. If necessary, we can leavea many-to-many relationship unresolved for the time being and return to itin the Design Stage.
The next relationship is EVENT and MEDIA. We could resolve this byintroducing a link entity called, perhaps, COVERAGE, where we storeinformation about the MEDIA coverage of each EVENT. However, thisseems like information overload. Does Jack really store such detailed infor-mation about each of his events? When this question was put to Jack he feltthat many events were best not covered at all: ‘The less people know aboutlast year’s six-legged pig race the better’. All Jack does is keep some contactinformation, so he can phone them to advertise events. It is not a require-ment to store any more information. We can, therefore, assume thatMEDIA no longer has any links with the main system being analysed.
The next relationship is a little more complex – DISH and INGREDIENT.Let’s look carefully at the attributes that these two entities might have(Figure 3.14).
56 Systems analysis: a beginner’s guide
ARTISTE EVENT
MEMBER
DISH
FOODORDER SUPPLIER
INGREDIENT
MEDIA
DRINKORDER
performs atpresents
attends
attractsoffers
is offered at
contains
is contained in
covers
is covered by
appears onis placed for
is placed with
deals with
is placed with deals with
Figure 3.13Entity model withone-to-onerelationshipsresolved.

We have information about the dish and information about the ingre-dient, but what we don’t have is information about which ingredient goesin which dish and how much of it goes in. This is starting to sound a littlebit like a recipe, which we’ve already dismissed, but it’s not quite the same.The link entity might be called DISH DETAIL and it will simply be a singleinstance of the DISH–INGREDIENT relationship. So if the DISH is ‘Skew-ered kidneys in lager’, the ingredient might be ‘kidneys’ and we mightstore the quantity required for, say, 100 meals, which might be ‘50 kg’. Thenext record in DISH DETAIL might be ‘Skewered kidneys in lager’ again forthe DISH, but the INGREDIENT might be ‘lager’ and the quantity might be‘10 litres’. Figure 3.15 shows the link entity and its attributes. Again, thiswill need noting in the Problem/Requirements List, but we will include thechange in our entity model for the time being.
Finally, there’s FOOD ORDER and INGREDIENT. A single instance ofthis relationship might be thought of as a FOOD ORDER LINE. If youimagine an order with a list of ingredients on the order, then one line of thislist would be our link entity. The information involved might be the OrderNumber, the Ingredient Number, the Quantity and the Price.
So our latest entity model will look like Figure 3.16.This is still early days in the modelling process. There will be more
changes to come as we start to design the new system.
9 Add the attributes and keys.It is useful, now that the entity model is nearing completion, to considerthe attributes for each entity and which attributes might be the key foreach entity. Figure 3.17 gives a rough idea of how this might look.
There are a few things to notice here:
Modelling the data structure 57
DISH INGREDIENT
Dish nameDish price
Ingredient numberIngredient nameQuantity in stockReorder level
Figure 3.14DISH andINGREDIENT.
DISH INGREDIENT
Dish nameDish price
Ingredient numberIngredient nameQuantity in stockReorder level
DISHDETAIL
Dish nameIngredient numberIngredient quantity
Figure 3.15DISH andINGREDIENTresolved.

� Primary keys are underlined.
� Attribute names have been condensed into one word with no spaces –spaces can cause problems in some systems. Capital letters are used todenote a new word in the name.
� An asterisk denotes a foreign key – an attribute which acts as a link toanother entity by appearing in both. It’s a primary key in one entity butnot in the other.
� Address attributes are shown as just one attribute, but in reality they areusually made up of a number of attributes e.g. Street, Town, County,Postcode.
We now have an overview of how the data in the current system atSwillbuckets could usefully be structured. In the process we have learnt alot about the system and how it might be improved. Before we set aboutmaking some improvements, there is one final technique which bringstogether what we have done in chapters 2 and 3 – physical data store/entitycross-reference.
58 Systems analysis: a beginner’s guide
ARTISTE
MEMBERDISH
FOODORDER
SUPPLIER
INGREDIENT
MEDIADRINKORDER
EVENT
EVENTTICKET
DISHDETAILS
FOODORDERLINE
Figure 3.16Current entity model.

3.4 Physical data store/entity cross-referenceThis is an important technique which serves to check that all the datastored in current data stores appears somewhere on our entity model. If itdoesn’t, we’ve missed something. Either we have a data store we don’t use,or our entity model is not complete. Here are the simple steps in creatingthe cross-reference:
1 List all the data stores.This is done by checking the current physical data flow diagrams. ForSwillbuckets, the list will look like this:
Modelling the data structure 59
ARTISTE
ArtisteNameRealNameArtisteAddressTel_homeA_MobileFee
MEMBER
MemberNoMemberNameMemberAddressPhoneNoM_MobileM_Date
DISH
DishNamePrice
FOODORDER
F_OrderNoOrderDate*SupplierNoDeliveryDateF_OrderPayment
SUPPLIER
SupplierNoSupplierNameS_AddressS_TelS_Contact Name
INGREDIENT
IngredientNoIngredientNameQuantityInStockReorderLevel
MEDIA
MediaNameM_AddressTypeM_ContactNameM_Tel
DRINKORDER
D_OrderNoOrderDate*SupplierNoDelivery DateD_OrderPayment
EVENT
EventNoEventNameDate*ArtisteName*DishNameArtistePayment
EVENTTICKET
TicketNo*MemberNo*EventNo
DISHDETAILS
*DishName*IngredientNoIngredientQuantity
FOODORDERLINE
*F_OrderNo*IngredientNoQuantityPrice
Figure 3.17Entity model withattributes.

M1 Membership shoeboxM2 Artiste shoeboxM3 Supplier shoeboxM4 Events folderM5 Recipe book
2 Cross reference each data store with corresponding entities from theentity model.
This means checking that each data store on the DFDs has a correspondingentity or entities. A data store can have more than one entity. The cross-ref-erence for Swillbuckets appears in Figure 3.18.
3 Check that each data store has at least one entity.We can see that this is the case for Swillbuckets.
60 Systems analysis: a beginner’s guide
M1 Membership shoebox
M2 Artiste shoebox
M3 Supplier shoebox
M4 Events folder
M5 Recipe book
MEMBER
ARTISTE
FOODORDER LINE
FOODORDER
SUPPLIER DRINKORDER
EVENT DISH
DISHDISHDETAILS
INGREDIENT
Figure 3.18Data store/entitycross-reference.

4 Check that each entity is stored in a data store.We note that the entities EVENT TICKET and MEDIA do not have datastores. The fact that EVENT TICKET does not have a data store is expected.This is because Jack does not currently store this information and itappears on the entity model to resolve a many-to-many relationship. Atsome point, we will have to decide, in consultation with Jack, whether tokeep it or not.
The fact that the MEDIA entity does not have a data store is the result ofan omission on the DFDs. In order to alert the media about his forthcomingevents, Jack would have to look up information such as addresses andphone numbers. This information might be stored in an address book or afolder. Either way, it’s a data store and should have appeared on the DFDs.We should now add it in, both to the cross-reference and the DFDs. We willcall it M6 – Media Details. Our final cross-reference will look like the one inFigure 3.19.
We have now completed our investigation into the current physical systemat Swillbuckets. In this chapter we have developed an entity model, so thatwe know the structure of the data currently in use, and a cross-reference tocheck that we have done the job properly.
The entity model and cross-reference for the Medical Centre are includedin Figures 3.20 and 3.21. Note that M14 ‘Pay cabinet’ has no correspondingentity. This indicates that it does not store any meaningful data and canprobably be dispensed with. It will be investigated as part of the next Stage.
In the next chapter we will look at the techniques involved in convertingto a logical system and summarizing the requirements for the new system.
SummaryIn this chapter, we have looked at the techniques involved in modelling thedata. Entity modelling has been the focus and we have considered the ele-ments involved in the structure of data. In the next chapter, we attempt totake a logical view of the data and the data flows.
Modelling the data structure 61

62 Systems analysis: a beginner’s guide
M1 Membership shoebox
M2 Artiste shoebox
M3 Supplier shoebox
M4 Events folder
M5 Recipe book
M6 Media details
MEMBER
ARTISTE
FOODORDER LINE
FOODORDER
SUPPLIER DRINKORDER
EVENT DISH
DISH
MEDIA
DISHDETAILS
INGREDIENT
Figure 3.19Final data store/entitycross-reference.

Modelling the data structure 63
PATIENT
PatientNoP_First NameP_SurnameP_ AddressP_DOBP_Tel_homeP_MobileP_DoctorName
APPOINTMENT
AppointmentNo*PatientNo*Doctor/NurseNameA_DateA_TimeA_Outcome
PRESCRIPTION
PrescriptionNo*PatientNo*DoctorNameP_Date
SUPPLIER
SupplierNoSupplierNameS_AddressS_TelS_ContactName
DOCTOR
DoctorNameD_AddressD_Tel_HomeD_MobilePagerStartDate
ORDER
OrderNo*SupplierNo*NurseNameO_DateO_Total
PRESCRIPTIONLINE
*PrescriptionNoDrugCodeDosageCondition
TREATMENT
RecordNo*PatientNoDateConditionPrescriptionNoOutcome
REFERRAL
ReferralNo*PatientNo*DoctorNameR_DateDestinationR_Outcome
NURSE
NurseNameN_AddressN_Tel_HomeN_MobileStartDate
WORKROTA
*DoctorNameDateStartTimeEndTimeHoursWorked
DRUG
DrugCodeSupplierUsageSideEffectsRestrictions
ORDER LINE
*OrderNoProductCodeQuantityCost
EXPENSES
ExpenseNo*DoctorNameExpenseTypeE_AmountE_date
REPEATPRESCRIPTION
RepeatPrescripNo*PrescriptionNoFrequencyNextDate
Figure 3.20

64 Systems analysis: a beginner’s guide
PATIENT
PATIENT
PATIENT
PATIENT
PATIENT
PRESCRIPTION
WORK ROTA
WORK ROTA
ORDER ORDERLINE
SUPPLIER
EXPENSES
PATIENT APPOINTMENT DOCTOR
PATIENT
No entity
M5 Patient records
M4 Doctor’s list
M1 Student list
M2 Catchment area
M3 Registration forms
M6 Medical records
M7 Appointment book
M8 Prescriptions
M9 Timesheets
M10 Work rota
M11 Expenses forms
M12 Budget
M13 Suppliers file
M14 Pay cabinet
Figure 3.21

Exercises3.1 Draw an entity model to model the following car rental businessscenario:
� Cars are always rented from one location and are brought back to thesame location.
� Customers may pay by cash or credit card.
� Customers who call the agency may request a particular car make, modeletc. if available.
� A bill is presented to the customer prior to releasing the rental car.
� A further bill may be presented to the customer once the rented car hasbeen returned to cover any damage or excessive mileage.
3.2 Draw an entity model to model this university scenario:
� A university department employs lecturers and clerical staff.
� It offers a three-year degree.
� A student has to take 12 modules during the course.
� Each lecturer teaches one or more courses.
� Courses may be taught by more than one lecturer.
� During the year, each postgraduate student has to complete two or threecoursework assignments for each module.
Modelling the data structure 65

C H A P T E R 4The logical view
4.1 LogicalizationSo far, we have been concerned with how the current system works. Beforewe can design a new and better system, we need to be clear exactly whatthe current system does, not how it does it. In other words, we need to stripoff all the physical trappings introduced by Jack Trout at Swillbuckets andthe receptionists at the Medical Centre and focus on what the systemsactually do. This process is called logicalization, and the outcome will be alogical model of the current system. We try to envisage how things wouldwork if no physical constraints existed. Once it is done, we can move on toStage 2 of SSADM, where we start to consider how we can improve things.
Logicalization focuses on the data flow diagrams, specifically the lowestlevel DFDs. The diagrams produced so far use terms and processes createdby the users (Jack and the receptionists). These may not be entirely logical.They may be plain daft. Ways of doing things will have developed over theyears which might seem fine to the user, but they should at least be exam-ined to see if they are sensible. At the Medical Centre, for example, patientrecords are made up of handwritten cards stuffed into a cardboard folder.These are then stored in huge filing cabinets, each the size of a smallgarage. These records will still have to be stored in our new system, butprobably not in this way.
The process can be divided up into four steps:
1 Logicalize the data stores: as well as the DFDs, logicalization usesthe data store/entity cross-reference produced at the end of the lastchapter. This cross-reference was physical, so we need to produce a log-ical version. In this version, each data store will be an entity, or a groupof related entities. So we might well end up with a data store called ‘Pa-tient’ which will contain all the data about patients. So physical storeslike ‘Student lists’, ‘Medical Records’ and ‘Patient Records’ will all fallinto the logical ‘Patient’ data store.
66

As we logicalize the data stores, their labels will change from M1, M2, ...to D1, D2, ... – this indicates that the label no longer signifies a manual datastore, just a data store. The exact nature of the data store is not importantin a logical DFD.
2 Remove physical time dependencies: this involves removing any pro-cesses which exist purely as a result of physical time constraints or fromconvenience. For example, we have a process at the Medical Centre: 4.3.3– Post pay claim. This process is purely a physical restraint and involvesthe receptionists waiting until all the timesheets are completed beforephysically posting the pay claim. In the world of the computer we prob-ably won’t be posting much at all. So logically we can remove this process.
3 Logicalize the processes: processes in the physical DFDs tell us howphysically a process is done and who does the process, but in the logicalDFDs this isn’t necessary. Logically, processes can be done anyhow byanyone. Logical processes will input data, read it, change it, store it ordelete it. Anything to do with physical tasks like Receptionist: ‘Receiveand distribute payslip’ can be removed.
4 Logicalize the data flows: any reference to forms, reports, sheets etc.must be removed and replaced with the actual data which flowsaround the system. The actual data is modelled in the entity model.Thus the data flows will be labelled with the entity used by the process.For example, a patient’s medical card will become simply ‘patient’ or‘patient details’ in our logical model. This is imprecise because themedical card will only contain some of the data stored in the PATIENTentity, but to specify which attributes the medical card actually con-tains would make the diagram too cluttered.
4.2 Simple steps in logicalizationIn this section, the focus will revert to the Medical Centre, though all thedocumentation for Swillbuckets will be included at the end.
1 Consider the data stores.We could simply take the entity model (see Figure 3.20) and make eachentity a data store. That would be the easiest thing to do and may well bethe best thing to do. In the case of the Medical Centre, that would give us15 logical data stores, which seems reasonable enough. However, it mightbe worth considering whether to combine some data stores. For example,we might combine all the prescription information into one data store. Onthe entity model we have ‘Prescription’, ‘Prescription Line’ and ‘RepeatPrescription’ all containing information about prescriptions. We couldlump these three together and call them ‘Prescription’. We will still needthem as separate entities, but joining them together will make the DFDssimpler. This is just a convenient way of representing the data stores; weare not actually merging the entities.
The logical view 67

Similarly, ‘Doctor’ and ‘Nurse’ are closely related and could be lumpedtogether to form one data store. We would be in big trouble with NursePayne if we called this store ‘Doctor’, so we had better call it ‘Doctor/Nurse’.We could also put ‘Work Rota’ and ‘Expenses’ in here, as they too refer tothe doctors and the nurse.
‘Order’ and ‘Order Line’ could sensibly be referred to as the ‘Order’ datastore and finally it might be easier to put ‘Referral’ and ‘Treatment’ in with‘Patient’ as they all relate to the patient. We might call this store ‘Patient’.
2 Produce the logical data store/entity cross-reference.This is simply a matter of listing the entities and corresponding data stores.Each entity must appear in only one data store. The data stores are labelled‘D1’, ‘D2’ etc. on the logical DFDs.
3 Remove time dependencies.There are a few of these in our physical DFDs – 4.3.3 ‘Post pay claim’ hasalready been mentioned, and 4.3.4 ‘Receive and distribute payslips’ is not aprocess we would want to keep if we could erase it. This is not because wedon’t want to pay the doctors (though the GPC has considered thisapproach). It is rather that it serves no logical purpose: it just wastes timeby passing on data which could go directly to the doctors. So we can removesome processes in this way.
4 Remove names and departments from the process boxes.Since it does not matter, logically, who does what, we can take out theselabels from the process boxes.
5 Change processes so that they describe what is done to the data.Where a process refers to any particular ways of doing things instead ofwhat is actually done, we need to change the process to make it logical. Anexample of this and the previous step is shown in Figure 4.2.
In this example, what we are actually doing is creating a new patient.Whether this is done by adding data to doctors’ lists or patient records, orboth, should not matter. We are focusing on what happens, not how it is done.
6 Remove any physical references from the process box.Any process names which refer to physical objects or describe physicalactions must be changed. If possible, make the objects entities and makethe actions one of: create, update, edit, delete or something similar.
For example, process 4.2 ‘Collate staff timesheets’ might become some-thing like ‘Update work rota’, since the timesheet information (hoursworked per day) is contained in the Work Rota entity in our entity model.
7 Make sure that the data flows refer to logical items of dataThese will normally be entities as items of data are contained within enti-ties and not things like forms, reports, handwritten notes, or chewed uppieces of card.
8 Data flows between processes should be removed.Instead, the data should be directed into and out of a data store.
68 Systems analysis: a beginner’s guide

The logical view 69
DRUG
ORDER ORDERLINE
SUPPLIER
APPOINTMENT
PATIENT
TREATMENT REFERRAL
PRESCRIPTION
PRESCRIPTIONLINE
REPEATPRESCRIPTION
DOCTOR NURSE
EXPENSES WORK ROTA
D1
D2
D3
D4
D5
D6
D7
Patient
Appointment
Prescription
Drug
Doctor/Nurse
Order
Supplier
Figure 4.1Logical data store/entity cross-reference.
1.3 Reception
Add patient toDoctors’ list andPatient records
Physical Logical
1.3
Create new patient
Figure 4.2Converting a physicalprocess to a logicalone.

If we put all these simple steps into practice, we will produce a set of cur-rent logical DFDs. These are shown in Figures 4.3–4.7. These might use-fully be compared to the current physical DFDs at the end of Chapter 2(Figures 2.16–2.20).
In Figure 4.3, note that processes 1.1 ‘File student list’ and 1.2 ‘Processregistration form’ have been merged to produce the logical process ‘Reg-ister patient’. This could have been called ‘Create patient’, but the use ofthe word ‘register’ is more descriptive of what actually happens.
All of the data stores used by these processes have been logically groupedinto one data store, ‘Patient’, and, similarly, the data flows are all con-cerned with ‘patient’. Even a data flow such as ‘doctor’s name’, whichmight appear to be about the doctor, is logically about the patient. Thename of the doctor would appear in the ‘Patient’ entity rather than the‘Doctor’, as can be seen from the entity model.
The logical DFDs normally seem much simpler than the physical ones.This is because many of the constraints and unnecessary activities havebeen taken away, leaving the bare bones of what happens.
Figure 4.4 shows the ‘Process appointments’ DFD in logical form. Thephysical processes ‘Take appointment request’ and ‘Create new appoint-ment’ have been deemed to be part of the same logical process which wecall ‘Create new appointment’.
‘Process Patient Requirements’ has been converted into logical format inFigure 4.5.
The only significant change here is that a new data flow has been added.This is ‘prescription’, which goes to the Prescription Monitoring Authority.Previously, this was done in a separate process – 4.4 ‘Compile PMA report’.
70 Systems analysis: a beginner’s guide
1.1
Register patient
1.2
Allocate patient todoctor
PATIENT
patient
UNIVERSITYpatient
1.3
Inform GPC
GPC
patient
D1 Patient
patient
patien
t
medicalcard
patient
patien
t
patient
patie
nt
patient
Figure 4.3Current logical DFD –‘Register patient’.

However, logically the prescription information should go directly to thePMA as part of 3.3 ‘Prescribe treatment’. How this might happen is not aconsideration as yet, and it may be that we still end up compiling a separatereport.
Things get a little more complex in process 4 – ‘Process ManagementInformation’. The timesheet is not a logical entity: it is a physical entity, aform. Or rather a scrappy bit of paper that Nurse Payne thrusts under thenoses of the receptionists at regular intervals in an effort to get them to fillin their actual working hours. It is not part of our entity model. Essentially,the information contained in it appears in the ‘Work Rota’ entity. As aresult, the rota appears on our logical DFDs and not the timesheet.
It should also be remembered that the ‘Work Rota’ entity has been placedin D5 ‘Doctor/Nurse’ for the sake of convenience.
Process 4.3 ‘Process staff income/expenses’ was the only process to betaken down to a level 3 DFD as part of the current physical DFDs. This wasdone because it was too complex to be completely clear as a level 2 process.The level 3 DFD was given in Figure 2.20 (p. 32).
Many of the processes in this DFD have been discussed above. We havealready decided that 4.3.3 ‘Post pay claim’ and 4.3.4 ‘Receive pay slips’ canbe removed because they refer to physical, not logical, activities. Similarly,4.3.1 ‘Check timesheets’ adds nothing and can be seen as part of 4.3.2‘Compile pay claim’. As a result, we are left with only two logical processes.It is therefore no longer necessary to have a lower level DFD and we canincorporate these processes in their level 1 process – 4.3 ‘Update staffincome/expenses’; see Figure 4.6.
Processes 4.4 and 4.5 on the physical DFD involve compiling reports. Wehave already seen how the PMA report can be removed by adding a dataflow to the PMA in Figure 4.5. Similarly, we can remove the process of
The logical view 71
2.2
Amendappointment
PATIENT
patient
2.3
Cancelappointment
D2 Appointment
appointment
appointment
appointment
appointment
appo
intm
ent
appointment
2.1
Create newappointment
appointment
appointment
appointment
appo
intm
ent
Figure 4.4Current logical DFD –‘Processappointments’.

gathering data for the accountant in 4.4 by adding data flows to theaccountant in the logical DFDs.
A final point is that there is no logical reason why pay informationshould be part of our system at all. The GPC pays the doctors, so logicallythe data flow is between these two entities. How this might happen in prac-tice remains to be considered, like many things.
The final logical DFD concerns physical process 5 – ‘Maintain supplies’(Figure 4.7).
As mentioned above, we should show financial data such as orders,invoices and payments going directly to the accountant, not going into phys-ical processes like compiling reports. Otherwise this DFD is straightforward.
The logical DFDs are now complete. We have seen how several of theproblems, many of which are related to the ‘Betty and George’ way of doingthings, have now disappeared. However, some problems still remain and itis time to consider the Requirements Catalogue in detail to consider howwe might resolve the outstanding problems.
72 Systems analysis: a beginner’s guide
3.2
Diagnose illnessor refer
3.3
Prescribetreatment
D2 Appointment
appointment
patient
3.1
Receive patientfor appointment
appointment
appointment
patient
D1 Patient
patientpatient
referral
HOSPITAL
referral
patientreferral
D4 Drug
drug
PATIENT
PATIENT
prescription
D3 Prescription
prescription
3.4
Create repeatprescription
patient
D1 Patient
patient
repeat prescription
repeat prescription
PMA prescription
Figure 4.5Current logical DFD –‘Process PatientRequirements’.

4.3 Logicalization at SwillbucketsThe data store/entity cross-reference and the current logical DFDs forSwillbuckets are provided in Figures 4.8–4.13.
The cross-reference in Figure 4.8 does highlight the issue of whetherFOOD ORDER and DRINK ORDER should be separate entities, or whetherit would be more sensible to combine them into an ORDER entity. We willconsider this in our Problem and Requirements Catalogue.
The DFD of Figure 4.9 is very straightforward, but that in Figure 4.10 –‘Book artistes’ – raises an issue.
The very title of the process indicates that there should be a BOOKINGentity in our system. The presence of the ‘booking form’ data flow rein-forces this view. However, currently Jack does not need this as he stores thisbooking information within the EVENT entity. This is fine as long as thereis only one artiste appearing at the event. But if we start booking more thanone artiste per event, we will soon hit problems. So it may well be that arequirement for our new system would be the facility to book more thanone artiste per event. Jack’s initial reaction to this idea is lukewarm:
We once had Jade Green and her Dancing Chihuahuas on with LeapyLen’s Flea Circus. A disaster. Half the members wear insect repellent tothis day. I vowed then that it would be one act per night. They’re badenough on their own, but two together is asking for trouble.
The logical view 73
4.2
Update workrota
4.3
Update staffincome/expenses
D5 Doctor/Nurse
previous rota
4.1
Create workrota
rota
rotarota
GPC
rota
rota
ACCOUNTANT
expe
nses
expe
nses
expenses
constraint
Figure 4.6Current logical DFD –‘Update staff income/expenses’.

Nevertheless, we could build in the facility quite easily in case Jackchanges his mind.
The next process at Swillbuckets, ‘Order Drinks and Supplies’ (Figure4.11), also throws up an issue.
Whilst we have a DISH entity to record information about the food sideof the Club, there is no method for recording drinks information. In termsof stock, Jack tends to adopt the ‘scraping the barrel’ approach. He does notorder more beer until even the frantic pumping of the bar staff fails to per-suade any more liquid to issue from the beer taps. This has been known tocause a degree of concern among members eager for another pint (oreight). Indeed, it was Nick Coal’s verbal invective which persuaded Jack ofthe need for change.
So the new system must record drink stock levels very carefully in orderthat Jack does not have to have Nick’s pint glass surgically removed.
The next process – ‘Process payments’ is simple enough to convert to log-ical form (Figure 4.12).
However, its simplicity indicates that we may be able to dispense with it.For example, we could move 4.1 ‘Pay supplier’ into the ‘Order drinks andsupplies’ DFD, making it process 3.4. Similarly, 4.2 ‘Pay artiste’ could go
74 Systems analysis: a beginner’s guide
5.2
Create neworder
5.3
Update order ondelivery
D7 Supplier
5.1
Updatesupplier
supplier
supplier
order
SUPPLIER
ACCOUNTANT
SUPPLIER
D6 Order
supplier
order
ACCOUNTANT
order
invoice
invoice
invoice
5.4
Pay invoice
payment
payment
paym
ent
Figure 4.7Current logical DFD –‘Maintain supplies’.

into the ‘Book artistes’ DFD, making it process 2.4. This would allow us toremove the top-level process ‘Process payments’ from our top-level currentlogical DFD. This change will be made in the required logical DFDs.
The ‘Manage events’ process is shown in logical form (Figure 4.13) tocomplete the current logical DFDs for Swillbuckets.
4.4 Problem and requirements catalogueThis catalogue is a constantly changing document. It is created when theanalyst first interviews users and is added to at various points during thesystems analysis. After the completion of the logical DFDs, it is a sensibletime to consider the current position.
Problems can be defined as:
� things the system is not doing correctly
The logical view 75
ARTISTE
EVENTTICKET
EVENT
MEDIA
MEMBER
FOODORDER LINE
FOODORDER
DISHDETAIL
DISH INGREDIENT
SUPPLIER
DRINKORDER
D1
D2
D3
D4
D5
D6
D7
D8
Artiste
Event
Dish
Media
Member
Food Order
Supplier
Drink Order
Figure 4.8Data store/entitycross-reference(Swillbuckets).

� things the system is doing inefficiently/ineffectively
� things the system should do but is failing to do
Requirements are requested features of the new system.
4.4.1 The Medical Centre
As we saw in Section 2.3.1, a useful template for recording problems andrequirements might be something like the one in Figure 2.2.
It is now time to develop a set of problems and requirements, agree themwith the user and start to consider priorities. We will, of course, need tocome back to the Catalogue at a later stage.
We have already seen the one in Figure 4.14.
76 Systems analysis: a beginner’s guide
1.1
Enrol newmember
MEMBER
member
1.3
Remindoverduemember
1.4 Secretary
Closemembership
D5 Member
1.2
Updatesubscriptions
member
member
mem
ber subscription
member
mem
ber
membermem
ber
MEMBER
D5 Member
membersubscription
member
member
member
Figure 4.9Current logical DFD –‘Processmembership’.

TEAM FLY The logical view 77
2.1
Book artisteARTISTE
artiste
2.3
Cancelbooking
D1 Artiste
2.2
Confirmbooking
artiste
event
even
t
event
D2 Event
event
cancellation
canc
ella
tion
Figure 4.10Current logical DFD –‘Book artistes’.
3.1
Record food anddrink stocks
KITCHEN
3.2
Place orderwith supplier
3.3
Recorddelivery
D2 Event
order
SUPPLIER
order
D7 Supplier
BARdish
suppliersupplier
D6 Order
order
dish
drink
D3 Dish
event
order
order
Figure 4.11Current logical DFD –‘Order drinks andsupplies’.

78 Systems analysis: a beginner’s guide
4.1
Pay Supplier
SUPPLIER
D7 Supplier
supplier
order
4.2
Pay Artiste
D1 Artiste
artiste
event
eventARTISTE
D6 Order
order
D2 Event
event
Figure 4.12Current logical DFD –‘Process payments’.
MEMBER
D2 Event
event
5.2
Record dish forevent
D3 Dish
dish
MEDIA
5.1
Create eventsreport
even
t
dish
5.3
Record artisterequirementsARTISTE
D1 Artiste
artisterequirements
even
t
event
dishKITCHENdish
artisteartiste
Figure 4.13Current logical DFD –‘Manage events’.

The logical view 79
Here is a summary of all the problems and requirements in bullet form:
� Double booking occurring due to the Appointments Book being hard tomaintain and Betty being past her best (Figure 4.14) (Ref: P1).
– Suggested solution: Figure 4.14.
� Repeat appointments being missed because staff have no time, or indeedinclination, to remind patients of their appointments (Ref: P2).
– Suggested solution: an automatic mailing system so that when arepeat prescription is made, a letter is printed off at the appropriatetime.
� Patient records being difficult to locate, especially when the cat has hadthem (Ref: P3).
– Suggested solution: records securely stored in a database system.
� Patient details being incorrectly entered – there is no blood group P, forexample (Ref: P4).
System: Medical Centre
Author: Kevin Bowman
Date: 30/10/03 Page 1 of 1 Draft/final
P/R P No: 1 Source: Betty Priority: 1
Description:Double booking is occurring as a result of the Appointments Bookbeing hard to maintain accurately.
Benefits if action taken:No more arguments with Amanda Stote. Patients seen on time.Fewer complaints.
Comments/suggested solutions:Computerised Appointments Data Entry Form to include Patientscombo box and pre-formatted appointment slots.
Related probs/reqts/documents:Requirement 1DFD Appointments
Problems/requirementscatalogue
Figure 4.14RequirementsCatalogue P1.

– Suggested solution: validation and verification checks set up to helpdata entry.
� Prescriptions are normally illegible – Chris Longbottom was recentlyalmost given boot polish instead of boil poultice, which might have hadirreversible consequences (Ref: P5).
– Suggested solution: a prescription printing facility for each doctor –these can be signed and a record stored for the PMA.
� Nurse Payne being worn down with all the financial informationrequired by the accountant – even syringing wax from ears is stimulatingin comparison (Ref: P6).
– Suggested solution: financial data might be entered into a database orspreadsheet system. This file could be sent to the accountant regularly.Alternatively, a web-based system could be set up whereby the accoun-tant has access to the database online.
� It would be sensible and unbelievably lucrative to negotiate a deal withpharmaceutical companies keen for the doctors to prescribe their drugs.The Centre would need to process prescription information so that theNurse could check that the Centre is receiving the correct amount ofmoney.
– Suggested solution: prescription information is stored and paymentcalculated on the basis of agreements with pharmaceutical companies.
Key requirements are:
� An effective appointments system (Ref: R1)
� A fast and effective way of storing and retrieving patient records (Ref:R2)
� A quicker way of producing legible prescriptions (Ref: R3)
� A report showing the work schedules of each member of staff (Ref: R4)
� A report to the GPC, detailing the patient processing for each month(Ref: R5)
� A report to the PMA, detailing the drugs prescribed for that month (Ref: R6)
� A system for Nurse Payne to keep track of orders and store financialinformation (Ref: R7)
Slightly less pressing are:� Fast information concerning the catchment area for the Centre (Ref: R8)
� Up to date information about the latest medical techniques – Dr McLeanstill uses leeches (Ref: R9)
� Information about referrals to hospitals – diagnosis, treatment etc. –which is then added to patient records (Ref: R10)
80 Systems analysis: a beginner’s guide

Stop press: the Prescriptions Monitoring Agency have just been on thephone to George. Apparently they want a full report each month from nowon, as some questionable prescribing practices have been noted. It will nolonger be sufficient just to send the raw data to them. The exact details ofthe required report were lost in translation as George seemed to lose thepower of speech when recounting the conversation. However, they willsend a full description in the post.
4.4.2 The problem and requirements catalogue forSwillbuckets
Artiste booking information is currently stuffed into the Events folder. Thiswould confuse our new computer system. It has already confused Jack.Last week, a few elderly stalwarts were quietly waiting for the Gypsy Ky-Lee Clairvoyant’s show to commence, when Rocky Rocket and theRockettes burst onto the stage like a howitzer. Mr Popplewell couldn’t keepdown solids for days afterwards.
� It would be better all round if there was a way of storing booking infor-mation more effectively (Ref: P1).
– Suggested solution: a new BOOKING entity.
� Supplier and order information is all stored in the Supplier shoebox (ifit’s ever stored at all). One more order and the whole box could explode(Ref: P2).
– Suggested solution: Supplies and Order information stored separatelybut linked together.
� Members’ subscriptions become due at different times of the year andJack can’t keep track. Even the robust interventions of Amanda Stotedon’t always persuade members to renew their subscriptions on time. IfAmanda had up-to-date and accurate information, however, at least shewould be sure to pin the correct person up against the pool table (Ref: P3).
– Suggested solution: a regular report which lists overdue members anda mail merge facility to print reminders before the subscriptionbecomes overdue.
� Jack needs up to date drink stock information so that he can order morebarrels in good time (Ref: P4).
– Suggested solution: a new DRINK entity with stock informationwithin it. It is worth considering combining the FOOD ORDER andDRINK ORDER entities into one entity called ORDER. However, sinceJack only ever orders drinks from one SUPPLIER, DRINK ORDER has adifferent relationship with SUPPLIER than FOOD ORDER. In thefuture, though, Jack may order from a number of suppliers, so we needto allow for this in our design. For the time being we will keep themseparate, as this is more flexible.
The logical view 81

� Jack recently had a phone call from Lard, of ‘Little and Lard’ claimingthat they had not been paid for their last ‘performance’. Jack informedLard that they had drunk their fee after, and indeed during, their act.Lard claimed that he had no memory of this fiscal arrangement. Jacksaid this wasn’t surprising. Threats were made and the upshot is thatJack has reluctantly decided to put a cheque in the post. If Jack hadproper payment records, this unsavoury incident might have beenavoided. Jack might not have been left with the damaging mental imageof 150 kg of Lard bearing down on him (Ref: P5).
– Suggested solution: add payment information into the new BOOKINGentity.
� The ‘Forthcoming Events List’ is time-consuming to produce, especiallyas Jack has to start from a blank page every time (Ref: P6).
– Suggested solution: a word processor or DTP template which could belinked to a database to produce the list automatically. Alternatively,the information could be dynamically displayed on a web site. How-ever, since most of the Swillbuckets members think the World WideWeb is another name for the Inland Revenue, this is probably a non-starter. However, an email link for the media might be appropriate.
Key requirements are:
� A new booking system
� A new supplies and ordering system
� An overdue members report
� Accurate drink stock information
� A record of payments made to artistes and suppliers
� A better way of producing and disseminating the events list
Slightly less pressing are:
� Better supplier information
� Some feedback on members’ likes and dislikes – a record of which mem-bers attend which events might be a start
� The flexibility to book more than one artiste per event – on the under-standing that animal life will only feature in one act
SummaryIn this chapter, we have looked at data flow modelling techniques to modelwhat the current system does. We have also started to consider whatrequirements the user has for the new system. We have now completed ourinvestigation of the current system and can now begin to consider the newsystem and what options are available to us.
82 Systems analysis: a beginner’s guide

Exercises4.1 Logicalize the following, if necessary:
� Type and copy invoice
� Collate customer details
� SR1 form – blue
� File details from new customer
� View patient’s name and address
� Photocopy application form
� Delivery note
4.2 Logicalize the mail order book company DFD shown in Figure 4.15(overleaf).
The logical view 83
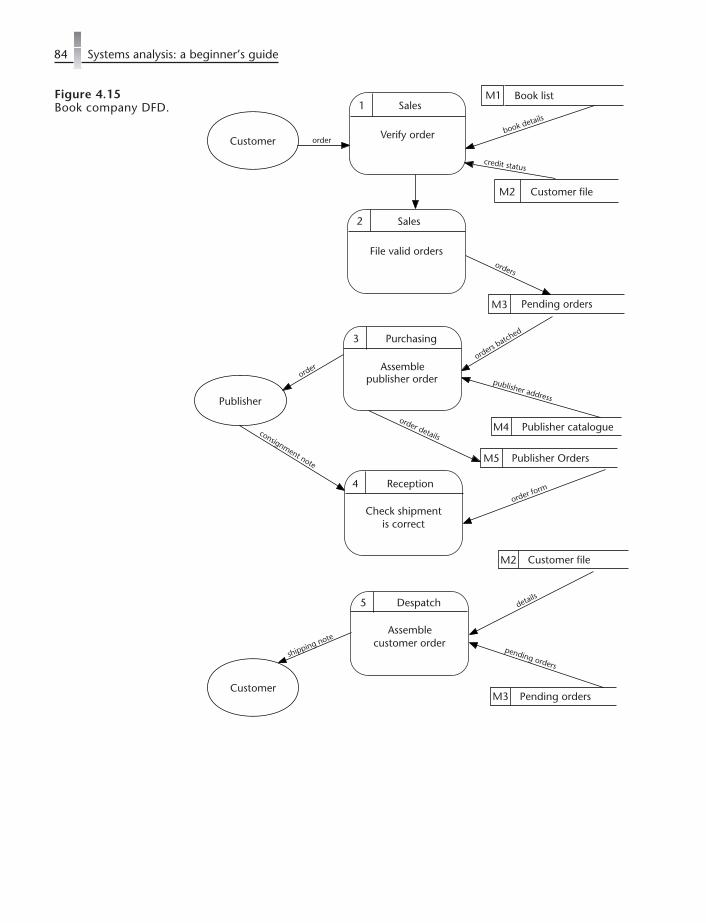
84 Systems analysis: a beginner’s guide
2 Sales
File valid orders
M3 Pending orders
1 Sales
Verify order
M2 Customer file
M1 Book list
credit status
Publisher
orders
consignment note
5 Despatch
Assemblecustomer order
details
3 Purchasing
Assemblepublisher order
orders batched
order
4 Reception
Check shipmentis correct
order form
Customer orderbook details
M4 Publisher catalogue
publisher address
M5 Publisher Orders
order details
M2 Customer file
M3 Pending orders
pending orders
Customer
shipping note
Figure 4.15Book company DFD.
C H A P T E R 5Business system
options
5.1 Business system optionsCreating the Business System Options (BSOs) and then selecting one ofthem constitutes the second Stage of SSADM. It is here that we begin tomove away from analysis and into design. Nevertheless, we may well con-tinue to identify problems and requirements as we progress, so, in a sense,analysis never finishes. What we do not want to do is find lots of problemsas we near the end of the system life cycle, as these may prove impossible,or very expensive, to resolve.
We should also try not to simply provide a more efficient version of theold system. We should consider quite revolutionary changes. It may be thatturning Swillbuckets into a bingo hall is the best thing for everyone. It willbe the user that makes the final decision about which direction to take.
Normally, the business system options consist of five or six preferredoptions for the new system. They will all be based on the Problem andRequirements Catalogue primarily, but will take different approaches tomeeting the needs of the organization. A group consisting of, for example,users and analysts will meet to define the options. Each option will need tobe described and modelled. The modelling takes the form of a RequiredLogical DFD for each option. These options are normally presented to man-agement, or a senior user, to whittle them down and make a choice. Thefinal choice may well not be one of the original options, but a mixture oftwo or three of them.
5.2 Simple steps in creating business systemoptions
1 Assemble the inputs to the process.
85

The inputs are the logical DFDs, the entity model and the Problem andRequirements Catalogue.
2 Assemble the team who will create the BSOs.This will normally be the analyst and one or more users.
3 Consider the aims of the organization and business plans.Any decisions taken about the information systems in an organizationmust be in keeping with the aims and strategies of that organization. If abusiness plan exists, it will provide guidelines for the budget for the newsystem. This kind of information is vital, as budget and time-scale will bekey parameters in the production and consideration of the BSOs.
4 The BSO production team produce a range of ideas.To begin with, the team should aim to be as creative as possible within theconstraints imposed by the organization.
5 Five or six BSOs are agreed for further discussion or presentation.The production team decide upon five or six options which will be dis-cussed with management or senior users. These may range from a cheapoption to an expensive option. One option might resolve all the problems inthe Problem and Requirements Catalogue, whereas another might onlydeal with the top-priority problems. The BSOs may consider alternatives,such as centralizing an organization’s information systems or makingthem more locally autonomous. There may be various networking andcommunications options to consider.
6 Two or three options are selected for detailed analysis.The analyst must investigate the implications of the chosen options verycarefully. Required Logical DFDs should be drawn up for each option. Acost–benefit analysis will be required which must consider the impact ofthe proposed changes on the organization. There may be a need to producean entity model for each option.
7 A choice is made and documented.Management makes a choice and the chosen option is described. It may bea mixture of two or three of the options. This specification of the requiredsystem now forms the basis of further development.
8 Elementary process descriptions are produced.These are brief narrative descriptions of the processes in the required log-ical DFDs. If there are any lower level DFDs, then these must be describedrather than their higher level equivalent. These descriptions will form thebasis of the programs required to make the system work.
5.3 BSOs at the Medical CentreEach of our BSOs must address all the key problems and requirements, butmay address all, some or none of the less pressing concerns.
86 Systems analysis: a beginner’s guide

The BSO production team might consist of a receptionist, a doctor, theNurse, a GPC representative and the analyst. After discussions, the fol-lowing options might be arrived at:
Option 1 A fully networked database system with an online sup-plies ordering system, email facilities and a printer inevery surgery.
Option 2 A networked database system with a terminal andprinter in every surgery and in reception, with Internetaccess and email.
Option 3 A simple network with a printer in reception only.Option 4 A stand alone system.Option 5 Keep the manual system, but get reliable staff to admin-
ister it.Option 6 A radical option involving the closing down of the Centre
in its current form and replacing it with a phone-in diag-nostics service and a drug dispenser.
After extensive discussions, it is decided that Option 1 is too expensive andfar too modern for the medical profession to consider. Option 6, althoughfavoured by the GPC, is rejected on the grounds that the staff would beunemployable elsewhere. Option 5 is rejected as the notion of ‘reliablestaff’ is felt to be unrealistic. Option 4 is also rejected as there would soonbe several different versions of patient records on the different PCs.
So we come down to Option 2 or 3. We should now create Required Log-ical DFDs for each of these options and produce a cost–benefit analysis. Inthis case, however, the DFDs would be almost identical, as we would still bedoing the same processes. The difference is that Option 2 would allow pro-cess 3.3 ‘Prescribe treatment’ to be performed more efficiently than Option3. This is because the prescription could be printed during the appointmentwith the doctor rather than having to collect it afterwards from reception.An additional benefit of Option 2 would be that the doctor would have thebenefit of online medical information to help with diagnosis. The requiredlogical DFD for patient processing would look like Figure 5.1.
This is almost identical to the current logical DFD (Figure 4.5). Indeed,none of the requirements in the Problems and Requirements Cataloguewould require us to alter the current logical DFDs very much in order toturn them into required logical DFDs. The only important change would bethe introduction of a new process to produce the report now required by thePMA. The other requirements are simply a matter of improving and auto-mating the processes on the current logical DFDs.
The cost–benefit analysis might look like the following.
Option 2: Fully networked database system with internet accessThis involves networking the Medical Centre with terminals in reception,and in each doctor’s and the nurse’s surgeries. All terminals would haveInternet access. Additionally, an integrated database system would be avail-able incorporating appointments, registration, patient records, prescriptions
Business system options 87

and management information. The nurse would have access to a suppliessystem.
A Required Physical DFD could be drawn demonstrating the effects. Thiswould show whether the processes are computerized or not, batch oronline, and where they are done.
CostsCosts would be quite high – a server PC plus at least five terminals, fiveprinters, communications hardware and software, other software, ISPcosts, additional phone charges etc.
Approximate cost: £50,000.
BenefitsBenefits would be impressive:
� Automatically produce a range of management information reportswhich could save lots of money eventually.
88 Systems analysis: a beginner’s guide
3.2
Diagnose illnessor refer
3.3
Prescribetreatment
D2 Appointment
appointment
patient
3.1
Receive patientfor appointment
appointment
appointment
patient
D1 Patient
patientpatient
referral
HOSPITAL
referr
al
patient
referral
D4 Drug
drug
PATIENT
PATIENT
prescription
D3 Prescription
prescription
3.4
Create repeatprescription
patient
D1 Patient
patient
repeat prescription
repeat prescription
Onlinemedical info
patient
Figure 5.1Required Logical DFD‘Process patientrequirements’(Option 2).

� Might need fewer staff (sorry George).
� All doctors would have immediate access to all patient records.
� Even Betty would not be able to double book appointments, as thesystem would prevent this happening.
� Easy access to important online medical information would improvediagnosis and might save hundreds of lives (a week).
� Security features would prevent unauthorized access to private informa-tion. Of course this wouldn’t stop Chelsea gossiping.
� Validation checks would ensure that only sensible information is entered– more or less.
� Printing prescriptions would allow chemists to read them instead ofhaving to phone up the Centre and ask what they said.
� Repeat appointments could be automatically entered into the systemand letters reminding patients could be printed.
To be useful, the analysis of benefits needs to have some sort of figure orrating attached to it. This might be an assessment of the financial benefitsof the option under scrutiny, or it might be a risk assessment resulting in arisk rating.
TimeIt is estimated that this option would take 4 months to deliver.
ImpactThis would have a major effect on the quality of the service, but would haveimplications for staff training. The phrase, ‘Betty, connect the tapestreamer and start the backup’ is not one which could be uttered withmuch conviction.
A similar analysis would need to be carried out for the remaining optionsand then a final decision reached. Let’s assume Option 2 is chosen.
5.4 BSOs at SwillbucketsAfter due consideration of the options with Amanda, Freddo and someonein the bar, Jack has chosen a database system containing the requiredinformation on bookings, orders, suppliers and members. Jack has decidednot to try to gather information on which members attend which events, ashe feels that would be overkill. As a result, the MEMBER entity will not belinked to the rest of the system on our required entity model. We will stillstore information about members, but not about which events they attend.
In a surprise move, Jack has decided to go for a web site. This is anamazing turnaround. When first asked if he wanted to go online, Jackthought he was being invited on a fishing trip. However, he was quick to
Business system options 89

see the benefits of a web site containing forthcoming events information.This could be linked to the database and would automatically display theevents as Jack entered them. This would save him having to phone themedia, as the local newshounds could simply log into Jack’s web site forinformation. His flier for the members could be generated from the data-base and printed as a report.
A small network would be required linking Jack’s PC in the office behindthe bar with Freddo’s PC in the corner of the kitchen by the freezer. Thiswould enable Freddo to keep the food stock and dish information up todate.
CostsTwo PCs (one a server), one printer, communications hardware and soft-ware, web access, a couple of swivel chairs – about £10,000. Running costsmight be £50 a month.
BenefitsJack would save a lot of time currently spent leafing through shoeboxeslooking for records. With all this spare time, he is thinking of joining theGnarlsborough Marrow Growing Circle in an attempt to meet some inter-esting people and/or vegetables.
The sharing of information between Jack and Freddo would be ofimmense benefit to the whole community. Never again would Jack buy agross of pigs’ trotters, throw them in the corner of the kitchen and findFreddo boiling them up six weeks later. With the new system, Freddowould know as soon as Jack made a purchase and could plan his dishesaccordingly. He could do this, though he might not bother.
Up-to-date drink information would save Jack from running out of keydrinks such as Black Rock Stout, Dark Ramshead Bitter, Old Moor Porterand Babycham. This should increase sales, improve customer satisfaction,and generally make members very happy right up to the point when con-sciousness is temporarily lost.
Freddo is keen to put his meat recipes up on the web site. He is confidenta book deal might be in the offing. He hasn’t quite decided on a title,though A Love Affair with Offal is the current favourite.
TimeIt is expected that the system could be up and running in two to threemonths.
ImpactAs long as Jack and Freddo keep the information up to date, the impactshould be considerable in terms of efficiency gains. However, there is aclear danger that the PCs will just gather dust after an initial burst ofenthusiasm. It is important, therefore, that both Jack and Freddo feelclosely involved in all aspects of the design. This will make them morelikely to use the system.
90 Systems analysis: a beginner’s guide

SummaryIn this chapter, we have considered the range of business options availablein our case studies and how to choose a preferred option. This completesStage 2 of SSADM.
Business system options 91

C H A P T E R 6Requirementsspecification
6.1 Requirements specificationWe know, broadly speaking, the kind of system we are working towards.We now need to specify it. To specify it means to model and describe it indetail. This will require the analyst to produce a full set of required logicalDFDs, a required entity model and a sensible data structure. Various checkswill also be required to ensure that we haven’t missed anything.
6.2 Required logical modelsWe must now produce a top-level required logical DFD, any lower levelDFDs which might be required and a required entity model.
The top-level required logical DFD for the Medical Centre might look likeFigure 6.1.
Figure 6.2 shows the required logical DFD Level 2 for ‘Process manage-ment information’.
The required logical DFD for ‘Process patient requirements’ has alreadybeen completed (Figure 5.1). The other Level 2 required logical DFDs areidentical to the current logical DFDs, as discussed in the previous chapter.
The required entity model would need to reflect the new entities DRUGCOMPANY and PAYMENT. We would also need to calculate and store theexpected payment somewhere. This could be done by extending thePRESCRIPTION LINE, DRUG and DRUG COMPANY entities, so that thesystem calculates the payment generated by each prescription. Exactlyhow this calculation is made will be looked at in the next chapter. The newentity PAYMENT will be required to store the details of payments from thedrug companies. A further decision is to merge the DOCTOR and NURSEentities, since NURSE would only have one record. This makes it untenableas an entity.
92

The required entity model is shown in Figure 6.3. Note that the companyname in DRUG is referred to as ‘Supplier’. The attribute ‘Supplier’ is, there-fore, an alias for DCompanyName. This means that the attributes are iden-tical but have two different names.
The required entity model for Swillbuckets Club also needs creating. TheBOOKING entity has been inserted and the EVENT TICKET and MEDIAentities removed, as Jack does not wish to gather information about theseentities. DRINK and DRINK ORDER LINE have been inserted to allow formore accurate drink stock information.
Requirements specification 93
1
Registerpatient
2
Processappointments
PATIENT appointmentappointment
patient
UNIVERSITYpatient
GPCpatient
3
Processpatient
requirements
prescription
HOSPITAL referral
referral
PMA
4 Reception
Processmanagementinformation
prescription
GPC
rota
ACCOUNTANT
report
expenses
5 Nurse
Maintainsupplies
SUPPLIER
supplier
order
order
Onlinemedical info
patient
orderinvoice
patient
DRUGCOMPANY
payment
payment
Figure 6.1Required logical DFD– Level 1.

6.3 Elementary process descriptionsThese provide descriptions of the lowest level (elementary) processes forthe required system. The format for these can vary depending upon thenature of the process being described. Some processes are very simpleand will just require a short written description. For example, process2.3 ‘Cancel Appointment’ is simply a matter of finding the particular
94 Systems analysis: a beginner’s guide
4.2
Update workrota
4.3
Update staffincome/expenses
D5 Doctor/Nurse
previous rotarota
4.1
Create workrota
preferred time
rota
rota
rota
GPC
rota
rota
ACCOUNTANT
DOCTOR
pay
expe
nses
expe
nses
expenses
4.4
Create PMAreportPMA
D3 Prescription
prescription
prescription
patie
nt
patient
report
4.5
Receive andcheck drugcompanypayments
D4 Drug
DRUGCOMPANY
payment payment
payment
ACCOUNTANT
payment
Figure 6.2Required logical DFD‘Process managementinformation’.

appointment and deleting it from the system. Process 2.1 ‘Create newAppointment’ is fairly straightforward and might look like Table 6.1.
However, the process 1.1 ‘Register Patient’ is a little more complex. Weneed to find out if patients are eligible to be registered by ensuring they areeither a student or living in the catchment area. If they are eligible, we needto register them and allocate them to a doctor. We need a policy for doing
Requirements specification 95
PATIENT
PatientNoP_FirstNameP_SurnameP_ AddressP_DOBP_Tel_homeP_MobileP_DoctorName
APPOINTMENT
AppointmentNo*PatientNo*Doctor/NurseNameA_DateA_TimeA_Outcome
PRESCRIPTION
PrescriptionNo*PatientNo*Doctor/NurseNameP_Date
SUPPLIER
SupplierNoSupplierNameS_AddressS_TelS_Contact Name
DOCTOR/NURSE
Doctor/NurseNameD_AddressD_Tel_HomeD_MobilePagerStartDate
ORDER
OrderNo*SupplierNo*Doctor/NurseO_DateO_Total
PRESCRIPTIONLINE
*PrescriptionNoDrugCodeDosageConditionValue
TREATMENT
RecordNo*PatientNoDateConditionPrescriptionNoOutcome
REFERRAL
ReferralNo*PatientNo*Doctor/NurseNameR_DateDestinationR_Outcome
WORKROTA
*Doctor/NurseNameDateStartTimeEndTimeHoursWorked
DRUG
DrugCode*SupplierUsageSideEffectsRestrictionsTotalValue
ORDER LINE
*OrderNoProductCodeQuantityCost
EXPENSES
ExpenseNo*Doctor/NurseNameExpenseTypeE_AmountE_date
DRUGCOMPANY
DCompanyNameAddressDC_TelDC_Contact
REPEATPRESCRIPTION
RepeatPrescripNo*PrescriptionNoFrequencyNextDate
PAYMENT
PaymentNo*DCompanyNamePaymentDateAmount
Figure 6.3Required entitymodel – MedicalCentre.

this. It may be that we simply allocate them to the doctor with the lowestnumber of patients.
All of this is a little complex to write in narrative form and could lead toconfusion. It is a good idea, in cases like this, to use techniques such asstructured English or decision trees.
96 Systems analysis: a beginner’s guide
ARTISTE
ArtisteNameRealNameArtisteAddressTel_homeA_Mobile
MEMBER
MemberNoMemberNameMemberAddressPhoneNoM_MobileM_Date
DISH
DishNamePrice
FOODORDER
FOrderNoOrderDate*SupplierNoDeliveryDate
SUPPLIER
SupplierNoSupplierNameS_AddressS_TelS_ContactName
INGREDIENT
IngredientNoIngredientNameI_QuantityInStockI_ReorderLevel
DRINKORDER
DOrderNoOrderDate*SupplierNoDeliveryDate
EVENT
EventNoEventNameEventDate*DishName
DISHDETAILS
*DishName*IngredientNoIngredientQuantity
FOODORDERLINE
*FOrderNo*IngredientNoF_QuantityF_Price
DRINKORDERLINE
*DOrderNo*DrinkNameD_QuantityD_Price
DRINK
DrinkNameD_Quantity InStockD_ReorderLevelD_Type
BOOKING
BookingNo*EventNo*ArtisteNameBookingDateDatePaidAmountPaid
Figure 6.4Required entitymodel – Swillbuckets.

6.3.1 Structured English and decision trees
Structured English is sometimes referred to as pseudo-code and is a kind ofhalf-way house between English and a programming language. It makesuse of some conventions originally used in languages such as Pascal orBASIC. Commands such as IF... ENDIF or REPEAT ... UNTIL can be used.However, the syntax does not have to conform to a rigid programming lan-guage and spoken English words can be used as well.
Using structured English, we might come up with something like this for1.1 ‘Register Patient’:
IF patient NOT registeredIF patient is a student
register patientELSE
IF patient in catchment arearegister patient
ELSEsend patient elsewhere
ENDIFENDIF
ELSEinform patient they are registered already
ENDIF
Of course this is just a rough description of the process, but it does give thepoor programmer, who will eventually have to implement our system, apretty clear idea of what is required.
A decision tree modelling the same process would look like Figure 6.5.
Requirements specification 97
Elementary Process Description
System: Medical Centre
Author: Kevin Bowman
Date: 30/3/03 Page 1 of 1 Draft/Final
Process Id: 2.1
Process Name: Create new appointment
Inputs to Process: Notification ofPatient’s need for appointment,preferred times
Outputs from Process: Appointmentcreated, Patient informed
Process Description: Patient requests appointment. Receptionist checks whichappointments are available. The patient is given some options for an appointmentand chooses the preferred time. The appointment is created and confirmed withthe patient.
Table 6.1 Elementary process description example.

Clearly, this technique models only the decision-making aspects in a pro-cess. It does not model the whole process as fully as the structured Englishexample.
It must be remembered that we are still in the early stages of design andthese processes could change further. When we are a little more certain ofwhat is required for the new system, we will use a further, more definitive,technique for describing processes called decision tables.
6.3.2 Decision tables
Decision tables are an alternative to structured English and decision treesand offer a more detailed specification. They are only necessary when thereis the possibility of confusion concerning the exact logic of a particularprocess.
A decision table is made up of four sections:
1 The possible conditions which might apply to the process.
2 The possible actions to take.
3 The possible combination of conditions which can occur.
4 The choice of action for each possible combination of conditions.
As an example, we will look at the process at the Medical Centre – ‘3.5Receive and Check Discount’.
The drug companies operate a scheme whereby they categorize a surgeryas gold, silver or bronze each month, depending upon the value oftheir drugs prescribed by the surgery. If the surgery prescribes over£50,000 worth of drugs in a month, they become a gold surgery andreceive a payment worth 10% of the value of the drugs. If they prescribe£10,000–£50,000 worth of drugs, they are categorized as silver and
98 Systems analysis: a beginner’s guide
1 Is patient registered?2 Is patient a student?3 Is patient in catchment area?
2
informpatient
1
registerpatient
3no
yes
no
registerpatient
sendelsewhere
yes
no
yesFigure 6.5A decision tree forprocess 1.1 ‘Registerpatient’.
receive 5% of the value. If they prescribe less than £10,000 worth ofdrugs, they receive bronze status which entitles them to a free first-aid kit,unless they received a first-aid kit last month, in which case they receivenothing.
In our new system, it will be the responsibility of Nurse Payne to checkthat payments are accurate. Nurse Payne is not keen on financial adminis-tration, however, and we need to make this process as automatic as pos-sible. Using a decision table, we can specify a computer program to checkthe payments automatically. All Nurse Payne will need to do is compare thepayment expected with the payment received.
So let’s set up the decision table using simple steps.
6.3.3 Simple steps in decision tables
1 List the possible conditions.The possible conditions for this process are:
Condition 1: Prescribed more than £50,000 worth of drugs (>50)Condition 2: Prescribed £10,000–£50,000 worth of drugs (10–50)Condition 3: Prescribed less than £10,000 worth of drugs (<10)Condition 4: Received first-aid kit last monthThere must be no ambiguity here. For example, it must be clear what
happens if exactly £50,000 worth of drugs is prescribed. In this case, itwould meet Condition 2 only.
2 List the possible actions.The possible actions are:
Action 1: Gold status (10% payment)Action 2: Silver status (5% payment)Action 3: Bronze status (first-aid kit)Action 4: Receive nothing
3 Calculate how many combinations of conditions can occur.This calculation is performed using the simple expression 2c. In otherwords, if there are four conditions, there will be 24 combinations of condi-tions i.e. 16 conditions. These normally take the form of a Y (Yes) or a N(No) sequence in the table (see Figure 6.6).
4 Prescribe actions for each combination of conditions.These are prescribed by the conditions laid down above.
5 Draw the draft table.The table is drawn using a four-part grid as in Figure 6.6.
There is a technique to ensure that all possible combinations of ‘Y’s and‘N’s are covered. We know there are 16 combinations of conditions. In thefirst row (>50,000), we make the first 8 ‘Y’s and the second 8 ‘N’s. In thenext row (10,000–50,000), we put 4 ‘Y’s followed by 4 ‘N’s and alternate inpatterns of 4. In the next row (<10,000), we alternate in patterns of 2.
Requirements specification 99

Finally, in the last row (First-aid kit), we alternate every time. This ensuresthat if we read vertically down the columns, every possible combinationoccurs somewhere.
6 Rationalize the table.This involves removing the impossible conditions and editing the redun-dant conditions. An example of an impossible condition is: if the drugs areworth over £50,000, then they can’t also be worth £10,000–£50,000, or lessthan £50,000, so these columns can be removed. The first column in Figure6.6 is just such a column. Similarly, it cannot be the case that none of theconditions applies, so the column with all ‘N’s can be removed.
A redundant condition occurs if the same action applies whether a con-dition is ‘Y’ or ‘N’. In this circumstance we place a dashed line in the condi-tion entry. For example, whether the Medical Centre received a first-aid kitlast month is irrelevant if prescriptions are over £10,000. The Centre stillreceives the payment.
The rationalized table (Figure 6.7) looks much simpler.
The decision table could now form the basis of a program to implement aroutine to calculate the payment for each drug prescribed and output areport each month for the Nurse to check against actual payments. The
100 Systems analysis: a beginner’s guide
>50,000
10,000–50,000
<10,000
First-aid kitlast month
Y Y Y Y Y Y Y Y N N N N N N N N
Y Y Y Y N N N N Y Y Y Y N N N N
Y Y N N Y Y N N Y Y N N Y Y N N
Y N Y N Y N Y N Y N Y N Y N Y N
10% payment
5% payment
First-aid kit
No payment
X X X X X X X X
X X X X
X X
XX
Figure 6.6Draft decision table.
>50,000
10,000–50,000
<10,000
First-aid kitlast month
Y N N N
N Y N N
N N Y Y
- - N Y
10% payment
5% payment
First-aid kit
No payment
X
X
X
X
Figure 6.7Rationalized decisiontable.

report could even contain a chart to inform the doctors, which might looklike Figure 6.8.
6.4 Input/output designThis part of the process is crucial to the success or failure of the system. Ifusers do not input data correctly, we will not have an effective system.Readers will, no doubt, be familiar with the maxim ‘Garbage in, garbageout’; it is at this stage that we can do most to avoid the garbage going in.Incidentally, the maxim above also happens to be Freddo Smitho’s mottoon dish production, but let’s not dwell on that.
Any system, computerized or not, can be stripped down to three basiccomponents: INPUT, PROCESSING and OUTPUT. Well, here we are goingto design two of the three. We need to do everything we can to ensure thatthe user only inputs sensible, accurate data. We also need to ensure thatoutputs are easy to understand and relevant to the user. They are, after all,the reason for the system being created.
Screen designs are the first impression the users will get of the system,and as such the system may be judged on the basis of these screens. If theusers do not like these screens, for whatever reason, they may turn againstthe system and possibly not use it at all.
Strangely, we need to consider the outputs before we can consider theinputs. This is because we need to identify what outputs are required,before we can be sure what inputs will be needed to produce these outputs.
Requirements specification 101
Paracetamol74%
Penicillin13%
Cough mixture10%
Boil cream1%
Ear drops1%
Other1%
Figure 6.8Prescription values.

6.4.1 Output design
So what is an output? An output might be a printed report for a manager orexternal body. Alternatively, an output might be a screen displaying thequantity of drinks in stock or a chart showing the number of patients eachdoctor has registered. Management reports can be of various types:detailed or just a summary. So outputs come in many shapes and sizes. Theanalyst will need to decide which type of output is required in each caseand to document this.
The outputs can be identified from the required logical DFDs. Any dataflows to external entities are outputs. Also, data flows from data storesmight be outputs. For example, before Jack places an order with a supplier,he will need to view the supplier information. So he will need a list of sup-pliers with contact details and product information so that he can make aninformed choice of which supplier to honour with an order for a truckloadof mushy peas. The list of suppliers, and the order itself, are both outputs.
It may not be necessary to identify every possible output in advance.Most modern database packages include simple reporting tools and wiz-ards so that most users will be able to set up their own queries as required.
When designing outputs, it is not wise to sit at a PC and start pressingbuttons straight away. It is far better to start with a pencil and paper anddraft a rough design for the screen or report.
Pre-formatted design sheets are often used featuring XXXXs to representalphanumeric characters and 9999s to represent numeric information (seeTable 6.3 below). In this way, fields or columns can be quickly positionedon the design. Report headings and sub-headings will appear at the top ofthe design and on every new page. At the end of the report, some kind ofsummary, such as totals and a grand total for numerical fields, will nor-mally be appropriate.
Additional features will depend upon the nature of the report, but thedate and page numbers will usually appear. Related information such aspatient name, address and telephone number will appear together in a sen-sible order. The key thing is to make the report clear and legible. This maymean including some white space around columns or headings so that thereport does not appear too cramped. Also, it is often worth supporting rowsand rows of figures with a chart or two picking out the key items ofinformation.
Whether the output is on-screen or in the form of a written report, itmust be carefully designed to suit the user. This usually means the outputsmust be relevant and clear as a minimum requirement. Internal reports,such as the work rota in the Medical Centre, will normally be just that – rel-evant and clear. However, reports to the GPC might be crafted more care-fully, perhaps highlighting key information through charts, or groupingrelated information together.
Another example of an external report might be the report to the PMA,which will list all the prescriptions issued by the Medical Centre over agiven period. A short extract from the report might look like Table 6.2.
102 Systems analysis: a beginner’s guide

However, this is not a particularly well-designed report. The informationis not in any significant order (just by date of entry), and nothing is high-lighted as being particularly significant. No report headings or dates are inevidence. A more useful report might group the report by prescription, asprescriptions are the focus, and order by date within the prescription. Abetter report design might look like the one in Table 6.3.
This design might produce a report like Table 6.4.This is a clear and simple design with no frills as it is for the sole use of a
government agency and is not for public view.An example from Swillbuckets: Jack will want to send details of forth-
coming events to the media and to club members. This report needs to beclear and well-presented as it is for public view. An example of this kind ofoutput is shown in Table 6.5.
Requirements specification 103
NHSnumber
Patientname
Prescriptiondate
Prescription Diagnosis Doctor
4534552 Wilf Carp 23/11/02 Paracetamol Broken leg McLean
3455622 Oliver Plum 12/12/02 Paracetamol Paracetamoloverdose
Hammler
4667782 Jason Spink 14/12/02 Paracetamol Collapsedlung
McLean
6733332 IreneSkidmore
14/12/02 Penicillin Gout Prodder
4667782 Jason Spink 15/12/02 Cod liver oil Collapsedlung
McLean
4667782 Jason Spink 16/12/02 Iron lung Respiratoryfailure
Prodder
Table 6.2 PMA report – weak design.
Medical Centre at the University of LifePMA Report – {report date}Prescription: {prescription}
NHS number Patient name Prescriptiondate
Diagnosis Doctor Amount (g)
9999999 XXXXXXXXXXXXXXXXXXXXXXXX
dd/mm/yy XXXXXXXXXXXXXXXXXXXXXXXX
{doctor} 999
Total 9999
Page no.
Table 6.3 PMA report design.

Image considerations such as a logo and the overall impression createdby the reports will be important here.
Other reports will simply be on-screen reports. Here, the user will viewone record at a time (e.g. members at Swillbuckets). Such screens will needto be simple and attractive. Additionally, there will need to be facilities toallow the user to move to other screens e.g. a ‘Back’ button and a ‘Forward’button. Many of the issues of screen design will be looked at in the InputDesign section (6.4.3). One key factor in output design, though, is toinvolve the user. Users get very frustrated with designs which don’t quitefit the bill, especially if they have to use them day in day out.
104 Systems analysis: a beginner’s guide
Medical Centre at the University of LifePMA Report – 4th Quarter 2002Prescription: Paracetamol
NHS number Patient name Prescriptiondate
Diagnosis Doctor Amount (g)
4534552 Wilf Carp 23/11/02 Broken leg McLean 50
3455622 Oliver Plum 12/12/02 Paracetamoloverdose
Hammler 20
4667782 Jason Spink 14/12/02 Collapsed lung McLean 100
Total 170
Prescription: Penicillin
2344552 Holly Skidmore 14/12/02 Gout Prodder 50
5656632 Archie Bloggs 18/12/02 Lumbago Squeam 100
Total 150
Prescription: Cod Liver Oil
4667782 Jason Spink 15/12/02 Collapsed lung McLean 300
Total 300
Prescription: Iron Lung (Ventilator)
4667782 Jason Spink 16/12/02 Respiratoryfailure
Prodder
Page 1 of 5
Table 6.4 PMA report – good design.

6.4.2 Simple steps in output design
1 Decide on the purpose of the report.This will involve talking to the user.
2 Decide how the report will be used.Will the report be for internal use, or external use? Will it be required regu-larly or just in exceptional cases?
3 List the information to be included in the report.What fields from the database will be included? Will there be any charts ormultimedia output? Only include information the user wants. Just becauseinformation is available does not mean that it should be in the report.
4 Decide whether the output will be on-screen, printed or both.
5 Design the report.This can be done on a piece of paper or using a pre-formatted design sheet.
6 Produce a prototype report.This should be discussed with users before the final design is specified.
6.4.3 Input design
This phase of the design process focuses on getting data into the system asquickly and effectively as possible. The first part of the process is to deter-mine exactly what we are going to put into the system. This can be achievedby listing all the attributes for each entity on our entity model. In otherwords, all the bits of data, such as Patient Name, Patient Address and so on,
Requirements specification 105
Swillbuckets Club December Events List
Date Event Name Artiste EntranceFee
11/12/02 Man of Men Competition Sharon Twain Entertains £5.00
12/12/02 Dan on Spoons Dan Pickles £1.50
16/12/02 A Right Good Do Little and Lard £3.00
19/12/02 5-legged Pig Race Rocky Rocket and theRockettes
24/12/02 Christmas EveExtravaganza
Tracey Beardmore is ShirleyBassey
£5.78
compiled by Jack Trout (Secretary) tel: 5554448
Table 6.5 Events List report.

will need to be input somehow. In addition we will need to look at the DFDsto see what data is flowing into the system from external bodies. All of thatdata may well have to go into our system. The student list required for theregistration of patients at the Medical Centre is an example of this.
Once we know what data is going in, we need to decide how it’s going toget into the system. There are various input devices we might use. There aresome devices which will input data automatically, such as barcode scan-ners. If possible, these should be used, as they reduce the risk of errorsbeing made. However, in many cases this is not appropriate. After all,patients might not be too happy about having bar codes imprinted on theirforeheads. On the other hand, it should be possible to arrange for the stu-dent lists arriving from the University to be easily imported into the ‘Pa-tient’ table. The Centre would have to insist that the lists arrive in digitalformat and then a little program could be written to allow the receptioniststo import the file into the system.
So we will need to go through all the inputs and decide how we are goingto perform the input, automating it where possible. Often, manual inputswill be required and this is where forms, or data entry screens, are used.
Data entry screensThere is one key thing to consider when designing these screens. We shouldtry, at all times, to minimize the amount of data being input and thenumber of keystrokes required to do it. We can do this by using data alreadyin the system to calculate or produce other data items where possible. Also,we can introduce codes and abbreviations to save typing in long strings ofdata. If there is a limited range of possible inputs, we can list them andallow the user to click on the one they want.
At the Medical Centre, most of the patients are students, so if we wantedto store occupation information, we could set up the system so that ‘Stu-dent’ would be automatically entered on the screen. The receptionist couldchange this on the occasions that it did not apply.
There are a number of Human–Computer Interface (HCI) considerationsto bear in mind when designing these screens:
� Data entry screens often require the user to enter the data from a paperform directly into the form on the screen. If this is the case, the form onthe screen should be consistent with the paper form, as far as possible.Ideally, it should be identical. At the very least, the fields on the screenshould be in the same sequence as those on the form.
� Generally, the data should be input into the form moving from left toright and from top to bottom.
� Similar types of information should be grouped together – e.g. name,address, phone number.
� Use headings and labels to help the user identify the data.
� Use comments and instructions to tell the user what to do.
106 Systems analysis: a beginner’s guide

� Make it easy to move between screens – this may involve the use of sub-forms to minimize the need to move around (see Figure 6.9).
The example in Figure 6.9 shows a well designed data entry screen forthe Medical Centre. The main form can be used for finding an existingpatient or for entering a new patient’s details. However, there is anappointment sub-form attached to it so that the receptionists can see pre-vious appointments and add a new appointment without leaving thepatient’s main screen.
The screen looks clear and uncluttered. Note that the text is primarily lowercase. This is easier to read than upper case. Also, the font needs to be easy toread, so avoid fancy fonts and italics. Use lines or boxes to separate differentareas. The background should normally be plain. A simple colour scheme isfine, but avoid lots of different colours. Images and animations may gettedious by the time the user has input 200 new patients, so use with care.
Data validationIt is important to make every effort to ensure that the data entered into thesystem is accurate and sensible. This involves designing data validation
Requirements specification 107
Figure 6.9Well-designed data entry screen.

checks. As mentioned above, the less data users need to enter, the fewererrors they can make. Additionally, we can check most of the data beingentered to try to spot errors before they become part of the system.
These are the kinds of checks we can build in to data entry screens:
� Check that key and mandatory fields have data in them.
� Check that numeric data is within a sensible range – e.g. no-one can beaged 601 (indeed, very few reach 61 if registered at the Medical Centre).
� Check that data is of the right type e.g. a name with a ‘7’ in it is unlikelyto be accurate.
� Check that data is entered in the right order.
� Check that data is sensible; e.g. an appointment time of 3.30 a.m. mightraise eyebrows.
All of these can be done automatically and any errors might generate amessage like ‘George, no-one was born on 15/h6/!%; have another try’.Generally, error messages should be simple and factual. Having just madeyet another error, the data input clerk is normally in no mood for jokeymessages.
6.4.4 Simple steps in input design
1 Identify the data to be input.
2 Determine the input method.
3 Design the screen.
4 Design the validation process.
6.4.5 User interface design
The user interface refers to the elements of a system through which userscommunicate with the system. Data input and output are a part of this, butthere are other related elements. We are aiming to achieve a high-qualityinterface, by which we mean an interface that is easy to learn, easy to useand efficient. After a while, the interface should feel intuitive so that theuser can move around the system without having to think.
Consistency is a key factor in making an interface easy to learn. The useof labels and icons must always be consistent. The same label or iconshould always mean the same thing. Also, the way the screens are struc-tured must be consistent and efficient.
For example, many systems use a menu structure to help users find thefacility they want. The top-level menu will list all the main functions oroperations performed by the system. There should be no more than six orseven of these. The user will choose one of these options and then be pre-sented with a sub-menu. Very quickly, the user should reach the facility
108 Systems analysis: a beginner’s guide

that he or she requires and will be able to run the program. Clearly, therewill need to be user involvement in the design of the menus.
It is often a good idea to include a Help facility in the system. This mightbe an indexed user guide, or a link to a web site where help is available.Other user interface features to consider will be: check boxes; radio but-tons; scroll bars; drop-down lists and so on. All of these can save users timeand effort as well as make the interface attractive and easy to use. More ofthis in Chapter 8.
SummaryIn this chapter, we have begun the process of specifying the requirementsof the new system. Requirements specification continues in the nextchapter, which involves the enhancement of the data model. This is morecommonly referred to as normalization.
Exercises6.1 Produce a decision table to model the logic in this scenario:A postal delivery company delivers parcels air or rail transport. The price ofdelivery by air depends upon the weight of the parcel. There is a basiccharge of £5 per kg up to 50 kg. Excess weight over 50 kg is charged at £3per kilo.
Delivery by rail is charged at £3 per kg up to 50 kg and then £2 per kg.There is a special service guaranteeing same day delivery which carries anadditional flat rate charge of £20.
Any deliveries overseas are charged at double the normal rate.
6.2 Produce a structured English specification for this scenario:A travel agent has account customers and individual customers. Accountcustomers who have spent over £25,000 in the past year get a discount of25%. Otherwise, they get a 10% discount. Individual customers who havebooked holidays previously get a 5% discount. New customers get no dis-count. Account customers who have spent over £10,000 in any previousyear will receive offers of free tickets on selected routes.
6.3 Design a report for the Medical Centre showing the appointments forthe following week. The report will be used by the receptionists to checkpatients as they arrive for their appointment, so consider what informationwill be required on the report.
Requirements specification 109
C H A P T E R 7Normalization
7.1 NormalizationNormalization is a bit like having a vaccine injected into your arm. It’spainful (I’ve seen grown men cry), but it’s better than the alternatives.
Normalization is a way of modelling the structure of the data. With a bitof luck, you should end up with the tables designed and ready to use.
You will already have done a version of this modelling of the data structurewhen you did your entity models. So why do it all again? Well, the entitymodels started from very general things, or entities, and then got more andmore detailed. Normalization is the other way round. You start with all thebits of data lying around on forms or in filing cabinets and you sort them intogroups of similar data. These end up being the tables, or data structure.
This is called ‘bottom up’ design. The aim is to help you understandbetter the data required by the new system, and to check that the entitymodel you have is accurate. Usually it’s not, and you end up having to doanother after normalization.
The other point is that entity modelling is a bit hit and miss, whereasnormalization is based on mathematical principles and, if you do it right,should give you a bullet-proof design. It’s the doing it right bit that cancause some pain.
7.1.1 What happens if data isn’t normalized
We’ll use Swillbuckets Country Club to demonstrate the nightmare thatcould happen if you don’t normalize. As you may know, Swillbuckets pridesitself on its meat dishes as well as the high-quality artistes who regularlyentertain the members.
As a result of all these different activities, there are all sorts of databuzzing round the place. Here’s a list of some of the data categories orfields; there would be more but these will do for now:
110

EventDateArtisteNameTelNocostStartTimeDishNameIngredNamequantityNoInStock
(The convention in this book is that where two words are required in thename, capital letters are used to denote this.)
We could just put all this data into one big table and start entering data.We would end up with something like Table 7.1.
Normalization 111
EventDate
ArtisteName TelNo cost (£) StartTime
DishName IngredName quantity NoInStock
01/05/03
TraceyBeardmore isShirley Bassey
33333 50 8.00 Chicken in apolystyrenetray
chicken quarter 4320
polystyrene 1 1044
02/05/03
Jade Green andher DancingChihuahuas
44444 80 7.00 Offal surpriseand peas
sheep intestines 0.5 kg 202
peas 28 550
04/05/03
Sharon TwainEntertains
55555 90 8.00 Skeweredkidneys inlager
kidneys 6 4078
lager 10 50
skewer 1 45
07/05/03
Gypsy Ky-LeeClairvoyant
66666 25 7.00 Crispy duckand crisps
duck half 345
prawn cocktailcrisps
1 5500
08/05/03
TraceyBeardmore isShirley Bassey
33333 50 7.30 Industrialstrength chilli
old beef 1 kg 188
tin of sauce 1 377
rice 4 g 289
09/05/03
Jade Green andher DancingChihuahuas
44444 80 7.00 Offal surpriseand peas
sheep intestines 0.5 kg 202
peas 28 550
Table 7.1 Unnormalized data.

One or two problems are clear straight away. We are repeating all theinformation about an artiste every time we book them. For example, everytime we book ‘Jade Green and her Dancing Chihuahuas’, we are also typingin the phone number and the cost. Since we already have this information,it is a waste of time and disk space to keep repeating it.
Another problem is the gaps that appear. The full effects of these gapswould not be seen until we tried to sort the information. If we sorted oningredient (IngredName), say, to use as a shopping list, we’d end up withone looking like the one in Table 7.2.
Now I’m no TV chef, but I would suggest that ‘Skewered kidneys in lager’would not normally have prawn cocktail crisps as a key ingredient.(Although, come to think of it, it might not be too bad....) Similarly, ‘Indus-trial strength chilli’ probably wouldn’t benefit much from having polysty-rene tipped in. You can see the sort of problems we’re having here.
112 Systems analysis: a beginner’s guide
EventDate
ArtisteName TelNo cost (£) StartTime
DishName IngredName quantity NoInStock
01/05/03
TraceyBeardmore isShirley Bassey
33333 50 8.00 Chicken in apolystyrenetray
chicken quarter 4320
duck half 345
07/05/03
Gypsy Ky-LeeClairvoyant
66666 25 7.00 Crispy duckand crisps
lager 10 50
08/05/03
TraceyBeardmore isShirley Bassey
33333 50 7.30 Industrialstrength chilli
old beef 1 kg 188
peas 28 550
peas 28 550
polystyrene 1 1044
06/05/03
Sharon Twainentertains
55555 90 8.00 Skeweredkidneys inlager
potatoes half a tin 5060
prawn cocktailcrisps
1 5500
rice 4 g 289
sheep intestines 0.5 kg 202
02/05/03
Jade Green andher DancingChihuahuas
44444 80 7.00 Offal surpriseand peas
sheep intestines 0.5 kg 202
09/05/03
Jade Green andher DancingChihuahuas
44444 80 7.00 Offal surpriseand Peas
skewer 1 45
tin of sauce 1 377
Table 7.2 Sorted unnormalized data.

Having gaps in the data structure has meant that we have lost our rec-ipes, possibly forever. A sad loss for the culinary world.
Normalization 113
EventDate
ArtisteName TelNo cost (£) StartTime
DishName IngredName quantity NoInStock
01/05/03
TraceyBeardmore isShirley Bassey
33333 50 8.00 Chicken in apolystyrenetray
chicken quarter 4320
01/05/03
TraceyBeardmore isShirley Bassey
33333 50 8.00 Chicken in apolystyrenetray
polystyrene 1 1044
02/05/03
Jade Green andher DancingChihuahuas
44444 80 7.00 Offal surpriseand peas
sheep intestines 0.5 kg 202
02/05/03
Jade Green andher DancingChihuahuas
44444 80 7.00 Offal surpriseand peas
peas 28 550
04/05/03
Sharon Twainentertains
55555 90 8.00 Skeweredkidneys inlager
kidneys 6 4078
04/05/03
Sharon Twainentertains
55555 90 8.00 Skeweredkidneys inlager
lager 10 50
04/05/03
Sharon Twainentertains
55555 90 8.00 Skeweredkidneys inlager
skewer 1 45
07/05/03
Gypsy Ky-LeeClairvoyant
66666 25 7.00 Crispy duckand crisps
duck half 345
07/05/03
Gypsy Ky-LeeClairvoyant
66666 25 7.00 Crispy duckand crisps
prawn cocktailcrisps
1 5500
08/05/03
TraceyBeardmore isShirley Bassey
33333 50 7.30 Industrialstrength chilli
old beef 1 kg 188
08/05/03
TraceyBeardmore isShirley Bassey
33333 50 7.30 Industrialstrength chilli
tin of sauce 1 377
08/05/03
TraceyBeardmore isShirley Bassey
33333 50 7.30 Industrialstrength chilli
rice 4 g 289
09/05/03
Jade Green andher DancingChihuahuas
44444 80 7.00 Offal surpriseand peas
sheep intestines 0.5 kg 202
09/05/03
Jade Green andher DancingChihuahuas
44444 80 7.00 Offal surpriseand peas
peas 28 550
Table 7.3 Unnormalized data with duplicate data.

114 Systems analysis: a beginner’s guide
Of course, we could just fill in the gaps with duplicate data: that would solvethe sorting problem. That would give us a data model looking like Table 7.3.
However, there are still three types of problem with this data structure.
1 The insertion problemSuppose we decide to buy some ingredients because they happen to becheap and available. In fact, this happened only last week at Swillbuckets,when Seth Shepherd poached a few rabbits on the Chalfont estate. JackTrout was quick to spot a commercial opportunity and a large black bagsoon appeared at the Swillbuckets back door.
So now Jack has the new ingredient, rabbit, but where does he put it inour current design? He doesn’t yet have a recipe to put it in or an event toserve it at. He can’t just put it in the ingredients column, as that wouldmean leaving blanks in most of the other columns, and we know wherethat leads. If he sorted on ingredient, he would finish up with rabbit in theskewered kidneys. Not ideal.
2 The update problemLet’s think about sheep’s intestines. On second thoughts, maybe not. Let’s thinkabout peas. Peas occurs twice in our list of ingredients. This is because Jade Green(and, indeed, her chihuahuas) is very partial to ‘Offal surprise and peas’. As aresult, every time she performs, she insists it’s on the menu. So, in our currentdata structure, peas will be repeated every time Jade Green performs. Also, peasmight occur in a number of different recipes and at different events.
At the moment, Jack has 28 tins of peas in stock. If he uses one up, heneeds to update the data (change it to 27). But he doesn’t just have to do thisonce, he has to go through all his data looking for every occurrence of peasand making the same update each time.
If he’s fresh from a lunchtime session in Swillbuckets Bar, he’s bound tomiss some and then no one will know whether there are 27 or 28 tins instock. Soon no one will believe the data. It’ll have no integrity. A bit like Jack.
3 The deletion problemAnother problem reveals itself if we have to delete something. If somebodycomplains about the ‘Industrial strength chilli’ (and who can blamethem?), or dies a painful death, Jack might have to take it off the menu. Sohe deletes the rows containing information about Industrial strengthchilli. Unfortunately, he’s also deleted the information about how muchold beef he has in stock – 90 kg of the stuff to be exact. This is bad newsbecause the Health Inspectors are not going to take kindly to finding 90 kgof old beef stuffed in the back of the fridge that Jack has forgotten aboutbecause he’s deleted it from his database.
There are plenty of problems with the way this data is structured at themoment. So what’s the solution? Splitting the data up into a number ofsmaller tables, instead of one big one. In other words – normalization. Solet’s do some before Swillbuckets gets shut down.
Normalization is quite difficult and complex. Sadly, it’s also arguably themost important bit of SSADM. Life’s cruel. If it wasn’t so important, itwould have been chucked in the bin years ago. Here are some simple tasks,

but they aren’t that simple. Don’t panic if you don’t get the hang of it firsttime. Almost nobody does. The trick is to keep hammering away at it untilit gives in and reveals its secrets.
7.1.2 (Not so) simple tasks in normalization
1 Make sure you understand the data.It’s no good expecting to be able to breeze through normalization withoutfirst understanding the data. You must know what each bit of data is therefor, what it relates to and how it’s used. Hopefully, you’ve done this duringthe analysis phase.
2 Decide what to normalize.The easiest way is to do it one form at a time, and then merge it all together.So that’s what we’ll do here. On the other hand, you could try to normalizeall the data at once. This is not recommended if there are more than about20 items of data in the system.
The Swillbuckets example above only shows nine fields of data, but inreality there would be many more: the address of the performers, theiragents, the admission fee etc. So we’ll tackle it one form at a time. I say‘form’, but actually we want anything that’s to be inputted into the systemor outputted from it – things like invoices, lists of forthcoming events, rec-ipes and stock lists. Also, we might need to add in new items that aren’tcurrently in the system but will be in the new system we’re designing. Fig-ures 7.1–7.4 show a sample of the sort of thing we might normalize.
Normalization 115
Swillbuckets Country Club
Forthcoming Events
4/12/02 8.00 Curry and peas night – eat, drink and be poorly £1
7/12/02 7.30 Slide show with Eddie Jones – ‘Stuffing dead voles’
11/12/02 8.00 Fancy Dress Party – Theme: ‘The Butcher’s Shop’ £5
12/12/02 7.30 Dan Pickles on spoons plus buttered toast £1
19/12/02 7.00 Annual 5-Legged Pig Race – Man and pig inharness!
24/12/02 8.00 Christmas Eve Special ‘A right good do’ (volunteersplease for balloon blowing and spittoon emptying)Admission by ticket only
£10
26/12/02 2.00 Boxing Day Tug o’ war, fastest 6 pints, stomachthrowing in the Swillbuckets Man of Men Competition
27/12/02 Closed for refurbishment
Events are free to members unless otherwise stated
Figure 7.1Forthcoming eventslist.

116 Systems analysis: a beginner’s guide
Swillbuckets Payment Slip
Payment Date: 12/10/02 Deductions: £45 – damage to stage
Payee: Little and Lard Payment method: Cash
Fee: £75.00 Net pay: £30
Figure 7.2Payslip.
Swillbuckets Membership Form
Name: Wilf Trotter Date: 20 November 2002
Address: Hag End FarmNether BogMuckthwaiteW. Yorks
Postcode: H34 2FT Date of birth: 12 January 1904
Member Type: Free Seconder: Josh Gitter
Interests: Brown water raftingCoal sculptingReclaiming mine shafts
Level: BeginnerExpertExpert
Do not write below this line or there will be trouble
For official use only
Member No: 5647 Fee: N/A
Figure 7.3Membership form.
Swillbuckets Event Booking Form
Date of event: 12/12/02
Name of event: Dan Pickles on Spoons
Artiste: Dan Pickles Contact No: 2344556
Fee: £45 Status: Provisional/Confirmed
Special Requirements: 5 rounds of buttered toast3 cups of teaspare spoons
Signed: Jack Trout Date: 14/11/02
Figure 7.4Event booking form.

That’s enough to be going on with. We’ll start with the ForthcomingEvents List.
3 List all the fields on a normalization sheet.You could use one like Table 7.4 (or just use some large, blank paper).
All the fields of data from the Forthcoming Events List are listed in thecolumn headed UNF – this stands for Unnormalized Form. The field called‘SpecialPoint’ refers to any special information about an event. Forexample, volunteers are needed for the Christmas Eve Special to blow upballoons and empty spittoons. Let’s hope they don’t get confused and blowup the spittoon....
4 Find a key.As mentioned in Chapter 3, a key is a way of identifying a form or a table, orwhatever. Your key is your name, usually. It’s how other people identifyyou. But it’s not a brilliant key because there will be lots of people with thesame name as you. A better key to identify you would be your NationalInsurance Number (or equivalent). It’s unique. There are never two thesame. That’s why the government invented it. They could have used yourname combined with your address as a way of identifying who you are. Theproblem is, people move house, whereas a National Insurance Numberalways stays the same.
Anyway, we need a key for the Forthcoming Events List.Let’s imagine there was a big pile of these lists and you had to find one
particular one. What bit, or bits, of data would you need to know to find thelist you wanted? Knowing one of the events wouldn’t help – say ‘Curry andpeas night’ – because that might appear on other lists. But if you knew oneof the events and the date, that would do it. There would never be two
Normalization 117
Normalization
System: Swillbuckets
Form/Report: Forthcoming Events List
Author: Kevin Bowman
Date: 20/6/03 Page 1 of 1 Draft/Final
Data Structure:
UNF 1NF 2NF 3NF TABLE NAME
EventDate
StartTime
EventName
EntranceFee
SpecialPoint
Table 7.4 Forthcoming events list UNF.

‘Curry and peas nights’ on the same day. That combination of event anddate would never appear anywhere else.
So, we’ve established that the key will be ‘Event name’ and ‘Event date’combined. (If you have a key made up of more than one bit of data, like thisone, it’s called a composite key.)
5 Underline the key bit(s) of data.Just to show it’s the key.
6 Find repeating groups.The best way to do this is to draw a rough table showing the sort of datawe’re likely to get, like the one earlier (Table 7.1) which showed all the gapsbefore normalization. Use the fields as headings in the table. So you getsomething like Table 7.5.
There are some gaps at the bottom of the table caused by the fact thatthere are three SpecialPoints for the Christmas Eve Special. We could fill inthe gaps by duplicating all the Christmas Eve Special information:
24/12/03 Christmas Eve Special 8.00 10.00 Volunteers for balloonblowing
24/12/03 Christmas Eve Special 8.00 10.00 Volunteers for spittoonemptying
24/12/03 Christmas Eve Special 8.00 10.00 Ticket only
but we clearly have a repeating group here. Repeating groups are the oneswith different values from the rest of the fields. In this case, it’s the‘SpecialPoints’ that are different. Everything else stays the same. You couldsay that for every event, there might be many ‘SpecialPoints’. It’s the‘many’ bits that we call ‘repeating groups’. So what do we do with them?
118 Systems analysis: a beginner’s guide
EventDate EventName StartTime
EntranceFee
SpecialPoint
04/12/03 Curry and peas night 8.00 1.00 None
07/12/03 Slide show with EddieJones
7.30 0 None
11/12/03 Fancy dress party 8.00 5.00 Theme: Butcher’s Shop
12/12/03 Dan Pickles on spoons 7.30 1.00 Buttered toast
19/12/03 5-legged pig race 7.00 0 None
24/12/03 Christmas Eve Special 8.00 10.00 Volunteers for balloonblowing
Volunteers for spittoonemptying
Ticket only
Table 7.5 Forthcoming Events List data.

7 Split up the data structure.Because we have repeating groups, we have to split up the data structure.We take away the repeating groups and make them into a separate group,or relation. We must take with this new group a copy of the key (Table 7.6).(The column headings will be explained as we go through the normaliza-tion process.)
8 Identify a key for the repeating group.This new breakaway group currently has the same key as theunnormalized group. This is never right. In this case, you could not iden-tify one particular ‘SpecialPoint’, by knowing the ‘EventDate’ and the‘EventName’. Let’s say you knew the event was the Christmas Eve Specialand the date was 24/12/01; you wouldn’t be able to identify a particular‘SpecialPoint’ as there are three possibilities – that’s why we had toremove them. So you always need a different key for repeating groups. Inthis case, there’s no option as there is only one bit of data not already inthe key – ‘SpecialPoint’. So we make this part of our composite key andnow we can identify all data items. Our table is now in First Normal Form(1NF) and looks like Table 7.7.
Normalization 119
Data structure:
UNF 1NF 2NF 3NF TABLE NAME
EventDateEventNameStartTimeEntranceFeeSpecialPoint
EventDateEventNameStartTimeEntranceFee
EventDateEventNameSpecialPoint
Table 7.6 Forthcoming Events List 1NF.
Data structure:
UNF 1NF 2NF 3NF TABLE NAME
EventDateEventNameStartTimeEntranceFeeSpecialPoint
EventDateEventNameStartTimeEntranceFee
EventDateEventNameSpecialPoint
Table 7.7 Forthcoming Events List 1NF with key.

The eagle-eyed among you will have noticed that the two new groupshave fields in common, i.e. the original key. This will become importantbecause these common fields will act as a link and allow a relationshipbetween the groups when they become tables in a database.
9 Move to Second Normal Form.Second Normal Form only applies to groups of data with composite keys –that’s the good news. The bad news is that there will usually be at least onegroup with a composite key. In our case, both our groups have compositekeys, so we need to examine both groups.
We are looking for non-key fields that are dependent upon only part ofthe composite key, not the whole thing. If we find any, we need to splitthem up. How do you know if a field is dependent upon another field ornot?
This is the crunch question in normalization.The best way to think about this is to ask the question: What determines
what? For example, a worker’s pay_grade determines his or her pay. If weknow the pay_grade, we know the pay. So pay is dependent uponpay_grade.
The box with the arrow pointing at it is dependent upon the box with thearrow coming from it.
Here are some more examples: doctor_no determines doctor_name anddoctor_address. If we know the doctor number, we know the doctor’sname and address. So doctor_name and doctor_address are dependentupon doctor_no.
Car_registration_no determines car_model, car_colour and engine_size. If we know the registration number of a car, we will know the model,colour and engine size. So they are dependent upon car_registration.
It gets a little more complicated when a field is dependent upon anumber of other fields. For example, in a university or college:course_name, date and class_time will determine room_no. You will haveto know all three of the course name, the date and the time of the class, inorder to know which room to go to. So room_no is dependent uponcourse_name, date and class_time combined.
120 Systems analysis: a beginner’s guide
pay_grade pay
doctor_no doctor_name
doctor_address

So let’s have another look at our current table (7.7). Remember, we’reinterested in any non-key fields that might be dependent upon only a partof the composite key.
Let’s look at the first group, the one with StartTime and EntranceFee as itsnon-key fields. We’ll take one field at a time. For the field StartTime, do weneed to know both EventDate and EventName in order to determineStartTime, bearing in mind there might be more than one event on a partic-ular date? Well, we would certainly need to know the EventName in order tofind out what time it started. But do we also need to know the date? Yes,because there might be many events with the same name (e.g. Dan Pickles onSpoons), but they might not have the same start times. We need to knowwhich particular Dan Pickles on Spoons, i.e. the EventDate, in order to be sureof the start time. Knowing the EventDate by itself would be sufficient as longas there is never more than one event on a particular date. But let’s assumethere might be more than one. So, we need to know both fields in order todetermine StartTime. This means it is dependent upon the whole key.
Now, EntranceFee; it’s pretty much the same as StartTime. We wouldneed to know both the EventDate and the EventName in order to be sure ofthe EntranceFee. So EntranceFee is dependent upon the whole key too.
So both our non-key fields are dependent upon the whole key. The data isnow in Second Normal Form and our table looks like Table 7.8.
That leaves us with the other group: EventDate, EventName andSpecialPoint. Well, they are all part of the key, so there are no non-key fieldsto worry about. Fantastic! Who said normalization was difficult? So, wejust move them across into the Second Normal Form column (Table 7.9).
Normalization 121
Data structure:
UNF 1NF 2NF 3NF TABLE NAME
EventDateEventNameStartTimeEntranceFeeSpecialPoint
EventDateEventNameStartTimeEntranceFee
EventDateEventNameSpecialPoint
EventDateEventNameStartTimeEntranceFee
Table 7.8 Forthcoming Events List 2NF (partly done).
date
class_time
course_name
room_no

10 Move to Third Normal Form.This one applies to just non-key fields. We have to check to see if any non-key fields are dependent upon another non-key field rather than on the key.If there are any like this, we need to split them away to form a new group.We will choose a key for this new group and leave a copy of this key in theold group. This forms a link between the two groups.
Looking at our table, there is only one candidate. For a start, the secondgroup (EventDate, EventName and SpecialPoint) contain no non-keyfields, so we can forget about that group. The first group needs looking at,though, since there are two non-key fields in there (StartTime andEntranceFee). We need to be sure that one of them is not dependent uponthe other. Well, is the EntranceFee determined by the start time? If weknow the start time, do we always know the entrance fee? No. Is the starttime determined by the entrance fee? No. They are both determined by thekey: EventDate and EventName.
So there is no problem here, we can simply move both our groups over tothe Third Normal Form column.
It is useful to give each group a name at this point, just so that we knowwhich group we are talking about. These may end up being the table namesin the final database. The final normalized table looks like Table 7.10.
122 Systems analysis: a beginner’s guide
Data structure:
UNF 1NF 2NF 3NF TABLE NAME
EventDateEventNameStartTimeEntranceFeeSpecialPoint
EventDateEventNameStartTimeEntranceFee
EventDateEventNameSpecialPoint
EventDateEventNameStartTimeEntranceFee
EventDateEventNameSpecialPoint
EventDateEventNameStartTimeEntranceFee
EventDateEventNameSpecialPoint
EVENT
SPECIALPOINT
Table 7.10 Forthcoming Events List 3NF.
Data structure:
UNF 1NF 2NF 3NF TABLE NAME
EventDateEventNameStartTimeEntranceFeeSpecialPoint
EventDateEventNameStartTimeEntranceFee
EventDateEventNameSpecialPoint
EventDateEventNameStartTimeEntranceFee
EventDateEventNameSpecialPoint
Table 7.9 Forthcoming Events List 2NF.

11 Celebrate vigorously.However, before you get too carried away, remember that we’ve only doneone form and there are a good few more to do.
The Swillbuckets Payment Slip, you may remember, looked like this:
This is fairly easy to normalize, so we’ll whiz through this one (Table 7.11).
This table shows all the fields on the Payment Slip with the exception of the‘Net pay’ field. This can be ignored for the time being as it can be calculated bysubtracting the ‘deductions’ value from the ‘amount’ value. Any calculatedfields do not normally need to be included in the normalization process.
Next we need to find a key. There’s a bit of a problem here. Even if we hadevery field as part of a composite key, we couldn’t be sure it would beunique. We might have more than one payment slip created on the sameday, for the same artist (payee) for the same amount, with the same deduc-tion etc. It’s unlikely, but far from impossible.
In this situation, rather than have a huge key which is not necessarilyunique, it’s best to invent a field which is unique. The obvious choice is
Normalization 123
Swillbuckets Payment Slip
Payment Date: 12/10/02 Deductions: £45 – damage to stage
Payee: Little and Lard Payment method: Cash
Fee: £75.00 Net pay: £30
Normalization
System: Swillbuckets
Form/Report: Payment Slip
Author: Kevin Bowman
Date: 20/6/03 Page 1 of 1 Draft/Final
Data Structure:
UNF 1NF 2NF 3NF TABLE NAME
PaymentDate
amount
deductions
payee
PayMethod
Table 7.11 Payment Slip UNF.

‘payment slip number’. This probably should have been on Jack’s formanyway; he just didn’t think of it. He doesn’t like forms much and who canblame him?
So let’s add ‘PayslipNo’ to our table and make it the key:
PayslipNo
PaymentDate
amount
deductions
payee
PayMethod
Simple Step 6 now requires us to identify repeating groups, so let’s seewhat the data might look like in a table (Table 7.12).
There are no obvious problems of a repeating group nature. The only possi-bility would be if we wanted to allow for the possibility that there might bea number of deductions on a payslip. Deductions would then be a repeatinggroup. However, Jack simply requires a total figure for deductions, not adetailed record.
Since there are no composite keys involved here, we can skip straight toSecond Normal Form. So the Normalization table would currently look likeTable 7.13.
124 Systems analysis: a beginner’s guide
PayslipNo PaymentDate amount deductions payee PayMethod
1 12/10/01 75.00 45.00 Little and Lard cash
2 15/12/01 90.00 0.00 Sharon Twain cheque
3 8/11/01 50.00 0.00 Tracey Beardmore cash
4 12/12/01 80.00 20.00 Jade Green cash
5 12/12/01 25.00 0.00 Gypsy Ky-Lee cash
Table 7.12 Payment Slip data.
Data Structure:
UNF 1NF 2NF 3NF TABLE NAME
PayslipNoPaymentDateamountdeductionspayeePayMethod
PayslipNoPaymentDateamountdeductionspayeePayMethod
PayslipNoPaymentDateamountdeductionspayeePayMethod
Table 7.13 Payment Slip 2NF.

TEAM FLY
Now we’re ready for Simple Step 10 – Move to Third Normal Form. This iswhere we consider the non-key fields to see if they are dependent uponother non-key fields rather than the key. If we find any that are dependentupon other non-key fields, we will remove them into a separate group.
We need to look at each non-key field in turn. Let’s start withPaymentDate. Does this field depend upon any of the other non-key fields?Does it depend upon amount? If we knew the amount, would we alwaysknow the payment date? No. If we knew the payee, would we always knowthe payment date? No. We would need to know the specific payslip(PayslipNo), in order to know the payment date.
If we go through each field in turn, we find that they all depend on thekey, PayslipNo, with one possible exception. Let’s just think aboutPayMethod. It’s possible that each payee might have a particular methodfor being paid. So Gypsy Ky-Lee might only accept cash, for example. So, itcould be argued that PayMethod depends upon payee.
If we decided that this was the case, we would take payee andPayMethod and put them in a separate group, with payee as the key. A copyof the key (payee) is left in the other group to act as a link, or foreign key. Sothe Third Normal Form table would look like Table 7.14.
The little asterisk next to ‘payee’ in the top group shows that this is the linkfield, or foreign key, as it is known.
Having done that, Jack Trout then informs us that some artistes, such asSharon Twain, aren’t bothered whether they get paid by cash, cheque orfree sherry, as long as they get paid. So, we would need to know the‘PayslipNo’ after all in order to determine whether it was cash or cheque, orfree sherry at the bar. So ‘PayMethod’ is not dependent upon ‘payee’ in allcases, it’s dependent upon the key after all.
So we need to hastily redraw our table and simply move the group acrossfrom Second Normal Form to Third Normal Form (Table 7.15).
We’ll call this table ‘PAYMENT’, and that’s another form done.
Normalization 125
Data Structure:
UNF 1NF 2NF 3NF TABLE NAME
PayslipNoPaymentDateamountdeductionspayeePayMethod
PayslipNoPaymentDateamountdeductionspayeePayMethod
PayslipNoPaymentDateamountdeductionspayeePayMethod
PayslipNoPaymentDateamountdeductionspayee*
payeePayMethod
Table 7.14 Payment Slip 3NF – provisional.

Now it’s time to consider the membership form. Just to remind you,here’s what it looks like (Figure 7.5).
This form is filled in when a new member joins Swillbuckets. It’s a littlemore complex than the last, so we’ll take it step by step. Let’s list all thefields in the usual way (Table 7.16).
The next simple step requires us to identify a key field. We’re in luckhere, as Jack Trout has had the wisdom and foresight to include ‘Member-ship No’ on his form. It’s called ‘MemberNo’ in our list of fields. Eachmember will have a different number allocated to them, so each one isunique. This makes it an ideal candidate for our key field. So without fur-ther ado, let’s underline it (Table 7.17).
Now we’re looking for repeating groups. Let’s draw our table with somesample data (Table 7.18).
126 Systems analysis: a beginner’s guide
Data Structure:
UNF 1NF 2NF 3NF TABLE NAME
PayslipNoPaymentDateamountdeductionspayeePayMethod
PayslipNoPaymentDateamountdeductionspayeePayMethod
PayslipNoPaymentDateamountdeductionspayeePayMethod
PayslipNoPaymentDateamountdeductionspayeePayMethod
PAYMENT
Table 7.15 Payment Slip 3NF – final version.
Swillbuckets Membership Form
Name: Wilf Trotter Date: 20 November 2002
Address: Hag End FarmNether BogMuckthwaiteW. Yorks
Postcode: H34 2FT Date of birth: 12 January 1904
Member Type: Free Seconder: Josh Gitter
Interests: Brown water raftingCoal sculptingReclaiming mine shafts
Level: BeginnerExpertExpert
Do not write below this line or there will be trouble
For official use only
Member No: 5647 Fee: N/A
Figure 7.5Membership form.
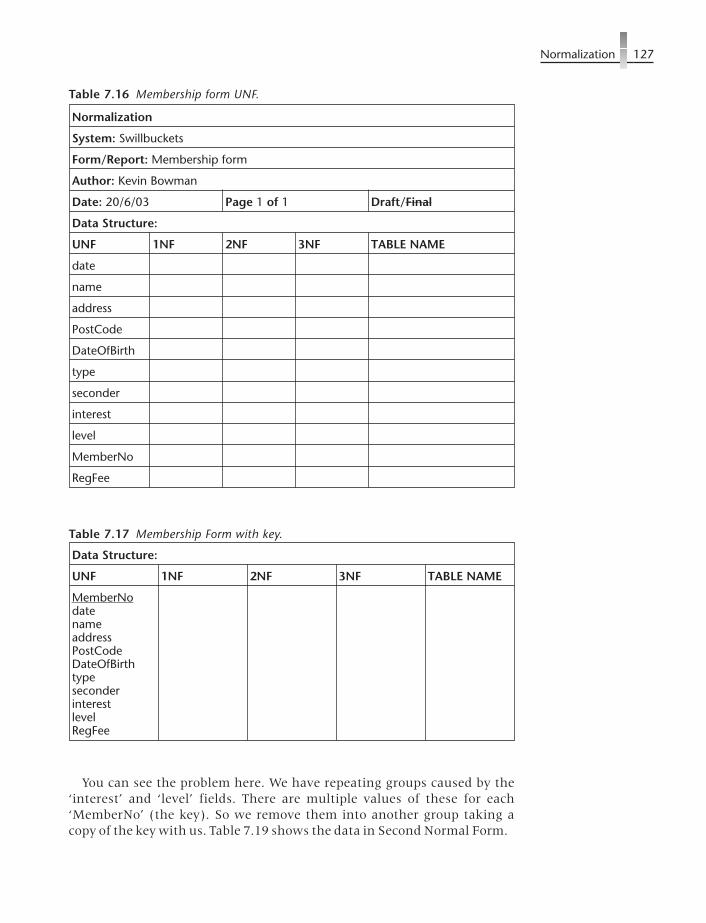
You can see the problem here. We have repeating groups caused by the‘interest’ and ‘level’ fields. There are multiple values of these for each‘MemberNo’ (the key). So we remove them into another group taking acopy of the key with us. Table 7.19 shows the data in Second Normal Form.
Normalization 127
Normalization
System: Swillbuckets
Form/Report: Membership form
Author: Kevin Bowman
Date: 20/6/03 Page 1 of 1 Draft/Final
Data Structure:
UNF 1NF 2NF 3NF TABLE NAME
date
name
address
PostCode
DateOfBirth
type
seconder
interest
level
MemberNo
RegFee
Table 7.16 Membership form UNF.
Data Structure:
UNF 1NF 2NF 3NF TABLE NAME
MemberNodatenameaddressPostCodeDateOfBirthtypeseconderinterestlevelRegFee
Table 7.17 Membership Form with key.

The next simple step is to identify a key for this new group. In this case,we can identify a specific interest of a member if we know the membernumber and the interest. We don’t need to know the level as well. So thecomposite key would be: ‘MemberNo’ and ‘interest’ (Table 7.20).
You will doubtless have remembered that moving to Second NormalForm requires us to examine only groups of data with composite keys. Weneed to check if the non-key field, ‘level’, is dependent upon both of the keyfields in our second group. Do we have to know both the member numberand the interest in order to identify the level? Yes we do. So, level isdependent upon both our key fields. We can move swiftly on throughSecond Normal Form (Table 7.21).
The move to Third Normal Form requires us to look at the other group.Here we are checking that non-key fields are not dependent upon othernon-key fields, but are dependent upon the key only.
128 Systems analysis: a beginner’s guide
MemberNo
date name address PostCode DateOfBirth
type seconder interest level RegFee
5647 20/11/99 WilfTrott
Hag EndFarm
H34 2FT 12/1/04 F JoshGitter
brown waterrafting
B n/a
coal sculpting E
mine shaftreclaiming
E
1234 12/3/94 HarryBabb
12 ParkSt
H1 3GH 14/2/11 R EwanSpratt
street cleaning E £10
industrialsewing
B
cheese shaping C
Table 7.18 Membership data.
Data Structure:
UNF 1NF 2NF 3NF TABLE NAME
MemberNodatenameaddressPostCodeDateOfBirthtypeseconderinterestlevelRegFee
MemberNodatenameaddressPostCodeDateOfBirthtypeseconderRegFee
MemberNointerestlevel
Table 7.19 Membership form 1NF.

The one possible candidate here is the ‘RegFee’ field. We need to knowhow that is determined. Jack tells us that there are three possible fees.Membership is free if the person is a pensioner when they joinSwillbuckets. This is denoted by an ‘F’ for free in the ‘Type’ field. Member-ship is £10 if the person is unemployed when they join. This is denoted by‘R’ for reduced in the ‘type’ field. Finally, membership is standard foreveryone else. The standard fee is £25.
This tells us that the ‘RegFee’ field is dependent upon the ‘type’ field. Ifwe know the type of membership – free, reduced or standard – we know thefee. So we need to take the ‘type’ and ‘RegFee’ fields out of the group,leaving a copy of the determinant field, ‘type’, behind. If we add the tablenames, our form is now normalized (Table 7.22).
Normalization 129
Data Structure:
UNF 1NF 2NF 3NF TABLE NAME
MemberNodatenameaddressPostCodeDateOfBirthtypeseconderinterestlevelRegFee
MemberNodatenameaddressPostCodeDateOfBirthtypeseconderRegFee
MemberNointerestlevel
Table 7.20 Membership form 1NF with keys.
Data Structure:
UNF 1NF 2NF 3NF TABLE NAME
MemberNodatenameaddressPostCodeDateOfBirthtypeseconderinterestlevelRegFee
MemberNodatenameaddressPostCodeDateOfBirthtypeseconderRegFee
MemberNointerestlevel
MemberNodatenameaddressPostCodeDateOfBirthtypeseconderRegFee
MemberNointerestlevel
Table 7.21 Membership form 2NF.

The final form we’re going to consider from Swillbuckets is the EventBooking Form. Jack Trout uses this form to store information about how abooking is progressing. As soon as it’s confirmed in writing by the artiste,Jack draws a ring round ‘Confirmed’ and moves it into a different shoebox.Figure 7.6 shows a copy of the form.
Some of the information on this form is recorded elsewhere. You mayremember that EventName and EventDate are two of the fields in the firstform we looked at, the Forthcoming Events List, so we need to be carefulwe’re not recording the same information twice. Fortunately, SSADM takescare of this for us. Let’s start filling in our normalization form in the usualway (Table 7.23).
130 Systems analysis: a beginner’s guide
Data Structure:
UNF 1NF 2NF 3NF TABLE NAME
MemberNodatenameaddressPostCodeDateOfBirthtypeseconderinterestlevelRegFee
MemberNodatenameaddressPostCodeDateOfBirthtypeseconderRegFee
MemberNointerestlevel
MemberNodatenameaddressPostCodeDateOfBirthtypeseconderRegFee
MemberNointerestlevel
MemberNodatenameaddressPostCodeDateOfBirthtypeseconder
typeRegFee
MemberNointerestlevel
MEMBER
MEMBERTYPE
MEMBERINTEREST
Table 7.22 Membership form normalized.
Swillbuckets Event Booking Form
Date of event: 12/12/02
Name of event: Dan Pickles on Spoons
Artiste: Dan Pickles Contact No: 2344556
Fee: £45 Status: Provisional/Confirmed
Special Requirements: 5 rounds of buttered toast3 cups of teaspare spoons
Signed: Jack Trout Date: 14/11/02
Figure 7.6Event booking form.

The key looks like being a combination of EventName and EventDate justas it was in the Forthcoming Events List. (Remember that we can’t justhave EventDate, as Jack might want to put on more than one event on aparticular day). However, this only works if there is only ever one artiste atan event. We need to clarify this with Jack.
Jack informs us that at the moment he only has one artiste per event.This is due to an unfortunate incident a few years ago. He booked JadeGreen and her Dancing Chihuahuas on the same bill as Leapy Len’s FleaCircus. Apparently, the chihuahuas were soon dancing in a more frenziedfashion than usual and the fleas were never seen again.
Having said that, Jack would still like the option of having more than oneact per event, so we have to allow for this possibility. This means that ‘art-iste’ needs to be part of the composite key. Let’s have a look at the sort ofdata we might get in tabular format (Table 7.24).
We can see that the special requirement field (SpecReq) is causing aproblem by forcing us to repeat the data for the other fields or leave blanks.We need to remove this field along with a copy of the key in order to moveto First Normal Form (Table 7.25).
The key for this new group will be the key for the unnormalized data plusSpecReq (Table 7.26).
Excellent. Now let’s move to Second Normal Form. We check to see if thenon-key fields are dependent upon the whole of the key. There is one fieldthat needs attention, the ContactNo field. It’s got nothing to do withEventDate or EventName but everything to do with artiste. ContactNo is
Normalization 131
Normalization
System: Swillets
Form/Report: Event Booking form
Author: Kevin Bowman
Date: 20/9/03 Page 1 of 1 Draft/Final
Data Structure:
UNF 1NF 2NF 3NF TABLE NAME
EventDate
EventName
artiste
ContactNo
fee
status
SpecReq
BookDate
Table 7.23 Event booking form UNF.

132 Systems analysis: a beginner’s guide
EventDate EventName artiste ContactNo fee status SpecReq BookDate
12/11/02 Slide show withEddie Jones
Eddie Jones 2242343 £50 C projector 24/10/02
12/12/02 Dan Pickles onspoons
Dan Pickles 2344556 £45 C 5 rounds ofbuttered toast
14/11/02
3 cups of tea
spare spoons
24/12/02 Christmas Party Bobby Crash 2343454 £85 P 10/11/02
31/12/02 New Year Do Sharon Twain 2657378 £75 C extra sherry 23/10/02
room for the night
ambulance onstandby
Table 7.24 Event booking data.
Data Structure:
UNF 1NF 2NF 3NF TABLE NAME
EventDateEventNameartisteContactNofeestatusSpecReqBookDate
EventDateEventNameartisteContactNofeestatusBookDate
EventDateEventNameartisteSpecReq
Table 7.25 Event booking data 1NF.
Data Structure:
UNF 1NF 2NF 3NF TABLE NAME
EventDateEventNameartisteContactNofeestatusSpecReqBookDate
EventDateEventNameartisteContactNofeestatusBookDate
EventDateEventNameartisteSpecReq
Table 7.26 Event booking form 1NF with key.

determined by artiste alone. So we need to place artiste and ContactNo intoa separate group leaving a copy of the determinant field, artiste behind(Table 7.27).
All the other non-key fields are dependent upon the whole of the key, so wedon’t need any more changes for Second Normal Form.
Third Normal Form requires us to check that there are no non-key fieldsdependent upon other non-key fields. So let’s have a look. The bottom twogroups aren’t affected because there is only one non-key field in eachgroup.
In the top group, fee, status and BookDate are all dependent upon thekey not each other, so there’s no problem here. Straight into Third NormalForm (Table 7.28) and we’ve almost finished normalizing our four forms.We’ll give the groups of data names and move on to the final task ofnormalization.
7.2 RationalizationThis final task is called rationalization and is very easy. We’ve been gath-ering data from various forms, and in the real world there would be manymore than the four we’ve looked at here. So we would end up with a largenumber of normalized groups. Rationalization attempts to merge some ofthese together, so we haven’t got quite so many.
The idea is that if any of our groups have the same keys, then really theyshould be in the same group. So we need to see our groups and their keys.Below are the data groups, or relations, obtained from each form.
Normalization 133
Data Structure:
UNF 1NF 2NF 3NF TABLE NAME
EventDateEventNameartisteContactNofeestatusSpecReqBookDate
EventDateEventNameartisteContactNofeestatusBookDate
EventDateEventNameartisteSpecReq
EventDateEventNameartistefeestatusBookDate
artisteContactNo
EventDateEventNameartisteSpecReq
Table 7.27 Event booking form 2NF.
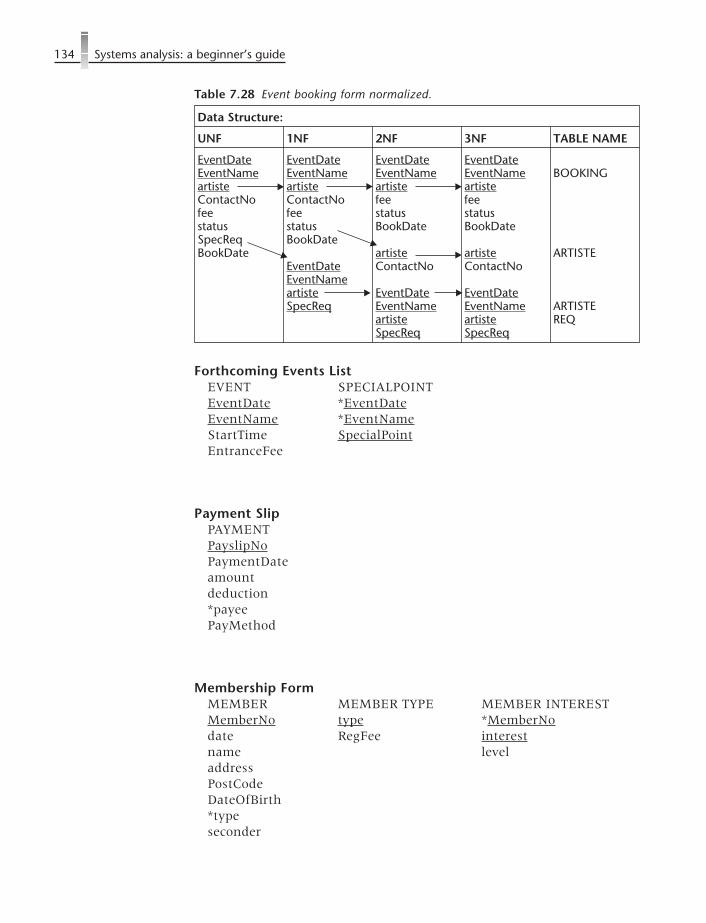
Forthcoming Events ListEVENT SPECIALPOINTEventDate *EventDateEventName *EventNameStartTime SpecialPointEntranceFee
Payment SlipPAYMENTPayslipNoPaymentDateamountdeduction*payeePayMethod
Membership FormMEMBER MEMBER TYPE MEMBER INTERESTMemberNo type *MemberNodate RegFee interestname leveladdressPostCodeDateOfBirth*typeseconder
134 Systems analysis: a beginner’s guide
Data Structure:
UNF 1NF 2NF 3NF TABLE NAME
EventDateEventNameartisteContactNofeestatusSpecReqBookDate
EventDateEventNameartisteContactNofeestatusBookDate
EventDateEventNameartisteSpecReq
EventDateEventNameartistefeestatusBookDate
artisteContactNo
EventDateEventNameartisteSpecReq
EventDateEventNameartistefeestatusBookDate
artisteContactNo
EventDateEventNameartisteSpecReq
BOOKING
ARTISTE
ARTISTEREQ
Table 7.28 Event booking form normalized.

Event Booking FormBOOKING ARTISTE ARTISTE REQS*EventDate artiste EventDate*EventName ContactNo EventName*artiste *artistefee SpecReqstatusBookDate
You might be tempted to think that because EventName appears in anumber of keys, these groups can be merged. However, the whole key has tobe identical for merging to take place.
It appears that there are no tables which share the same key, so nomerging can take place. If we had normalized every form at Swillbuckets,however, it is likely there would have been some rationalization required.
Once rationalization is complete, we are in a position to compare theRequired Logical Entity Model, completed in the last chapter (Figure 6.4)with the relations produced by normalization. Any enhancements requiredwill now need to be built into the final entity model.
Just from the forms looked at above, there are a number of enhance-ments identified by normalization. Instead of simply having a MEMBERtable, with all the data concerning members thrown in, we now see theneed to have three tables: MEMBER, MEMBER TYPE and MEMBERINTEREST.
Similarly, there is a need to hold information about the requirements ofartistes which we have called ARTISTE REQ and their payment which hasresulted in the PAYMENT table. Also, the SPECIAL POINT entity has beenadded to store any special points about a particular event.
The process of rationalization would require us to merge together theFOOD ORDER and DRINK ORDER tables as, logically, they both have thesame key – Order No.
Bearing these enhancements in mind, we can rebuild the Swillbucketsentity model.
7.3 Rebuild the entity modelThe model must be remodelled once again, to take into account the changesidentified by normalization (Figure 7.7).
A number of issues regarding attributes have been resolved. Forexample, the key for EVENT has been finalized as EventNo as in the nor-malized tables, not a composite key of EventName and EventDate. Wecould have kept these two attributes as the primary key, but it is easier touse EventNo. In this situation where there is more than one possible pri-mary key, the keys concerned are called candidate keys. As long as weremember to use EventNo as the primary key at all times, there will be noproblem.
Normalization 135

One or two synonyms have been identified. These are attributes with dif-ferent names, but which are logically the same. For example, Payee inPAYMENT is the same as Artiste, which is fortunate as Payee is our link orforeign key. We could change Payee to Artiste or, if it’s clearer, we can keepit as Payee.
7.4 Entity/function matrixSo far we have modelled the processes or functions using DFDs and thedata structure using entity models for the required system. A third (andfinal) view of the new system is required to consider how the system will be
136 Systems analysis: a beginner’s guide
ARTISTE
ArtisteRealNameArtisteAddressTel_homeA_Mobile
MEMBER
MemberNoMemberNameMemberAddressPostCodeD_O_B*TypePhoneNoM_DateSeconder
DISH
DishNamePrice
ORDER
OrderNoOrderDate*SupplierNoDeliveryDate
SUPPLIER
SupplierNoSupplierNameS_AddressS_TelS_ContactName
INGREDIENT
IngredientNoIngredientNameI_QuantityIinStockI_ReorderLevel
EVENT
EventNoEventNameDate*DishNameStartTimeEntranceFee
DISHDETAILS
*DishName*IngredientNoIngredientQuantity
FOODORDERLINE
*OrderNo*IngredientNoF_QuantityF_Price
DRINKORDERLINE
*OrderNo*DrinkNameD_QuantityD_Price
DRINK
DrinkNameD_QuantityInStockD_ReorderLevelD_Type
BOOKING
BookingNo*EventNo*ArtisteStatusBookDateArtisteFee
MEMBERINTEREST
*MemberNoInterestLevel
TYPE
TypeRegFee
ARTISTEREQ
*ArtisteSpecialReq
PAYMENT
PayslipNo*PayeeAmountPayMethodPayDateDeductions
SPECIALPOINT
*EventNoSpecialPoint
Figure 7.7Swillbuckets entitymodel afternormalization.

affected by time. Our DFDs tell us what events or functions are likely tooccur. Our entity model tells us what the data looks like. We now need tocheck that all the events can be accommodated by our data model. It maybe that we have missed some events, or functions, from our DFDs, in whichcase we will need to update them. Or we may have missed a data itemneeded by a function. The entity function matrix allows us to check this.
The matrix pulls together the two previous views of the system andallows us to check that each entity has a beginning and an end, i.e. a func-tion which creates it and a function which deletes it or archives it. Theability to delete an entity is particularly important; otherwise entities willcarry on expanding forever. Similarly, we should check that each entity isused once it’s in the system. After all, there’s no point in collecting infor-mation about, say, drugs, if there isn’t a means in the system to use theinformation. We don’t want it just sitting around doing nothing. We havereceptionists for that.
So we need to check if each entity is born, has a full and purposeful life,and then dies.
Creating an entity/function matrix is simple. Here are the steps.
7.4.1 Simple steps in creating an entity/function matrix
1 List the entities and functions.Create the matrix on a piece of paper by listing all the entities down theside and all the functions across the top. You may need a large piece ofpaper to do this.
2 Create a grid.Draw lines to divide the paper up into cells.
3 Fill in the grid.This is done by looking at the DFDs and entering one of these possibleoptions: I (Insert), R (Read), M (Modify), D (Delete) or A (Archive). Cellsin the grid can be left blank if the function has no effect on the entity.
4 Check that each row (entity) has a full life.In other words, it should be have an I, at least one R or M and a D or an A.Often there are no functions in the DFDs to create an entity or to delete theentity. These functions will need to be added to the DFDs. Occasionally, anentity will have more than one I. This needs looking at, as it implies thatthe entity is created more than once by different functions. There may beinconsistencies here.
5 Update the DFDsThere will normally be some changes required to the DFDs as a result ofthis process.
Table 7.29 is a section from an entity function matrix for the MedicalCentre (not all functions and entities are shown).
In the Medical Centre, we can see that nothing is ever deleted apart fromwhen an appointment is cancelled. We would need to discuss with Betty
Normalization 137

and George a strategy for deleting records. Obviously we would want tokeep patient records until the patient dies or leaves the Centre. We may berequired to archive them for a period of time after death in case there areany queries about treatment. Perish the thought. These functions will needto be added to the required DFDs so that they appear in the final system.
It might also be noted that the Doctor entity is never inserted. This maynot be viewed as a problem since it will happen only rarely, but the newsystem must allow us to perform this function.
SummaryWe have focused very much on normalization in this chapter. This isbecause it is a crucial part of systems analysis and is relatively difficult tolearn. This completes the specification of requirements and it now becomesa simple matter of sorting out a few physical design issues before we canstart implementing the new system. The next chapter looks at the technicaland physical design techniques required.
Exercises7.1 Normalize the following data taken from a student assessment form,bearing in mind that students will take a number of modules:
Student NumberStudent NameStudent Address
138 Systems analysis: a beginner’s guide
Function
Entity 1.1
Reg
iste
rPa
tien
t
1.2.
Allo
cate
pat
ien
tto
do
cto
r
1.3
Info
rmG
PC
2.1
.Cre
ate
app
oin
tmen
t
2.2
Am
end
app
oin
tmen
t
2.3
Can
cel
app
oin
tmen
t
3.1
Rec
eive
pat
ien
tfo
rap
po
intm
ent
3.2
Dia
gn
ose
illn
ess
or
refe
r
3.3
Pres
crib
etr
eatm
ent
3.4
Cre
ate
rep
eat
pre
scri
pti
on
3.5
Rec
eive
and
chec
kd
isco
unt
Doctor
Appointment I R/M D R/M
Patient I M R R/M R
Prescription I M R/M
Referral I
Drug R
Table 7.29 Entity/function matrix – Medical Centre.

Module CodeModule NameModule MarkModule Grade
7.2 Normalize this form:
Purchase Order (Customer copy) Order: 345
To:Jack TroutSwillbuckets ClubWest Yorkshire
8/12/2002
From:Cooper’s Brewery15 Brewery StFillem
Product No Name Quantity Price
10 Babycham 400 1.50
25 Old Firtle 25 30.00
48 Egg nog 20 2.50
28 Red Nose bitter 30 25.00
Total cost: 3536.00
Normalization 139

C H A P T E R 8Technical andPhysical Design
8.1 Technical design and physical designThe technical design involves making any final decisions concerning thetechnical environment. We have already decided on the broad componentsof our system in both case studies. However, we now need to considerdetails like the exact specification of the PCs we will need. Which vendorshould we choose to buy from? Can the required software be bought off theshelf? Or will it need developing? We will certainly need to discuss theseissues with suppliers of equipment before reaching any decisions.
In a large system, it may be necessary to compile a list of options, muchas we did for the Business Systems Options in Chapter 5. The same processof identifying the options, analysing costs and benefits and choosing thebest option would apply.
Some organizations have detailed information systems policies thatmight well include service level agreements. Service level agreementsspecify the level of service that users can expect from the information sys-tems. In this kind of environment, we need to be sure that our technicalenvironment can meet the demands of the agreements.
The main aim of physical design is to design the physical system suchthat the performance is acceptable to the user and data integrity and secu-rity are guaranteed. In order to create the design, the analyst will need:
� the normalized tables
� attribute details
� interface requirements
� data volume estimates
� service level requirements
� security needs
140

We already have much of this information but have not, so far, consid-ered the need to ensure that we have sufficient storage capacity in oursystem to store all the data. In order to be sure of this, we will have to calcu-late roughly how much storage space our system will require in the foresee-able future. This technique is called volumetrics and will be describedshortly.
The main areas to be considered in physical design are:
� the performance of the system
� the user friendliness of the system
� response times
� security aspects
� accessibility
� the flexibility of the system – it’s ability to develop as required
It is not difficult to imagine the impact on the user if any one of these areasis not functioning properly.
Very often it is impossible to make an informed choice of technicaloptions until we have considered the physical design of our proposedsystem. These two activities must, to some extent, run in parallel ratherthan occur sequentially.
8.1.1 Design detailed user interface
A more detailed look at the user interface is now required. We have alreadyspecified some general principles in Chapter 6, but there are still someimportant decisions to make. As mentioned earlier, the key to a successfulinterface design is consistency. A set of rules or standards for the interfacemust be decided upon and used throughout. This makes the system easy tolearn and gives it an intuitive feel. If, for example, the ‘Print’ button is situ-ated in the bottom left-hand corner in one screen, it must be situated therein all the others, so that the users instinctively know where it is. A numberof industry standards for interface design already exist and it seems sen-sible to adopt one of these.
While colour schemes should be consistent too, there may be some roomfor flexibility here. The user may wish to have different colours to denotedifferent parts of the system. For example, Jack Trout might find it helpfulto have a background of insipid puce for all the artiste screens and one ofbile green for the food-related screens. This might add to the intuitivenature of the system. However, whatever colour scheme is used, the firstpriority is to make sure the text is clear and readable. That usually meansdark text on a light background.
Readability is not improved by flashing purple labels on a blackbackground.
On the subject of text, the choice of fonts is important. Lower-case seriffonts are the easiest to read. Examples of serif fonts are Times Roman and
Technical and Physical Design 141
Garamond. They have little hooks on the letters which allow the user’s eyeto skim across them quickly and easily. Avoid using italics and obscure orchildish fonts.
The layout of the screens needs careful thought. There is a balance to beachieved between having all the necessary information available to theuser on one screen and making the screen too cluttered. Screens should notbe overloaded with navigation buttons and sub-forms. It may be necessaryto create an additional screen if one screen is overloaded.
A good idea is to have an ‘Escape to Main Menu’ button on each keyscreen so that if users get confused, they have a route back to the safehaven which is the opening screen. Try to make this opening screen, themain menu, as welcoming as possible. This might be done with a welcomemessage, a logo or banner and use of colour.
8.1.2 Prototyping
Prototyping has developed as a response to some of the problems identifiedwith SSADM and similar structured systems analysis methodologies.These problems are:
� implementation is delayed
� users are resistant
� the process takes too long
� diagrams are misunderstood
Prototyping attempts to solve these problems by the building of a cut-down version of the system as part of the design process. This allows theuser to evaluate one or more prototypes and become more involved in theprocess. This also saves time by avoiding the need for lots of diagrams.
It is often a good idea to prototype one or two different user interfaces atthis point in order to involve the user and to establish some clear prefer-ences. The design of the user interface will have implications for the choiceof technical environment. For example, one of our prototype interfacesmight require a colour monitor to be effective. However, we might havedecided on black and white monitors as a technical systems option. Shouldthe preferred interface design drive the choice of hardware or should thechoice of hardware drive the interface design? We will have to make thiskind of awkward decision at this stage.
Prototypes can be generated very quickly using various high-level toolssuch as application generators. Since little time needs investing in them,they can be scrapped or radically altered if necessary without significantcosts. They allow the user to visualize a range of options, to use them and toevaluate them. Usually a hybrid design is the preferred option afterevaluation.
The analyst must be careful not to raise expectations unrealistically,however. Having seen the analyst generate a prototype interface in a couple
142 Systems analysis: a beginner’s guide

of hours, the user may well expect the final system to be delivered in acouple of days. If so, the user is likely to be grossly disappointed, as there isstill considerable work to do. That aside, prototyping is usually a veryworthwhile technique providing high-quality feedback for the analyst.
8.1.3 Simple steps in prototyping
1 Discuss the options for screen designs with users.We will need to be aware of any constraints and make the user aware of thescope of prototyping.
2 Build a prototype – quickly.The prototype will need to take into account the chosen Business SystemOption, the entity model and the DFDs.
3 Demonstrate the prototype.It will be necessary to set up this session carefully. The prototype must beinstalled on the user’s workstation in advance and tested with sampledata.
4 Evaluate the prototype.This must be done in consultation with the user. The prototype may gostraight in the bin, or there may be elements in it that the user likes. Eitherway, the analyst will have learnt something.
5 Build another prototype.Hopefully, this is the end of the prototyping stage, but be prepared foranother trip round the loop.
8.1.4 Interface flow diagrams
The ability to navigate easily between screens is another key aim of inter-face design. Ideally, the design should follow the likely flow of work as theuser uses the system. This will give the user confidence in the system andincrease efficiency. This aim can be achieved by the use of interface flowdiagrams and by consideration of the required entity model, to identify keyrelationships. These diagrams in combination with prototyping provide aneffective tool for the analyst.
The diagrams model the possible movement between screens available tothe user. They provide an overview of the structure of the interface. Figure8.1 is an example of one for part of the Medical Centre.
This shows the appointments sub-system and some related areas. SinceAPPOINTMENT has relationships with PATIENT and DOCTOR on theentity model, we would expect to see a similar set of relationships in theinterface design. Clearly, there are a number of other ways in which thenavigation around the system could be arranged; hence the need for proto-type interfaces to aid selection.
Technical and Physical Design 143

8.2 Database designMost systems will require the creation of a relational database – certainlyour case study systems will. A relational database is defined by Connollyand Begg (1999) as ‘a collection of normalized relations’. We will havespent considerable time and energy in designing these ‘normalized rela-tions’ for our new system. Techniques such as normalization may have leftus feeling weak and confused. However, it’s all been worth it, because wecan now start implementing our database.
Before we set up the tables in our Database Management System (suchas Access or Oracle), we need to plan the detailed field formats. Broadlyspeaking, we will need to do the following:
� Each table (or relation) identified through entity modelling and normal-ization (i.e. on our required entity model) will become a table in ourdatabase.
� Each attribute on our required entity model will become a field in ourdatabase.
144 Systems analysis: a beginner’s guide
Main menu
Patientsearch
clicksearch
button
Patient list
choosep
atientPatientscreen
Appointmentsearch
Appointmentlist
chooseap
pointm
ent
Appointmentscreen
makeappointment
clicksearch
button
Doctorlist
choosedoctor
Doctorscreen
view workrota Work rota
screen
clickw
orkrota
buttonchoose
patient butto
nchoose doctor button
chooseap
pointm
entbutton
back
tom
ain
men
u
backto
main
menu
Figure 8.1Interface designdiagram.

� Primary keys and foreign keys on our entity model will be translated ontoour database structure, checking that foreign keys are at the ‘many’ endof the relationships.
� Each attribute will require a name, a field length, a data type (usuallyText or Number) and possibly an input mask and validation rules (seebelow). Data integrity must be promoted through validation rules builtinto the format of the field.
The promotion of data integrity can take a number of forms. We can, forexample, limit the range of possible inputs into a field. The Medical Centrecould set the range of permissible inputs into ‘Patient Age’ to 0–120. In thecase of Dr McLean’s patients, that could be 0–65 without much danger ofcausing problems. Input masks ensure that data is entered in a specifiedformat. This is particularly important in fields such as ‘Postcode’.
Some DBMS allow the use of combo boxes in the design of the interface.These allow the user to choose from a list of prescribed choices. The chosenoption is then entered into the field automatically so there is no possibilityof error. This can only be used when there are only a limited number of pos-sible entries, such as ‘Doctor Name’.
8.2.1 Indexes
We will also need to design the indexes for our database. Particular fields,or combinations of fields, can be indexed. This means that an index file iskept, by the DBMS, recording the location of specific records and the orderin which they need to be presented. These records can then be quicklylocated and presented in the particular order specified. For example, wecould set up an index to list patients alphabetically by their surnames. Thiswould allow the DBMS to locate and order the records much more quicklythan if no such index existed.
We must consider very carefully, in consultation with the user, exactlywhat indexes need to be set up. Most modern DBMS systems will automat-ically produce an index for each table based on the primary key of the table.Additional indexes will depend upon what queries the user anticipateshaving to deal with regularly and what reports we have already identifiedin the system requirements. Indexes can take up considerable space, how-ever, so the analyst should take care that the index is really necessary.
8.3 Access and securityIn more complex systems with a number of users having access to thesystem, it may well be that users will only be able to access certain parts ofthe system. For example, when Freddo Smitho logs on to the system, wemight allow him to order ingredients or add dishes, but we certainly wouldnot want him dealing with the artistes, particularly Sharon Twain. As a
Technical and Physical Design 145

result, we would need to design the interface available to each category ofuser. In large systems there might be many different categories of user,each with a different view of the system. The different views will need to bespecified through separate interface design diagrams. These differentviews will then need to be built into the physical design of the system.
This is normally achieved by using the DBMS security features such asprivileges and views. Privileges allow categories of users to perform certainoperations. Users might be allowed to read or query information in a table,but not be allowed to update or delete information. It is common sense notto allow users access to more information than they need. Similarly, only avery few users should be allowed to update or delete information.
8.4 VolumetricsAs mentioned above, before we can make final decisions on hardware andstorage requirements, we need to have some idea of the volume of datalikely to be generated by our system. The likely volumes can be modelledusing the entities on the entity model. The average number of occurrencesof each entity is marked inside the entity box. So, if we have 15,000patients in our system, we will write 15000 inside the PATIENT box. Onaverage, each patient might have had two referrals, so we write 2 on therelationship with REFERRAL. This gives us 15,000 × 2 referrals on average,so we would write 30000 in the REFERRAL entity box. Figure 8.2 shows amodel for the Medical Centre.
This diagram shows us the average number of occurrences for each entityduring a specific time period. The time period is the life of the entity beforeit is deleted or archived. This will be determined by the Database Adminis-trator and will vary from entity to entity. For example, we would expect tokeep the patient information for many years before archiving or deleting.However, the work rota information will quickly become obsolete and canbe deleted soon after the work has been done.
Figure 8.2 only estimates the number of records we can expect in a tableat any one time; it does not tell us the size of each record. In order toacquire that information, we need to consider the size of each field in thetable and expand our calculations accordingly. Figure 8.3 shows part of aspreadsheet which might be used to make the final calculations. This willgive us a logical volumetric size of the database. In practice, databases areusually larger than the predicted size.
Note that the ‘Size’ data is taken from the format of the fields and the‘Volume’ data is taken from the volumetrics diagram (Figure 8.2). The twotables, PATIENT and TREATMENT, will generate around 30 Mbyte of datain this example. A figure for all the entities in the system will be requiredand this will give us a good idea as to whether our planned hardware willbe able to cope with the storage requirements.
146 Systems analysis: a beginner’s guide

8.5 DocumentationThis is an area which tends to get ignored by many analysts. Havinglaboured over the analysis and design and having produced the perfectblueprint for the perfect system, the last thing anyone feels like doing iswriting up the documentation. However, the documentation is the user’snumber one support tool. As a minimum, it should consist of:
Technical and Physical Design 147
PATIENT
15000
APPOINTMENT
75000
PRESCRIPTION
50000
SUPPLIER
25
DOCTOR/NURSE
5
ORDER
500
PRESCRIPTIONLINE
150000
TREATMENT
300000
REFERRAL30000
WORK ROTA
500
DRUG
1500
ORDER LINE
2500
EXPENSES
500
DRUGCOMPANY
30
26000
20
515000
100 100
10000
3
50
100
100
5
20
10
Figure 8.2Volumetrics diagram.

� a preliminary user guide
� a technical guide
� online help
� users may require a guide to the daily or weekly operations required
The user guide should be a clear set of instructions showing the user howto use the system. It must avoid technical language and jargon. It should bea training manual as well as a reference guide. Key sections will be thefunctions of the system and how to use the interface.
The online help should contain information about all the key proceduresand components in the system. There could be information about the pos-sible error messages and available reports and queries. This informationshould be indexed and also contain search facilities.
The technical guide should contain the data dictionary where all the datais defined; DFDs; entity models; system architecture information; and pro-totype information. This guide will be used primarily by the technical staffwho will operate the system. In small organizations, there may not be anytechnical staff. In this case, the guide will have to be fairly general and maybe included as a section in the user guide.
148 Systems analysis: a beginner’s guide
PATIENT Type Size Volume Total (k)
PatientNo Number 6 15000 90
P_FirstName Text 15 15000 225
P_Surname Text 20 15000 300
P_Address Text 50 15000 750
P_TelHome Text 15 15000 225
P_Mobile Text 15 15000 225
P_Type Text 5 15000 75
P_DateOfBirth Date 8 15000 120
TREATMENT
RecordNo Number 8 300000 2400
PatientNo Number 6 300000 1800
Date Date 8 300000 2400
Condition Text 20 300000 6000
PrescriptionNo Number 10 300000 3000
Outcome Text 40 300000 12000
Grand Total = 29520 kbyte
or 29.5 Mbyte
Figure 8.3Spreadsheet showingvolumetric data fortwo tables.

We are now in a position to hand over our designs to the programmer todevelop and test the required code. Our job as a systems analyst is over andwe would expect to see large amounts of money appearing imminently inour bank balance.
8.6 CASE toolsComputer-Assisted Systems Engineering (CASE) tools were originallydeveloped in response to a number of problems experienced by systemsanalysts and their clients. Primarily, these problems can be summarized as:systems were expensive and didn’t work. Apart from that, they were fine.It’s not hard to see how the process of analysis and design can be tedious,slow and expensive. The phrase ‘paralysis by analysis’ is often used. CASEtools are an attempt to speed up the process and make it less prone to error.
CASE tools can be used to support many aspects of systems engineering.However, there are a large number of tools available which specifically sup-port structured systems analysis and design techniques and methodologies.
CASE tools allow the analyst to draw DFDs and entity models which canbe easily updated and amended as the need arises. This can save manyhours of redrawing diagrams. They will also validate the diagrams to makesure that no errors of consistency have been made. For example, they willensure that each DFD process box has at least one input and at least oneoutput. Similarly, they will check that DFDs across different levels are con-sistent. As a result, CASE tools, once mastered, are likely to improve boththe efficiency and the effectiveness of the analyst.
Many modern CASE tools will even generate required code from designs,particularly in the areas of prototyping, report generation and querydesign. The really good news is that they will generate reams of documen-tation too, but this comes with a serious health warning and will needcareful editing.
Other features of CASE tools are:
� Support for reusable code
� Support for project groups
� Project management information and support
� Links to external products such as databases
� Pseudo-code generation
� Re-engineering of existing systems
There are four different types of CASE tool:
� Upper CASEThese are used in the strategic planning of information systems. They pro-vide a structure for the planning phase of the systems life cycle.
Technical and Physical Design 149

� Middle CASEThese are used during the analysis and design phase of projects and tend tobe the tools analysts mean when they refer to CASE tools.
� Lower CASEThese are used by programmers during the implementation and mainte-nance phases of projects to help develop and test code.
� Integrated CASE toolsThese tools integrate the previous three into one tool. So they cover upper,middle and lower CASE tools.
It is worth bearing in mind that most time is expended on maintenancein the systems development life cycle. This is because new systems oftenhave many errors or omissions which need correcting. This is classed ascorrective maintenance.
Other types of maintenance might be adaptive maintenance, whichrequires changes to be made to allow the system to adapt to new technolo-gies in the external environment; and perfective maintenance, whichinvolves changing the system in response to changing user requirements.Maintenance can be very expensive, so it is important to try to minimizethe need for it. This can only be done by careful and flexible design.
The use of CASE tools ought to pick up or eradicate many of these poten-tial problems before the system is implemented. Analysts get tired, dispir-ited, bored, subversive and bad-tempered (often all at the same time),whereas CASE tools do not. They can automate much of the tedious stuff,leaving the analyst free to chew over that sticky design issue, or go for agame of golf.
Before one gets too carried away, it should not be forgotten that CASEtools do not guarantee a high-quality system. That remains the analyst’sresponsibility, and CASE tools will not put users at ease or tease out hiddenrequirements. They can be tricky to learn and use, but modern analysts willbe expected to have one or two in their tool kit.
SummaryThe system design is now complete. Some very general comments havebeen made about technical and physical design, but much will dependupon what hardware and software is chosen. It is now time to implementand test the system, but that is beyond the scope of this book.
Exercise8.1 Design an interface for Freddo Smitho at Swillbuckets. He needs to beable to see and update information about dishes, ingredients, recipes andevents. Use the entity model in Figure 6.4 to help you.
150 Systems analysis: a beginner’s guide

And finally...Readers will be pleased to hear that Jack Trout is alive and well and has justopened the ‘Cold Turkey Health Club’ (Motto: ‘Vim and Vigour’) just downthe road from Swillbuckets. Members can recharge their batteries whileenjoying a relaxing massage from Phyllis Haddon. In this way, memberspay him to make them ill at Swillbuckets and then pay him again to makethem better at the health club. This is an iterative process.
Sadly, there is not such good news of the Medical Centre. A GPC investi-gation, prompted by an incorrect diagnosis of bubonic plague for achickenpox sufferer, resulted in the discovery that Dr McLean was not adoctor after all. He just happened to possess a white coat and illegiblehandwriting. After being struck off, his last known whereabouts were as aconsultant in a health club in West Yorkshire....
Technical and Physical Design 151

A P P E N D I X
Teaching casestudy – NorthSea Ferries
TITLE: NSF Project Information Document
Project Background� North Sea Ferries is a small independent ferry operator.
� North Sea Ferries Head Office is at Hull.
� They have booking terminals at Hull, Amsterdam, Rotterdam andZeebrugge.
� The company runs passenger and vehicle ferry services between Hull andthe three other ports.
� The company owns four RORO (Roll On, Roll Off) ferries and one cata-maran. Sometimes at busy times the company will charter other boats.The company may also have to do this if one of their own boats is beingmaintained or repaired.
� All crossings run on a regular timetable.
� Ferries usually carry a mixture of people on business, people on holidayand freight.
� At the moment the booking system is a manual one.
� Business has increased over the past few years, so the company feels itshould start to use computerized systems.
� The company knows that most other ferry companies use computers.
152

� The company has problems with the system it is using now, and theseproblems will get worse as business increases.
Earlier this year, the company decided to have its existing systems forbooking, issuing tickets and embarkation analysed. If this analysis is suc-cessful it could lead to the design and implementation of a computerizedsystem.
Project Team – Terms of Reference
As a development team, your terms of reference are to:
� Carefully analyse the existing systems for booking, issuing tickets andembarkation control.
� Find out what the problems are at the moment with these systems.
� Find out what the new requirements are.
� Design a new system to meet the requirements.
Document this using Structured Systems Analysis and Design Methodstandards.
NSF Project Briefing Document
Company Overview – Crossing Bookings
NSF started off as a family firm. Many of the structures and proceduresthat the company has now have developed from this family origin.
The company has a number of separate functions involved with ferrybookings:
� The Central Booking Office at Hull deals with bookings and also withcustomer enquiries. So here staff deal with enquiries, reserve tickets forcustomers, make bookings for customers and provide general crossinginformation.
� The Crossing Desks are at the ports. Here, the staff deal with crossingqueries, take last minute bookings, issue tickets, take cash payments andissue boarding passes.
� The Payment Control Department checks all payments and authorizesand issues tickets.
When bookings are made, all the details are recorded on a crossingbooking form. This form is created at the desk where the booking is made.It is the main record of each booking.
The booking form is then sent from the desk where the booking is made,over to the central booking office. From the central booking office it is thensent to the payments control area for them to check the payment and issuethe ticket. Finally, the form goes back to the central booking office where it
Appendix 153

is put in a file. The form is kept in the file for reference in the future andalso to analyse places available on ferries.
Whenever a booking is made, the customers can pay by cash, credit card,or on account. If a customer has an account, they can put the amount ontheir account and they will receive an invoice later.
Some members of staff have been interviewed. Transcripts of these inter-views are available.
154 Systems analysis: a beginner’s guide
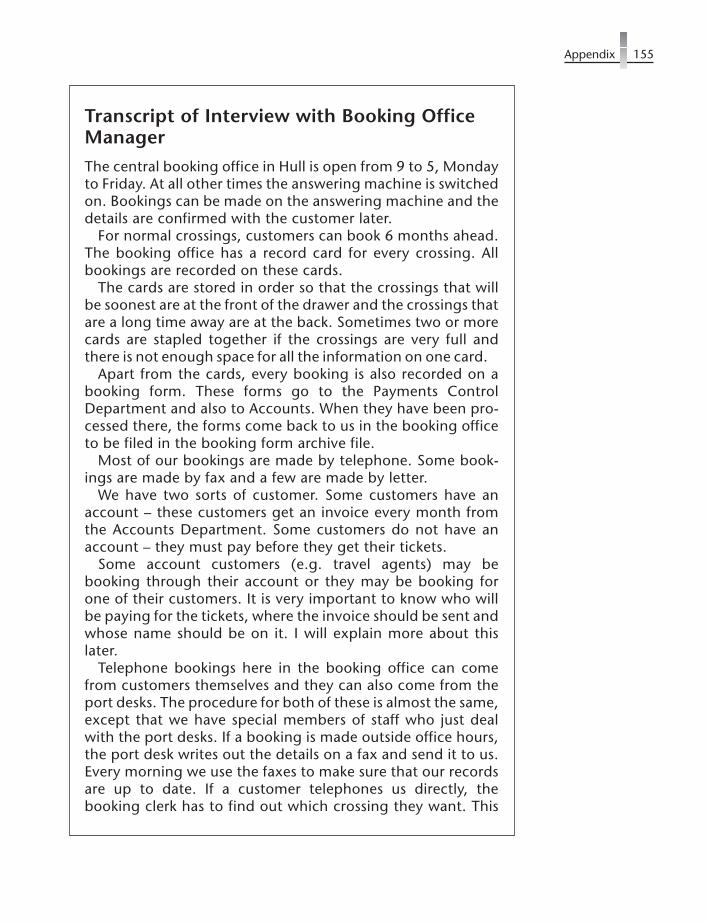
Appendix 155
Transcript of Interview with Booking OfficeManagerThe central booking office in Hull is open from 9 to 5, Mondayto Friday. At all other times the answering machine is switchedon. Bookings can be made on the answering machine and thedetails are confirmed with the customer later.
For normal crossings, customers can book 6 months ahead.The booking office has a record card for every crossing. Allbookings are recorded on these cards.
The cards are stored in order so that the crossings that willbe soonest are at the front of the drawer and the crossings thatare a long time away are at the back. Sometimes two or morecards are stapled together if the crossings are very full andthere is not enough space for all the information on one card.
Apart from the cards, every booking is also recorded on abooking form. These forms go to the Payments ControlDepartment and also to Accounts. When they have been pro-cessed there, the forms come back to us in the booking officeto be filed in the booking form archive file.
Most of our bookings are made by telephone. Some book-ings are made by fax and a few are made by letter.
We have two sorts of customer. Some customers have anaccount – these customers get an invoice every month fromthe Accounts Department. Some customers do not have anaccount – they must pay before they get their tickets.
Some account customers (e.g. travel agents) may bebooking through their account or they may be booking forone of their customers. It is very important to know who willbe paying for the tickets, where the invoice should be sent andwhose name should be on it. I will explain more about thislater.
Telephone bookings here in the booking office can comefrom customers themselves and they can also come from theport desks. The procedure for both of these is almost the same,except that we have special members of staff who just dealwith the port desks. If a booking is made outside office hours,the port desk writes out the details on a fax and send it to us.Every morning we use the faxes to make sure that our recordsare up to date. If a customer telephones us directly, thebooking clerk has to find out which crossing they want. This

156 Systems analysis: a beginner’s guide
means they need to know where the crossing goes from,where the crossing goes to, and the time and date of thecrossing.
We only ever book single crossings. This means that a returnis booked as a single there and a single back, each with aunique booking number. We then need to know who the cus-tomer is and what they require. We also need to include anyvehicle details and whether they need a seat or a cabin.
If the booking is not going to go on a customer’s account,we need to know who to send the invoice to and where tosend it to. We need to know who the passengers are, and anyspecial detail such as wheelchairs, medical problems or smallbabies. All these details are used to complete the booking formand to work out the total cost based on the booking tariff. Ifthe customer later cancels the booking we change the detailson the crossing record card for that ferry. We also fill in abooking cancellation form, which goes to Payment Control inthe same way as a normal booking form.
Sometimes people telephone us and they want to travel verysoon. This can mean that we do not have enough time to sendthem an invoice by post and receive the money from them. Ifthis happens they can pay by credit card, by giving us the cardnumber over the telephone. If this is not possible they canarrange to pay when they arrive to get on the ferry. Thesedetails must be written on the booking record card so that thedesk staff will know what to do. They must also go on thebooking form for Payments and Accounts.
If a person wants to pay by credit card we check their credit-worthiness (i.e. whether they are over the limit on their card).When we check this with the credit card company they give usan authorization number, which is then written on thebooking form. We also go through the checking procedure if aperson pays by credit card at the desk.
If a port desk phones us with a booking because they have acustomer there who wants to make a booking, exactly thesame procedure is followed. It is just as if the customer wasphoning us. The only difference is that the desk staff can takethe payment at the time and they can also give the customerthe tickets. Account customers can of course also book atdesks.

Appendix 157
One problem we have with the booking system is when cus-tomers book by leaving the information on the answeringmachine. Quite often there is information missing.
When a booking is made out of hours (i.e. when the desk isshut) or when a desk takes money or issues tickets, they shouldfill in a booking form and then fax the form to us. Sometimesthey forget to do this.
We keep a file of all account customers. We keep this file upto date from information we get from the Payments ControlDepartment. This file contains a security procedure whichpeople booking on behalf of this company must use. The pro-cedure may involve using an order number, which must bequoted, or only certain people being allowed to makebookings.
When non-account customers receive an invoice, theyshould send the payment to the Accounts Department. TheAccounts Department let the Payments Control people knowthat they can go ahead and issue the ticket. When the pay-ment is made, Payment Control should tell us on the bookingform so that we can keep our records up to date. Also, if ticketsare issued at the desk, this information needs to be entered onthe booking record so that the desks are aware of this. Oftenthis information reaches us too late.
At the end of every day we fax copies of crossing recordcards for the crossings on the next day to the desk at the portof departure. That desk then deals with last minute bookingsand they also sell standby tickets. Standby tickets are slightlycheaper. They are available for all unbooked places, but theycannot be sold until 2 hours before departure.
Our biggest problems in here are that we receive vital infor-mation from Accounts very late. Also booking confirmationinformation is not clear and the answering machine is aproblem. Everything else is fine. I suppose that the bookingform could be designed better. There is loads of paperwork ofcourse, but that’s all part of working in an office.

158 Systems analysis: a beginner’s guide
Transcript of Interview with Port Desk StaffWe have a lot of problems here. What happens is that if a mis-take is made somewhere else in the system, the passengeralways ends up in here complaining.
I think we do three things that will be of interest to you. Weact as go-betweens with the booking office if a passengerwants to make an advance booking. This means that we relayinformation that the booking office wants and also sometimestake the customer’s payment. We also deal with checking in,boarding passes and last-minute bookings.
When the booking office closes it faxes copies of the crossingrecord cards to us. The cards give us all the information aboutlatest bookings and passenger information. When the bookingoffice is closed we can take bookings for crossings that willsoon be departing. Sometimes the copies of the record cardsare very messy and difficult to read. Usually the worst cards arethe ones for the busiest crossings. We are supposed to sort outhow many places there are left on the boats and sell them.When we do sell them, we have to fill in a booking form andfax it back to the booking office. If the customer wants thetickets on account, we have to check with the booking officethat this is all right.
Sometimes passengers collect their tickets at check-in andsometimes they have to pay for them as well. Passengers canpay by cash or credit card. We are supposed to work all this outfrom the messy copies of the booking cards. At the end ofevery day we put the money in the bank, which has a branchon the port. When the bank gives us the paying-in slip, wesend this to the sales ledger department in Accounts.
Two hours before the ferry goes, we can sell any leftovertickets or any reserved tickets that have not been paid for. It isvery difficult for us to work out how many we have available tosell from the information on the crossing record cards. If wemake a mistake the passengers get very angry when theyrealize that we have sold their seats to another passenger.
We have quite a few problems, as I have said. The worst oneis working out what the crossing record card means. We cannever even be sure that the information is up to date and cor-rect. It is very embarrassing to be asking for money from a pas-senger who has already paid.

Appendix 159
Another problem is that it is very difficult to cope when thebooking office is closed. We use the latest crossing recordcards, but sometimes we might make a booking for a ferrywhich is already full. Also, if the central booking office is closedwe have no way of checking whether a customer can pay onaccount for crossings which are departing very soon.
Normally we only take account bookings from 9 to 5, butsometimes we have to make a decision ourselves. We reallyneed a copy of the account customer file here and at everyother desk.
When we take a booking or if we sell tickets, we fill in abooking form which is sent by fax to the central bookingoffice. Sometimes, if we are very busy, it is difficult to do thisproperly. If we can’t find and fill in the paperwork quicklyenough the crossing can’t be delayed. If the customer has paidthere and then and the ship is about to leave; why does thebooking office need to know anyway?
Could you change things so that we don’t have to fill in allthe unnecessary details on the booking forms? It would makeour jobs much easier. Also, if you can persuade the bookingoffice to let us have complete, correct information which iseasy to read on the crossing records, then staff who have todeal with the public would find life a lot easier.

Examples of Documents used by North SeaFerriesThe following are examples of documents that the NSF use now. Thesewere collected when the work areas of NSF were being researched. The doc-uments are:
� Crossing Booking Form
� Booking Cancellation Form
� Crossing Record Card
� Load Factor Report
� Weekly Traffic Report
� Sample of Crossing Ticket
� Invoice
� Boarding Card
160 Systems analysis: a beginner’s guide

Appendix 161
Crossing Booking Form Booking Date: Booking Number:
Crossing Date: Departure Time: Arrival Time:
Crossing Number: Departure Port: Arrival Port:
Customer Name: Seats Booked: Cabins Booked:
Vehicle Details – Make and Model: Reg. No:
Passengers Cabin Seat Special Requirements
Payment Name and Address:
Amount Due: Payment Mode:
Account Number: Invoice Number:
Date Charged: Date Paid:
Credit Card Details: Cash Payment Date:
Date Charged: Received By:
Date of Ticket Issue:

162 Systems analysis: a beginner’s guide
Booking Cancellation Form: Cancellation Date: Booking Number:
Crossing Date: Departure Time: Arrival Time:
Crossing Number: Departure Port: Arrival Port:
Passenger Name(s): Cabins Booked Seats Booked
Payment Name and Address:
Actioned By: Action Date:

Appendix 163
Crossing Record Card Date:
Crossing Date: Departure Time: Arrival Time:
Crossing Number: Departure Port: Arrival Port:
Vehicle Allocated: SeatsAvailable:
CabinsAvailable:
Deck Crew: Amenities Crew:
Passenger Name Booking Date Booking Status Spec. Req. Seat Booked Cabin Booked

164 Systems analysis: a beginner’s guide
Load Factor Report Date:
CrossingNumber
DepartureTime
ArrivalTime
VesselType
Seats/CabinsAvailable
Seats/Cabins Booked %
Firm Reserved Total

Appendix 165
Weekly Traffic Report Date:
Departure Port Arrival Port No. of Crossings No. of Passengers % loading
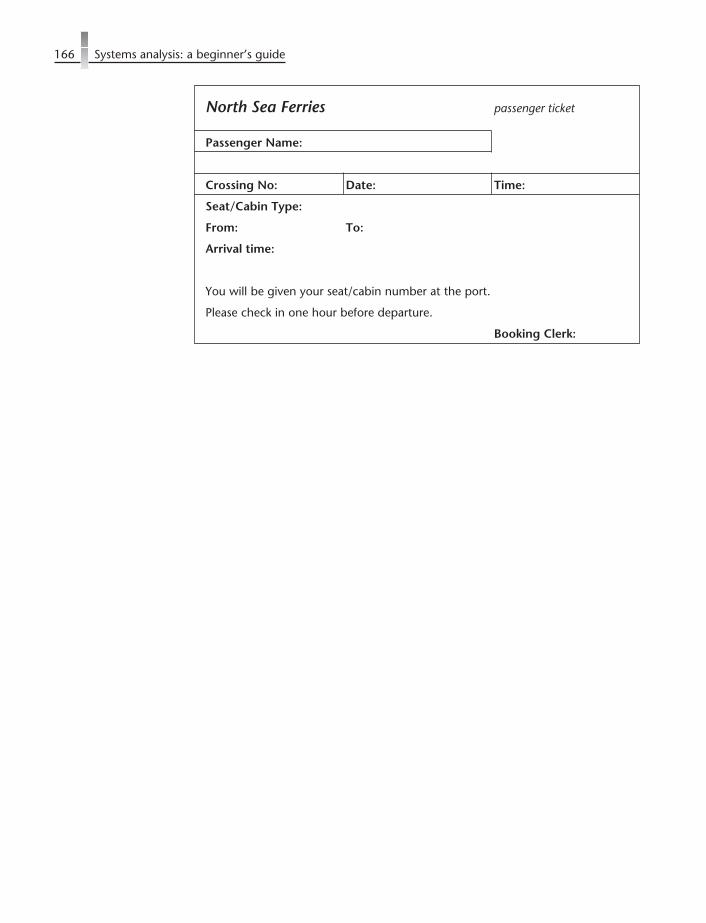
166 Systems analysis: a beginner’s guide
North Sea Ferries passenger ticket
Passenger Name:
Crossing No: Date: Time:
Seat/Cabin Type:
From: To:
Arrival time:
You will be given your seat/cabin number at the port.
Please check in one hour before departure.
Booking Clerk:

Appendix 167
North Sea Ferries invoice
Invoice no:
Customer Name:
Crossing No: No. passengers: Price: Total:
Total due:
Please send payment with this invoice to:
North Sea Ferries, 25 Cross Street, Hull
Date paid: Accounts Clerk:

168 Systems analysis: a beginner’s guide
North Sea Ferries Boarding Card
Passenger Name:
Crossing No: Date: Time:
Seat/Cabin Number:

Bibliography
Connolly, T. and Begg, C. (1999). Database Systems, 2nd edn. Reading, MA:Addison-Wesley.
Fournier, R. (1999). A Methodology for Client/Server and Web Application Devel-opment. Upper Saddle River, NJ: Prentice Hall.
Goodland, M. with Slater, S. (1995). SSADM A Practical Approach. New York:McGraw-Hill.
Hoffer, J. A., George, J. F. and Valacich, J. S. (1998). Modern Systems Analysisand Design, 2nd edn. Reading, MA: Addison-Wesley.
Weaver, P. L., Lambrou, N. and Walkley, M. (1998). Practical SSADM, 2ndedn. London: Financial Times Professional.
169


Index
attributes 42–4, 47, 50, 53, 56–8, 67,93, 135, 136, 145
Business System Options 6, 85–91
candidate keys 135CASE tools 149–50composite key 44
in normalization 118, 119, 120,121, 123, 128, 131, 135
context diagram 17, 21–4cross-checking 5
database design 144–5database management system 144–6data dictionary 148data flow 20–1data flow diagrams 18–24
data flow modelling 17decomposition 26–8exercises in 40–1levels 30limitations 33logical 66–71Medical Centre examples 26,
29–33, 70–3, 88Simple Steps in 22–6Swillbuckets examples 34–40, 73–8
data store 18–21, 27–9different forms of 28entity cross reference 58–62logical 66–9
decision table 98–100exercise in 109simple steps in 99
decision tree 97–8dependencies 119–22documentation 147Document Flow Diagram 18, 21–4
elementary process 27descriptions 86, 94, 97
entities 42–65
characteristics 42database design 144entity/function matrix 136–8exercises in 65external 19, 21, 23link 55–7logical 66–71Medical Centre examples 63–4modelling 42–9, 92–6rebuilding 135representation 25simple steps in 48–9size of 146Swillbuckets examples 49–59
fact-finding techniques 16–17feasibility 5–7, 14First Normal Form 119, 131foreign key 48, 58, 125, 136, 145functions 42, 108, 137, 148
entity/function matrix 137–8
Human–Computer Interface (HCI) 106indexes 145information 2
gathering 16management 13
information systems 2input design 105–6interface design 141–2interface flow diagram 143–4investigation of system 5, 6, 14, 22
keys 43–4, 47, 48, 57, 119, 123, 126composite see composite keyforeign see foreign keyidentification 123primary see primary key
logicalization 66–73of DFDs 67simple steps in 67–9Swillbuckets example 73–5
171

normalization 110–39exercises in 138–9First Normal Form (1NF) 119rationalization see rationalizationrepeating groups 118–19, 124, 126,
127Second Normal Form (2NF) 120–2simple steps in 115–23Third Normal Form (3NF) 122,
125, 128unnormalized data 110–15
output design 102–5
physicalanalysis 4constraints 66–7data store 59design 4–6, 140–50DFD 25–6, 32to logical 67–9view 17, 26
primary key 48–9, 58, 135, 145problem and requirements catalogue
73, 75–81Medical Centre example 76–81Swillbuckets example 81–2
processes 2, 17, 18, 19–20, 24rules 20logicalization of 66–73
prototyping 142–3, 149
rationalization 133–5
relationshipsbetween entities 44–9, 50–5resolving many to many 46, 55, 56resolving one to one 54type 45
report design 103–4required system 6, 17, 18
specification 86, 92–109
screen design 106–7Second Normal Form (2NF) 120–2security 140, 145–6SSADM
approach to 9data modelling in 17principles of 4, 7problems with 142steps in 14structure of 5–6
Structured English 97exercise in 109
systems development life cycle 7
technical design 140–50Third Normal Form (3NF) 122, 125,
128
unnormalized data 110–15user guide 148user interface design 141–2
validation 107volumetrics 146–7
172 Index


![the birthdayshoes.com [beginner’s guide] to Vibram FiveFingersimg2.timg.co.il/forums/1_142523900.pdf · [beginner’s guide] to VFFs the birthdayshoes.com [beginner’s guide] to](https://img.dokumen.tips/doc/110x75/5f31c0e74c5d41162d54cd63/the-beginneras-guide-to-vibram-fivefingersimg2timgcoilforums1142523900pdf.jpg)