Embed Size (px)
Citation preview

Systemic Risk in ASEAN-6: A New
Empirical Investigation∗
Trung H. Le
Banking Faculty, Banking Academy of Vietnam
Current version: April 15, 2020
Abstract
We provide the first study on systemic risk of banking sector in the
ASEAN-6 countries. In particular, we investigate the systemic risk dynamics
and determinants of 49 listed banks in the region using the SRISK measure
of Brownlees and Engle (2017) over the 2000-18 period. We document
significant variations of systemic risk in each country, which are currently
at par or higher level than the recent global financial crisis. Our empirical
evidence advocates capital surcharges on the systemically important financial
institutions. We also encourage the regional regulators to account for the
idiosyncratic characteristics of their banking sector in designing effective
macroprudential policy to contain the systemic risk.
JEL classification:
Keywords: Systemic Risk, SRISK, Banking, ASEAN-6
∗Corresponding author is Trung H. Le: [email protected]
1

1 INTRODUCTION
One of the main reasons for the outbreak of the recent global financial crisis was the
widespread failures and losses of undercapitalized financial institutions. When financial
institutions face a negative shock to their capital, a typical response is selling assets or
raising capital in the market (Engle and Ruan, 2019). However, if the whole system is
also undercapitalized, the shocks may not be absorbed by other strong competitors and
aggravated to an aggregate capital shortage of the financial sector (Acharya et al., 2012,
2017). When this shortage is extreme, it could significantly reduce the aggregate supply
of credit and consequently hit the real economy (Brownlees and Engle, 2017). Thus, the
focus of post-crisis regulation has changed from keeping individual institutions sound to
containing the systemic risk, which is the risk of correlated failures in the financial sector
(Meuleman and Vander Vennet, 2020). In this context, measuring and monitoring systemic
risk are fundamental tasks for the banking supervisors to design relevant macroprudential
policy aiming at maintaining the stability of the financial market.
This paper provides the first study on the systemic risk of ASEAN-6 countries,
including Indonesia, Malaysia, Philippines, Singapore, Thailand and Vietnam. This area
has been one of the most dynamic regions with rapid economic growth and increasing
financial integration.1 In particular, the financial system of these countries is bank-based
with the banks holding the predominant source of financing (Ha et al., 2019). Bats
and Houben (2020) find that the bank-based financial structure is associated with
higher systemic risk, compared to that of a market-based economy, due to the risky
nature of banks with high leverage, large asset-liability mismatches and high level of
interconnectedness. Thus, a detrimental shock to the bank stability could easily exacerbate
significant distress to the region’s economy. Against this background, we address two
questions. First, what are the levels and rankings of the bank’s systemic risk in the
ASEAN-6 countries? Second, what are the drivers of the bank’s exposure to systemic
risk in each country? The answers to these two questions are of particular interest to
the regional policymakers in designing macroprudential tools aiming at regulating and
reducing the systemic risk in the banking industry.
Measures of systemic risk have been widely developed in the aftermath of the global
financial crisis of 2007-2009.2 One approach is the scoring methodology developed by
the Basel Committee on Banking Supervision (BCBS). It starts with the requirement of
identifying the systemically important financial institutions (SIFIs), which are subjected
to higher capital requirements. Intuitively, this measure combines information about
the systemic importance of an institution with regards to four categories: size,
1According to the 2019 ASEAN Economic Integration Brief (ASEAN Secretariat, 2019) , theaverage real GDP growth of the ASEAN-6 countries in 2018 is 5.1%, compared to 3.6% of theglobal GDP growth
2Detailed surveys on the development of systemic risk measurements can be found in Bisiaset al. (2012) and Benoit et al. (2017).
1

cross-jurisdiction activity, complexity and substitutability.3 While this approach can be
useful in ranking banks at a given point in time, the use of accounting data limits its
usages to monitor systemic risk over time. Thus, growing measures of system risk exploit
the publicly market data to measure the systemic risk. This approach draws on the idea
that, if the market is efficient, the level and contribution of an institution to systemic risk
can be captured by the correlation between its stock price and the whole market. The
main advantage of these market-based measures is its ability to estimate systemic risk in
real-time and detect potential shifts in the systemic risk regimes.
In this study, we employ the market-based SRISK measure of Acharya et al. (2012)
and Brownlees and Engle (2017) to investigate the systemic risk of the ASEAN-6’s banking
sector. SRISK corresponds to the expected capital shortfall of a financial institution
conditional on a prolonged market stress. Thus, a bank with high SRISK imposes
pressure on the undercapitalization of the financial sector during the stressed period,
which subsequently produces negative externalities to the real economy. The idea is that
the undercapitalisation of financial institutions is a signal of excessive credit growth in the
financial sector (Engle and Ruan, 2019). When “credit boom goes bust”, the risky credit
that is typically issued at the end of the credit cycle would result to significant losses
to the financial sector and likely to initiate a financial crisis (Reinhart and Rogoff, 2011;
Schularick and Taylor, 2012). Brownlees and Engle (2017) finds that the aggregate SRISK
can also serve as an early warning signal of distress in the U.S., whereas Engle et al. (2015)
provide a similar result for European countries. The use of SRISK to measure systemic
risk has been widely applied in many recent empirical studies (see, amongst other Buch
et al., 2019; Bostandzic and Weiß, 2018; Colletaz et al., 2018; Brownlees et al., 2020; Bats
and Houben, 2020).
Another popular market-based systemic risk measure is the so-called ∆CoVaR of
Adrian and Brunnermeier (2016). ∆CoVaR considers the sensitivity of the overall market
to a particular institution by examining the risk of system losses conditional on that
institution being under financial distress.4 We prefer SRISK over ∆CoVaR because of two
main reasons. First, SRISK combines information from the market and balance sheet of
the financial firm, rather than purely rely on the market price. In particular, SRISK is
a function of a financial firm’s size, degree of leverage and level of dependence with the
market return. Thus, this specification can also capture the evidence that size is typically
an important determinant of systemic risk (see, for example, DeJonghe, 2010; Laeven
et al., 2016; Varotto and Zhao, 2018) and the high leverage nature of banking business
increases its risk exposure when the economy is weak (Acharya and Thakor, 2016; Bats and
Houben, 2020). Second, while SRISK focuses on the shortage of capital shortfall facing
3This methodology is currently implemented by the Financial Stability Board to classify a setof financial institutions as the Global Systemic Important Financial Institutions (G-SIFIs)
4Girardi and Tolga Ergun (2013) generalise the original ∆CoVaR to several more extremeevents, whereas Bonaccolto et al. (2019) extend the estimation process to include the state atwhich the financial system and the conditional firm are jointly in distress
2

financial institution conditional on the systemic distress, ∆CoVaR takes an opposite view
and determine the risk of financial system due to the effect of distress in one particular
firm. Engle (2018) argues that this approach is only valid when the health of other firms
is holding constant. In other words, it ignores the high interdependence between financial
institutions and could lead to the inference of many systemic firms even if only one is.
We investigate the SRISK on 49 listed banks in the ASEAN-6 from January, 2000
to December, 2018. Not surprisingly, Singapore has the highest systemic risk exposure
on average, as well as at the end of the study period, given the relatively large size of
their banking sector. Importantly, the systemic risk of ASEAN-6 countries, except for
only Philippines, has been increasing significantly and currently at par or even higher
level than the exposure during the global financial crisis. We then follow Engle and Ruan
(2019) to examine the severity of potential crisis caused by systemic risk. The systemic
risk severity is based on the cost of alternative strategies that banks may need to compel
to strengthen their balance sheet, which are appealing for a bailout, selling existing assets
and raising capital by selling new shares. The loss of GDP to bailout banks under stress
is highest in Singapore as expected, at 17% of GDP. If the banks choose to sell assets or
shares to reduce their capital shortfall, however, Vietnamese banks would have suffered the
most severity, followed by Thailand. Economically, Vietnamese banks would need to sell
62.5% of their total asset or approximately 45% worth of the current market capitalisation
to reduce the SRISK to zero. Such large sale of asset and equity could trigger the “fire
sale externality”, that could further dampen the undercapitalisation of the banking sector
and leads to a financial crisis (Engle and Ruan, 2019). Finally, we identify the most
systemically risky banks for each country as of December 2018. This list can be useful for
the regulators to monitor and apply capital surcharge on these so-called SIFIs to reduce
their risk exposures to the financial system.
Last, we analyse the determinants of systemic risk of banks in the region. We
find strong evidence of the too-big-to-fail paradigm, with which bank size is positively
related to the systemic risk (see, e.g., Laeven et al., 2016; Buch et al., 2019; Silva-Buston,
2019, for similar results). Moreover, banks with a more traditional business model,
lower quality loan portfolios, less profitable and lower market-to-book values are generally
associated with higher systemic risk. Notably, we do not find consistency in the empirical
results across ASEAN-6 countries. This finding implies that the regional supervisors
need to account for the fundamental differences in economic development, institutional
environment in designing relevant regulatory frameworks for the systemic risk.
The rest of the paper is organized as follows. Section 2 presents our measure
of systemic risk. In section 3, we present our data and examine the properties and
determinants of systemic risk in ASEAN countries. Section 4 discusses the implications
of our results to the policy makers while the last section concludes the paper.
3

2 SYSTEMIC RISK MEASURE
We employ the SRISK measure developed by Acharya et al. (2012) and Brownlees
and Engle (2017) to measure the systemic risk of a bank based on its capital shortfall
conditional on a systemic event. In particular, the SRISK measure how much capital
would a bank need to raise on a prolonged market decline. Thus, the calculation of SRISK
shares the same spirit of the stress test that is typically employed by the regulators but
it has the advantage of being more responsive to changes in the market and involves only
publicly available information.
2.1 Conditional Capital Shortfall
Brownlees and Engle (2017) defines the capital shortfall of bank i in day t (CSi,t) as the
difference between the regulatory capital that the bank needs to hold and its market value
of equity.
CSi,t = kAi,t −Wi,t = k (Di,t +Wi,t)−Wi,t (1)
where k is the prudential capital ratio, which is set at 8% as similar to the international
standards and current practices of countries under consideration in this study. Ai,t is the
value of quasi assets, which comprises of the book value of debt, Di,t, and the market value
of equity, Wi,t. The formulation of Eq. (1) implies that the bank faces a capital shortfall
when its market value of equity falls below the required capital reserves, i.e. CSi,t < 0.
The SRISK measures the level of capital shortfall for the bank in case of a system-wise
crisis defined as a prolonged decline of the stock market:
SRISKi,t = Et (CSi,t+h|Rm,t+1:t+h < C) ,
= kEt (Di,t+h|Rm,t+1:t+h < C)− (1− k)Et (Wi,t+h|Rm,t+1:t+h < C)(2)
where Rm,t+1:t+h is the multiperiod arithmetic market returns of h−horizon from day t+1
to day t+h and (Rm,t+1:t+h < C) is the systemic event in which the market declines below
a threshold C. To compute the expectation, we assume the bank can not negotiate its
debt in the systemic event, i.e. Et (Di,t+h|Rm,t+1:t+h < C) = Di,t. Thus, Eq. (2) can be
rewritten as:
SRISKi,t = kDi,t − (1− k)Wi,t(1− LRMESi,t),
= Wi,t [kLV Gi,t + (1− k)LRMESi,t − 1] .(3)
where LV Gi,t is the quasi leverage ratio, (Di,t+Wi,t)/Wi,t and LRMESi,t denotes the long-
run marginal expected shortfall, which estimates the expectation of the bank multiperiod
4

returns conditional on the systemic event:
LRMESi,t = −Et(Ri,t+1:t+h|Rm,t+1:t+h < C) (4)
where Ri,t+1:t+h is the multiperiod arithmetic returns of bank i from day t+1 to day t+h.
Eq. (3) signifies that the systemic risk of a bank will increase when the bank has higher
leverage ratio, more sensitivity to the crisis in the stock market and has a bigger size.
2.2 Long-run Marginal Expected Shortfall
To estimate SRISK as in Eq. (3), it is necessary to estimate the time-series dependence
between the domestic stock market and bank equity returns. In this article, we follow
Brownlees and Engle (2017) and Engle et al. (2015) to rely on the standard DCC-GARCH
model of Engle (2002) to obtain estimators of LRMES.
Let ri,t = log(1 + Ri,t) and rm,t = log(1 + Rm,t) are the logarithmic returns of the
bank i and the market m at day t, where Ri,t and Rm,t are their corresponding arithmetic
returns. The return pair has conditional joint distribution D on the information set Ft−1
with zero mean and time-varying covariance as follows:[ri,t
rm,t
]∣∣∣∣Ft−1 ∼ D
(0,
[σ2i,t ρi,tσi,tσm,t
ρi,tσi,tσm,t σ2m,t
]). (5)
in which the dynamic of returns volatility is captured by the GJR-GARCH volatility model
of Glosten et al. (1993) as follows:
σi,t = ωi + αir2i,t−1 + γiri,t−1I(ri,t−1<0) + βiσ
2i,t−1, (6)
σm,t = ωm + αmr2m,t−1 + γmrm,t−1I(rm,t−1<0) + βmσ
2m,t−1, (7)
where I(.) is the indicator function. The time-varying correlation between the bank equity
returns and market index is estimated by the DCC correlation model of Engle (2002)
through the standardized innovations εi,t = ri,t/σi,t and εm,t = rm,t/σm,t:
Cor
(εi,t
εm,t
)=
[1 ρim,t
ρim,t 1
]= diag(Qi,t)
−1/2Qi,tdiag(Qi,t)−1/2, (8)
with Qi,t is the pseudo correlation matrix, with which the dynamics is specified as an
autoregressive process:
Qi,t = (1− αC,i − βC,i)Si + αC,i
[εi,t−1
εm,t−1
][εi,t−1
εm,t−1
]′+ βCiQi,t−1, (9)
where Si is the unconditional correlation matrix between the bank equity and market
5

index. To estimate LRMES, we adopt the simulation approach of Brownlees and Engle
(2017) to reflect the possibility of time-varying market risk of the bank equity. In
particular, we simulate S = 10, 000 random sample of h−period bank and market
arithmetic bank returns based on information available at day t and estimated parameters
of the GARCH-DCC models described above:5[Rs
i,t+1:t+h = exp(∑h
k=1 rsi,t+k
)− 1
Rsm,t+1:t+h = exp
(∑hk=1 r
sm,t+k
)− 1
]∣∣∣∣Ft−1 s = 1, .., S (10)
where rsi,t+k and rsm,t+k are the simulated bank and market logarithmic returns. The
LRMES of bank i for day t are then computed as follows:
LRMESi,t =
∑Ss=1R
si,t+1:t+hI(Rs
m,t+1:t+h<C)∑Ss=1 I(Rs
m,t+1:t+h<C)
(11)
where I(.) is the indicator function. We follow Engle (2018) and Engle et al. (2015)
to consider the systemic event as the worst 6-month of stock market when the market
capitalization lost 40% of the value, i.e h = 125 days and C = 40%. Similar to Engle
et al. (2015), we adjust the threshold level by its relative volatility with a World portfolio
to account for the difference in the volatility of the markets under consideration. In
particular, we set Cj = −0.4 × σj/σw, where σj and σw are the annualised volatility of
the domestic index in country j and the MSCI World portfolio. Finally, we plug the
LRMES measure to Eq. (3) together with the market capitalization, Wi,t, and the most
recent information the quarterly book debt, Di,t to estimate the systemic risk of bank i
at day t, SRISKi,t. A positive value of SRISK indicates that the bank would suffer an
undercapitalisation if a systemic risk event is triggered over the next 6 months.
3 EMPIRICAL STUDY
3.1 Data
Our empirical analysis comprises of banks listed on the stock markets of the ASEAN-6
countries. To estimate SRISK, we obtain the quarterly book value of equity and debt,
daily stock prices and market capitalization from S&P CapitalIQ database. We focus on
large banks with market capitalization greater than 200 million USD as of the end of
December 2018. The sample period spans from January 3, 2000 to December 31, 2018.
We also require the bank to start listing on the stock markets before January 1, 2010
to ensure relatively long historical data for the DCC-GARCH model estimation, which
results to an unbalanced panel data of 60 banks. We further drop 11 banks with which
5The simulation algorithm is described in details in Appendix A of Brownlees and Engle (2017)
6

the GARCH-DCC model can not converge due to the low level of liquidity. The final list
of 49 banks is reported in Table 1. Finally, we use the major stock index in each country
as the market index in the GARCH-DCC model estimation.6
Figure 1 presents the cumulative performance for the stock index and the aggregate
of bank returns in each country. All stock markets have experienced notable downturns
during the recent financial crisis 2007-2009 with the most severe drawdowns recorded in
Singapore and Vietnam. Banks are significant underperformed the aggregate market over
the sample period in most of the markets, except only for Malaysia where bank stocks
significantly outperform the index after the crisis. Between countries, Indonesia stock
market generates the highest returns, whereas Vietnam investors have suffered dramatic
falls during the crisis and only gradually regaining their losses until recently.
Table 2 confirms the cumulative performance. Only Vietnam has negative average
annualised returns over the sample period in both index and bank levels (-0.005 and -0.051,
respectively). Banks outperform the aggregate index in Malaysia (0.066 vs. 0.035) and
Singapore (0.022 vs. 0.014). Banks have higher volatility than the aggregate index in
all markets, except only for Philippines. Almost all series are characterised with negative
skewness and excess kurtosis, except only the bank stocks in Indonesia and the market
index of Philippines with positive skewness. In all countries, the dynamics of bank stocks
are highly correlated with the aggregate market.
3.2 SRISK computation
We estimate the GARCH-DCC model for each bank in the sample with the country index
in a recursive manner similar to Brownlees and Engle (2017). Since we compute LRMES
using simulation approach, the recursive approach ensures enough historical data to draw
sufficient number of scenarios for market crashes. In particular, we calculate SRISK for all
banks in the panel at the end of each month using all data available up to that date. For
each bank, the first estimation window consists of 5 years of available data to guarantee
the model convergence.
Table 3 reports the median of parameter estimates across banks for the GJR-GARCH
and DCC dynamics in each country using the full sample. The GJR-GARCH parameters
are similar across countries with highly persistent individual volatility dynamics. The
asymmetric coefficients (γ) are positive with a slightly higher sensitivity of the conditional
volatility to lagged negative returns in Indonesia. The skew parameters (λ) are higher than
unity in all but only Singapore, signaling positive conditional skewness in the univariate
conditional distribution. The degree of freedom (ν) ranges from 3.367 to 8.403, indicating
fat tails in the bank stock returns. The time-varying sensitivity of the bank stock returns
6For country with more than one stock index, we employ the index with greater marketcapitalization. We also repeat our analysis with the MSCI representative index for each countryas a robustness check. The result is relatively similar to the use of domestic index and availablefrom the authors upon request.
7

to the market index is highly persistent in all markets as the autoregressive coefficient βC,i
are ranging from 0.924 to 0.965. The median of the average conditional beta reported
the last row confirms this finding. Except for only Philippines (βi,t = 0.558), banks are
notably sensitive to the aggregate market dynamics with highest level being Thailand
(βi,t = 1.186).
3.3 SRISK dynamics and rankings
In this section, we analyse the dynamics and rankings of systemic risks between countries
and across banks within each market. Table 4 summarises the statistics of the main
ingredients in the SRISK measures as in (3), including the market capitalization, financial
leverage, LRMES and SRISK estimates. Panel A reports the median of the mean over time
of the systemic risk measures and its components across banks, while Panel B presents
the statistics as of December 2018. The listed banks in Singapore are the largest firms
on average, whereas Vietnamese banks have the smallest market capitalization. Figure
2 displays the evolution of the total market capitalization of the banking sector in all
countries over the sample period. While the bank stocks have plummeted to the lowest
level during the financial crisis in all countries, there is a significant upward trend in the
post-crisis period.
Two key ingredients in the SRISK measures as in Eq. (3) is the financial leverage and
LRMES estimates. The leverage of Vietnamese banks is highest on average, at 11.386,
whereas the lowest average leverage is at 6.670 in Philippines banking sector. The level of
leverage in the most recent period is higher than the average in all countries. Vietnamese
banks continue to have the highest financial leverage, at 15.950, while the leverages of
banks in Thailand and Malaysia are relatively moderate, at 8.862 and 8.819, respectively.
Figure 3 displays the dynamic of average financial leverage across banks in each country
over the full sample. Except only for Vietnam because of shorter historical data, the
financial leverage in the banking industry raised dramatically and peaked in mid-2009.
Since we define the financial leverage as the ratio of the quasi-market value of the bank
over its market value of equity, this observation is largely driven by severe drawdowns of
the market price of bank stocks. The dynamics of leverage post-crisis between countries
are not identical after the crisis. Leverage decreased substantially in all countries after the
crisis and remains at a relatively low level in Malaysia, Philippines and Thailand to the
current levels. In Indonesia, Singapore and Vietnam, in contrast, leverage gradually built
up after 2010 and reached the second highest point around 2017.
The LRMES estimates indicate higher average sensitivity to a shock in the aggregate
market in Thailand and Vietnam than other countries in the sample. A market decline of
relative 40% in the market index implies an average expected losses of 64.7% and 54.7%
in Thailand and Vietnam, respectively. Banks in Malaysia and Philippines have the least
sensitivity to a shock in the aggregate market. In particular, the expected losses of banks
8

in Malaysia to a 40% semiannual decline in the market index is only 22.9% on average and
18.4% as of December 2018. Figure 4 shows significant variations in the average LRMES
of the banking sector in all countries. As shown in Table 4, the sensitivity of bank stocks
to the market index is highest in Thailand, reaching as high as an average expected loss
of 70% in 2007 before gradually decreasing to the current level of 53.7%. In contrast, the
LRMES of the banking sector in Malaysia ranges from only 17% to 27% over the sample
period. We also observe a significant increase in the sensitivity of banking stocks to the
market index in Vietnam in the most recent period. By the end of 2018, their LRMES is
even higher than that of Thailand, at 58.2%, implying notable risks to the banking sectors
in case of a shock hitting the equity market.
The SRISK measures for each country are reported in the last row of each panel. In
absolute term, Singapore has the largest systemic risk both on average over the sample
period and as of December 2018, mainly due to the relatively bigger size of their listed
banks compared to other countries in the sample. The combined effects of financial leverage
and LRMES to systemic risks can be clearly illustrated in the cases of Thailand and
Malaysia. Both countries have similar level of market capitalization and fragility (reflected
by the financial leverage). However, Thailand has the second largest systemic risk on
average, at 847.011 million $, whereas Malaysia would have suffered to the capital shortfall
of only 134.862 million $ in the case of aggregate market decline due to their relatively
low level of sensitivity to the equity market trends. Figure 5 shows the SRISK dynamics
in each country. The systemic risk of banking sectors increased significantly in the recent
financial crisis. However, except only for Philippines, the current level of expected capital
shortfalls are at par or even higher. In particular, the systemic risk of Vietnamese banks is
peaking at their highest level, at 6620.717 million $ as of December 2018. We notice that
while the exposure of banks to the aggregate markets during the crisis is mainly driven
by the high leverage, the current systemic risk is fuelled by a rapid growth of market
capitalization.
When SRISK is high, there is possibility of distress in the real economy since the
availability of credit is constrained. As a result, both the regulator and the risk manager
would be willing to strengthen the bank balance sheet to reduce their systemic risk
exposure. Engle and Ruan (2019) discuss several ways in which we can measure the
severity of systemic risk, depending on how the bank wants to reduce their exposure. One
possibility is that the bank can simply wait for the stock market upwards to increase their
market value, otherwise they appeal for a bailout. In this case, a systemic risk event
would lead to a loss to the government in order to rescue the stressed banks and a natural
measure of severity is SRISK/GDP , where GDP is the country gross domestic product
estimate. Another strategy is that the bank could sell existing assets to reduce their debt
and leverage. This scenario would lead to the so-called ’leverage spiral’, which results to
assets sales at price blow their fundamental values and a capital loss to the banks. The
severity of the sales depends on the level of regulatory capital ratio at which the bank
9

needs to maintain. Engle and Ruan (2019) shows that the corresponding measure if the
bank follows this strategy is SRISK/(k × TA), where TA is the total asset and k is the
capital requirement ratio. Finally, the bank could raise their capital by selling new stocks,
which in turn leads to a loss to the bank shareholders by lowering the values of existing
shares. Thus, the severity measure is simply SRISK/MV .
Figure 6 shows that Singapore has the highest level of SRISK/GDP , followed by
Vietnam. These numbers mean the amount of taxpayer money to bail out the banks
of Singapore and Vietnam are significant, at about 17% and 11% of GDP in another
financial crisis, respectively. Figures 7 and 8 indicate that Vietnamese banks would have
been suffered the most severity if there were a shock to the equity market, followed by
Thailand. The ratio of SRISK to total assets is approximately 5% in Vietnam, significantly
higher than that of other countries. Since we apply the capital ratio k = 8%, the
Vietnamese banks would need to sell 5/8 (62.5%) of their total asset to reduce the SRISK
to zero. Such large asset sales would likely to trigger a “fire sale externality”, when a
large volume of asset is sold to an insufficient number of buyers, further depress asset
prices to well-below its fundamental values. If Vietnamese banks choose to raise capital
by selling new shares to the equity market, they would need to sell approximately 45% of
the current market capitalization to reduce the capital shortfalls. Selling this volume of
shares when the market is undertaking a shock would dramatically dampen the market
prices. Furthermore, it would produce a signaling effect to the market participants that
the bank is in trouble and escalate the negative impact on stock price.
Table 5 shows the ranking of the most systematically risky banks at the end of
our estimation sample.7 In each country, we report the share of individual banks to
the aggregate country SRISK (SRISK %) and the two measures of SRISK severity,
namely SRISK/(k×TA) and SRISK/MV . In Indonesia, Malaysia and Philippines, the
aggregate SRISK is mainly driven by one particular risky institution in the sector. For
example, the Metropolitan Bank and Trust Company contributes to 93% of the capital
shortfall of banking sector in Philippines as of December 2018. In Singapore, Thailand and
Vietnam, the contribution to the aggregate country SRISKs is roughly shared between the
top 5 banks (top 3 in Singapore) in the sector. Except only for Malaysia and Philippines,
the most systemically risky bank is not necessary the bank that is affected the most when
they need to sell assets or new shares to eliminate SRISK. For example, Saigon-Hanoi
Commercial Joint Stock Bank contributes only 14.9% to the aggregate SRISK in Vietnam.
However, this bank would not be able to reduce their SRISK to zero, even after selling all
of their asset or three times of their current market capitalization worth of shares to the
equity market.
7We report the top 5 banks with highest systemic risks as of December 2018, except only forSingapore, where we only have 3 banks in our sample.
10

3.4 SRISK determinants in ASEAN countries
We now identify the factors that determine the severity of bank systemic risks on the
ASEAN level and in each individual country. In particular, we follow Bostandzic and
Weiß (2018) and Buch et al. (2019) to regress proxies for the severity in bank systemic
risks on several bank and country-specific variables.
SRISKsi,j,t = αi + γt + βiXi,t−1 + βcMj,t + εi,j,t (12)
where SRISKsi,j,t is measure of the severity of bank systemic risk, SRISK/MV and
SRISK/TA, respectively. Xi,t−1 are the banks-specific variables, which are lagged by
one period to mitigate the potential problem of endogeneity with the dependent variables.
Mj,t are the country-specific variables, which account for the effects of macroeconomic
conditions in each country on the systemic risks of the banking sector. To account
for potential unobserved heterogeneity between banks and over time due to common
macroeconomic developments, we estimate the panel regression with bank-fixed (αi) and
time-fixed (γt) effects. Standard errors are clustered at the bank-level, similar to Buch
et al. (2019). Our base model consists of all 49 banks in 6 ASEAN countries, while we
also explore the determinants of systemic risk severity in each country separately.
3.4.1 Main independent variables
For the bank-specific variables, we first consider the bank’s size, which equals to the natural
logarithm of the bank’s asset ((Size). Large banks have more complex and interconnected
business models (Laeven et al. (2016)), thus they tend to respond more aggressively than
those of smaller banks in a prolonged market decline. Moreover, the “too-big-to-fail”
hypothesis suggests that the managers of large banks would be more willing to take on
more risk in the presence of higher probability of government bailout in case of default
(Gandhi and Lustig (2015)). Consequently, we expect a positive relationship between
bank size and systemic risk, which implies that larger banks are more subject to systemic
risk.
The next potential driver of systemic risk is the difference in the bank’s business
models. To this end, we consider two proxies, which are the contribution of non-interest
income to the bank’s total income (Non − interest/Inc.) and the ratio of bank loans to
the total bank asset (Loan/TA). Lower contribution of non-interest income and a higher
percentage of loans in the bank’s total asset is indicatives of a more traditional banking
model. Previous studies have not yet reach a consensus on the effect of bank business
models to their systemic risk. One the one hand, DeYoung and Torna (2013) finds
that banks engage in risky non-traditional activities tend to take additional risks on the
traditional activities, which increase their probability of default. Likewise, Brunnermeier
et al. (2019) show that non-interest income positively relates to the bank’s tail risk and
11
interconnectedness risk. On the other hand, a higher share of non-interest income can
reduce the bank’s exposure to the systemic risk in the traditional market, thanks to a
more diversified portfolio. Furthermore, banks that supply higher credit to the market
are more exposed to the credit contagion (Jorion and Zhang, 2007). Buch et al. (2019)
recently explore that the relationship between non-interest income and bank’s systemic
risk is reversed between small and large banks. We further consider the quality of bank
loan’s portfolio as an indicator of the bank risk in their main business as proxied by the
ratio of loan loss provision to the net income (Loan prov./NI ). Allen et al. (2012) explore
that banks with lower quality in their loan portfolios are more exposed to the potential
spillover from interconnected banks. Therefore, we expect a positive impact of higher loan
loss provision to the bank’s systemic risks, similar to the recent findings of Buch et al.
(2019) and Brunnermeier et al. (2019).
We also explore the impacts of bank profitability, proxied by bank return on asset
(ROA), to the systemic risk, similar to Bostandzic and Weiß (2018) and Silva-Buston
(2019). The relationship between bank profitability to the bank systemic risk remains
inconclusive. While more profitable banks would be more resilient to the shocks in the
market, high profitability would also be a result of higher risk-taking behaviour and more
market power (DeJonghe, 2010). Finally, we employ the bank charter value, proxied by
the ratio of market price to book value of bank stock (Market− to− Book). We expect
this proxy to be negatively related to the bank’s systemic risk since banks with greater
charter value have incentives to limit their risk-taking and increase their diversification to
insure against potential losses (Bostandzic and Weiß, 2018).
In addition to the bank-specific characteristics, we also control for several country
variables to capture the potential effects of the financial development, banking sector
environment and macroeconomic condition on the bank’s systemic risk. For example,
banks operating in a more developed financial system may have a higher level of
interconnectedness, which could increase their systemic risks. In contrast, a more
developed financial markets would also provide better opportunities for banks to diversify
their portfolio and assess to liquidity and funding. To proxy for the financial development
and equity market condition, we consider the stock market capitalization to GDP
(Stockcap./GDP ) and the annualized volatility of the stock market (V ol(Stock)). For
the banking environment, we employ the market concentration in the banking sector
(Bankconcentration) and the banking system’s z-score (Bankz − score). Silva-Buston
(2019) argues that banking competition would increase the stability in banking system by
reducing the excess commonality between banks. Moreover, banks may be willing to take
excessive risks when they are facing a higher probability of insolvency (Laeven and Levine,
2009). Finally, we use the GDP growth (GDPgrowth) as a standard macroeconomic
control variable. All of these variables are sourced from World Bank’s World Development
Indicator and Global Financial Development Database.
12

3.4.2 Empirical results
Table 6 reports the results of our panel regression for the determinants of bank’s SRISK.
The full sample results with 49 listed banks in 6 ASEAN countries are presented in Column
(1), while the results for each country are shown in Columns (2) - (7). Similar to Laeven
et al. (2016), we find that bank size has a positive and significant effect to the bank’s
systemic risk. This finding indicates that larger banks in ASEAN countries, on average,
have higher exposure to the financial distress since one standard deviation increase in the
bank size increases the SRISK by 0.125 billion $. For individual countries, however, we
do not find consistent effect as only the coefficients of bank size in Singapore, Thailand
and Vietnam are statistically significant.
Next, we find that the relationship between bank’s business models and systemic
risk varies considerably between countries. The coefficients of non-interest income on the
bank’s systemic risk is positive but not statistically significant in the full-sample regression.
The regression results in columns (2)-(7) reveal that the relationship is actually reversed
in Indonesia and Malaysia and signify that a higher share of income from non-traditional
activities would reduce the bank’s SRISK in these countries. The ratio of loans to total
assets enters the full-sample regression with negative sign. However, the coefficient is not
statistically significant and this effect varies considerably between countries. While banks
with a higher share of loans in their total assets have lower systemic risk in Singapore,
the corresponding effect is reversed in Vietnam. Not surprisingly, the level of loan loss
provision has negative impacts on the bank’s SRISK, even though the coefficient is not
statistically significant. The results in Columns (2) - (7) signify that this effect is mainly
driven by banks in Indonesian and Philippines.
We explore evidence that the profitability of ASEAN banks generally reduces the
bank’s systemic risk. This effect is statistically significant in Indonesia, Philippines
and Vietnam, implying that profitability helps to shield banks in these countries from
adverse effects in the period of financial distress. In Singapore, however, we find a
significant relationship between ROA and bank’s SRISK, similar to the results of Buch
et al. (2019). Since the sample of Singapore includes three banks of approximately
similar size, this observation might indicate that higher profitability in Singapore is a
sign of higher risk-taking activities as claimed in DeJonghe (2010). The coefficients of
the Market − to − Book variable are consistently negative and significant in the full
sample and across countries, similar to the finding of Lin et al. (2018) for Taiwanese
financial institutions. This finding indicates that indicate that banks with greater charter
value would reduce the incentives of their managers to take additional risks and be less
exposed to the financial instability. Finally, the systemic risk of banks is also related to the
financial market development and the condition of banking system. We find that countries
with higher development in the stock market, as proxied by the ratio of stock market
capitalisation to GDP, would economically and significantly reduce the bank’s systemic
13

risk. This evidence may be result of higher diversification opportunities in funding and
liquidity for both banks and the overall economy. Moreover, as a higher Z-score indicates
lower default risk, the bank’s systemic risk would be reduced when the overall default risk
of the banking sector decreases.
We also explore the determinants of the severity of the bank’s systemic risk in tables
7 and 8. In this article, we focus on the two measures of the severity of systemic risks,
namely SRISK/GDP and SRISK/TA, respectively. While raising capital by selling new
shares is feasible in developed markets, it is relatively more challenging in the case of
emerging stock markets due to higher market frictions. Moreover, this strategy depends
significantly on the regulatory requirements between countries. In contrast, the use of
GDP provides a natural comparison of banking systemic risks between countries under
consideration and selling assets to reduce required capital is the most common approach,
particularly during stressed periods (Engle and Ruan, 2019).8
The regression results exhibit similar findings to the main analysis. On average, the
economy faces higher losses when the systemic risk is originated from bigger banks and
banks with lower quality in the loan portfolio, whereas increasing the bank’s profitability
or market-to-book ratio reduces the loss of GDP for a potential bailout. Similarly, bank
size would significantly increase the severity of asset sales to reduce the bank’s systemic
risk, whereas higher ROA and bank’s charter value would produce the reversed effect.
Again, we do not find consistent relations between the bank’s specific variables to the
severity of systemic risk across ASEAN countries. For example, while banks in Singapore
with higher shares of loans to total assets significantly contribute to the lower severity
of systemic risk, the opposite relationship is found in the Vietnamese banks. Moreover,
a higher level of loan loss provisions in Thailand and Vietnam leads to the lower loss to
GDP, although the coefficient is only negatively significant in Thailand.
4 DISCUSSIONS
Our analysis provides relevant information on the systemic risk for the supervisors in
the ASEAN banking sectors. First, we explore significant dynamics in the systemic
risk in banking sector of the six ASEAN countries. In particular, we find that, except
for Philippines, the level of systemic risk is currently higher than that at the global
financial crisis during 2007-2008. This trend is mainly driven by the combined effect of
increasing level of bank’s market values and sensitivity to the market index as measured
by the LRMES. Higher capital shortfalls of financial institutions would lead to adverse
fundamental shocks in the economy (Giglio et al., 2016), provides early warning signals of
distress in real activity (Brownlees and Engle, 2017) and increase the probability of future
8The panel regression for SRISK/MV yields similar results and is available from the authorsupon request.
14

crisis (Engle and Ruan, 2019). Thus, this finding would provide warnings to the regulators
to strengthen their macroprudential policy on the banking sector.
Second, the structure of the systemic risk is considerably different between the six
countries. In Indonesia, Malaysia and Philippines, the aggregate systemic risk is mainly
driven by one particular bank, while the contributions are approximately similar between
top risky banks in the remaining countries. Most importantly, we note that the rankings
of banks regarding the severity of systemic risk as scaled by their total asset and market
capitalisation are generally different to the level of SRISK. This observation indicates that
the supervisors should not only pay higher attention to the banks with the highest SRISK,
but also the banks which would likely be suffered the most losses during financial distress.
Third, we observe strong evidence that bank size is positively related to the systemic
risk. This is in line previous studies (see, e.g., Laeven et al., 2016; Buch et al., 2019; Silva-
Buston, 2019) and supports the too-big-to-fail paradigm. Thus, this finding advocates
the incentive to impose a capital surcharge on large banks as documented in the Basel
III regulations. We also find that bank’s systemic risks are generally associated with
banks that have more traditional business models, lower quality in their loan portfolios,
less profitable and with lower market-to-book values. However, except for the market-to-
book ratio, these effects are not consistent between ASEAN countries. This observation
reveals the heterogeneity between ASEAN countries and their banking sectors due to
their fundamental differences in economic development, institutional environment and
regulatory framework (Ha et al., 2019; Wu, 2019). Although the region has been pushing
to higher financial integration in recent years, our empirical results imply that, at least
to the systemic risk, the banking supervisors would still need to account for idiosyncratic
characteristics of their banking sector in designing relevant regulatory frameworks.
5 CONCLUSION
We provide the first study on the systemic risk of the banking sectors in ASEAN-6
countries. It is important for the regional regulators since the bank-based financial
structures of these countries are associated with higher systemic risk and potentially more
severe distress to the real economy. In particular, we employ the popular SRISK measure
of Brownlees and Engle (2017) to investigate the dynamics, rankings and determinants
of systemic risk for 49 listed banks in the region. The main advantage of SRISK is
the use of both market data and balance sheet information to construct a market-based
measurement. This approach allows SRISK to provide a timely estimate of systemic risk
and explicitly capture the effect of size and leverage on the expected capital shortfall of a
financial firm, given the market is in long-run distress.
Our empirical evidence provides several policy implications to the regional policy-
makers. The increasing trend of systemic risk in the region calls for advancements in
the macroprudential policy to maintain the stability of the regional financial system. In
15

particular, we find evidence supporting the too-big-to-fail paradigm, thus, we advocate
the use of a capital surcharge on the systemically important financial institutions as
documented in the Basel III regulations. However, we note that the local banking
supervisors should account for idiosyncratic characteristics of their banking sector in
designing the relevant macroprudential policy given the fundamental difference in economic
development and institutional environment between the ASEAN-6 countries.
16

References
Acharya, V. V., Engle, R. F., and Richardson, M. (2012). Capital Shortfall: A New
Approach to Ranking and Regulating Systemic Risks. American Economic Review,
102(3):59–64.
Acharya, V. V., Pedersen, L. H., Philippon, T., and Richardson, M. (2017). Measuring
systemic risk. Review of Financial Studies, 30(1):2–47.
Acharya, V. V. and Thakor, A. V. (2016). The dark side of liquidity creation: Leverage
and systemic risk. Journal of Financial Intermediation, 28:4–21.
Adrian, T. and Brunnermeier, M. K. (2016). CoVaR. American Economic Review,
106(7):1705–1741.
Allen, F., Babus, A., and Carletti, E. (2012). Asset commonality, debt maturity and
systemic risk. Journal of Financial Economics, 104(3):519–534.
Bats, J. V. and Houben, A. C. (2020). Bank-based versus market-based financ-
ing:Implications for systemic risk. Journal of Banking & Finance, 114:105776.
Benoit, S., Colliard, J. E., Hurlin, C., and Perignon, C. (2017). Where the risks lie: A
survey on systemic risk. Review of Finance, 21(1):109–152.
Bisias, D., Flood, M., Lo, A. W., and Valavanis, S. (2012). A Survey of Systemic Risk
Analytics. Annual Review of Financial Economics, 4(1):255–296.
Bonaccolto, G., Caporin, M., and Paterlini, S. (2019). Decomposing and backtesting a
flexible specification for CoVaR. Journal of Banking & Finance, 108:105659.
Bostandzic, D. and Weiß, G. N. (2018). Why do some banks contribute more to global
systemic risk? Journal of Financial Intermediation, 35(March):17–40.
Brownlees, C., Chabot, B., Ghysels, E., and Kurz, C. (2020). Back to the Future:
Backtesting Systemic Risk Measures during Historical Bank Runs and the Great
Depression. Journal of Banking and Finance, page 105736.
Brownlees, C. and Engle, R. F. (2017). SRISK: A conditional capital shortfall measure of
systemic risk. Review of Financial Studies, 30(1):48–79.
Brunnermeier, M. K., Dong, G., and Palia, D. (2019). Banks ’ Non-Interest Income and
Systemic Risk. (January).
Buch, C. M., Krause, T., and Tonzer, L. (2019). Drivers of systemic risk: Do national and
European perspectives differ? Journal of International Money and Finance, 91:160–176.
17

Colletaz, G., Levieuge, G., and Popescu, A. (2018). Monetary policy and long-run systemic
risk-taking. Journal of Economic Dynamics and Control, 86:165–184.
DeJonghe, O. (2010). Back to the basics in banking? A micro-analysis of banking system
stability. Journal of Financial Intermediation, 19(3):387–417.
DeYoung, R. and Torna, G. (2013). Nontraditional banking activities and bank failures
during the financial crisis. Journal of Financial Intermediation, 22(3):397–421.
Engle, R. F. (2002). Dynamic Conditional Correlation: A Simple Class of Multivariate
Generalized Autoregressive Conditional Heteroskedasticity Models. Journal of Business
and Economic Statistics, 20(3):339–350.
Engle, R. F. (2018). Systemic Risk 10 Years Later. Annual Review of Financial Economics,
10(1):125–152.
Engle, R. F., Jondeau, E., and Rockinger, M. (2015). Systemic risk in Europe. Review of
Finance, 19(1):145–190.
Engle, R. F. and Ruan, T. (2019). How Much SRISK Is Too Much?
Gandhi, P. and Lustig, H. (2015). Size anomalies in US bank stock returns. Journal of
Finance, 70(2):733–768.
Giglio, S., Kelly, B., and Pruitt, S. (2016). Systemic risk and the macroeconomy: An
empirical evaluation. Journal of Financial Economics, 119(3):457–471.
Girardi, G. and Tolga Ergun, A. (2013). Systemic risk measurement: Multivariate GARCH
estimation of CoVaR. Journal of Banking and Finance, 37(8):3169–3180.
Glosten, L. R., Jagannathan, R., and Runkle, D. E. (1993). On the relation between the
expected value and the volatility of the nominal excess return on stocks. Journal of
Finance, 48(5):1779–1801.
Ha, D., Gillet, P., Le, P., and Vo, D.-T. (2019). Banking integration in ASEAN-6: An
empirical investigation. Economic Modelling, (September).
Jorion, P. and Zhang, G. (2007). Good and bad credit contagion: Evidence from credit
default swaps. Journal of Financial Economics, 84(3):860–883.
Laeven, L. and Levine, R. (2009). Bank governance, regulation and risk taking. Journal
of Financial Economics, 93(2):259–275.
Laeven, L., Ratnovski, L., and Tong, H. (2016). Bank size, capital, and systemic risk:
Some international evidence. Journal of Banking and Finance, 69:S25–S34.
18

Lin, E. M., Sun, E. W., and Yu, M. T. (2018). Systemic risk, financial markets, and
performance of financial institutions. Annals of Operations Research, 262(2):579–603.
Meuleman, E. and Vander Vennet, R. (2020). Macroprudential policy and bank systemic
risk. Journal of Financial Stability, 47:100724.
Reinhart, C. M. and Rogoff, K. S. (2011). From financial crash to debt crisis. American
Economic Review, 101(5):1676–1706.
Schularick, M. and Taylor, A. M. (2012). Credit booms gone bust: Monetary
policy, leverage cycles, and financial crises, 1870-2008. American Economic Review,
102(2):1029–1061.
Silva-Buston, C. (2019). Systemic risk and competition revisited. Journal of Banking and
Finance, 101:188–205.
Varotto, S. and Zhao, L. (2018). Systemic risk and bank size. Journal of International
Money and Finance, 82:45–70.
Wu, F. (2019). Stock market integration in East and Southeast Asia: The role of global
factors. International Review of Financial Analysis.
19

Figure 1 Cumulative Returns by Country
This figure displays the cumulative performances of the stock index (solid line) and the aggregate bank returns (dashed line) for each country in thesample.
Jan 02 2001 Jan 03 2005 Jan 01 2009 Jan 01 2013 Jan 02 2017
Indonesia 2001−01−02 / 2019−04−09
5
10
15
5
10
15
Jan 03 2000 Jan 01 2004 Jan 01 2008 Jan 02 2012 Jan 01 2016
Malaysia 2000−01−03 / 2019−04−09
1.0
1.5
2.0
2.5
3.0
3.5
4.0
1.0
1.5
2.0
2.5
3.0
3.5
4.0
Jan 03 2000 Jan 01 2004 Jan 01 2008 Jan 02 2012 Jan 01 2016
Philippines 2000−01−03 / 2019−04−10
1
2
3
4
1
2
3
4
Jan 03 2000 Jan 01 2004 Jan 01 2008 Jan 02 2012 Jan 01 2016
Singapore 2000−01−03 / 2019−04−09
0.6
0.8
1.0
1.2
1.4
1.6
0.6
0.8
1.0
1.2
1.4
1.6
Jan 03 2000 Jan 01 2004 Jan 01 2008 Jan 02 2012 Jan 01 2016
Thailand 2000−01−03 / 2019−04−10
0.5
1.0
1.5
2.0
2.5
3.0
3.5
0.5
1.0
1.5
2.0
2.5
3.0
3.5
Apr 03 2007 Jan 01 2010 Jan 01 2013 Jan 01 2016 Jan 01 2019
Vietnam 2007−04−03 / 2019−04−09
0.4
0.6
0.8
1.0
0.4
0.6
0.8
1.0
20

Figure 2 Market Capitalization
Mar 2006 Mar 2008 Mar 2010 Mar 2012 Mar 2014 Mar 2016 Mar 2018
Indonesia 2006−03−30 / 2018−12−30
20
40
60
80
100
120
20
40
60
80
100
120
Mar 2006 Mar 2008 Mar 2010 Mar 2012 Mar 2014 Mar 2016 Mar 2018
Malaysia 2006−03−30 / 2018−12−30
30
40
50
60
70
80
90
30
40
50
60
70
80
90
Mar 2006 Mar 2008 Mar 2010 Mar 2012 Mar 2014 Mar 2016 Mar 2018
Philippines 2006−03−30 / 2018−12−30
10
15
20
25
30
35
10
15
20
25
30
35
Mar 2006 Mar 2008 Mar 2010 Mar 2012 Mar 2014 Mar 2016 Mar 2018
Singapore 2006−03−30 / 2018−12−30
40
60
80
100
120
40
60
80
100
120
Mar 2006 Mar 2008 Mar 2010 Mar 2012 Mar 2014 Mar 2016 Mar 2018
Thailand 2006−03−30 / 2018−12−30
20
30
40
50
60
70
80
20
30
40
50
60
70
80
Mar 2006 Mar 2008 Mar 2010 Mar 2012 Mar 2014 Mar 2016 Mar 2018
Vietnam 2006−03−30 / 2018−12−30
10
12
14
16
18
20
10
12
14
16
18
20
21

Figure 3 Financial Leverage by Country
This figure displays the average financial leverage of banks in each country in the sample.
Mar 2006 Mar 2008 Mar 2010 Mar 2012 Mar 2014 Mar 2016 Mar 2018
Indonesia 2006−03−30 / 2018−12−30
6
8
10
12
6
8
10
12
Mar 2006 Mar 2008 Mar 2010 Mar 2012 Mar 2014 Mar 2016 Mar 2018
Malaysia 2006−03−30 / 2018−12−30
8
10
12
14
16
8
10
12
14
16
Mar 2006 Mar 2008 Mar 2010 Mar 2012 Mar 2014 Mar 2016 Mar 2018
Philippines 2006−03−30 / 2018−12−30
6
8
10
12
14
6
8
10
12
14
Mar 2006 Mar 2008 Mar 2010 Mar 2012 Mar 2014 Mar 2016 Mar 2018
Singapore 2006−03−30 / 2018−12−30
8
10
12
8
10
12
Mar 2006 Mar 2008 Mar 2010 Mar 2012 Mar 2014 Mar 2016 Mar 2018
Thailand 2006−03−30 / 2018−12−30
8
10
12
14
16
18
20
8
10
12
14
16
18
20
Mar 2006 Mar 2008 Mar 2010 Mar 2012 Mar 2014 Mar 2016 Mar 2018
Vietnam 2006−03−30 / 2018−12−30
10
12
14
16
18
10
12
14
16
18
22
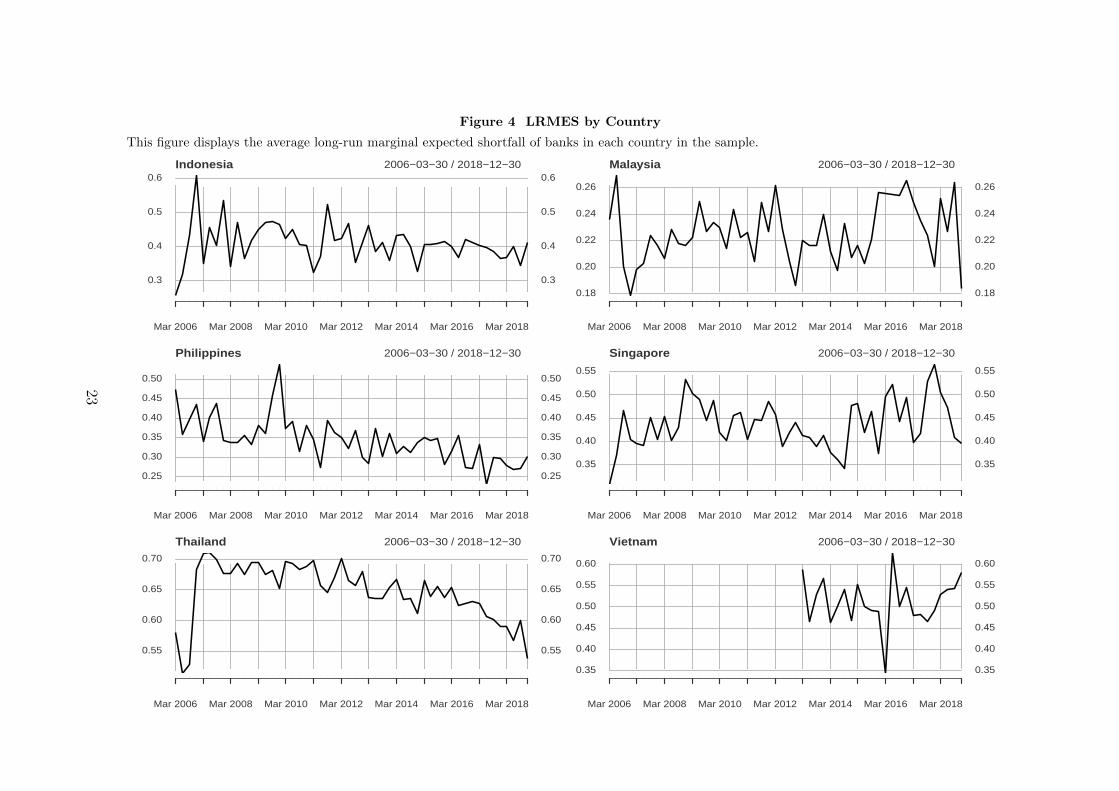
Figure 4 LRMES by Country
This figure displays the average long-run marginal expected shortfall of banks in each country in the sample.
Mar 2006 Mar 2008 Mar 2010 Mar 2012 Mar 2014 Mar 2016 Mar 2018
Indonesia 2006−03−30 / 2018−12−30
0.3
0.4
0.5
0.6
0.3
0.4
0.5
0.6
Mar 2006 Mar 2008 Mar 2010 Mar 2012 Mar 2014 Mar 2016 Mar 2018
Malaysia 2006−03−30 / 2018−12−30
0.18
0.20
0.22
0.24
0.26
0.18
0.20
0.22
0.24
0.26
Mar 2006 Mar 2008 Mar 2010 Mar 2012 Mar 2014 Mar 2016 Mar 2018
Philippines 2006−03−30 / 2018−12−30
0.25
0.30
0.35
0.40
0.45
0.50
0.25
0.30
0.35
0.40
0.45
0.50
Mar 2006 Mar 2008 Mar 2010 Mar 2012 Mar 2014 Mar 2016 Mar 2018
Singapore 2006−03−30 / 2018−12−30
0.35
0.40
0.45
0.50
0.55
0.35
0.40
0.45
0.50
0.55
Mar 2006 Mar 2008 Mar 2010 Mar 2012 Mar 2014 Mar 2016 Mar 2018
Thailand 2006−03−30 / 2018−12−30
0.55
0.60
0.65
0.70
0.55
0.60
0.65
0.70
Mar 2006 Mar 2008 Mar 2010 Mar 2012 Mar 2014 Mar 2016 Mar 2018
Vietnam 2006−03−30 / 2018−12−30
0.35
0.40
0.45
0.50
0.55
0.60
0.35
0.40
0.45
0.50
0.55
0.60
23

Figure 5 Systemic Risk by Country (billion $)
This figure displays the aggregate SRISK in billion $ for each country in the sample
Mar 2006 Mar 2008 Mar 2010 Mar 2012 Mar 2014 Mar 2016 Mar 2018
Indonesia 2006−03−30 / 2018−12−30
1
2
3
4
1
2
3
4
Mar 2006 Mar 2008 Mar 2010 Mar 2012 Mar 2014 Mar 2016 Mar 2018
Malaysia 2006−03−30 / 2018−12−30
1
2
3
4
1
2
3
4
Mar 2006 Mar 2008 Mar 2010 Mar 2012 Mar 2014 Mar 2016 Mar 2018
Philippines 2006−03−30 / 2018−12−30
0.5
1.0
1.5
2.0
0.5
1.0
1.5
2.0
Mar 2006 Mar 2008 Mar 2010 Mar 2012 Mar 2014 Mar 2016 Mar 2018
Singapore 2006−03−30 / 2018−12−30
5
10
15
20
25
5
10
15
20
25
Mar 2006 Mar 2008 Mar 2010 Mar 2012 Mar 2014 Mar 2016 Mar 2018
Thailand 2006−03−30 / 2018−12−30
4
6
8
10
12
4
6
8
10
12
Mar 2006 Mar 2008 Mar 2010 Mar 2012 Mar 2014 Mar 2016 Mar 2018
Vietnam 2006−03−30 / 2018−12−30
2
3
4
5
6
2
3
4
5
6
24

Figure 6 SRISK/GDP rankings
0.00 0.05 0.10 0.15
Indonesia
Philippines
Malaysia
Thailand
Vietnam
Singapore
Cou
ntry
SRISK / GDP
25

Figure 7 SRISK/TA rankings
0.00 0.01 0.02 0.03 0.04
Malaysia
Philippines
Indonesia
Singapore
Thailand
Vietnam
Cou
ntry
SRISK / Total Assets
26

Figure 8 SRISK/MV rankings
0.0 0.1 0.2 0.3 0.4
Indonesia
Malaysia
Philippines
Singapore
Thailand
Vietnam
Cou
ntry
SRISK / Market Cap
27

Table 1 List of tickers and banks grouped by country
This table reports the list of tickers and name of banks grouped by country used in the SRISK analysis
Tickers Indonesia Tickers Philippines
BNBA Bank Bumi Arta BPI Bank of the Philippine IslandsPNBN Bank Pan Indonesia BDO BDO Unibank, Inc.INPC Bank Artha Graha Internasional CHIB China Banking CorporationBBKP Bank Bukopin MBT Metropolitan Bank & Trust CompanyBACA Bank Capital Indonesia PBC Philippine Bank of CommunicationsBDMN Bank Danamon Indonesia RCB Rizal Commercial Banking CorporationBBNI Bank Negara Indonesia (Persero) SECB Security Bank CorporationBNLI Bank Permata UBP Union Bank of the PhilippinesBBTN Bank Tabungan Negara (Persero) PNB Philippine National BankBVIC Bank Victoria InternationalBBRI Bank Rakyat Indonesia (Persero) Tickers Thailand
BMRI Bank Mandiri (Persero) TMB TMB BankBBCA Bank Central Asia TISCO TISCO Financial GroupBNGA Bank CIMB Niaga SCB The Siam Commercial BankBNII Bank Maybank Indonesia TCAP Thanachart Capital
KTB Krung Thai BankTickers Malaysia KKP Kiatnakin Bank
AMBANK AMMB Holding Berhad KBANK KasikornbankCIMB CIMB Group Holdings Berhad BBL Bangkok BankMAYBANK Malayan Banking Berhad BAY Bank of AyudhyaPBBANK Public Bank BerhadHLBANK Hong Leong Bank Tickers Vietnam
BIMB BIMB Holdings Berhad ACB Asia Commercial Joint Stock BankHLFG Hong Leong Financial Group CTG VietinBank
SHB Saigon-Hanoi Commercial Joint Stock BankTickers Singapore STB Saigon Thuong Tin Commercial Joint Stock Bank
D05 DBS Group Holdings Ltd EIB EximBankO39 Oversea-Chinese Banking Corporation VCB VietcombankU11 United Overseas Bank Limited
28

Table 2 Summary statistics of bank stock returns and country index returns
This table provides summary statistics of the bank stock returns and country index returns over the sample period.Column (1) presents the average statistics for the bank stock returns, whereas column (2) presents statistics for thecountry index returns. For each catergory, we report the average annualized return, annualized volatility, skewness,kurtosis and the average correlation between the aggregate index and bank stocks.
Indonesia Malaysia Philippines Singapore Thailand Vietnam(1) (2) (1) (2) (1) (2) (1) (2) (1) (2) (1) (2)
Ann. Return 0.084 0.145 0.066 0.035 0.028 0.066 0.022 0.014 0.036 0.062 -0.051 -0.005Ann. Volatility 0.285 0.207 0.148 0.127 0.176 0.202 0.219 0.179 0.281 0.204 0.294 0.223Skewness 0.116 -0.687 -0.244 -0.847 0.158 0.276 -0.050 -0.268 -0.243 -0.753 -0.039 -0.284Kurtosis 12.023 10.918 10.795 14.354 16.727 18.873 8.528 8.916 12.740 14.322 5.891 4.768Correlation 0.641 0.811 0.706 0.886 0.880 0.810
29
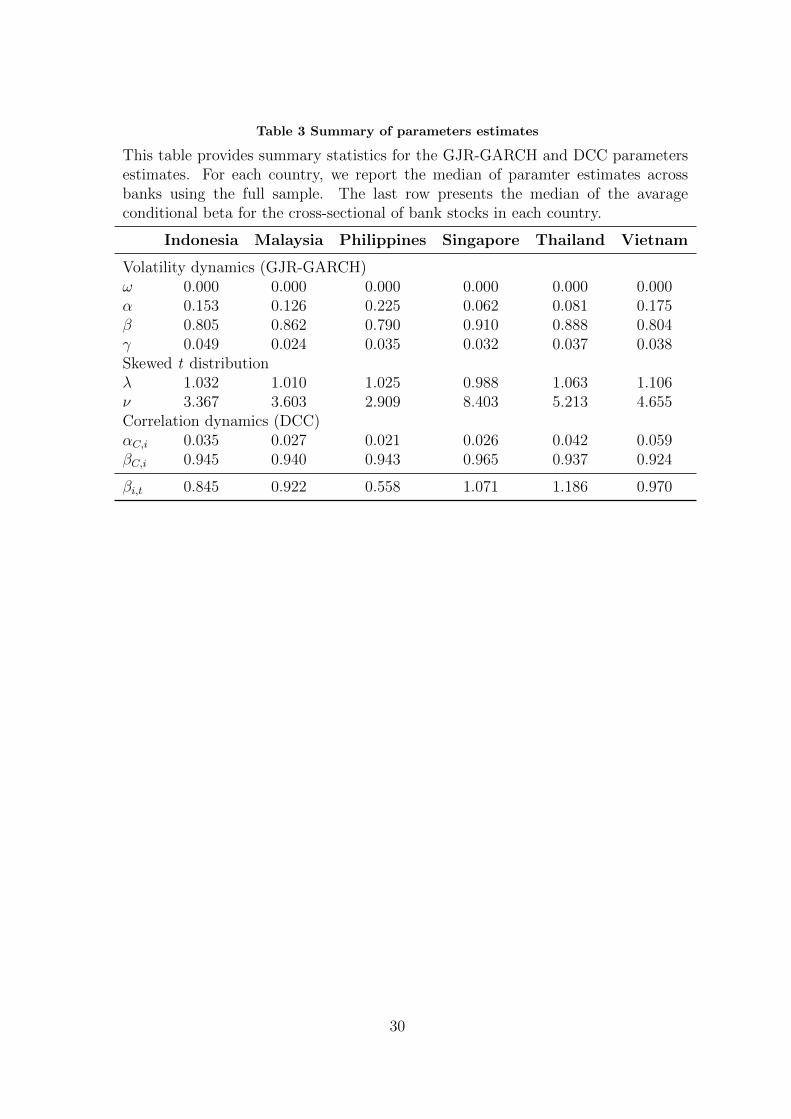
Table 3 Summary of parameters estimates
This table provides summary statistics for the GJR-GARCH and DCC parametersestimates. For each country, we report the median of paramter estimates acrossbanks using the full sample. The last row presents the median of the avarageconditional beta for the cross-sectional of bank stocks in each country.
Indonesia Malaysia Philippines Singapore Thailand Vietnam
Volatility dynamics (GJR-GARCH)ω 0.000 0.000 0.000 0.000 0.000 0.000α 0.153 0.126 0.225 0.062 0.081 0.175β 0.805 0.862 0.790 0.910 0.888 0.804γ 0.049 0.024 0.035 0.032 0.037 0.038Skewed t distributionλ 1.032 1.010 1.025 0.988 1.063 1.106ν 3.367 3.603 2.909 8.403 5.213 4.655Correlation dynamics (DCC)αC,i 0.035 0.027 0.021 0.026 0.042 0.059βC,i 0.945 0.940 0.943 0.965 0.937 0.924
βi,t 0.845 0.922 0.558 1.071 1.186 0.970
30

Table 4 Systemic Risk and its components
This table reports the median of the mean over time of the systemic risk measure and its componentsacross firms in each country. In each panel, I report the market capitalization, leverage ratio (definedas Li,t = Ai,t/Wi,t), the LRMES and the SRISK measure. Panel A presents the results computed overthe entire sample, whereas Panel B shows the statistics as of December 30, 2018. Market capitalizationand SRISK are reported in million USD.
Indonesia Malaysia Philippines Singapore Thailand Vietnam
Panel A: Entire sample
Market capitalization 1672.59 5363.60 1287.14 23276.76 5359.65 983.34934Leverage 8.480 7.538 6.670 8.786 7.667 11.386LRMES 0.408 0.229 0.326 0.430 0.647 0.547SRISK 72.801 134.862 59.590 3277.547 847.011 489.753
Panel B: As of December 2018
Market capitalization 8267.33 11668.26 3608.02 36229.22 7240.34 2505.35Leverage 10.733 8.819 9.454 9.529 8.682 15.950LRMES 0.412 0.184 0.302 0.421 0.537 0.582SRISK 3410.512 2644.923 1348.345 15761.215 9533.334 6620.717
31

Table 5 Systemic Risk rankings by country
This table reports the ranking of Top 5 banks with the highest systemic risk ineach country as of December 30, 2018. For each country, we report the SRISKcontribution in percentage (%) and the two measures of SRISK severity, namelySRISK/(TA*k) and SRISK/MV.
Rank SRISK (%) SRISK/TA SRISK/MV
Indonesia
1 BBNI 0.470 BVIC 0.621 BVIC 1.5312 BBTN 0.155 BBKP 0.619 BBKP 0.8753 BNGA 0.096 BBNI 0.548 INPC 0.8444 BBKP 0.091 BBTN 0.509 BBTN 0.4745 BNLI 0.059 INPC 0.459 BNBA 0.306
Malaysia
1 CIMB 0.596 CIMB 0.267 CIMB 0.2592 MAYBANK 0.263 AMBANK 0.200 AMBANK 0.1593 AMBANK 0.119 MAYBANK 0.078 MAYBANK 0.0554 HLFG 0.022 HLFG 0.022 HLFG 0.0235 PBBANK 0 PBBANK 0.000 PBBANK 0.000
Philippines
1 MBT 0.930 MBT 0.210 MBT 0.1372 PNB 0.070 PNB 0.040 PNB 0.0353 UBP 0.000 UBP 0.000 UBP 0.0004 SECB 0.000 SECB 0.000 SECB 0.0005 RCB 0.000 RCB 0.000 RCB 0.000
Singapore
1 D05 0.399 O39 0.398 O39 0.3502 O39 0.388 D05 0.348 D05 0.3053 U11 0.213 U11 0.263 U11 0.214
Thailand
1 KTB 0.256 TCAP 0.621 TCAP 0.9372 BBL 0.215 TMB 0.512 KTB 0.4133 BAY 0.167 KTB 0.475 TMB 0.3554 KBANK 0.147 BAY 0.442 BBL 0.2815 TCAP 0.120 BBL 0.364 BAY 0.226
Vietnam
1 CTG 0.305 SHB 0.859 SHB 3.5302 VCB 0.244 STB 0.755 STB 1.1773 STB 0.180 ACB 0.551 CTG 0.6054 SHB 0.149 CTG 0.447 ACB 0.5935 ACB 0.093 VCB 0.431 EIB 0.291
32

Table 6 Systemic Risk Determinants - SRISK
This table reports regression results of bank systemic risk on bank and country variables. The fullsample results with 49 listed banks in 6 ASEAN countries are presented in Column (1), while theresults for each country is shown in Columns (2) - (7). The dependent variable is the quarterlyaverage SRISK in billion $. Size is the logarithm of bank total assets. Non-interest/Inc. isthe ratio of non-interest income over total income. Loan/TA is the ratio of total loans to totalassets. Loan prov./NI corresponds to the proportion of loan-loss provision to net interest income.ROA is the return over total assets. Market-to-Book indicates the ratio of market value to bookvalue of bank’s equity. All the bank-level variables are lagged by one period and standardised.For the macroeconomic control variables, we include the ratio of stock market capitalization tototal GDP, the annualised volatility of stock market, the level of bank concentration, the bankingsystem Z-score and the GDP growth. The Panel regressions are estimated using bank and timefixed effect. Standard errors are clustered by bank and reported in parentheses.
Dependent variable:
SRISK
(1) (2) (3) (4) (5) (6) (7)
ASEAN Indonesia Malaysia Philippines Singapore Thailand Vietnam
Size 0.125∗∗ 0.021 0.329 0.007 1.083∗ 0.272∗∗∗ 0.292∗∗
(0.057) (0.037) (0.203) (0.025) (0.635) (0.065) (0.146)
Non-interest/Inc. 0.053 −0.016∗∗ −0.079∗∗ −0.004 −0.050 −0.011 0.033
(0.035) (0.007) (0.037) (0.005) (0.094) (0.055) (0.038)
Loan/TA −0.036 −0.013 −0.075 −0.003 −0.657∗∗∗ −0.056 0.157∗∗
(0.036) (0.011) (0.049) (0.013) (0.079) (0.043) (0.066)
Loan prov./Inc 0.034 0.022∗∗∗ 0.142 0.011∗∗ 0.128 −0.036 −0.047
(0.028) (0.008) (0.088) (0.005) (0.219) (0.034) (0.031)
ROA −0.027 −0.012∗∗ 0.001 −0.014∗ 0.224∗∗ −0.015 −0.199∗∗∗
(0.020) (0.006) (0.007) (0.008) (0.098) (0.044) (0.060)
Market-to-Book −0.110∗∗∗ −0.049∗∗∗ −0.198∗∗∗ −0.026∗∗∗ −0.670 −0.307∗∗∗ −0.064∗
(0.038) (0.016) (0.068) (0.009) (0.729) (0.045) (0.038)
Stock cap./GDP −2.517∗∗∗
(0.920)
Vol(Stock) −7.030
(5.730)
Bank concentration −0.083
(0.584)
Bank Z-score −0.252∗∗∗
(0.097)
GDP growth 1.096
(0.742)
Bank-fixed effects Yes Yes Yes Yes Yes Yes Yes
Time-fixed effects Yes Yes Yes Yes Yes Yes Yes
Observations 1,803 615 355 465 164 478 136
R2 0.235 0.115 0.169 0.061 0.157 0.396 0.269
Note: ∗p<0.1; ∗∗p<0.05; ∗∗∗p<0.01
33
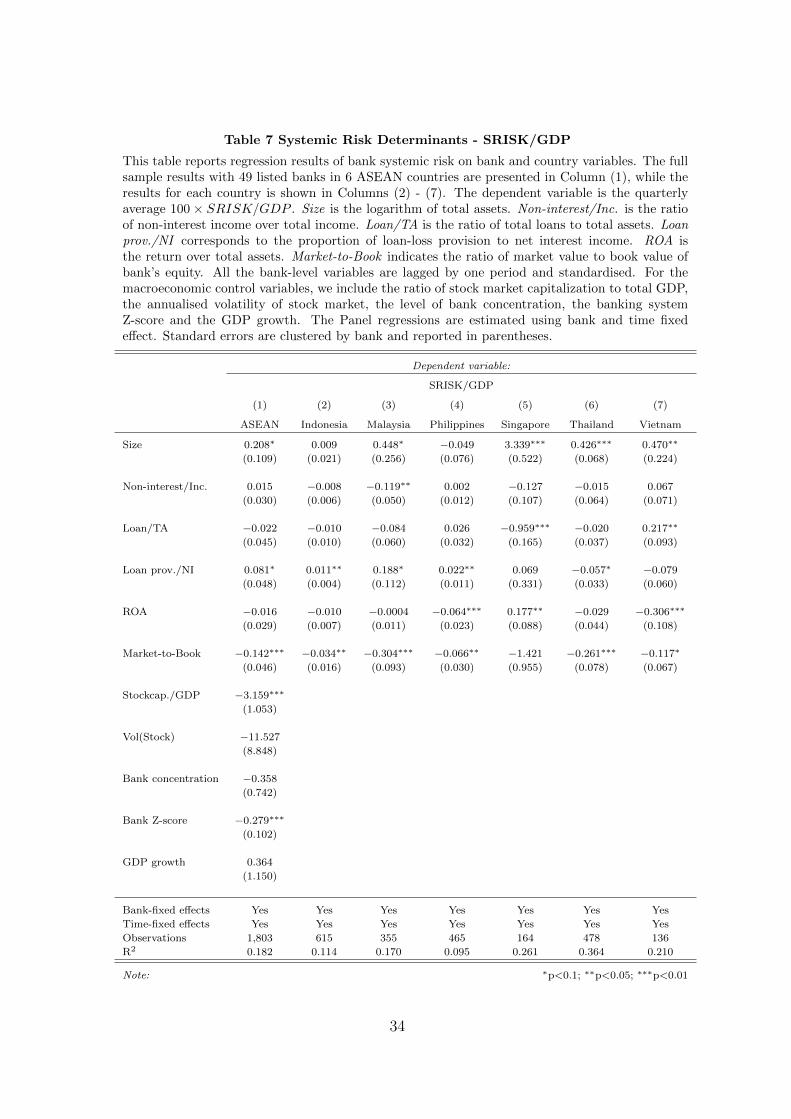
Table 7 Systemic Risk Determinants - SRISK/GDP
This table reports regression results of bank systemic risk on bank and country variables. The fullsample results with 49 listed banks in 6 ASEAN countries are presented in Column (1), while theresults for each country is shown in Columns (2) - (7). The dependent variable is the quarterlyaverage 100× SRISK/GDP . Size is the logarithm of total assets. Non-interest/Inc. is the ratioof non-interest income over total income. Loan/TA is the ratio of total loans to total assets. Loanprov./NI corresponds to the proportion of loan-loss provision to net interest income. ROA isthe return over total assets. Market-to-Book indicates the ratio of market value to book value ofbank’s equity. All the bank-level variables are lagged by one period and standardised. For themacroeconomic control variables, we include the ratio of stock market capitalization to total GDP,the annualised volatility of stock market, the level of bank concentration, the banking systemZ-score and the GDP growth. The Panel regressions are estimated using bank and time fixedeffect. Standard errors are clustered by bank and reported in parentheses.
Dependent variable:
SRISK/GDP
(1) (2) (3) (4) (5) (6) (7)
ASEAN Indonesia Malaysia Philippines Singapore Thailand Vietnam
Size 0.208∗ 0.009 0.448∗ −0.049 3.339∗∗∗ 0.426∗∗∗ 0.470∗∗
(0.109) (0.021) (0.256) (0.076) (0.522) (0.068) (0.224)
Non-interest/Inc. 0.015 −0.008 −0.119∗∗ 0.002 −0.127 −0.015 0.067
(0.030) (0.006) (0.050) (0.012) (0.107) (0.064) (0.071)
Loan/TA −0.022 −0.010 −0.084 0.026 −0.959∗∗∗ −0.020 0.217∗∗
(0.045) (0.010) (0.060) (0.032) (0.165) (0.037) (0.093)
Loan prov./NI 0.081∗ 0.011∗∗ 0.188∗ 0.022∗∗ 0.069 −0.057∗ −0.079
(0.048) (0.004) (0.112) (0.011) (0.331) (0.033) (0.060)
ROA −0.016 −0.010 −0.0004 −0.064∗∗∗ 0.177∗∗ −0.029 −0.306∗∗∗
(0.029) (0.007) (0.011) (0.023) (0.088) (0.044) (0.108)
Market-to-Book −0.142∗∗∗ −0.034∗∗ −0.304∗∗∗ −0.066∗∗ −1.421 −0.261∗∗∗ −0.117∗
(0.046) (0.016) (0.093) (0.030) (0.955) (0.078) (0.067)
Stockcap./GDP −3.159∗∗∗
(1.053)
Vol(Stock) −11.527
(8.848)
Bank concentration −0.358
(0.742)
Bank Z-score −0.279∗∗∗
(0.102)
GDP growth 0.364
(1.150)
Bank-fixed effects Yes Yes Yes Yes Yes Yes Yes
Time-fixed effects Yes Yes Yes Yes Yes Yes Yes
Observations 1,803 615 355 465 164 478 136
R2 0.182 0.114 0.170 0.095 0.261 0.364 0.210
Note: ∗p<0.1; ∗∗p<0.05; ∗∗∗p<0.01
34

Table 8 Systemic Risk Determinants - SRISK/(k × TAThis table reports regression results of bank systemic risk on bank and country variables. The fullsample results with 49 listed banks in 6 ASEAN countries are presented in Column (1), while theresults for each country is shown in Columns (2) - (7). The dependent variable is the quarterlyaverage SRISK/TA. Size is the logarithm of total assets. Non-interest/Inc. is the ratio ofnon-interest income over total income. Loan/TA is the ratio of total loans to total assets. Loanprov./NI corresponds to the proportion of loan-loss provision to net interest income. ROA isthe return over total assets. Market-to-Book indicates the ratio of market value to book value ofbank’s equity. All the bank-level variables are lagged by one period and standardised. For themacroeconomic control variables, we include the ratio of stock market capitalization to total GDP,the annualised volatility of stock market, the level of bank concentration, the banking systemZ-score and the GDP growth. The Panel regressions are estimated using bank and time fixedeffect. Standard errors are clustered by bank and reported in parentheses.
Dependent variable:
SRISK/(k × TA
(1) (2) (3) (4) (5) (6) (7)
ASEAN Indonesia Malaysia Philippines Singapore Thailand Vietnam
Size 0.050∗∗ 0.027 0.023 −0.041 0.094∗∗∗ 0.079∗∗∗ 0.070∗∗
(0.021) (0.037) (0.029) (0.034) (0.023) (0.024) (0.033)
Non-interest/Inc. 0.002 −0.006 −0.006 0.013∗ −0.004 −0.003 0.014
(0.005) (0.006) (0.004) (0.008) (0.005) (0.011) (0.017)
Loan/TA 0.0003 0.002 −0.012∗ 0.018 −0.019∗∗∗ −0.014∗∗∗ −0.003
(0.005) (0.011) (0.007) (0.018) (0.005) (0.005) (0.019)
Loan prov./NI 0.003 0.009 0.007 0.004 0.003 −0.011 −0.013
(0.003) (0.006) (0.012) (0.005) (0.009) (0.007) (0.012)
ROA −0.018∗∗∗ −0.018∗∗ −0.006 −0.034∗∗∗ −0.001 −0.024∗∗ −0.067∗∗∗
(0.004) (0.007) (0.005) (0.005) (0.003) (0.011) (0.024)
Market-to-Book −0.058∗∗∗ −0.055∗∗∗ −0.052∗∗∗ −0.038∗∗∗ −0.057∗∗ −0.097∗∗∗ −0.057∗∗∗
(0.008) (0.014) (0.014) (0.012) (0.029) (0.013) (0.015)
Stock cap./GDP −0.188∗∗∗
(0.072)
Vol(Stock) −0.435
(0.772)
Bank concentration −0.068
(0.080)
Bank Z-score −0.011∗
(0.007)
GDP growth −0.065
(0.156)
Bank-fixed effects Yes Yes Yes Yes Yes Yes Yes
Time-fixed effects Yes Yes Yes Yes Yes Yes Yes
Observations 1,803 615 355 465 164 478 136
R2 0.286 0.163 0.212 0.119 0.282 0.572 0.303
Note: ∗p<0.1; ∗∗p<0.05; ∗∗∗p<0.01
35


![ASEAN + ME [ASEAN object traveler]](https://img.dokumen.tips/doc/110x75/568c534f1a28ab4916ba3e5d/asean-me-asean-object-traveler.jpg)