Embed Size (px)
Citation preview

Systemic decisions for more sustainable WEEE
(Waste Electrical and Electronic Equipment)
management in developing countries
Sandra Méndez Fajardo

ii

i
Systemic decisions for more sustainable WEEE
(Waste Electrical and Electronic Equipment)
management in developing countries
Doctoral thesis
To obtain the title of Doctor
At the Pontificia Universidad Javeriana
By
Sandra MÉNDEZ FAJARDO
Civil Engineer
Given in Bogotá, Colombia

ii
This doctoral thesis is approved by the director:
Prof. Rafael A. González
Pontificia Universidad Javeriana, Bogotá, Colombia
And co-advised by
Prof. Claudia R. Binder
Ecole Polytechnique Fédérale de Lausanne, Switzerland
Committee members:
Prof. Rafael A. González Pontificia Universidad Javeriana, Bogotá,
Colombia
Prof. University of
Prof. Universidad
Prof. Pontificia Universidad Javeriana, Bogotá,
Colombia

iii
This thesis is dedicated to my lovely Mother, Pili, whose love was my inspiration.
To Jaimito, whose love and companion were my motivation.

iv
Preface & Acknowledgements
Colombia, like all developing countries, has suffered the effects of an unsustainable global
development model. The evidence can be found not only in the Latin-American nation’s poverty
and social degradation, but also in the deterioration of the ecosystem and the pervasive air and
water pollution. Throughout my professional career, I have witnessed the deleterious effects of
uncontrolled generation and irresponsible disposal of solid waste, including Waste Electrical and
Electronic Equipment (WEEE). The lack of awareness, coupled with the rapid increase in
consumption of electronic devices, has transformed informal activities, such as recycling, into a
source of survival for thousands of people living in poverty. Working with communities has led
me to explore the concept of Integrated Solid Waste Management (ISWM) developed by George
Tchobanoglous, specifically via a systems approach that primarily focuses on waste management
processes. A systems approach, though, implies much more than processes; it requires taking into
account different dimensions, stakeholder interests and cause-effect circularity in the short-,
medium- and long-terms. Programs designed on the basis of the ISWM may include public
awareness and educational strategies; however, for the most part, these aspects have been
disjointed of other management elements or, worse yet, not been implemented.
There are several WEEE management guidelines focusing on the implementation of standardized
programs, infrastructure and technical solutions in developing countries. Nevertheless, identified
negative effects demonstrate that decisions regarding the design of policies and programs must be
improved. Decision-Enhancement Studios (DES) that include computer-based simulations as
technological tools help to strengthen the systemicity in such processes. In particular, the use of
agent-based models and simulation allow policy makers to understand the aggregated behavior of
individual decisions of agents on the whole system; for clarity, agents can be consumers,
producers or distributors of equipment. Their active participation also increases the knowledge of
the system. Likewise, trust among policy makers, which is directly tied to their motivation to
cooperated, can be improved using a DES.
This doctoral research has been supported by different organizations, professors, colleagues and
friends to which I am very grateful. Professor Rafael Gonzalez advised me throughout the entire
process, providing me with key ideas, as well as Systems Engineering tools and instruments to
develop the DES design and support the policies designed during the case studies. Professor
Claudia Binder helped me secure a grant from the DAAD (German Academic Exchange Service)
for a short-term stay at Ludwig-Maximilian University in Munich. Professor Binder also assisted
with training in model conceptualization and a framework to describe the contributions of my
thesis.
Special thanks go to Luis David Prieto, Luis Alberto Jaramillo and Daniel Ruiz for enabling the
process by which I obtained institutional and financial support from the Pontificia Universidad
Javeriana in Bogotá, Colombia; to Heinz Böni, for devoting many hours to the discussion of my
research, suggesting meaningful improvements and facilitating the process to receive support from
Empa (Swiss Federal Laboratory for Material Science and Technology in St Gallen, Switzerland)
v
and the WRF (World Resources Forum); to Empa for financing my two half-year internships and
trips through the SRI Project (Sustainable Recycling Industry). Also, I would like to thank all the
members of the CARE (Critical Materials and Resource Efficiency) group at Empa for sharing
their vast array of experiences in WEEE Management with me and for welcoming me during my
visits to Switzerland.
The success of this thesis would not have been possible without the support and continuous
participation of relevant actors in the Colombian WEEE Management system: Andrea López,
Angel Camacho and Edwin Camelo from the Ministerio de Ambiente y Desarrollo Sostenible;
Carlos Hernández from the Centro Nacional de Producción Más Limpia, CNPML (the National
Cleaner Production Center); Florencia Leal, Andrés Santamaría, Edgar Erazo, Wilson Contreras,
and collaborators from the Asociación de Industriales de Colombia - ANDI (the Industrial
Association of Colombia) and post-consumer programs. Luis Fernando Guerrero, Juan Fernando
Jaramillo and representatives of formal recyclers; María Cristina Camejo from the Federación
Nacional de Comerciantes - FENALCO (the National Federation of Traders); Heinz Böni
aforementioned and Daniel Ott, Swiss experts in WEEE Management who have helped strengthen
Colombian WEEE Management program since 2007, and Mathias Schluep of the WRF, who has
served as project manager of the SRI program since 2014.
The continuous support of “higher-ups” and colleagues at the Pontificia Universidad Javeriana was
fundamental: Luis Alfonso Castellanos S.J., Vice-President of Social Welfare; Javier Forero,
Director of the Campus Administration Office and his team; all the members of the University’s
Environmental Committee; and, Concepcion Romero and Rosmine Penagos, who supported me
with administrative procedures over the course of many semesters.
I was able to implement the agent-based model in NetLogo thanks to the support of the
aforementioned Claudia Binder aforementioned and Christian Neuwirth of LMU in Munich;
Christof Knoeri of ETH, Mohammad Amandi of KTH in Sweden, and Stefan Holm of the
University of Zurich.
I received never-ending inspiration and motivation from members of ELAPDIS (per its acronym
in Spanish), Professor Juan Lucena from the Colorado School of Mines, and Professor Markus
Schwaninger from the St. Gallen University in Switzerland.


i
Content
List of figures ................................................................................................................................................ iii
List of tables .................................................................................................................................................. iv
Acronyms ...................................................................................................................................................... vi
1 Introduction ......................................................................................................................................... 1
1.1 The concept of sustainability in solid waste management ..................................................... 1
1.2 WEEE Management in Developing Countries ...................................................................... 2
1.3 Statement of the Problem, Objectives and Research Questions ............................................ 7
1.4 Research Methodology and Contributions ............................................................................ 8
1.4.1 Research Philosophy ........................................................................................................................... 8
1.4.2 Research Strategy ................................................................................................................................ 8
1.4.3 Research Techniques ..........................................................................................................................10
1.4.4 Research Outline ................................................................................................................................12
2 Problematic situation: The unsustainable WEEE Management in Developing Countries ........ 13
2.1 Introduction ......................................................................................................................... 13
2.2 Case Study Setting and Methods ......................................................................................... 14
2.3 Case Study Findings ............................................................................................................ 17
2.3.1 WEEE Management in Colombia .......................................................................................................17
2.3.2 Actor-Networks and Mobilization.......................................................................................................21
2.3.3 University Campus as City Model ......................................................................................................25
2.4 Discussion and Design Requirements ................................................................................. 27
2.4.1 Design Requirements ..........................................................................................................................30
3 The Decision-Enhancement Studio: Towards More Sustainable WEEE Management ............. 33
3.1 Sustainability and Decision Making .................................................................................... 33
3.2 The Decision-Enhancement Service, DES .......................................................................... 34
3.3 Coop4SWEEEM: The Agent-Based Model and Simulation ................................................ 36
3.3.1 Overview .............................................................................................................................................37
3.3.2 Design Concepts .................................................................................................................................42
3.3.3 Translating the Conceptual Model into the Computer-based Simulation ..........................................45
3.4 The Multi-Criteria Decision-Making Tool .......................................................................... 51
3.5 DES Setup ........................................................................................................................... 53
3.6 The Decision-Enhancement Studio in Action...................................................................... 55
3.6.1 Using Coop4SWEEEM .......................................................................................................................57
3.6.2 The Multi-Criteria Decision-Making Process ....................................................................................59
3.6.3 The Decision .......................................................................................................................................61
3.6.4 Decisions are about Concepts and Interests.......................................................................................61
4 The Decision-Enhancement Studio (DES) for More Systemic Decisions ..................................... 65
4.1 Introduction ......................................................................................................................... 65
4.2 Instruments for Validating the DES .................................................................................... 65

ii
4.2.1 Instrument for Validating Coop4SWEEEM ....................................................................................... 66
4.2.2 Technology Acceptance Model (TAM) .............................................................................................. 69
4.3 Validation Results ................................................................................................................ 71
4.3.1 Coop4SWEEEM ................................................................................................................................ 71
4.3.2 TAM results ....................................................................................................................................... 73
5 Epilogue .............................................................................................................................................. 77
5.1 Findings ............................................................................................................................... 77
5.2 Contributions ....................................................................................................................... 79
5.3 Reflections on the research strategy and techniques employed herein ................................ 82
5.4 Further research ................................................................................................................... 83
6 References .......................................................................................................................................... 85
Appendix A. Paper: Actor-Network Theory on Waste Management: A University Case Study ............................. 95
Appendix B. Chapter: Using Actor-Network Theory in Agent-Based Modelling ................................................. 109
Appendix C. Participatory design of the policy for the integral WEEE Management in Colombia ...................... 127
Appendix D. Participatory design of the ecological and environmental policy for the Pontificia Universidad
Javeriana 135
Appendix E. Interviews instrument and results ..................................................................................................... 139
Appendix F. Consumer Behavior: The Massive Virtual Survey at the Pontificia Universidad Javeriana in Bogotá,
Colombia 145
Appendix G. Coop4SWEEEM code. Available in www.xxxx .............................................................................. 155
Summary .................................................................................................................................................... 157
Curriculum Vitae ....................................................................................................................................... 161

iii
List of figures
Figure 1-1: Generic WEEE management processes in developing countries. Adapted from (Müller et
al., 2014; Streicher-Porte et al., 2009) ........................................................................................... 4
Figure 1-2: Design Science Research cycles. Adapted from (Hevner, A.R., 2007; Hevner, A.R. et al.,
2004) .............................................................................................................................................. 9
Figure 1-3: Conceptual framework used to structure self-reflection and present contributions. Adapted
from (Binder et al., 2015) .............................................................................................................10
Figure 2-1: WEEE scenarios in Colombian streets ..........................................................................................13
Figure 2-2: Units of analysis in the exploratory case study. Adapted from (Yin, 2003b) ...............................15
Figure 2-3: General policy design methodology .............................................................................................15
Figure 2-4: Graph of A-N mobilization in local and global networks. Adapted from (Méndez-Fajardo
and González, 2014; Stanforth, 2006)...........................................................................................16
Figure 2-5: Generic WEEE management processes in Colombia ...................................................................18
Figure 2-6: Informal WEEE management processes in Colombia ..................................................................18
Figure 2-7: General WEEE management timeline in Colombia ......................................................................19
Figure 2-8: Local and global networks in Colombia’s WEEE management system (*National
Direction of Taxes and Customs of Colombia). [a) 2013; b) 2015] ..............................................22
Figure 2-9: Mobilization of actors in local and global networks within Colombia’s WEEE
management ..................................................................................................................................23
Figure 2-10: General WEEE management processes on the Javeriana Campus. Adapted from (Méndez-
Fajardo and González, 2014). .......................................................................................................25
Figure 2-11: Mobilization of actors in local and global networks within the Javeriana’s WEEE
management (Méndez-Fajardo and González, 2014)....................................................................27
Figure 2-12: Design requirements for more sustainable WEEE management ...................................................31
Figure 3-1: The decision enhancement studio (DES) ......................................................................................33
Figure 3-2: Requirements used for designing the decision-enhancement studio .............................................35
Figure 3-3: Generic ABM structure. Adapted from (Knoeri et al., 2010) .......................................................36
Figure 3-4: Boundaries of WEEE management related to the collection process ...........................................38
Figure 3-5: Producer, distributor, (PCP) box and consumers in Coop4SWEEEM ..........................................40
Figure 3-6: General processes of Coop4SWEEEM .........................................................................................41
Figure 3-7: Detailed schedule of Coop4SWEEEM processes .........................................................................41
Figure 3-8: Actor mobilization in local and global networks in the single-case study of WEEE
management in Colombia (see Chapter 2 for further information regarding the case study). ......46
Figure 3-9: Coop4SWEEEM interface ............................................................................................................49
Figure 3-10: Animation Area Details ................................................................................................................50
Figure 3-11: Visualization of emergence and observation (output area) ...........................................................50
Figure 3-12: Example displays for one scenario (final simulated scenarios are shown in part 3.5 below) .......51
Figure 3-13: Relationship between the two T-Ts (Coop4SWEEEM simulation and MCDM [Excel]) .............53
Figure 3-14: Scenarios simulated in Coop4SWEEEM within the DES ............................................................54
Figure 3-15: DES development in images .........................................................................................................57
Figure 3-16: Simulation outputs for scenarios 1 and 2 in Figure 3-14 (above) .................................................58

iv
Figure 3-17: Results of simulation of scenarios 1 (left) and 2 (right) in the “Animation Area” of
Coop4SWEEEM .......................................................................................................................... 59
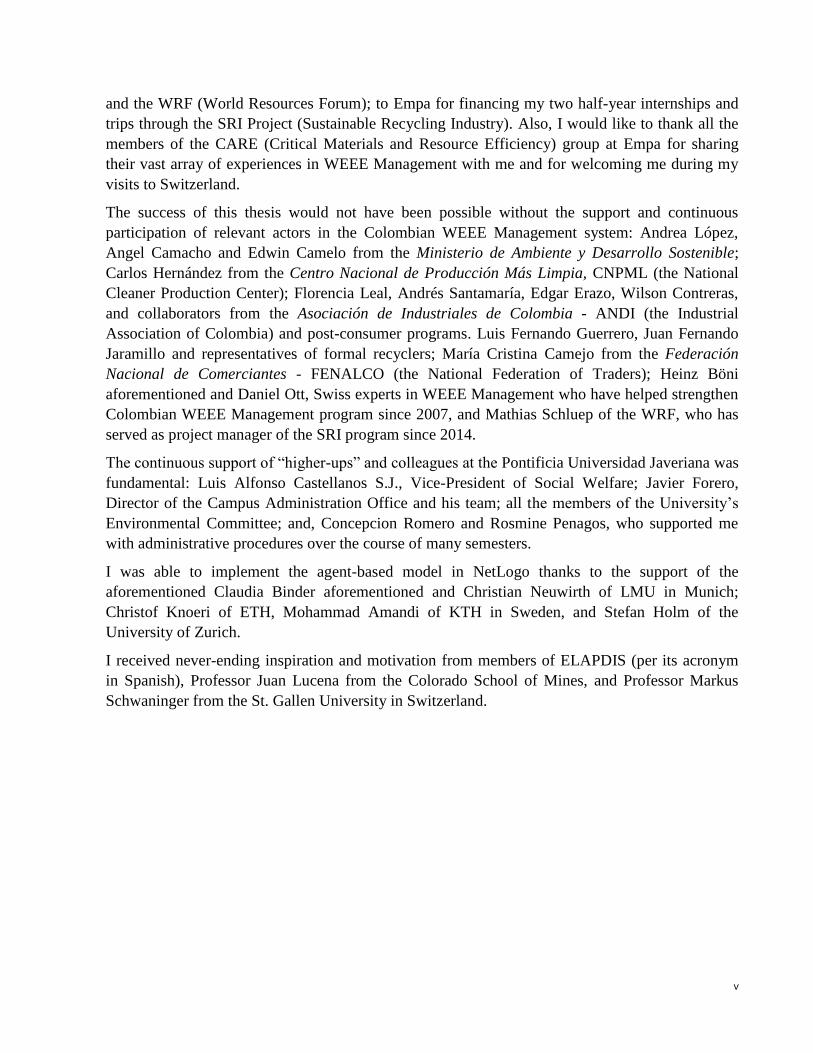
Figure 3-18: Simulation results of the eight scenarios in Coop4SWEEEM ..................................................... 60
Figure 3-19: Scenario prioritization according to criterion weights ................................................................. 60
Figure 4-1: TAM research model (Rigopoulos et al., 2008). .......................................................................... 69
Figure 4-2: Strong direct or indirect positive relationships according to the hypotheses of TAM.
Dashed lines refers to the lowest scores in the TAM results (Table 4-9 above). ......................... 75
List of tables
Table 2-1: WEEE management components needed in Colombia per NWC member prioritization
(short-, medium- and long-term) .................................................................................................. 20
Table 2-2: Prioritization of structural (or most dependent) causes ................................................................ 21
Table 2-3: Actor-Networks Actively Involved in Solid Waste Management (including WEEE) at the
Pontificia Universidad Javeriana (Méndez-Fajardo and González, 2014). .................................. 26
Table 3-1: General DES Structure ................................................................................................................. 35
Table 3-2: ODD structure for the design of Coop4SWEEEM (Grimm et al., 2010; Müller et al., 2013) ...... 37
Table 3-3: Entities of the Coop4SWEEEM ABM .......................................................................................... 39
Table 3-4: Agent attributes in Coop4SWEEEM ............................................................................................ 39
Table 3-5: Cooperation elements in Coop4SWEEEM ................................................................................... 43
Table 3-6: Stochasticity in Coop4SWEEEM ................................................................................................. 44
Table 3-7: Consumer distribution according to primary motivation to participate (based on the virtual
survey, Appendix F) ..................................................................................................................... 47
Table 3-8: Agents, computational attributes and values in Coop4SWEEEM ................................................ 48
Table 3-9: Structure of the multi-criteria decision-making (MCDM) tool .................................................... 52
Table 3-10: Main cooperation elements in the Coop4SWEEEM simulation ................................................... 54
Table 3-11: Last individual decision-making exercise within the DES .......................................................... 55
Table 3-12: DES attendees .............................................................................................................................. 56
Table 3-13: Results of the voting on the best PCP design ............................................................................... 61
Table 3-14: Elements of the systems approach to WEEE management included in the narratives
comprising the last part of the DES ............................................................................................. 63
Table 4-1: The constructs (and their arguments) included in the validation of the conceptual model
and its operationalization ............................................................................................................. 66
Table 4-2: The constructs (and their arguments) included in the validation of the animation and
output data of the computer-based simulation ............................................................................. 67
Table 4-3: The constructs (and their arguments) included as “yes/no” questions in the validation of
the T-Ts ........................................................................................................................................ 68
Table 4-4: Hypotheses supported by the TAM (Rigopoulos et al., 2008) ..................................................... 69
Table 4-5: TAM constructs. Adapted from (Rigopoulos et al., 2008). .......................................................... 70
Table 4-6: “Yes/no” question included in the constructs (and their arguments) for validation of the
decision systemicity ..................................................................................................................... 70
Table 4-7: Pre-DES validation of Coop4SWEEEM ....................................................................................... 71

v
Table 4-8: Results for yes/no questions included in the pre-DES validation instruments ..............................73
Table 4-9: TAM results ..................................................................................................................................74
Table 4-10: The final question regarding the systemicity of the decision-making process developed in
the DES .........................................................................................................................................75
Table 5-1: Outputs, or short-term contributions .............................................................................................80
Table 5-2: Impacts (medium-term contributions) and outcomes (long-term contributions) .........................81

vi
Acronyms
ABM Agent-based modeling
A-N Actor-Network
ANDI The Asociación de Industriales de Colombia per its acronym in Spanish (the Industrial Asso-
ciation of Colombia)
ANT Actor-Network Theory
CNPML The Centro Nacional de Producción Más Limpia per its acronym in Spanish (the National
Cleaner Production Center, Colombia)
Coop4SWEEEM Cooperation for Sustainable WEEE Management (computer-based simulation)
CPE Computadores para educar per its acronym in Spanish
DES Decision-Enhancement Studio
DScR Design Science Research
EEE Electrical and Electronic Equipment
Empa The Swiss Federal Laboratory for Material Science and Technology (Switzerland)
FENALCO The Federación Nacional de Comerciantes per its acronym in Spanish (the National Federa-
tion of Traders, Colombia)
MADS Ministerio de Ambiente y Desarrollo Sostenible per its acronym in Spanish (The Ministry of
Environment and Sustainable Development, Colombia)
NWC The National WEEE Committee (Colombia)
ODD Overview, Design concepts, and Details (protocol)
OPP Obligatory Passage Point
PCP Post-Consumer Program
SECO The Swiss State Secretariat of Economic Affairs (Switzerland)
TAM Technology Acceptance Model
T-T Technological Tool
WEEE Waste Electrical and Electronic Equipment

1
1 Introduction
1.1 The concept of sustainability in solid waste management
The concept of sustainability was first introduced in the area of forestry by H.C. von Carlowitz in
1713 (cited in Hilty and Aebischer, 2015). More recently, it has been linked to “Sustainable
Development,” as formalized in the U.N.’s Agenda 21 (U.N., 1993). Furthermore, it has been
endorsed in the latest round of global summits and conventions, including Rio+20 in Brazil
(2012), the UN Conference of Parties (COP) on climate change in Peru (COP20) in 2014 and in
France in 2015 (COP21). At present, several concepts of sustainability coexist, such as corporate
sustainability (Marcelino-Sádaba et al., 2015; McManners, 2016), economic sustainability
(Martens and Carvalho, 2015) and supplier sustainability (Craig R. Carter and Dale S. Rogers,
2008), among others.
In fact, different organizations have made sustainability part of their corporate and institutional
strategies, namely the World Business Council for Sustainable Development (WBCSD), The
World Commission on Environment and Development, The Organization for Economic
Cooperation and Development (OECD) and The United Nations (UN). These organizations have
identified two common characteristics of sustainability: i) a multidimensional approach that
integrates social, environmental and economic issues; and, ii) a temporal dimension expressed as
“present and future” (U.N., 1993) or “long-term” (Shrivastava, 1995), which implies a cause-effect
way of thinking.
As one of the primary causes of global warming, solid waste management (SWM) has recently
gained traction at climate change conventions (Christensen et al., 2009; Hilty and Aebischer, 2015;
Intergovernmental Panel on Climate Change. Working Group III, 2000). Additionally,
environmental problems in urban areas are mainly associated with the degradation of ecosystems
and the pollution of air and water, highlighting the need for renewable energy sources in which
unsustainable SWM represents both a problem and an opportunity (Hay, L. et al., 2014; Kurdve et
al., 2015; Milutinovic, B. et al., 2014; Mirvis et al., 2010). In this sense, the U.N.’s Agenda 21 has
already emphasized the extension of solid waste service coverage to all urban and rural areas
worldwide (Troschinetz and Mihelcic, 2009). Subsequently, during the Fifth World Urban Forum
in Rio de Janeiro in 2010, the management of Waste Electrical and Electronic Equipment(WEEE)
assumed its role as a prominent issue within Municipal Solid Waste (MSW) in cities around the
world (Wilson et al., 2012). This recognition demonstrates the relevance of WEEE as part of the
discussion on urban sustainability, especially in developing countries (Karak et al., 2012; Oyoo et
al., 2011). Similarly, during the COP20, the paradigm of Zero Waste was endorsed as a key
sustainability strategy (Zero Waste Europe, 2014). Indeed, Heads of State and Government and
High Representatives gathered in New York last September (2015) and declared the new Global
Sustainable Development Goals (GSDG). The GSDG are constitutive elements of the 2030
Agenda for Sustainable Development entitled “Transforming Our World” (U.N., 2015). The 2030
Agenda includes 17 goals, two of which are specifically aimed at waste management targets (#2:

2
“Make cities and human settlements inclusive, safe, resilient and sustainable” / # 12 “Ensure
sustainable consumption and production patterns”).
Despite these advances, SWM systems have not been consummated in developing countries,
resulting in increased public health risks and generating environmental and socio-economic
problems (Abu Qdais, 2007; Ezeah and Roberts, 2012; Rathi, 2006; Sharholy et al., 2008). In these
countries, institutions that organize territorial planning programs are faced with rapid urbanization
and concomitant waste management problems. Moreover, urban planners often make decisions
based on economic priorities without consideration of environmental or social variables
(Perkoulidis et al., 2011; Zhang et al., 2010; Zurbrügg et al., 2012). To tackle these issues, and
simultaneously achieve the objectives set out in the GSDG, studies argue that policy makers and
waste management program designers should apply a systems approach, which provides
interdisciplinary support involving technical, social, economic, legal, ecological, political and
cultural elements (Achillas et al., 2010; Chang et al., 2001; Eriksson et al., 2005; Omran et al.,
2009). In the same vein, the concept of transparency has been employed in sustainability to
strengthen the participation of stakeholders, thereby addressing two priorities: (i) transparency
concerning economic, social and environmental issues, (ii) reporting to stakeholders, actively
engaging them and eliciting their feedback in order to e.g. improve supply chain processes (Carter
and Rogers, 2008).
In addition, an attempt to design more integral solutions for waste management manifested as the
theory of integrated solid waste management (ISWM). ISWM focuses on integrating processes
(generation, segregation, transfer, collection, treatment, recovery and disposal); it has been widely
applied in municipal waste management planning and public policy (Tchobanoglous, 1994;
Tchobanoglous et al., 1993). Based on the concept of ISWM, Decision-Support Systems have
integrated simulation-based models to study waste generation dynamics (Antanasijevic et al.,
2013; Benitez et al., 2008; Maddox et al., 2011), determine landfill allocation (Alves et al., 2009;
Antanasijevic et al., 2013; Kollikkathara et al., 2010) and ascertain optimal SWM planning
(Yeomans, 2004), among other things.
1.2 WEEE Management in Developing Countries
The European Waste Electrical and Electronic Directive (WEEE Directive) defines Electrical and
Electronic Equipment (EEE) as equipment that requires electric currents or electromagnetic fields
in order to properly function, as well as equipment for generation, transfer and measurement of
such currents and fields and designed for use with a voltage rating not exceeding 1 000 volts for
alternating currents and 1 500 volts for direct currents (The European Parliament and The Council
on Waste Electrical and Electronic Equipment, 2012). The Directive categorizes WEEE into one
of 10 groups: (i) Large household appliances, (ii) Small household appliances, (iii) IT and
telecommunications equipment, (iv) Consumer equipment, (v) Lighting equipment (including gas
discharge lamps), (vi) Electrical and electronic tools (with the exception of large-scale stationary
industrial tools), (vii) Toys, leisure and sports equipment, (viii) Medical devices (with the
exception of implanted and infected products), (ix) Monitoring and control instruments and (x)

3
Automatic dispensers (The European Parliament and The Council on Waste Electrical and
Electronic Equipment, 2012).
WEEE has become a pertinent global waste stream due to its high growth rate (Ahluwalia and
Nema, 2007). Although this growth rate is especially pronounced in developing countries (Araújo
et al., 2012; Herat and Agamuthu, 2012; Ongondo et al., 2011), it is also considerable in the
developed world (Premalatha et al., 2013). For example, between 2003 and 2011, 25 of the 50
United States passed WEEE laws (Leigh et al., 2012), and the United States is the largest global
generator of Information and Communication Technologies (ICT) waste (Böni et al., 2015). In
addition to increasing rates, WEEE is composed of potentially hazardous elements, underscoring
the importance of including WEEE strategies in urban sustainability programs (GSMA TM and
UNU-IAS, 2015; Przybyla and Pegah, 2007; Widmer et al., 2005).
Hazardous compounds with toxic substances can have public health effects and environmental
consequences. These problems are exacerbated in developing countries on account of low-tech
recycling and disposal processes, poor operational practices and characteristics inherent to some
products and substances upon disposal, as documented in several reports (Duan et al., 2008;
Gassara et al., 2011; Hassanvand et al., 2011). Studies performed in Peru, Colombia, China, India,
Nigeria and Ghana make it clear that the prevailing—inadequate—recycling operations can
engender severe health and environmental effects (Amoyaw-Osei, Y. et al., 2011; Chi et al., 2011;
Empa and CNPML, 2008a, 2008b; Espinoza, O. et al., 2008; Ezeah and Roberts, 2012; Sinha-
Khetriwal et al., 2005; Thanh and Matsui, 2011; Widmer et al., 2005).
In spite of the hazard presented by some WEEE components, this waste presents an opportunity,
for WEEE contains base and precious metals (e.g. gold and silver solders), rare earth elements
(e.g. neodymium in computer hard disks) and other critical raw materials (e.g. indium in screens
and gallium in mobile phones). These elements can be recovered, yet, in some cases, they are lost
in the recycling chain (Herat and Agamuthu, 2012; Reuter and Van Schaik, 2012; Widmer et al.,
2005). Developed countries, such as Switzerland (Sinha-Khetriwal et al., 2005), began
implementing WEEE collection and recycling programs more than a decade ago. Therefore, the
technologies needed to recover valuable materials from WEEE are well-known, and mainly
implemented in the industrialized world, while strategies to create citizen awareness about the
importance of sorting and recycling waste in developing countries is a much more recent
phenomenon.
WEEE Generation Rates and Management Processes in Developing Countries
EEE consumption has grown rapidly over the last 5 years in all developing countries. In China, per
capita generation (inhabitant per year) of WEEE is around 3.5 kg; in Brazil, around 3.4 kg (Araújo
et al., 2012; Swiss e-waste programme and FEAM, 2009); in Colombia, 2.7 kg; and, in Bolivia,
around 2.3 kg (Swiss Contact et al., 2009). Recent statistics show that the global quantity of EEE
entering the market in 2012 was around 65 million tons and the corresponding WEEE was
between 42 and 49 million tons (Böni et al., 2015; GSMA TM and UNU-IAS, 2015). Of the total
WEEE generated globally in 2014, roughly 53% was generated in Asia (38%), Africa (5%), Latin

4
America (9%), and Oceania (1%). WEEE generation in Latin-American countries has been on the
rise: in 2009, this figure was rough 2800 kt; in 2014, it spiked to 3900 kt (GSMA TM and UNU-
IAS, 2015).
Colombia was the fourth-highest generator in Latin America in absolute terms (roughly 300 kt) in
2014, following Brazil (roughly 1420 kt), Mexico (roughly 910 kt) and Argentina (roughly 310 kt)
(GSMA TM, 2015). Taking the example of computers, studies have calculated a global WEEE
generation of around 0.3 kg/capita per year; however, in countries such as Mexico, Argentina and
Chile, rates are much higher (0.44, 0.49 and 0.42 kg/inhabitant/year, respectively) (Araújo et al.,
2012).
A generic scheme of the EEE and WEEE management process cycle in developing countries is
shown in Figure 1-1 (below). EEE production in countries such as Colombia refers mainly to
equipment imports and, to a lesser degree, the import of (foreign) parts and local (domestic)
assembly. Likewise, distribution involves large and small retailers and is divided into new and
second-hand (donated, repaired or reconditioned equipment) EEE.
Figure 1-1: Generic WEEE management processes in developing countries. Adapted from (Müller et
al., 2014; Streicher-Porte et al., 2009)
Mining activities negatively impact the environment in the form of ecosystem degradation,
pollution of natural resources (air, ground and water), in addition to public health problems
(Brunner, 2011, 2011). These effects have been largely confirmed in the context of developing
countries where informal mining is a pressing issue (Armstrong et al., 2014; Kinyua, 2012).
Similarly, the smuggling of low-quality equipment represents a part of imports (production) in
developing countries, which increases the amount of WEEE generated given that it must be added
to the WEEE exports from the developed world to developing countries. Consequently, urban
mining, which is the term for city dwellers’ use of WEEE as a material source, has taken on
growing importance for material recovery and decreased primary extraction (Simoni et al., 2015).
The use-reuse phase displayed in Figure 1-1 includes both new and used equipment, and the
generation of WEEE occurs once EEE is declared obsolete by the consumer. At this juncture, it
demands pre-treatment (either repaired or disassembled), with the option of selling or exporting
the whole obsolete equipment, breaking it down into parts, disposing of it in sanitary landfills or
introducing it into informal recycling processes (this last option is predominant in developing
countries).
Developing countries
Raw
material
processing
Production
(import/local
assembly)
Use
and
reuse
WEEE
Collection
and Sorting
DistributionPre-
treatment
Treatment
Disposal Disposal
Mining
Environment (air, water, soil, fauna, flora, biota)Lithosphere
Normal flow take-back chain
EEE WEEE

5
In order to improve WEEE management, six Latin-American countries have introduced specific
legislation; Colombia is one of these six nations. In total, eleven Latin-American countries have
begun drafting a regulatory framework (GSMA TM and UNU-IAS, 2015). The majority of these
regulations are based on the principle of Extended Producer Responsibility (EPR), which promotes
the improvement, in environmental terms, of production and manufacturing systems (Agamuthu
and Victor, 2011; Herdiana, D.S. et al., 2014) by placing the responsibility of end-of-life
management on producers and distributors. EPR has been extensively applied to EEE in Europe
(Khetriwal et al., 2009). According to Lindhqvist (2000), EPR aims to influence production
processes in one of two directions (upstream or downstream): shifting responsibility to
downstream procedures that involve different actors in collection, recycling and treatment
processes; providing upstream incentives to producers to incorporate environmental considerations
in the design of their products (Herdiana, D.S. et al., 2014), e.g. cleaner production or design for
recycling (Mayers, 2007).
EPR places the responsibility for equipment on its respective producer(s), including the final
disposal of toxic constitutive elements (e.g. heavy metals) and the recovery of materials (e.g.
metals and plastics). Crucially for the case of developing countries, EPR goes beyond the borders
of the country in which equipment is produced; responsibility would extend to countries in which
equipment is distributed and used. To collect WEEE, producers need communication channels to
both consumers and recyclers in order to ensure recycling processes comply with technical and
environmental standards. In response to this issue, the reverse logistics chain has emerged a
principal strategy, for it entails collection points often located where EEE is sold and at municipal
waste collection facilities. Another widely-used structure is the Producer Responsibility
Organization (PRO), which employs EPR in a collective scheme of producers, importers and
distributors. As of 2007, more than 250 had been established in Europe (Mayers, 2007).
An EPR scheme’s success is premised on the identification of relevant actors or stakeholders in
the system, in addition to the creation of channels of communication and cooperation. Main
(generic) actors or stakeholders at the national level include the environmental authority, the ICT
authority, the import/export authority, the industry (producers), distributors and retailers of new
and second-hand equipment, recyclers (formal and informal) and, last but certainly not least,
consumers. In countries where EPR has been implemented and collective take-back schemes are in
place, PRO serves as the bridge between consumers and producers, thus acting as an important
stakeholder in its own right.
Two main factors determine the amount of WEEE collected: consumer behavior (Desa et al.,
2011; Ongondo and Williams, 2011; Saphores et al., 2012) and physical infrastructure, which, in
turn, affects consumer attitudes (which culminate in behavior). Development of physical
infrastructure depends on coordination and cooperation among public and private organizations
and the existence of a legal framework. It is important to mention that consumers can be
households, public (government) or private (industry, schools, universities, etc.) organizations.
Common consumer attitudes in WEEE management include: storage of obsolete items at home,
transfer to family members, friends or informal recyclers or disposal along with ordinary waste
(Fernández P., 2007). Disposal with ordinary waste allows informal waste collectors to glean

6
WEEE from streets, garbage deposits and landfills (Empa and CNPML, 2010). Factors geared
towards boosting consumer participation in formal collection programs include the following
(non-exhaustive) list of strategies.
i) The lack of knowledge regarding “best practices” and their positive impact on public
health and the environment (Marshall and Farahbakhsh, 2013); the lack of awareness,
(Srivastava and Sahu, 2014) stemming from inadequate education and failed transmission
of clear information about the possible public health and environmental effects of im-
proper and unsafe WEEE management; the lack of public awareness regarding the re-
sponsibility to deliver WEEE to collection points;
ii) Unsatisfied basic needs dictate priorities in each person and/or group (Griskevicius and
Kenrick, 2013), not to mention the Homo economicus aspect of human beings (Bauman,
2007a, 2007b; Henrich et al., 2005); this is also related to the willingness to pay for for-
mal collection and/or recycling (Marshall and Farahbakhsh, 2013) and the fact that in-
formal recyclers usually pay consumers for WEEE.
iii) At the organizational level, economic considerations drive action, as evidenced by their
emphasis on two targets: decreasing taxes on WEEE management (collection service tax-
es) and reducing cost of EEE purchases (e.g. cheaper equipment regardless of quality rel-
ative to price).
iv) For both types of consumers (individuals and organizations), physical accessibility is a
determinant; this refers to collection point locations, which should be easily accessible for
consumers (Srivastava and Sahu, 2014)
As for the second factor (infrastructure), post-consumer strategies have been implemented in some
developing countries. However, studies in various countries reveal the inadequate progress of
these strategies in urban areas and their virtual inexistence in rural areas (Amoyaw-Osei, Y. et al.,
2011; Chi et al., 2011; Empa and CNPML, 2010, 2008a; Espinoza, O. et al., 2008; Ott, 2014;
Sinha-Khetriwal et al., 2005).
At this point, other WEEE management actors should be broached. One of the main barriers to
implementing collection and management strategies in these countries has been the lack of
coordination and cooperation among public organizations and between public and private
institutions. The dissemination of regulations and public policies could help achieve necessary
stakeholder participation, but this needs to be complemented by control instruments in the hands
of the relevant authorities. Furthermore, public policies are usually designed (and passed) by only
one authority (generally the environmental authority), despite the fact that the complexity of the
system demands inter-sectorial cooperation. In order for such cooperation to be effective, multi-
sectorial public policy is required (e.g. involving ICT, education and public health authorities).

7
1.3 Statement of the Problem, Objectives and Research Questions
WEEE Management may be characterized as a typical socio-technical system in that it relies on
technical artifacts to achieve material goals; however, it is also strongly affected by several
(human) actors’ behaviors and decisions. As previously mentioned, the growing population,
increasing consumption patterns, and introduction of new technologies in developing countries
have brought about the rapid escalation of WEEE quantity.
The main causes of ineffective WEEE management are poor or absent infrastructure in cities,
small municipalities and rural areas and deficient coordination and cooperation among actors. The
latter, coupled with the first cause, results in meager amounts of WEEE collection via the
established network.
Colombia has recently begun to design and implement a national WEEE management system
founded on EPR, i.e. aimed at forcing producers, importers, distributers and consumers to assume
responsibility for the end-of-life management of their technological equipment. To meet this goal,
the participation and inclusion of all actors in the entire take-back process is obligatory. In effect,
the implementation of this system requires consensual decisions and strategies designed to impact
every actor in the reverse supply chain. Additionally, EPR entails the implementation of
infrastructure to collect WEEE from consumers with active distributor participation and the design
of infrastructure for the transport, storage and treatment of this waste.
The lack of a systems approach in decision-making processes is one of the main hurdles to
effective waste management, as evidenced by an analysis of this socio-technical system, an
extensive literature review, a case study and the author’s own experience. A non-systems-based
approach translates into a lack of coordination among stakeholders and results from a failure to
design and implement sustainable education strategies. A simulation-based approach may help
close the identified gap; as decision-support systems, simulation-based models have been applied
in decision-making in waste management, though the “optimization” of processes is suggested,
which cannot be expected of socio-technical systems because learning processes for human actors
are required to achieve (more) sustainable management.
Taking into account the concepts of sustainability and systems, the present research proposes
including four components in a systems approach to decision-making: (i) multiple dimensions of
the problem; (ii) targets of the different stakeholders; (iii) processes within WEEE management;
and, (iv) circular cause-effects of current decisions in the short-, medium- and long-term. Specific
dimensions, actors and stages considered relevant to attain a more systemic decision process are
discussed in the development of this research.
Based on the issues described in the previous sections, this doctoral thesis enhances systemicity in
decision-making policy designed to increase sustainability in WEEE management—specifically
for developing countries—using the design of a Decision-Enhancement Studio (DES). Therefore,
this research also contributes to the solution of the principal issues related to policy decisions.
The two main research questions are formulated as follows:

8
RQ1: How can we design decision enhancement studios to support policy makers in the crea-
tion of sustainable WEEE Management programs in developing countries?
RQ2: What are the essential elements needed to enhance systemicity in decision-making for
WEEE management?
1.4 Research Methodology and Contributions
The methodology employed to answer the two research questions above implies three facets:
philosophy, strategy and techniques.
1.4.1 Research Philosophy
The main goal of this doctoral research is to enhance systemicity in policy-related decision making
with an eye towards fostering sustainable WEEE management in developing countries through the
design of a decision enhancement studio. From a philosophical point of view, research must
account for the nature of the problematic situation. According to Kroes (2012), socio-technical
systems refer to “hybrid systems consisting of elements of various kinds, such as natural objects,
technical artefacts, human actors and social entities and the rules and laws governing the behavior
of human actors and social entities” (Kroes, 2012). Seeing as WEEE management involves the
aforementioned elements, it can safely be considered a socio-technical system, above all because it
demands technical artifacts to achieve goals such as EEE distribution, WEEE collection and
recycling of implementation of public educational strategies designed to boost responsible
consumption. WEEE management is also deeply affected by human attitudes and the decisions of
several social actors, who play different roles within the management processes (Figure 1-1) and
decision-making processes related to planning, designing and implementing programs and public
policies.
The socio-technical nature of this research does not reduce the world to pure human knowledge or
the empirically-observable and quantitatively-measurable. Rather, the philosophical apparatus
used to support this doctoral research is critical realism (Mingers et al., 2013). Thus, in answering
the research questions from a holistic and systems-based approach, critical realism is important
insofar as it offers a profound understanding of the real world via the recognition and discovery of
the system (real world) of each actor that influences the system’s dynamics, in addition to
accounting for the differences between the actors’ perceptual and theoretical lenses (Mingers,
2015; Mingers et al., 2013).
1.4.2 Research Strategy
Engineering can be classified as an applied science, and design is a constitutive part of an
engineer’s core professional activities (Meijers, 2008). Engineers approach the world as agents of

9
change in an effort to adapt the world to the practical needs of humans by virtue of problem-
solving processes (Kroes, 2012; Simon, 1996). This distinguishes them from researchers, who
approach reality as spectators, discoverers or theorists in the world (Kroes, 2012). This is coherent
with Hevner’s Design Science Research (DScR), which improves organizational practice by
developing innovative technological solutions, models or methods (Diggelen, 2011; Hevner, A.R.,
2007; Hevner, A.R. et al., 2004). In the DScR strategy, knowledge and understanding of the
problematic situation’s domain, as well as its solution, are achieved in the construction and
application of the designed artifact (Hevner, A.R. et al., 2004). Hevner’s proposal links relevance
and design with rigor as part of the progressive problem-solving process involved in the strategy
that constitutes the methodology employed herein (Figure 1-2).
Figure 1-2: Design Science Research cycles. Adapted from (Hevner, A.R., 2007; Hevner, A.R. et al.,
2004)
Design in engineering responds mainly to the design cycle in Figure 1-2. However, within DScR,
design is not only developed iteratively, but is also tied to the following cycles: the context-based
identification of requirements as part of the relevance cycle to define design inputs and, within the
cyclical process, field testing of the design, which causes changes in the requirements, the design
and the context itself. To support design, applicable knowledge (e.g. theories, methods and
models) is taken from the knowledge base (“Rigor Cycle” in Figure 1-2) and the design process
creates new knowledge that expands the pre-existing knowledge base.
An important element of the DScR is the scientific contribution (see Figure 1-2). Due to the fact
that this research tackles a real-world problem, combined with the fact that WEEE management
involves several actors inside and outside of academia, understanding the problem requires
identifying actor participation for the relevance and design cycles. What is more, the strategy that
constitutes the methodology employed herein applied facilitates mutual-learning processes and
allows for the creation of solution-oriented knowledge that generates both practical and theoretical
results. Together, these characteristics highlight the importance of employing a transdisciplinary
approach to the solution of real-world problems (Lang et al., 2007). According to Binder (2015),
transdisciplinary projects deliver contributions at the following three levels (see Figure 1-3):
outputs (short-term), impacts (medium-term) and outcomes (long-term). Within the outputs,
contributions can be tangible, i.e. publications, workshops, reports, etc. or intangible, i.e.
methodological, organizational or social experiences. As for the impacts and outcomes,
contributions can be tangible, i.e. actions, decisions, plans, etc., or intangible, i.e. forms of
Application
domain
- Actors
- Processes
- History
Requirements
Field testing
Design Science
Research
Relevance
cycle
- Theories
- Models
- Methods
- Artefacts
- Experience
- Expertise
Contribution
Applicable
knowledge
Rigor cycle
Knowledge
base
Build
Evaluate
Design
cycle

10
knowledge (system knowledge, target knowledge or transformation knowledge) or system
changes, which might not be easily attributed to the project alone (Binder et al., 2015).
Figure 1-3: Conceptual framework used to structure self-reflection and present contributions. Adapted
from (Binder et al., 2015)
Validation was performed throughout the research process using triangulation with multiple
instruments. To validate tangible and intangible research contributions (Figure 1-3), the methods
applied included textual and photographic reports of workshops and meetings, as well as expert
interviews to validate the agent-based model (ABM), experiments to evaluate computer-based
simulation and the application of the Technology Acceptance Model (TAM) to validate the
decision-enhancement studio, which incorporates a “studio” as the main facilitative environment
for decisions and a set of technological tools (Keen and Sol, 2008). Intangible contributions were
also validated through the dialogical analysis of documents (products) and open-ended questions
in surveys included in the instruments for validating products. The detailed methods applied are
described below.
1.4.3 Research Techniques
Critical realism recognizes the existence of different types of objects of knowledge (i.e. physical,
social and conceptual); as a result, it necessitates a wide range of research methods (Mingers et al.,
2013). Developing the relevance-design-rigor cycles in this doctoral research (focused on design),
in line with critical realism, meant applying multiple techniques in the form of diverse methods,
instruments and tools. These research aspects are outlined in the following paragraphs and
described, in-depth, in Chapters 2, 3, 4 and 5. Before proceeding, it is important to clarify that all
of the techniques applied were culled from the knowledge base shown in Figure 1-2.
Experience
Tangible outputs
Experience
Cognitive
impacts
Impacts of the
tangible outputs
Cognitive
impacts
Decision
making capacity
Tangible
outcomes
Decision
making capacity
Transdisciplinary
research
Scientific contribution
Practical contribution
Outputs Impacts Outcomes
Experience
Tangible outputs
Experience
Cognitive
impacts
Impacts of the
tangible outputs
Cognitive
impacts
Decision
making capacity
Tangible
outcomes
Decision
making capacity
Transdisciplinary
research
Scientific contribution
Practice contribution
Outputs Impacts Outcomes
Processes Products
Experience
Tangible outputs
Experience
Cognitive
impacts
Impacts of the
tangible outputs
Cognitive
impacts
Decision
making capacity
Tangible
outcomes
Decision
making capacity
Transdisciplinary
research
Scientific contribution
Practice contribution
Outputs Impacts Outcomes
Processes Products

11
A starting point to gauge the current state of WEEE management in developing countries
(application domain), an exploratory multiple-case study was conducted, which helped study
current phenomena in a real-world context (Maguire et al., 2010; Yin, 2003a, 2003b). Doing so led
to the design requirements (Figure 1-2). The specific case study is embedded, for it includes two
units of analysis (Yin, 2003b): the first unit is WEEE management in Colombia (country-level),
while the second is WEEE management on the Pontificia Universidad Javeriana’s campus in
Bogotá, Colombia. This university-level analysis complemented findings related to the country’s
system. Data collection mainly involved participant observation (Platt, 1983), structured
interviews (Briones, 2003) and document review (i.e. assessments, studies, and official reports).
From there, Actor-Network Theory (ANT), proposed by Michael Callon (1986) and Bruno Latour
(2005), was used to analyze case study data in order to define the artifact’s design requirements.
ANT is a conceptual framework for exploring socio-technical processes, and it utilizes a set of
concepts known as infra-language to look for symmetry between human and non-human actors or
actants in networks (Correa-Moreira, 2011). This theory has widely applied to studies on the
relationship between technology and society. One indicative example is the analysis of the role of
the main information system within the National Science and Technology System (Rafael A.
Gonzalez, 2010) or the study of the network dynamics of e-government implementation in
developing countries (Stanforth, 2006). In human-environment systems, analysis that includes
non-human actors is endowed with added relevance given that it identifies the effects of regulatory
mechanisms, among other aspects (Scholz and Binder, 2004). In the same vein, ANT proves useful
when it comes to understanding the role of laws in the dynamics of complex environmental
systems (Méndez-Fajardo and González, 2014). In short, ANT was used, in conjunction with the
participation of interviewees, to define historical milestones related to actors, relationships and the
dynamics of agreements.
As part of the design cycle (Figure 1-2), the definition of system boundaries was the next step in
the design of tools to support decisions within the DES. Consequently, boundaries were defined as
the most urgent decision (Keen and Sol, 2008) or the focal subsystem within the problematic
situation. This process was based on structured interviews with the relevant actors and took the
location and the links with the system as a whole into account. In effect, the previous process
enabled workshop participants to reflect on topics that went beyond the limits of the simulated
subsystem.
Having gone through the previous steps, the conceptualization of an agent-based model and its
implementation as a computer-based simulation were carried out. The ABM was designed using
the Overview, Design concepts and Details (ODD) protocol (Grimm et al., 2010; Müller et al.,
2013). ABM design took exploratory case study findings and information from the literature
review into consideration. Here, it should be mentioned that the empirical data obtained in the case
study required the complementary implementation of a survey. The purpose of this survey was to
understand consumer behaviors (as part of the WEEE management system); it was duly included
in ABM design. The evaluation of the ABM was made using sets of experiments with different
scenarios in the model implemented in NetLogo 5.2.0. In order to ensure the best results of the

12
DES, both the ABM and its implementation as a simulation-based model in NetLogo 5.2 were
iteratively validated prior to the DES.
All steps described above were validated and evaluated by triangulation using different
instruments, in particular structured interviews with experts, experiments and the dialogical
analysis of discussions, questionnaires and documents. Thus, the validation of the DES as the main
designed artifact was done with TAM (Davis, 1993; Rigopoulos et al., 2008), expert interviews
and experiments. TAM uses the Likert scale, which ranges from “strongly disagree” to “strongly
agree” for different constructs related to the artifact to be validated. The detailed questionnaire is
described in Chapter 4. Validation forms part of the design cycle (Figure 1-2), though some
experts involved in the validation process were concurrently relevant actors in WEEE
management, so the specific validation of simulation and of the DES (the artifact) were performed
not only for the design cycle, but also for the application domain or relevance cycle in Figure 1-2.
In addition, the weighted sum method used in the design of the multi-criteria decision-making tool
has been widely utilized in research related to the decisions field and, therefore, was not
individually validated. Nevertheless, the experiments to verify the implementation of ABM also
included the evaluation of the relations between the defined criteria and the prioritization of
alternatives. Furthermore, a pertinent open-ended question was included in the expert interviews
applied before the DES.
Finally, it is important to point out that the experts involved in this research fell into one (or more)
of three main fields: WEEE management, agent-based modeling and decision-making sciences.
1.4.4 Research Outline
Firstly, to define this doctoral research’s general objective and questions, Chapter 1 explores the
key issues in WEEE management within the context of developing countries as part of the
relevance assessment. From there, the methodology (in terms of approach, strategy and
techniques) is described (rigor cycle).
Secondly, as part of the relevance and design cycle, Chapter 2 explains the exploratory case study
structure and main findings through the lens of Actor-Network Theory (ANT).
Chapter 3 presents the design cycle is presented. This chapter develops the DES design as the
product of the decision-enhancement studio, the design of the ABM and its implementation as a
computer-based simulation and the multi-criteria decision making tool. This Chapter also presents
the DES implementation and main findings.
Chapter 4 lays out the validation of the DES and presents the main findings arrived at via the
validation instruments.
Chapter 5, the Epilogue, summarizes the contributions made by this doctoral thesis in terms of
outputs, impacts and outcomes (see Figure 1-3). Chapter 5 also directly answers the research
questions proposed in this section, traces courses of possible future investigation and details
reflections related to the methodology employed herein.

13
2 Problematic situation: The unsustainable WEEE Management
in Developing Countries
2.1 Introduction
Vignette: WEEE Tells Us Stories
Clean, pressed clothes: Strolling through a Bogotá park, appreciating the birds and trees, I found this waste
lying on the street (a -- Figure 2-1). The image of two families immediately came to mind. The first enjoyed
some comfort, as they were able to care for their clothes. Surely, a maternal figure lovingly ironed and added
pleasant scents for her children or husband; this loving matron did not know how to properly dispose of her
iron after it stopped working, so she discarded it along with ordinary waste. Here, the second family came into
play: informal recyclers who earn a scant income for food and therefore have become experts at identifying
valuable objects among WEEE. They removed elements with resale value from the iron before continuing on
their way, searching for more items of value in all corners of the neighborhood.
Figure 2-1: WEEE scenarios in Colombian streets
Changing light bulbs and ingenuity: Although there are post-consumer programs designed for their collec-
tion, bulbs and lamps are commonly found on the streets of Bogotá (b -- left side). The most shocking result
of such WEEE mismanagement is meeting artists who, in a wonderful display of Colombian ingenuity, cre-
ate beautiful ornaments by heating tubes and blowing into them. However, they are blind to the presence of
mercury and directly absorb the heavy metal (b -- right side). Unsatisfied basic necessities mean that infor-
mal recycling, an unimaginably arduous task, represents the sole source of survival for more than 13,000 in-
habitants in Bogotá. As in the case of the aforementioned artists, I was astonished to observe what were es-
sentially “mobile buildings” made of recyclable materials collected by only one person (c -- left side and
middle). More than just Colombian idiosyncratic creativity, and caused by myriad reasons, objects take on a
profound meaning in Colombia. To give just one example, it is not unusual to find obsolete fridges that have
been with a family for more than 30 years, despite functioning exclusively for non-refrigerating purposes,
e.g. a closet. In the same vein, TVs and computer screens so old that they could be in a museum remain a
fundamental part of households. Fortunately, current WEEE collection campaigns have begun to ensure that
these objects do not become sources of pollution … however, potential damages to the health of informal re-
cyclers still exist (c -- right side).
a b
c

14
As described in Chapter 1, although some developing countries have introduced legal frameworks
for managing Waste Electrical and Electronic Equipment(WEEE), several studies have cited
inadequate recycling operations as prevalent sources of severe health and environmental effects.
To tackle these issues, policy makers should design strategies from a systems-based approach that
takes the following elements into account: i) different dimensions of the problem; ii) targets of the
different stakeholders; iii) processes within WEEE management; and, iv) circular cause-effect
relationships stemming from current decisions in both the short-, medium- and long-terms. The
failure to rely on a systems approach represents one of the main hurdles to effective waste
management; this hurdle is primarily distinguished by a lack of coordination among stakeholders
in addition to a lack of design and implementation of sustainable education strategies.
In order to identify the requirements for designing a decision-enhancement studio (DES) to foster
systemicity in policy-oriented decision-making in the context of developing countries, this chapter
explains the methods utilized for the setting and development of an exploratory case study. Also,
in an effort to better understand the context of the research problem, the results obtained from this
case study are presented in terms of Actor-Network Theory (ANT). Likewise, the principal
findings are discussed to ascertain the requirements for designing more sustainable WEEE
management programs.
2.2 Case Study Setting and Methods
To study the current state of WEEE management in the context of developing countries, an
exploratory multiple-case study (Yin, 2003a, 2003b), composed of two single-cases, was
developed, as follows: The WEEE management in Colombia, South America, and the WEEE
management at the Pontificia Universidad Javeriana in Bogotá, Colombia. The second study
consists of a single-case in the context of Colombia and a single-case at the Pontificia Universidad
Javeriana. The Pontificia Universidad Javeriana is located in Bogotá, Colombia’s capital and
largest city; the campus population can be considered a scale model of a city in a number of
aspects: population (the Pontificia Universidad Javeriana’s population is roughly 22,000 people),
the community’s civic behavior (citizens), governmental structure, administrative budget and
budget for investment in infrastructure (Armijo de Vega et al., 2008; Bialowas et al., 2006; Jain
and Pant, 2010; Maldonado, 2006); in addition, the campus contains natural resource management
and waste generation and management dynamics, among other aspects, that frame it as a scale
model.
As recommended by Yin’s method, the present case study includes the following four
components.
First, it is embedded, that is, it includes two units of analysis (Figure 2-2). One is related to
decision makers, while the other corresponds to operational roles within the system.

15
Figure 2-2: Units of analysis in the exploratory case study. Adapted from (Yin, 2003b)
Second, the following questions guided the exploratory case study and helped identify the
requirements for designing a DES to support more sustainable WEEE management:
(i) Have decision-makers implemented a systems approach in their decisions?
(ii) Is there an organized operational structure for WEEE management?
(iii) What elements have triggered improvements in WEEE management?
In addition to the review of documents (which included assessments, studies, and reports),
decision makers and operative roles related to WEEE Management were incorporated in the
participatory policy design in both single-case studies: with regard to the national level, this meant
policy design for WEEE management; with regard to the university level, Javeriana’s
environmental policy included WEEE management. The specific design methods for the two
policies are detailed in Appendix C and D.
Figure 2-3: General policy design methodology
Likewise, actors and processes in committees and technical (operative) groups were observed and
assessed via structured interviews; the interviews are detailed in Appendix E. Decision-makers at
the Pontificia Universidad Javeriana were not the only ones in charge of managing economic
resources at the organizational level, for actors inside University Faculties, e.g. deans, directors
and even researchers, were also granted this responsibility. Therefore, instead of relying on
structured interviews, forms were sent to key figures—past and present deans and department
heads—to ascertain the relevant case history and construct a list of milestones later validated by
decision-makers.
Embedded unit of
analysis 1:
Decision-makers
Embedded unit of
analysis 2:
Operative roles
Multiple exploratory case study
Single case study: WEEE
management in Colombia
Embedded unit of
analysis 1:
Decision-makers
Embedded unit of
analysis 2:
Operative roles
Single case study: WEEE management
at the Javeriana University
POLICY
DOCUMENT
Processes that include
participatory methods
DESIGN
Year1 … Year n …
Time
IMPLEMENTATION

16
The third component of this case study consisted of using ANT to interpret the collected data.
ANT proved valuable for determining relevant facts, actor-networks (A-N), relationships and
agreement dynamics based on historical milestones. In this study, the four constitutive elements of
ANT were defined as follows:
- The Obligatory Point of Passage (OPP) corresponds to the focal A-N that mobilizes the
system by virtue of its power to establish local networks or impose actions on A-Ns in or-
der to meet specific interests.
- The local network entails A-Ns with clear interactions that stabilize the system and thus al-
low for the emergence of milestones.
- The global network consists of A-Ns not actively participating in policy decisions despite
the fact that they should. A global network also includes A-Ns capable of interfering with
the system or impacting the local network when the OPP is weakened. Local network A-Ns
can directly interact with global A-Ns.
- Translation explains the dynamics between local and global networks by describing the A-
N alignment of interests and focusing them on inducing successful action. Translation can
be understood in terms of the following “moments” in each milestone: problematization or
how to become indispensable, interessement or how the allies are locked into place, enrol-
ment or how to define and coordinate roles and mobilization or how the principal A-Ns
borrow the force of more passive ones and turn themselves into the representatives or
spokespeople of these more passive A-Ns (Callon, 1986a).
The main results of applying ANT are illustrated in the mobilization graph (Figure 2-4). Figure 2-4
helps visually track A-N relationships by presenting a timeline, episodes and milestones as they
pertain to, on one hand, the degree of attachment of an A-N in global network and, on the other,
the level of local network mobilization. For more information, readers are directed to the results in
Section 2.3.2.
Figure 2-4: Graph of A-N mobilization in local and global networks. Adapted from (Méndez-Fajardo
and González, 2014; Stanforth, 2006)
Low local
network
mobilization
Most solid projects
High degree of A-N attachment in the global network
Disaggregated A-Ns
High local
network
mobilization
Milestone
Milestone
Milestone

17
As the previous figure illustrates, the most solid project is that for which both the highest degree of
attachment of A-Ns in the global network and the highest local-network mobilization occurred.
Solid projects are ones in which all actors’ interests are strongly aligned; as a result, solid projects
generate projects in the form of programs, strategies, actions, facts or documents.
Finally, from the design’s inception, the prior conceptualization of a “system-based approach” for
each stakeholder was noted in detailed forms that reported on semantics and were used to
demonstrate conceptual changes that took place later as part of the results.
2.3 Case Study Findings
2.3.1 WEEE Management in Colombia
Processes
The total WEEE generated by all world regions in 2014 was 41,800,000 tons, of which 53% was
generated in developing countries (GSMA TM and UNU-IAS, 2015). Colombia, a developing
country, has around 48.5 million inhabitants, 76% of whom live in urban areas (DANE, 2016)
where the largest amounts of WEEE are usually generated. Assessments indicate that in 2013, the
generation of WEEE in Colombia was around 120,000 tons. WEEE generated in the country
includes large household appliances (24%), IT and telecommunications equipment (17%),
consumer equipment (38%), lighting equipment (13%) and batteries (8%) (Pronet, 2013).
The per capita generation of WEEE in Colombia has increased from 3.7 kg/inhabitant in 2009 to
5.3 kg/inhabitant in 2014 (GSMA TM and UNU-IAS, 2015). In order to determine the urban per
capita generation of WEEE, it is important to account for the six different socioeconomic levels in
the country: low-low (22.2% of the total population), low (41.2%), medium-low (27.1%), medium
(6.4%), medium-high (1.9%) and high (1.2%) (Ministerio de Hacienda y Crédito Público et al.,
2005).
Generic processes related to WEEE management are shown in Figure 2-5. In the figure,
production refers to international manufacturers and importers of EEE, as well as local (national)
assemblers, which make up less than 10% of the total. Primary distribution refers to the sale of the
new equipment—imported or locally assembled directly by the companies that produce them, or
by large and small distribution chains. When obsolete EEE is discarded, it becomes WEEE. Some
materials obtained in the pre-treatment stage are recovered locally or disposed of in local
(regional) landfills, while some fractions resulting from WEEE treatment are exported and further
processed for metal and plastic recovery. Moreover, disassembling, also called dismantling or
manual processing, aims at separating devices and their parts (e.g. CD drives, memory cards, etc.)
for subsequent material recovery (e.g. metals, plastics etc.).

18
Figure 2-5: Generic WEEE management processes in Colombia
Previous processes only included the formal system, i.e. processes authorized by the
environmental authority. In Colombia, as part of the collection and sorting processes, post-
consumer programs have been implemented for computers, batteries, lighting equipment and
mobile phones. Nevertheless, a high share of obsolete devices is collected and pre-treated by
informal workers; in fact, this is a common practice in most waste management activities of
developing countries (Chi et al., 2011; Guerrero et al., 2013). Informal recyclers dismantle WEEE
by pounding the objects against the ground, for example, which increases potential health risks to
recyclers, not to leads to deleterious environmental effects due to the toxic elements contained in
EEE (Empa and CNPML, 2010; León, 2010; Streicher-Porte et al., 2005; Widmer et al., 2005).
The informal sector also recovers some metals. Figure 2-6 displays the informal processes as a
sub-system.
Figure 2-6: Informal WEEE management processes in Colombia
Production
WEEE Collection**
and Sorting***
PrimaryDistribution
Re use
Exp
ort
s
Refurbishment
Disassembling*
Local assembly
Imports
Second handDistribution
Landfilling
Recovery
* Or dismantling; Manual and mechanical liberation and separation of materials** Involves take-back points for consumers, campaigns, etc.
*** Manual and/or mechanical separation of materials
Production UseWEEE Collection
& SortingDistribution Pre-treatment Treatment & Disposal
Use
Boundary System of ColombiaEEE WEEE
Informal WEEE
Collection
Re useScrap metal
marketing
Manual
Disassembling*
Landfilling
Informal
metal
extraction
WEEE Collection
& Sorting Pre-treatment Treatment & Disposal
Use
Boundary System of Colombia
Formal metal
extraction
(ferrous metals)
EEE WEEE

19
Actors
Generic actors involved in WEEE management in Colombia can be classified as follows:
producers, distributors, consumers, recyclers (formal and informal) and the Government at
national, regional, local levels. Recyclers usually play the supplementary role of collectors. A
National WEEE Committee (NWC) was created in 2014 to advise in matters related to policy
decisions and follow-up policies, strategies and programs. As promulgated by the Law 1672/13,
the NWC must establish the mechanisms for negotiating with the private sector; identify sources
of financial support; and, support research and related technological innovations. The NWC is
made up of associations that include groups of producers (ANDI – The Asociación de Industriales
de Colombia and CCIT – Cámara Colombiana de Telecomunicaciones, or Colombian Chamber of
Informatics and Telecommunications) and distributors (FENALCO – the Federación Nacional de
Comerciantes), as well as the Ministerio de Ambiente y Desarrollo Sostenible (MADS), the
Ministerio de Protección Social (Ministry of Health and Social Protection), the Ministerio de
TICSs (Ministry of Communication and Information Technologies), and the Ministerio de
Comercio, Industria y turismo (Ministry of Commerce, Industry and Tourism). To round out the
committee, two delegates from authorized WEEE recyclers, two advisers and one representative
from the Centro Nacional de Producción Más Limpia – CNPML (the National Cleaner Production
Center) were added. Last, but not least, the NWC counts on the support of international experts.
Past Actions and Current Necessities
According to the interviews, the historical evolution of WEEE management in Colombia
(described in Figure 2-7) really did not begin until 2000, when the “Computers for Schools”
program was inaugurated (Computadores para Educar in Spanish - CPE). CPE focuses on EEE
refurbishment activities and seeks to provide donated computers to schools in order to help bridge
the digital divide (Marthaler, Christian, 2008).
Figure 2-7: General WEEE management timeline in Colombia
Taking into account these past facts and their results, as well as the latest regulations, WEEE
management components were prioritized by the stakeholders interviewed on the basis of what is
needed in the short- (1 year), medium- (between 1 and 4 years) and long- (more than 4 years) term
to improve Colombia’s WEEE management (Table 2-1). It is important to highlight that this
prioritization helped identify the most important decisions to be made later in the DES designed in
The program
“Computadores
para Educar”
(Computers for
Schools) started
2000 2015 … 2007 … 2010 2012 2013
Swiss Technical
support in WEEE
management
started
Regulations for
some WEEE was
passed (computers,
lighting, alkaline
batteries)
Take-back
programs (for
computers, lighting,
and alkaline
batteries started)
The national
Law for WEEE
management
was passed
The national Committee
for WEEE management
was consolidated
2014
The participatory
design of the policy for
WEEE management
was made
A voluntary take-back
program for mobile
phones started
A technical
committee was
created
The technical
committee was
dissolved

20
this doctoral research. That is, their prioritization does not represent the real non-linear
relationships between causes and effects observed in the case study.
Table 2-1: WEEE management components needed in Colombia per NWC member prioritization
(short-, medium- and long-term)
Elements of WEEE Management to Strengthen or Implement
Strengthen strategies to increase take-back of WEEE from users: awareness, education, incentives and sanctions
Strengthen the role of educational institutions in Colombian education and research (high schools and universities)
Formalize informal / semi-formal recycling
Implement citizen-oriented strategies for environmental education and WEEE awareness
Strengthen strategies related to producers and marketers in the form of penalties for non-participation in take-back
Implement take-back (collection) points and strategies related to market chains; from providers to end users
Reduce WEEE linked to responsible consumption of EEE (generate less WEEE)
Design and implement new recycling plants
Strengthen producer incentive systems to promote recycling (cleaner production, responsible design, eco-design,
etc.)
Strengthen the role of producer and marketer guilds
Design and implement selective routes for WEEE collection (public or private)
Implement economic/tax-based incentives for collecting / recycling / disassembling / refurbishing businesses in
order to increase their technological capabilities
An important finding was that the most urgent action (in the short-term) for improving current
WEEE management in Colombia consisted of designing and implementing strategies aimed at
increasing WEEE consumer collection rates. Complementarily, educational and awareness
programs were shown to be relevant, representing the second and fourth priorities in Table 2-1. In
addition, informality in recycling (including informal collection) was found to be a serious issue;
this aspect was related to consumer behavior.
Furthermore, a list of causes and observed effects related to current WEEE management in
Colombia was prioritized by NWC members and the generic actors who attended activities of the
participatory policy design (among them the Swiss experts and academic scholars). This
prioritization is shown in Table 2-2, along with the structural or most dependent causes. Structural
analysis based on the matrix of influences - MICMAC (Godet, 1993) was used; see Appendix C
for more information.

21
Table 2-2: Prioritization of structural (or most dependent) causes
Causes of Insufficient and Inefficient WEEE Management in Colombia
Poor inter-institutional coordination
Poor regulatory framework for legal implementation
Lack of ongoing training of public staff
Poor cooperation among (public and private) institutions
Poor integration of WEEE management in national educational programs
Insufficient monitoring-control by the Environmental Authority with regard to formal and informal
sectors
Lack of Information Systems to support monitoring and control activities
Poor general dissemination of information (related to the differentiated WEEE management) to con-
sumers (including the obligation to deliver WEEE to the formal system)
Poor monitoring of the Extended Producer Responsibility to implement post-consumer programs
2.3.2 Actor-Networks and Mobilization
Colombia’s WEEE Management
Laws, Acts and Policies were the main mechanisms to tackle previous causes, effects and
necessities (see Tables 2.1 and 2.2). Figure 2-8 shows local (shaded area) and global networks in
terms of Law 1672/2013 and the participatory design of the national policy (2014-2015) within the
timeline (Figure 2-7 above). It should be noted that, as ANT (Latour, 2005) states, the term actor-
network (A-N) encompasses not only human but also non-human actors, such as documents and
laws.

22
Figure 2-8: Local and global networks in Colombia’s WEEE management system (*National Direc-
tion of Taxes and Customs of Colombia). [a) 2013; b) 2015]
Explicit relationships or links between A-Ns are not displayed in Figure 2-8, for their complexity
would render the graph incomprehensible. Furthermore, relationships change, have different
strengths, include feedback loops and result in high interaction density. For instance, the local
network involves A-Ns that have participated in all relevant moments (detailed below), but the
global network includes actors not actively participating in current decisions, despite the fact that
they should be. To name just two examples: consumers and the Ministerio de Educación (Ministry
of Education), which influences education related to consumer behavior. Although all A-Ns
involved in the NWC have taken part in the local network, the Educational Authority has not sent
any representatives yet.
The MADS has participated throughout the entire timeline of WEEE management in Colombia;
likewise, it has convened other actors, published regulations and laws and supported assessments
and studies (see Timeline in Figure 2-7 above). In light of this active participation, and due to the
fact that any project or action an A-N wants to realize must be approved by this institution, it can
be labeled the system’s OPP.
a)
Ministry of Social Protection
Ministry of Foreign
Commerce
Ministry of Education
CCITAcademy
Informal recycling
Ministry of ICT
Ministry of
Environment
ANDIDIAN*
EMPA/SECO CNPML
WEEE
Management in
Colombia
Computers, lighting and batteries regulations
Assessments of WEEE
management in ColombiaLaw for WEEE
management in Colombia
Decree for: Hazardous
Waste Management Act
in Colombia
Congress of the
Republic of ColombiaAuthorized
recyclers
Computadores
para Educar
Post-consumer programs
(computers and batteries)
Voluntary agreement reached
by Mobile phone operators
Mobile phone
service operators
FENALCO
Consumers
b)
Ministry of Social Protection
Ministry of Foreign
Commerce
Ministry of Education CCIT
Academy
Informal recycling
Ministry of ICT
Ministry of
Environment
ANDI
DIAN*
EMPA/SECO CNPML
WEEE
Management in
Colombia
Computers, lighting and batteries regulations
Assessments of WEEE
management in Colombia Law for WEEE
management in Colombia
Decree for: Hazardous
Waste Management Act
in Colombia
Congress of the
Republic of
Colombia
Authorized
recyclers
Computadores para Educar
Post-consumer programs (computers and batteries)
Voluntary agreement reached
by Mobile phone operators
Mobile phone
service operators
FENALCO
Consumers

23
Based on a review of interviews and documents, the milestones (or mobilization moments) in the
evolution of Colombian WEEE management, in addition to the A-Ns involved in each milestone,
were identified as shown in Figure 2-9. The starting point (Milestone 0 in Figure 2-9) was the
creation of the CPE program in 2000. Subsequent years have witnessed parallel episodes. On one
hand, private companies have increased their interest in computer donations, spurred by the
younger generation’s push to provide IT access and the positive environmental impact of reducing
the disposal of still usable computers. On the other, since companies previously were not
financially responsible for the management of this waste, they had an economic interest in their
efforts for the first time. Additionally, their engagement also served marketing purposes and
resulted in a decrease of tax payment (a tax break earned by virtue of their engagement in
corporate social responsibility).
Figure 2-9: Mobilization of actors in local and global networks within Colombia’s WEEE manage-
ment
In parallel, the government started to design regulations for hazardous waste management under
pressure to comply with international agreements, e.g. the Basel Convention (1992) or the Kyoto
Protocol (1997) and domestic laws, e.g. the National Environmental and Natural Resources
Management Law (1993). As a result, the Hazardous Waste Management Act was passed in 2005,
generating further pressure on the industry. In 2007, an agreement between Switzerland and
Colombia was signed (Milestone 1 in Figure 2-9), with the participation of the most relevant A-N.
Note that local network mobilization increased as a factor of the interessement or attraction of
interests: the interessement was, on one hand (for the OPP), prevention of environmental impacts,
compliance with the hazardous waste law and international sustainability requirements; on the
other (for Empa/SECO, the Swiss representatives), it was geared towards supporting developing
countries in WEEE management. This Swiss initiative, which started in China, India and South
Africa as the “Swiss e-Waste Program,” was extended to Colombia and Peru starting in 2007.
During the first two years of this collaboration, local network mobilization of the A-N and global
network attachment increased. Together, such increases facilitated the creation of the computer
and mobile phone working groups (Milestone 2 in Figure 2-9) and EEE and WEEE management
assessments. The latter achievement, the assessments, still resonates as important technical
documents that support decision making.
Low local network
mobilization
Solid
project
High degree of A-N attachment in the global network
Disaggregated A-N
High local network
mobilization
1
3
4
5
26
Milestone General Description
0 Computers for Schools program was created
1 The Switzerland - Colombia cooperation started
2 Computer and mobile-phone working groups
started
3 Regulations for computers and lighting were
passed
4
The post-consumer programs EcoComputo,
Lumina and Pilas con el Ambiente were
implemented
5 The national law for WEEE management was
passed
6
Increased involvement of stakeholders in the
participatory design of national policy on WEEE
management
0

24
In 2009, the local network members conducted a “study tour” to observe WEEE management in
Switzerland in order to obtain primary information on the design of WEEE strategies for
Colombia. Pursuant to the “study tour,” the working groups entered an internal crisis caused by
members’ divergent particular interests, which attenuated global network A-N aggregation and
local network mobilization (see Figure 2-9). However, out this crisis, a crucial step was taken: the
OPP decided to pass regulations (2010) so as to achieve a mandatory collection of computers and
lighting equipment (Milestone 3 in Figure 2-9).
Through a shift in the leadership of the producer representation to ANDI, the composition of the
local network changed and mobilization and participation increased. Three post-consumer
programs (PCP) for collecting computer (EcoComputo), lighting (Lumina) and alkaline batteries
(Pilas con el Ambiente) waste emerged as a result of these efforts (Milestone 4 in Figure 2-9). The
interessement to achieve this milestone stemmed from two primary (interrelated) motivations:
computer producers and importers wanted to comply with the law and to avoid penalties. The
economic opportunity presented to authorized recyclers, representing savings for producers, also
played a role. On account of the lack of regulation, experience from the second working group
(mobile phones) resulted in a weak voluntary agreement by some mobile phone service providers
to implement collection points for consumer equipment (phone service subscribers), which would
then be passed along to authorized recyclers.
The National WEEE Management Law was passed in 2013 (Milestone 5 in Figure 2-9), and the
National WEEE Committee was established in 2014. In conjunction, the creation of the committee
and the passing of this 2013 Law were the culmination of a process begun in 2010 by local A-Ns.
Implementation of regulations, and related Acts, since 2010 have demonstrated the importance of
legislation in terms of achieving increased WEEE collection rates. PCP dynamics have proved
helpful as a learning process to avoid failures in complete system implementation (all WEEE EU
categories).
At present, the MADS, with the support of the CNPML, Empa/SECO and the Pontificia
Universidad Javeriana, is designing the instruments and regulations needed to implement the Law
and a control system. The NWC has been a part of this process, mainly as pertains to policy design
(Milestone 6 in Figure 2-9), which has become the most solid project (see Figure 2-9). Their
involvement seeks to align the interests and motivations of the rest of the actors in local and global
networks (A-N enrolment); likewise, their involvement looks to help achieve a more sustainable
implementation of the chosen strategies. The use of participatory methodologies to identify the
causes and effects of the current, insufficient WEEE management system in Colombia, as well as
the relationship among causes, definition of structural causes and design of strategies and action
plan as part of the policy, have increased the confidence and motivation of A-Ns, which, in turn,
has strengthened global network attachment to (see Figure 2-9).

25
2.3.3 University Campus as City Model
Within the WEEE management system at the city or country level (see Figure 2-5 - Colombia’s
WEEE management processes), a university plays the role of consumer. Nevertheless, as the
second single-case study, the Pontificia Universidad Javeriana exploratory case study was focused
on interior processes and actors (decision-makers and operative roles); in and of itself, these
constitute a subsystem with additional elements of a WEEE system that encompass much more
than consumption.
The Pontificia Universidad Javeriana has two campuses. The main campus is in Bogotá; this
campus was the context of this single-case study. The second is located in Cali. The Bogotá
campus has a population of around 22,000 people, with students accounting for 71% of the total
and scholars/professors for 17%. Waste management, including WEEE, is led by the Campus
Administration Office (CAO), which manages campus investments in infrastructure and
coordinates the logistics of all administrative processes; the CAO also handles WEEE on a daily
basis in the form of specific elements that entail infrastructure, processes and human resources.
Although there are no reliable data regarding waste generation, the management processes are
clearly delineated (Figure 2-10). Such processes include separation of consumer equipment (TVs,
photographs and audio equipment in particular), ITC equipment, lighting equipment and large
equipment from laboratories (e.g. ovens or refrigerators). Equipment that still works is either sold
to the administrative staff or donated to regional social projects (especially computers).
Figure 2-10: General WEEE management processes on the Javeriana Campus. Adapted from (Méndez-
Fajardo and González, 2014).
A-Ns actively involved in local and global networks are shown in Table 2-3. The OPP is the
Campus Administration Office (CAO). The CAO is responsible for designing, building and
maintaining infrastructure investments. The head of this office is the primary decision-maker in
terms of planning, designing and implementing SWM infrastructure, in addition to developing
related programs and campaigns.
WEEE Generation in
Buildings
> 90 % Separated from ordinaryStorage - delivery
to authorized
services
(Country/city post-
consumer
programs)
Internal salesReusing
DonationsReusing
Campus management
RecyclingInternal “informality”

26
Table 2-3: Actor-Networks Actively Involved in Solid Waste Management (including WEEE) at the
Pontificia Universidad Javeriana (Méndez-Fajardo and González, 2014).
Actor-Network (A-N) Units/Faculties/Groups Involved
Campus Administration Office (CAO) -
Department of Ecology and Territory (DET) -
Environmental Administration Group (EAG) CAO and administrative employees from the primary
hazardous waste generators*
The Environmental Committee (EC) CAO, SFE**, SFES***
Vice-president of the Welfare Office, which is respon-
sible for the Healthy University Program (HUP)
-
University Environmental Group (UEG) CAO, SFE**, SFES***, SFAD**** and Academic
Dean of the Environmental Sciences Faculty
Plans for SWM (ordinary and hazardous waste) EC
Environmental Management System (EMS) document CAO, SFES ***
Safety protocols for hazardous waste management
within the Sciences Faculty
CAO, SFES***, Administrative Staff from the Scienc-
es Faculty
* Sciences, Medicine, Odontology, Engineering, Arts, Architecture & Design Faculties, as well as the University Hospital; ** Scholars from the
Engineering Faculty; *** Scholars from the Environmental Sciences Faculty; **** Scholars from the Architecture & Design Faculty
In addition to the A-Ns identified in the table above, two A-Ns emerged as relevant to WEEE
management: (1) employees as the primary consumers/generators of WEEE on the campus; (2)
University Purchasing and Supplies Direction (UPSD), which is responsible for EEE purchases. In
this respect, Faculties would become crucial if WEEE management were refocused on responsible
consumption. The UPSD would also take on added significance due to its role in responsible
consumption insofar as they were related to concepts such as green supply, brands with green
labels, etc.
The moments of translation at the university are shown in Figure 2-11, and the complete
description is included in Appendix A.

27
Figure 2-11: Mobilization of actors in local and global networks within the Javeriana’s WEEE man-
agement (Méndez-Fajardo and González, 2014).
Mobilization of A-Ns through the moments of translation displayed above began after the National
Healthcare Waste Management Law was passed in 2000 (Milestone 0 in Figure 2-11). Of
particular importance were the necessary adaptions of the physical infrastructure in the Sciences
Faculty building and the protocol for hazardous waste management (Milestone 1 in Figure 2-11).
To wit, all milestones emerged from this law’s requirements, whether directly or indirectly. For
instance, the campaign to collect obsolete mobile phones and accessories in 2008 (Milestone 3 in
Figure 2-11) and the leadership of the University Recycling Program initiative (PRIES per its
acronym in Spanish) in Bogotá (Milestone 4 in Figure 2-11) emerged for two main reasons: the
hazardous waste management legal requirements (2005) and the formalization of informal
recyclers in Bogotá (2010). For the milestones described, these regulations were crucial in that
they aligned the interests of the OPP and relevant A-Ns within the system.
Similar to the situation observed at the country level, there were important networks of informal
collection and recycling on the campus, which involve, for the most part, security staff, cleaning
staff, laboratory staff and secretarial staff, all of whom collect not only WEEE but also paper,
cardboard and plastics from offices and sell it off campus.
Finally, a fact worth highlighting is the move towards a more systems-based approach achieved by
the policy’s approval and subsequent operation (Milestone 8 in Figure 2-11) on both of the
Javeriana’s campuses (Bogotá and Cali), especially given that it represented the first time
something of this nature happened at the Pontificia Universidad Javeriana.
2.4 Discussion and Design Requirements
To reiterate, the questions proposed for this case study were:
(i) Have decision-makers implemented a systems approach in their decisions?
(ii) Is there an organized operational structure for WEEE management?
(iii) What elements have triggered improvements in WEEE management?
* These milestones (Nov. 2015, 2016) were achieved after the single-case publication (Dec. 2014)
Solid
project
Disagregated A-N
1
23
6 4
0
5
Episode General Description
0 Prior to the passage fo the National Medical Waste
Management Act
1 First formal protocol for the management of hazardous waste
on the campus (compliance with act in episode 0)
2 Campus Environmental Management System created
3 Campaign for collecting obsolete mobile phones and related
accessories
4 University Recycling Program in Bogota (PRIES per its
acronym in Spanish)
5 Massive virtual environmental survey
6 Implementation of the post-consumer program for alkaline
batteries (Pilas con el Ambiente)
7 * Javeriana University’s Ecological and Environmental Policy is
developed
8 * Javeriana University creates an Environmental Management
Committee to implement the policy in episode 7
7 *
8 *
Low local
network
mobilization
High local
network
mobilization
High degree of A-N attachment in the global network

28
To more thoroughly answer these three questions, the elements of a systems approach (presented
in Section 2.1) should be recalled: i) different dimensions of the problem; ii) targets of the
different stakeholders; iii) processes within WEEE management; and, iv) circular cause-effect
relationships stemming from current decisions in both the short-, medium- and long-terms.
The first question refers to the decision-maker’s approach. Although the main decision-makers
incorporated different dimensions and (occasionally) different actors, programs and strategies
regarding WEEE management, they failed to account for a multi-causal analysis, multiple
management stages and knowledge gleaned from past experiences in an explicitly methodological
way. Regulations, laws and guidelines include keywords chosen to foster more systemic actions.
In spite of this, two main situations emerged. First, the content of the documents has not been
implemented (as was the case for Milestone 2 at the Pontificia Universidad Javeriana; see Figure
2-11), so they have been relegated to unimplemented-yet-documented ideas. Second, some
implemented strategies did not include systemic design; thus, only partial solutions have emerged
to address the structural causes of the problems to date. Take, for example, the focus of some
recycling programs on physical waste collection artifacts, such as bins, to the detriment of
educational strategies and continuous information campaigns vital to fostering consumer
participation. Situations of this nature were observed in Colombian cities and the Pontificia
Universidad Javeriana. In consequence, trashcans are frequently filled with mixed waste, making
the recycling processes inefficient. Further confirmation of the non-systems-based approach in
decisions is attested by the lack of reliable data on waste generation and the increasing levels of
informal activities in collection and recycling.
Decision making did not follow a systemic process at the country or university levels. In the latter
case, the main motivation was the authority’s requirement for compliance with the laws, such that
decisions were made with an emphasis on short-term solutions. What is more, decisions usually
flowed from the campus administration area (to the exclusion of other areas), and decisions looked
to address daily problems. There was no systematic defined set of criteria to facilitate the
prioritization of issues that require investments, e.g. infrastructure development, educational
campaigns or natural resource management (water, energy, ecosystems). Nonetheless, some
successful projects were initiated, attributable to interest from scholars; however, these scholars
have not been actively involved in decision-making. Yet, there are positive signs: due to the
recently passed environmental policy, various scholars will be brought in to the decision-making
process as advisers for the new environmental committee charged with designing and
implementing future strategies.
At the country level, informal recycling, discarded WEEE in public areas and sanitary landfills,
low rates of WEEE collection, low consumer participation, high levels of smuggling and low EEE
quality in markets collectively demonstrate the absence of a systems-based approach to decision-
making. A primary cause is rooted in the inadequate cooperation among relevant actors, i.e. the
lack of coordination among public and private organizations and even within the public sector.
The second question addresses the organizational structure needed for WEEE management. The
operational structure, albeit extant, proved insufficient for effective WEEE management in the
country and university cases. This research has shown that the most important operational roles in

29
waste management for the two single-cases (e.g. the environmental authority at the national level
or the logistics director at the Pontificia Universidad Javeriana) have several responsibilities, even
outside of the waste management field. Moreover, the lack of information systems, to name one
example, available to support decision-making and related activities represents one of the most
conspicuous weaknesses of the management system. This lack resulted in a veritable dearth of
information regarding waste generation (amount of WEEE generated), generators (actors
generating waste) and flows, among other aspects. That being said, one sign of progress is that, at
the outset of this exploratory study, neither Colombia nor the Pontificia Universidad Javeriana had
a related policy, which has been remedied today.
The third question proposes the identification of elements that have triggered improvements in the
WEEE management in each context. In addition to the need to comply with public laws, the
particular interests of relevant actors have motivated the OPP in each system (the MADS in
Colombia and the CAO at the Pontificia Universidad Javeriana) to promote the design and
implementation of strategies considered milestones (Figures 2.9 and 2.11). Since positioning and
marketing are key for equipment producers or large consumers, such as universities, both
Corporate Social Responsibility and Corporate Environmental Responsibility, usually measured
through project impact, have come to form a pivotal step in improving waste management.
Looking specifically at the university case study in which education is the University’s raison
d’être, decision-makers are interested in turning the campus itself into the subject of education.
Beyond external requirements imposed by local, regional or national environmental authorities, in-
house motivation, e.g. boosting Corporate Social Responsibility and increasing the university’s
positioning both nationally and internationally, prompted the primary decision makers to support
policy design activities. Therefore, the latest actions regarding waste management are not merely a
reaction to requirements, but rather are part of a strategy crafted to strengthen Corporate Social
Responsibility. Of note are Milestones 5 and 6 (Figure 2-11), which emerged as preventive
strategies. The massive e-survey (Milestone 5 in Figure 2-11) was part of the participatory design
to elicit appropriation of the policy by the actors to design the university’s environmental policy
(for detailed results, see Appendix D). Moreover, this non-authority-driven strategy may also be
applied to the implementation of the PCP for batteries (Milestone 6 in Figure 2-11). It must be
granted that Milestone 6 was aligned with Colombia’s WEEE Management Law, given that the
battery program increased the awareness of responsible consumption in the university community.
More than five years elapsed between the first attempt to design and pass a policy related to
WEEE management (at the national level) or environmental management (at the university level)
and the realization of this goal. The introduction of a facilitator to methodologically guide
discussion and dialogue among actors catalyzed both processes. At the university, this was
apparent due to the environmental policy legalized in November 2015 and, in the final step, the
national WEEE policy currently under review by the MADS’s legal arm. The following
understanding about the alignment of actors’ interests in the two contexts could help shape similar
projects: a policy should be made public as the framework for designing subsequent laws and
regulations (which, in turn, guide the law’s implementation). However, in Colombia, the WEEE
Management Law was passed in 2013, whereas more successful policy design only came about in

30
2014 and 2015, around the same time as the design of the regulation that included legally-binding
annual collection rates for producers. In this legislative context, calls to attend policy design
activities were led by the MADS (the OPP at the national level), the same actor actually designing
the corresponding regulations. This effectively prompted actor mobilization and made it easier to
achieve the required participation.
Lastly, additional elements were observed during the policy design that should be taken into
account for sustainable WEEE management implementation: i) the same person should represent
actors in local networks throughout the entire process; ii) this representative should be interested in
the topic, rather than view it as an obligation; and, iii) as non-human A-Ns, there should be
detailed reports of all strategies designed and implemented, along with key elements (actors,
actions, type of WEEE, failures, successes, possible future problems and consequences, among
other) and complementary strategies, a de facto acknowledgment of the fact that achieving project
sustainability requires time and resources.
2.4.1 Design Requirements
The answers presented above depict the current state of WEEE management in developing
countries. Clearly, there is noticeable contrast between the current state of affairs and a sustainable
system. As demonstrated by the interviews and literature review, a more sustainable system would
eradicate WEEE in public areas or sanitary landfills, do away with informal recycling, achieve
high rates of consumer participation in PCPs and develop regulations and infrastructure to handle
all WEEE categories and combat low-quality EEE on the market. An ideal system of this nature
would also reinforce formal recycling via the implementation of infrastructure in an effort to
recover valuable materials in the country.
The gap between the current system explored in the case study and more sustainable systems is
explained in terms of design requirements, illustrated in Figure 2-12 below.
The implementation of all listed requirements would ensure WEEE management was on a more
sustainable path. Requirements include information (IT) infrastructure-related aspects (R1 and
R2), as well as physical infrastructure (R3); others are associated with human activities, such as
education, participation, cooperation and decision making (R4 - R8).

31
Figure 2-12: Design requirements for more sustainable WEEE management
Public policies are advantageous when bringing together these requirements to form the basis for
strategy and program development; however, the design of sustainable policies means
requirements such as participation (R5 and R7) and cooperation (R4) cannot be overlooked.
In light of this doctoral research’s focus on the achievement of more systemic decision-making
processes, the design will not broach all requirements. In other words, the decision-enhancement
studio (DES) developed herein included three main elements: people (decision-makers and
facilitator), processes that guided the studio as the main facilitative environment for decisions and
a set of technological tools that integrated technological tools and protocols (Keen and Sol, 2008).
Thus, requirements explicitly incorporated into the design of the DES (see Chapter 3) are as
follows: R5 and R8 are related to general DES goals, while R3, R4, and R7 are related to specific
technological tools goals.
Cu
rren
treali
tyo
f W
EE
E
Man
ag
em
en
t
A m
ore s
ust
ain
ab
leW
EE
E
Man
ag
em
en
t
Reliable and available information about generators, kinds and amounts of WEEE
generated, as well as amounts of waste managed in the informal sector
Design and implementation of Information Systems to support monitoring and control
developed by authorities
Implementation of physical infrastructure and programs to increase WEEE collection
and formal recycling
Clear and open definition of responsibilities of different actors to facilitate coordination
among public and private institutions and motivate cooperation
Create strategies and opportunities to facilitate participation and engagement of relevant
actors in decision making
Design and implementation of educational programs for consumers in order to increase
their awareness about WEEE management mechanisms and risks
Design and implementation of incentives to increase EPR practices and stimulate consumer
participation
Support of academic and experts to design and implement more sustainable WEEE
management programs
R1
R2
R3
R4
R5
R6
R7
R8

32

33
3 The Decision-Enhancement Studio: Towards More Sustainable
WEEE Management
3.1 Sustainability and Decision Making
As described in Chapter 1, global agreements on sustainable development have affirmed the
relevance WEEE management. The effects of such management are more impactful in developing
countries. The exploratory two-case study presented in Chapter 2 revealed the absence of a
systems approach in decision-making. This absence emerged as the main structural cause of
unsustainable WEEE management in Colombia. In an effort to implement a systems-based
approach (or a process closer to a systems-based approach) to waste management, Decision
Support Systems (DSS) have been integrated into the simulation-based models, for an integrated
approach serves, for example, to guide decision making regarding landfill allocation (Alves et al.,
2009; Antanasijevic et al., 2013; Kollikkathara et al., 2010). Further still, this integration allows
for a conceptualization of the role of computers within decision making in order to better
understand and thereby improve the decision-making process. However, decision enhancement
studios take this one step further, given that they serve as a management lens through which it is
possible to significantly enhance executive decision making via a fusion of human skills and
technology. DESs apply this fusion to areas that combine people, processes and technology, and in
which, generally speaking, the impact on decision making has to date been quite limited (Keen,
2011; Keen and Sol, 2008). The present doctoral thesis engages people, processes and technology
using a Decision-Enhancement Studio (DES), designing a DES that accounts for relevant actors in
WEEE management in Colombia, the facilitator (people), the studio—the main facilitative
environment for decisions guided by a protocol (processes)—and tools such as a computer-based
simulation, a multi-criteria decision table (technological tools, T-T) and questionnaires (see Figure
3-1).
Figure 3-1: The decision enhancement studio (DES)
Multicriteria decision making form
Agent-Based simulation
Agreement
about input data
Strategies
Towards
Sustainability
Social structure Environment
Agents 1
2
n
…
Producers
Government
Technical
supportDistributors
1
2
3
4
Relationships and
rules based on
moments of
translation
Authorized
recyclers
4
T-T 1
T-T 2
Policy-makers
Facilitator
Target
decision
What you are
going to do is …

34
As detailed below, the DES’s goal is broader than the T-T’s goals. The T-T consists of an agent-
based model (ABM) implemented as a computer-based simulation using NetLogo, a multi-criteria
decision table implemented in Excel Microsoft Office and a questionnaire included in the DES
guideline.
This chapter describes the design of the studio and the T-Ts and outlines the DES’s
implementation. In Chapter 4, the results of this DES, in addition to its validation, are discussed.
3.2 The Decision-Enhancement Service, DES
When defining the DES’s goals, it is important to review the types of decisions proposed by Keen
and Sol (2008), who argued for six categories:
i) Urgent decisions significantly affect customer relationships, market strategy or corporate fi-
nancing, etc.
ii) Consequential decisions have a range of “adequacy,” in which there is room for error, time
to make adjustments and limited downside risk. Here, the DES contributes to the transfor-
mation of the decision-making process.
iii) Non-avoidable decisions are ones whose contributions consist of encouraging involvement
that leads to commitment, and, in turn, help avoid delays and/or purely “political” decisions
imposed by some stakeholders
iv) Non-reversible decisions are decisions where some parties are not comfortable committing
to a decision, even though said parties are aware of the decision’s importance and conse-
quences. Therefore, these decisions often form the basis of decision avoidance.
v) Packed with uncertainty decisions mean the DES should include simulations to make a rec-
ommendation or consensual forecast, in particular via rapid “what if?” visualization and
analysis.
vi) Wicked decisions emerge from a conflict of values and the difficulty of making trade-offs.
In these scenarios, the DES provides a forum for building a mutual understanding of views,
shared scenario evaluation and collaborative efforts to reach an agreement with a commit-
ment to “follow-on” action. Thus, the main contribution of this decision is, as in consequen-
tial decisions, to improve the process.
The DES has, as a general goal, answering the research questions posed by this doctoral thesis,
whereas the goals of the T-T are more specific and tailored to the structural causes of insufficient
and inefficient WEEE management in Colombia. Per the results of the exploratory case study
(Chapter 2), requirements responsible for driving the design of the DES are R5 and R8 (DES’s
goals), while R3, R4, and R7 are responsible for driving the more specific T-T goals.

35
Figure 3-2: Requirements used for designing the decision-enhancement studio
In other words, the DES’s goal was directly related to the definition of a systems approach:
cultivating an environment in which different points of view (actors) are shared, learning about
WEEE management processes so as to add different dimensions to the discussion and raising
awareness of the circular cause-effects underlying current decisions with regard to short-, medium-
and long-term decisions. Thus, the DES´s goal was formulated as follows: “Decide on aspects that
affect sustainability in WEEE management in Colombia”. Per the six types of decisions previously
outlined, this represents a wicked decision, whereas the T-T goal, identified by the relevant actors,
was to answer the following question: “How can consumer behavior be influenced?” This
corresponds to an urgent decision.
The DES’s general structure can be broken down into four main parts (Table 3-1), although it was
one four-hour-long meeting with a coffee break.
Table 3-1: General DES Structure
As part of the T-Ts, an ABM was designed and implemented as a computer-based simulation (see
Section 3.3), in addition to the development of a multi-criteria decision table using the weighted
sum method and implemented in Excel (see Section 3.4). Section 3.5 details the DES setup.
Cu
rren
treali
tyo
f W
EE
E
Man
ag
em
en
t
A m
ore s
ust
ain
ab
leW
EE
E
Man
ag
em
en
t
R3
R4
R5
R7
R8
Implementation of physical infrastructure and programs to increase WEEE collection
and formal recycling
Clear and open definition of responsibilities of different actors to facilitate coordination
among public and private institutions and motivate cooperation
Create strategies and opportunities to facilitate participation and engagement of relevant
actors in decision making
Design and implementation of incentives to increase EPR practices and stimulate consumer
participation
Support of academic and experts to design and implement more sustainable WEEE
management programs
Description of key concepts
Description of general and specific goals
Explanation of the studio’s methodology
Using Coop4SWEEM
Analyzing the Multi-criteria decision tool
Group decision making
Questionnaire, TAM validation and general suggestions
Development of the studio
Individual decision making (groups of 2 or 3 people)
20 mins
20 mins
60 mins
40 mins
50 mins
15 mins

36
3.3 Coop4SWEEEM: The Agent-Based Model and Simulation
Agent-based modeling may be defined as a computational method that allows for the creation and
analysis of models, as well as model experimentation; these models are made up of agents that
interact in the decision-making process decisions within an “environment” (Gilbert, 2007). Agent-
based modeling helps discover possible emergent properties from a bottom-up perspective and
allows for the representation of phenomena (as do other models, e.g. equation-based models).
Furthermore, agent-based modeling makes it possible to simulate complex situations with limited
information, limited possible responses, limited material resources and limited computational
capabilities. Nevertheless, the effectiveness of ABMs largely depends on agent organization and
coordination roles within the model (Dam et al., 2012; Nikolic and Kasmire, 2013). A generic
ABM structure is shown in Figure 3-3.
Figure 3-3: Generic ABM structure. Adapted from (Knoeri et al., 2010)
In order to design the ABM, the Overview, Design concepts and Details protocol (ODD) proposed
by Volker Grimm in 2006 was used. The ODD protocol established a standard for describing
ABMs (Grimm et al., 2010; Grimm, V. et al., 2006) and has been widely used in the scientific
community (Müller et al., 2013). The ODD protocol’s general structure (see Table 3-2) was
adapted to design an ABM dubbed Coop4SWEEEM (Cooperation for Sustainable WEEE
Management).
Social structure
• Relationships
• Rules
Environment
• Natural
• Artificial
Agent
• Decision
making
1
2
n
…

37
Table 3-2: ODD structure for the design of Coop4SWEEEM (Grimm et al., 2010; Müller et al., 2013)
3.3.1. Overview
Purpose
Entities, state variables and scales
Processes overview and scheduling
3.3.2. Design concepts
Basic principles
Individual decision making and sensing
Interaction, collectives and heterogeneity
Stochasticity
Emergence and observation
3.3.3. Details (translation of the conceptual ABM
into a computer-based simulation)
Implementation details
Initialization and input data
Sub-models
Each item included in Table 3-2 is explained below. Additionally, Section 3.3.3 describes aspects
related to the implementation of this ABM in the free software NetLogo 5.2, which is a platform
for building and analyzing agent-based models and a staple of agent-based modeling (Wilensky,
1999).
3.3.1 Overview
As part of the ODD protocol (Table 3-2), the “overview” covers the model’s purpose, information
regarding “entities, state variables and scales,” and the description of the “processes overview and
scheduling.” These three elements are developed below.
ODD starts with a concise summary of the overall purpose for model development. Since the
urgent decision was defined as “How can consumer behavior be influenced?” the goal of
Coop4SWEEEM becomes a display of cooperation scenarios between EEE producers and
distributors, which is crucial for the implementation and operation of post-consumer programs
(PCP). In turn, these PCPs rely on incentives to encourage consumers to return their WEEE
through the formal system.

38
Figure 3-4: Boundaries of WEEE management related to the collection process
Here, two key points should be clarified. Firstly, WEEE refers, for the present purposes, to ICT
equipment (or similar), such as mobile phones and computers, for they require different logistics
than, say, large appliances, e.g. refrigerators. Secondly, neither second-hand distribution/use
processes nor recycling (pre-treatment) activities were included in the ABM. These two caveats
should make it clear that Coop4SWEEEM was designed for policy makers, for those who make
decisions about PCPs as part of WEEE management in urban areas.
In the ODD, an entity is considered a distinct or separate object or actor that behaves as a unit and
may interact with other entities or be affected by external environmental factors. In this research,
entities were agents, and the environment was divided into the two following areas: the
“motivation to cooperate area” and the “urban area;” the latter is where PCPs were physically
implemented. For their part, agents are a collection of autonomous interacting entities with
encapsulated functionality that operate within a computational world, thus allowing for the
representation of agent behaviors in light of their past experience(s) (Railsback and Grimm, 2011).
The entities utilized in Coop4SWEEEM were identified through the case study (see Table 3-3).
Production
WEEE Collection**
and Sorting***
PrimaryDistribution
Re use
Exp
ort
s
Refurbishment
Disassembling*
Local assembly
Imports
Second handDistribution
Landfilling
Recovery
* Or dismantling; Manual and mechanical liberation and separation of materials** involves take-back points to receive equipment from consumers, as well as campaigns to raise awareness of these
take-back points*** Manual and/or mechanical separation of materials
Production UseWEEE Collection
& SortingDistribution Pre-treatment Treatment & Disposal
Use
Boundary System of ColombiaEEE WEEE
Cooperation between
producers and distributors
Participation of consumers
(delivering WEEE)

39
Table 3-3: Entities of the Coop4SWEEEM ABM
Entity Type Description
Producer Agent Represents the producer within WEEE management
Distributor Agent Represents the distributor within WEEE management
Consumer Agent Represents the consumer within WEEE management
Post-consumer program
(PCP)
Agent Represents the artifact that generates decisions in producers,
distributors and consumers within WEEE management
Motivation to cooperate area Environment Represents the dynamics of the motivation to cooperate in
producers and distributors
Urban Area Environment Represents an urban area where the PCPs are implemented
and where consumers act
“State variables and scales” are defined by the entities’ properties or attributes, as shown in Table
3-4. However, two additional variables are a function of agent actions: potential pollution
(expressed as a percentage), a function of the WEEE not returned by consumers via formal
systems; and the gap between “motivation to cooperate” in producers and distributors (likewise
expressed as a percentage).
Table 3-4: Agent attributes in Coop4SWEEEM
Entity Attribute Unit
Producer Motivation to cooperate Percentage
Resources Units of money
Distributor Motivation to cooperate Percentage
Consumer
WEEE Units
Main interest Interest
Money received Units of money
Post-consumer program (PCP) WEEE collected Units
Resources bag Units of money
Motivation to cooperate area Spatial variable Coordinates (x, y)
Urban Area Spatial variable Coordinates (x, y)
The PCPs included in this design were defined as the “collection strategy,” consisting of urns (or
boxes) physically placed at EEE points of sale in addition to a variety of incentives aimed at
influencing consumers (in an effort to increase the amount of WEEE collected). The PCP
represents the triad of producer-distributor-box (see Figure 3-5), in which “producer” and
“distributor” represent real (generic) actors. In particular, information diffusion and education

40
strategies were coupled with consumer incentives. The incentives considered in this model were
economic and social in nature.
Figure 3-5: Producer, distributor, (PCP) box and consumers in Coop4SWEEEM
As mentioned, the “environment” was split into two zones (see Table 3-3 above): the first
represented the cooperation dynamics between producers and distributors (Sub-model 1) by
situating them into the two activity areas in line with their percentage of “motivation to
cooperate.” The second zone contained consumer dynamics (Sub-model 2) in an urban area.
“Motivation to cooperate” in producers and distributors was defined on the basis of the case study
results. It is useful to classify the agents into “more active” or “less active” areas within the larger
“motivation to cooperate” areas. Similarly, the primary consumer motivations when deciding
whether or not to formally recycle their WEEE were designed using the data obtained in the
massive survey of the Pontificia Universidad Javeriana’s community, as the Sub-model in Section
3.3.3 below illustrates (see also Appendix F).
As part of the “overview,” “general processes” of Coop4SWEEEM are shown in Figure 3-6. The
current legislative context as pertains to the case study includes regulations for some WEEE.
Essentially, these regulations defined an initial percentage of motivation to cooperate in producers
and distributors. Under such conditions, the first step was to implement the initial alliance to
stimulate cooperation. From there, the next step was to design the two PCPs, beginning with the
selection and subsequent implementation of incentives.
Producer
DistributorConsumers

41
Figure 3-6: General processes of Coop4SWEEEM
The ODD defines “scheduling” as the proper order for executing events in the model. The general
schedule corresponds to the previous figure (3.6), yet, within processes two and three, there were
specific sub-processes that relied on two different time scales: WEEE delivery dynamics were
weekly, as were changes in distributor motives, while producer motives and the amount of WEEE
collected via the two PCPs was reviewed annually (in line with current Colombian regulations).
Following the logic displayed in Figure 3-6, the detailed schedule is shown in Figure 3-7.
Figure 3-7: Detailed schedule of Coop4SWEEEM processes
Once the two PCPs were implemented, their physical existence meant consumers could act. After
came PCP operation, i.e. consumer delivery dynamics went into effect (Figure 3-7). Consumers
Consumer Participation Producer and Distributor Cooperation
Consumer ParticipationImplementation of
the PCPs
Every Producer
and Distributor
possesses a
baseline
“motivation to
cooperate”
Collection of
WEEE at each
PCP
Their WEEE generates
potential polution
0 1 2 3
Incentives
Economic
Socio-
environmental
(support project)
Dissemination of
infomation
Design of the PCPs
Motivation to cooperate
dynamics in producers
and distributors
Affects the
Consumers decide to
participate in the PCP
delivering their WEEE
Otherwise
Initial alliance
implemented
Design of
PCP 1
Is there
a SEP to
support?
Are there
economic
incentives?
Is there a
diffusion
strategy?
Assign
Resources
Configure
PCP 1
Yes
No
Yes
No
Yes
No
Implement
PCPs
WEEE Collection
Design of
PCP 2
Is there
a SEP to
support?
Are there
economic
incentives?
Is there a
diffusion
strategy?
Assign
Resources
Configure
PCP 2
Yes
No
Yes
No
Yes
No
Consumers decide if
deliver (or not) in line
with their interests
MTC in P and D
dynamics
Is there more
WEEE to
deliver?
Is the
MTC in P
or D > 0?
Collection of
WEEE stops
Yes
No
Yes
No
PCP: Post-consumer Program
SEP: Socio-Environmental Project
P: Producer
D: Distributor
MTC: Motivation to Cooperate

42
decided (and continually decide) whether or not to deliver WEEE (measured weekly); distributor
motivation to cooperate was measured weekly as a function of the amounts of WEEE collected;
and, producer motivation to cooperate was measured annually (conforming to EPR-derived
regulations). In parallel, the PCP-Box measured the amount of WEEE collected per week, though
amounts were tallied over a year to establish how much each collection point received annually.
Similarly, the potential pollution and the gap between the motivation to cooperate in producers and
distributors were measured weekly.
Finally, since this model does not include options for consumers to generate additional WEEE
(e.g. buy new EEE), one situation that may lead this model to cease functioning is consumer
failure to deliver WEEE. Another would be if the motivation to cooperate in producers or
distributors dropped to zero.
3.3.2 Design Concepts
Design concepts include the description of the theoretical and empirical background, as well as
individual decision making and “sensing,” interaction, collectives, heterogeneity, stochastic
properties, emergence and observation.
As described in Chapters 1 and 2, the principal theoretical background applied to the development
of this ABM is Waste Management addressed from a systems approach and focused on WEEE, for
which the Extended Producer Responsibility (EPR) principle (Lindhqvist, 2000) proves the most
appropriate by virtue of its widespread use. In this theoretical context, EEE producer and
distributor cooperation is needed to achieve, for example, a specific consumer-oriented WEEE
collection goal (Kiddee et al., 2013; Widmer et al., 2005). This principle is complemented by the
reverse logistics concept; reverse logistics holds that WEEE collected by distributors through
consumer delivery is assigned to producers in order to ensure regulatory compliance (Bai and
Sarkis, 2013; Chiou et al., 2012; Li and Tee, 2012).
Two different conceptions stem from the theories used to design agents in this research: producers
and distributors represent organizations, while consumers represent individuals. To ensure
methodological coherence, the approach to the study of their decisions must also be different. On
one hand, organizations decide based on the behavioral planned theory (Ajzen, 1991), in which
utility and opportunity cost drive agent interest. On the other, behavior curtailment in consumers is
based on the value-belief-norm theory (Stern, P.C. et al., 1999). Regardless, economic rationality
(Henrich et al., 2005) was used in the design of both agents in light of its utility for understanding
the effects of incentives. Decisions in producers and distributors are based on the motivation to
cooperate, which was obtained from the case study employing Actor-Network Theory (ANT)
(Callon, 1986b; Latour, 2005) (see Chapter 2 for more information). However, the consumer
decision model was empirically supported with data obtained in a virtual survey of students,
professors, researchers, managerial and administrative staff at the Pontificia Universidad Javeriana
in Bogotá. 2139 (84%) registries (within the surveys) were completed, of which 1614 (75.5%)
were responded to by inhabitants from Bogotá (Appendix F).

43
Individual decision making in agents served as the template for the model’s cooperation rules
(Table 3-5).
Table 3-5: Cooperation elements in Coop4SWEEEM
Agent Required cooperation activity Primary motivation
Producers Economically supporting the incentives included in the
PCP Complement to annual collection goals
Distributors Having a physical space in business places to locate the
urn and temporarily store the waste collected
Consumers who deliver WEEE daily
became potential customers
Consumers Delivering WEEE to the PCP Incentives included in the PCP
“Sensing” in agents depended on the existence of PCPs. Producers and distributors increased or
decreased their motivation to cooperate in function of the WEEE received in the PCP Box (as well
as accumulated amount collected). Consumers decided to cooperate, i.e. deliver WEEE, when PCP
Boxes were physically close in the spatial environment that simulated an urban area and as a
function of the incentives offered to them—consumers cooperated when incentives coincided with
their primary interest (economic remuneration or support of socio-environmental projects or
simply stumbling across the PCP).
It is important to point out that there were no learning processes or individual predictions in this
initial version of Coop4SWEEEM.
ODD protocol defines interaction as the direct and/or indirect (e.g. competition for a mediating
resource) interactions through which individuals encounter and affect others. Interactions could
involve communication, though, in Coop4SWEEEM, there was no direct communication
(messages) among agents. Since the motivation to cooperate in both producers and distributors, in
addition to the consumer’s decision to participate, was dependent upon incentives, communication
was done via PCPs.
ODD protocol provides two definitions of collectives. For the first, agents can belong to
aggregations such as social groups, organizations or human networks; for the second, a separate,
explicit type of entity engages in its own actions (Müller et al., 2013; Railsback and Grimm,
2011). Looking at the latter, in Coop4SWEEEM, there were four collectives: producers,
distributors, PCP boxes and consumers. Agents in this ABM were considered heterogeneous
because, as demonstrated in Table 3-4 above, they differed in parameters, preferences and
decision-making criteria.
Stochasticity in the ODD protocol refers to determining which processes include randomization.
To define the stochasticity in Coop4SWEEEM, the spatial information was defined as discrete, as
were agent attributes, such as money, resources, WEEE and primary interest. However, motivation
to cooperate was defined as continuous. See Table 3-6 below for further description of stochastic
properties.

44
Table 3-6: Stochasticity in Coop4SWEEEM
Entity Stochastic property Stochasticity
Producers
and distribu-
tors
Level of motivation to coop-
erate
Range determined by the analysis of case study data – continu-
ous
Spatial location within the
motivation to cooperate area
Range of (x, y) coordinates showing high or low motivation –
discrete
Consumers
Initial spatial location within
the represented urban area
Range of (x, y) coordinates within a represented urban area –
discrete
Spatial movement within the
represented urban area
Randomized (x, y) coordinates within the entire represented
urban area - discrete
If the PCP includes information diffusion strategies, the ran-
domized movement is directly addressed to the PCP – discrete
PCP Box Initial spatial location within
the represented urban area
Range of (x, y) coordinates within a represented urban area –
discrete
Spatial location and movement include randomized movement, which represented the scant or
non-existent diffusion of information regarding implemented PCP in the real world—the main
reason why consumers have not been apprised of these collection options. Randomized consumer
movement was greater in the absence of diffusion of information regarding PCPs. Conversely,
when information was spread, consumers (in accordance with their stated preferences) were drawn
to the PCP. Further still, the spatial location of the two PCPs was also randomized so as to
represent the physical dispersion of these programs in the real world. Also, continuous
randomization helped represent differences among agents in terms of their motivation to cooperate
(percentage) and, as a result, helped increase heterogeneity in the model.
To define “emergence” in the ODD protocol, the following question must be answered: What key
results, outputs or characteristics of the model emerge from individuals? (Müller et al., 2013).
With an eye towards improving support and enhancing decision-making in policy makers and
authorities, the desired results of emergent properties in Coop4SWEEEM, such as higher amounts
of WEEE collected and higher cooperation between actors, were made explicit. These
characteristics were, in turn, linked to higher sustainability and the prevention of pollution of
WEEE management. Thus, emergence in Coop4SWEEEM can be said to refer to two categories:
The dynamics of WEEE collection that emerge from consumer decisions with respect to
delivering waste are defined in terms of a comparison of their interests and incentives of-
fered by the PCPs. The flip side of collected WEEE is “potential pollution” (WEEEs not
delivered by consumers).
The dynamics of motivation to cooperate in producers and distributors result from the
“satisfaction of individual interests” related to collected WEEE. In addition, the observa-
tion of the maximum gap in the motivation to cooperate was interpreted as high-low po-
tential success of the aggregated PCP (of the whole system).

45
The direct environmental implications of potential pollution must be complemented by the real-
world consequences of not delivering WEEE to formal programs. Failing to deliver WEEE to
formal programs may engender the following negative effects: i) it may fall into the informal
recycling chain, which could harm the health of informal workers and the environment by
releasing toxic substances; ii) it may be thrown away or disposed of (by consumers or members of
the informal recycling sector) in public areas; see Vignette 2.1.1 in Chapter 2 for more on this
point; and, iii) it may be discarded with ordinary waste, ending up in sanitary landfills. This
situation would release toxic substances in the waste matrix and pollute natural resources,
especially water sources.
The model represents the dynamics of WEEE collection and agent behavior in a single unique
design of the PCPs in each run. After runs, for the sake of comparing different scenarios (i.e. PCP
designs), the results of each possible combination should be observed; using Equation 1, this
meant observing a total of fifteen combinations.
Eq. 1
Where: i is the number of parameters (3 types of incentives, on/off), and j is the number of PCPs.
3.3.3 Translating the Conceptual Model into the Computer-based Simulation
To implement the ABM as a computer-simulation tool, the conceptual model must be translated
into a computational one. The initialization elements and the following two sub-models facilitate
this translation: cooperation between producers and distributors and consumer participation.
In order to define the model world’s initial state, and as set forth by the “processes overview”
(Figures 3.6 and 3.7 above), the initial alliance for cooperation was implemented, which created
two producers and two distributors; in turn, these producers and distributors were linked to two
PCPs. Every agent possessed an initial motivation to cooperate and was placed in the
corresponding active area (more or less). Then, the initialization called for the design and
implementation of the two PCPs. In this model, there was no input data matched to external
sources, such as data files, or other models representing processes that changed over time (the
ODD’s definition of “input data”).
The first sub-model is “Cooperation between Producers and Distributors.” Analyzing the data
obtained in the case study allowed for the modeling of the mobilization of actors into local and
global networks. The current normative situation in Colombia, as of 2015, is the existence of
regulations for some WEEE generated, in particular computers, light bulbs and batteries
(Milestone 3 in Figure 3-8); that is, PCPs are designed (in this model) for collecting the
aforementioned WEEE to comply Colombia’s regulatory framework (Milestone 4 in Figure 3-8).
As Figure 3-8 makes clear, the mobilization of agents to cooperate between these two milestones
reached roughly 50% of the maximum positive mobilization. In order to randomly assign the
𝐶𝑖,𝑗 = 𝑖!
(𝑖 − 𝑗 )!

46
percentage of the initial motivation to cooperate (MTCo in Equation 2 below) as part of the initial
agent attributes of these agents, the range was set between 45% and 55%.
Figure 3-8: Actor mobilization in local and global networks in the single-case study of WEEE man-
agement in Colombia (see Chapter 2 for further information regarding the case study).
During operation of the PCPs, agents with more than 70% motivation were placed in the more
active area (representing the local network in the real world). Furthermore, during this stage, the
level of motivation (%) was measured every week (each tick in NetLogo) and adjusted according
to the amount of WEEE delivered at each PCP. Change in this variable is called “satisfaction of
interests” (in producers and distributors); “satisfaction of interest” dynamics are expressed by the
equation 2:
Eq. 2
Individual satisfaction is a function of the WEEE collected via the PCP. It differed for producers
and distributors:
For producers, it meant increasing WEEE collected by 1% per year
Also for producers, it meant either (cumulatively) increasing collected WEEE 5% per year
(every 52 ticks in NetLogo): e.g. year 1, 5%; year 2, 10%; year 3, 15%; and so on. Or, con-
versely, reducing collected WEEE by 10% per year when it was under 5% (cumulatively).
This rule represents real-world regulatory control (% of WEEE collected annually).
For distributors, it meant increasing WEEE collected by 2% per year or reducing non-
WEEE collected by 0.2% per tick (week).
Low local network
mobillization
Solid
project
High degree of attachment of A-N in global network.
Disagregated A-N
High local network
mobillization
1
3
4
5
26
Maximum postive mobillization
50%
𝑀𝑇𝐶(%) = 𝑀𝑇𝐶0 ± 𝐼𝑛𝑑𝑖𝑣𝑖𝑑𝑢𝑎𝑙𝑆𝑎𝑡𝑖𝑠𝑓𝑎𝑐𝑡𝑖𝑜𝑛

47
The simulation stopped when the motivation to cooperate percentage of any producer or
distributor reached a value of zero.
The second sub-model is “Consumer Participation.” To characterize this participation, a virtual
survey of the Pontificia Universidad Javeriana community was conducted. A total of 2,139 of
2,547 questionnaires were completed. Of these, 1,614 respondents were from Bogotá and fell into
the following age ranges: 18 to 22 (43.4%), 22 to 50 (47%), >50 years old (9.6%). 53.3% of
consumers prefer to deliver their WEEE to a PCP located in shops and stores where EEE is sold
(shops, markets). This population of 53.3% showed other additional interests (i.e. motivation to
participate) displayed in Table 3-7.
Table 3-7: Consumer distribution according to primary motivation to participate (based on the virtual
survey, Appendix F)
Primary Interest %*
Receive money (economic incentive) 21.7
Support social/environmental projects 70.8
Finding the box is sufficient (proximity) 3.7
Receive information about the PCP** 3.7
* Of the 53.3% motivated by PCP in stores
** Info. regarding what to do with WEEE and the negative impacts prevented by responsible
recycling
Each consumer started the simulation with 5 WEEE devices, and every week (tick), consumers
could deliver one WEEE to a PCP-Box. The simulation should allow users to distinguish each
consumer when they deliver WEEE. The simulation stopped when the total WEEE held by
consumers fell below 5%.
Coop4SWEEEM was implemented using NetLogo software. Table 3-8 summarizes the agents,
computational attributes and values defined in the previously described design.

48
Table 3-8: Agents, computational attributes and values in Coop4SWEEEM
Entity Attribute Values
Producer Motivation to cooperate 0 – 100
Resources 0 – 100
Distributor Motivation to cooperate 0 – 100
Consumer
WEEE 0 – 5
Primary interest 1 - 4
Money received 0 - 5
Post-consumer
program (PCP)
Incentive offered (1 COP per WEEE received) On-Off
Social/environmental project to support On-Off
Diffusion of information about the PCP and
WEEE management
On-Off
WEEE collected 0 - 805
Resources bag
Start with 0
Decreases with each WEEE received
Increases if producer belonging to the
PCP cooperates
Motivation to
cooperate area
High activity zone (higher % of motivation to
cooperate): x, y coordinates
(-16 to 0), (9 to 16)
Low activity zone (lower % of motivation to
cooperate): x, y coordinates
(0 to 16), (9 to 16)
Urban Area x, y coordinates (-16 to 16), (-16 to 8)
The complete NetLogo code is included in Appendix G. In line with the ODD protocol described
above, the interface has three main areas (see Figure 3-9 below).
The initialization and input data area includes the design of the two PCPS, each of which has three
kinds of incentives that can be turned on or off. Firstly, the PSA-Posc1 (or 2) corresponds to the
support of a social/environmental project economically handled by producers. Secondly, the Inc$-
Posc1 (or 2) refers to the offer of a direct economic incentive to consumers, such as money in
exchange for turning in WEEE or redeemable bonds when buying new EEE. The third and last
incentive (DifuPosc1 – or 2) is related to the diffusion of information regarding PCP via media.

49
Figure 3-9: Coop4SWEEEM interface1
The first step in Coop4SWEEEM, as previously stated, consisted of implementing the initial
cooperation alliance, whose main result was the visualization of producers and distributors (the
upper animated area in Figure 3-9). There were two producer-distributor pairs linked to PCPs 1
and 2, respectively. The second step was to design and implement the two PCPs in terms of
incentives and then visualize both PCP-Boxes and consumers (the lower animated area in Figure
3-9). There were 161 consumers, 10% of survey respondents in Sub-model 2 (Section 3.3.1.3)
described above, adding up to a total of 805 units of WEEE at the simulation’s outset.
After carrying out the previous steps, the collection system operation commenced. During this last
phase, emergence and observance were continuously displayed in the output area. Consumer
dynamics (lower part) and producer-distributor dynamics (upper part) can be seen in the
Animation Area in Figure 3-9 (and Figure 3-10). Producer-distributor movement here represents
agent motivation to cooperate; the value of this motivation increases or decreases according to the
design described in Sub-model 1. For its part, the animation of consumers shows both their
randomized movement relative to the location PCP Boxes; color changes correspond to consumer
decisions regarding WEEE delivery (Figure 3-10).
1 This figure is in Spanish, given that it is a screenshot of the simulation used for the Case Study in Colombia, a Spanish-
speaking country
Área de animación
Área de resultados
Área de configuraciónInitialization and input dataAnimation
Outputs (emergence and observation)

50
Figure 3-10: Animation Area Details2
Turning attention to the graphs in the output area (Figure 3-11), producer and distributor
motivation changed in response to consumer delivery of WEEE, as well as potential pollution (%).
Figure 3-11: Visualization of emergence and observation (output area)3
A clear example of how the model works is seen in Figure 3-12. This figure illustrates results of
the scenario in which PCP-1 includes consumer incentives and PCP-2 does not include any. For
2 This figure is in Spanish, given that it is a screenshot of the simulation used for the Case Study in Colombia, a Spanish-
speaking country
3 This figure is in Spanish, given that it is a screenshot of the simulation used for the Case Study in Colombia, a Spanish-
speaking country
Productor (genérico),
Posconsumo1
Distribuidor (genérico),
Posconsumo1
Productor (genérico),
Posconsumo2
Distribuidor (genérico),
Posconsumo2
Urna (genérico),
Posconsumo1
Urna (genérico),
Posconsumo2
Producer
PCP 2
Distributor
PCP 2
Producer
PCP 2
Distributor
PCP 2
PCP-Box
1
PCP-Box
2
Variación en la energía de
cooperación productor y
distribuidor de cada posconsumo
Unidades de RAEE
recibidas en cada
urna semanalmente
Variación en el % de
contaminación potencial por
RAEE no entregado
Brecha entre energía de
cooperación máxima y mínima,
en productores y distribuidores
Variation of the motivation (%)
in producers and distributors
Units (#) of WEEE that are
weekly received in each PCP
Gap between min-max mtivation to
cooperate of producers and distributorsVariation of the potencial
pollution (%)

51
the sake of clarity, the graphs of the gap in motivation and potential pollution do not show data for
each PCP; instead, they portray accumulated data.
Figure 3-12: Example displays for one scenario (final simulated scenarios are shown in part 3.5 below)4
At the end of each simulation run, the amount of WEEE collected by each PCP (as units and
percentage), in addition to total time (years), final motivation gap and potential pollution were
displayed in the output area. These data represent the criteria taken into account for each
alternative (scenario) in the multi-criteria tool.
In order to evaluate implementation of the ABM, an experimental design was utilized. Results can
be consulted in Appendix G.
3.4 The Multi-Criteria Decision-Making Tool
The multi-criteria decision-making (MCDM) tool consists of a list of alternatives (scenarios
simulated in Coop4SWEEEM) and criteria used to choose or reject alternatives (ai). To prioritize
alternatives, the weighted sum method was employed (Caterino, 2009; Fishburn, 1967); this
method requires a weight (wi) be assigned to each criterion (j), until 100% is assigned (Equation
3).
Eq. 3 ∑ 𝑎𝑖𝑗𝑤𝑖𝑗𝑗
Four criteria were defined on basis of the results of the case study and literature review. Firstly, the
amount of WEEE collected, the parameter included in policies and regulations as the unit of
required producer collection amounts. Secondly, the time elapsed between the simulation’s
4 This figure is in Spanish, given that it is a screenshot of the simulation used for the Case Study in Colombia, a Spanish-
speaking country

52
beginning and end, which represents the number of years needed to collect the WEEE assigned to
consumers. Thirdly, there was the final gap between producer and distributor motivation. Fourthly,
there was the percentage of potential pollution registered at the end of the simulation.
The weighted sum method was programmed in an Excel spreadsheet (Table 3-9 below); each cell
was filled with data obtained from each run of the Coop4SWEEEM simulation. Each weight in the
table could be changed by decision-makers (DES attendees) in order to generate debate about the
importance of including the perspectives of different actors involved in the decision-making
process.
Table 3-9: Structure of the multi-criteria decision-making (MCDM) tool
* The sum of the weights has to be equal to 100. The highest value corresponds to the most important criterion in the decision
The worst The best
Prioritization scale

53
Figure 3-13: Relationship between the two T-Ts (Coop4SWEEEM simulation and MCDM [Excel])5
3.5 DES Setup
At first, to engage attendees, a shared understanding of key concepts had to be inculcated. A
perfect example is the meaning of systems approach. This was defined as an approach that takes
the following into account i) social, cultural, economic, politic, technical and environmental
dimension; ii) roles within WEEE management (government, producers, distributors, consumers,
and formal and informal recyclers); iii) stages of WEEE management in Colombia
(production/importation, distribution, use/reuse, collection, pre-treatment, treatment, exportation);
and, iv) circular cause-effect relationships stemming from current decisions in the short-, medium-
and long-terms. A post-consumer program (PCP) was defined as a collection strategy that
consists of an urn (a box) physically available at EEE points of sale. A PCP should also offer
incentives aimed at influencing consumers, and thereby the amount of WEEE collected.
The third key concept was cooperation. In this DES, cooperation refers to the performance of
activities that different actors should carry out—together—in order to achieve more sustainable
WEEE management. The specific activities required of each actor involved in the simulated
collection system, along with the primary motivation of each, are shown in Table 3-10.
5 This figure is in Spanish, given that it is a screenshot of the simulation used for the Case Study in Colombia, a Spanish-
speaking country
Resultados corrida 1, escenario 1:
Resultados corrida 2, escenario 1:
Resultados corrida 3, escenario 1:
Escenario Simulado
Peso del criterio*
13 16 19 2.2 2.2 2.5 20 23 22 98.4 98 97.6
0 0 0 0 0 0 0 0 0 0 0 0
0 0 0 0 0 0 0 0 0 0 0 0
0 0 0 0 0 0 0 0 0 0 0 0
0 0 0 0 0 0 0 0 0 0 0 0
0 0 0 0 0 0 0 0 0 0 0 0
0 0 0 0 0 0 0 0 0 0 0 0
0 0 0 0 0 0 0 0 0 0 0 0
0 0 0 0 0 0 0 0 0 0 0 0
Brecha Motivacion
(%)entre Productor y
Distribuidor
25
%Potencial
Contaminación
25
%RAEE Recibido
25
Años
25

54
Table 3-10: Main cooperation elements in the Coop4SWEEEM simulation
Actor Cooperation activity Primary motivation
Producers Economically support the incentives includ-
ed in the PCP
Complement annual collection
goals
Distributors
Having a physical space in the business to
place the box and temporarily store collected
waste
Consumers that delivered WEEE
on a daily basis were potential
customers
Consumers Delivering WEEE to the PCP PCP incentives
After explaining the definitions of the key concepts presented, DES goals were described. The
general objective was to decide on issues that affect sustainability in WEEE management. The
three specific objectives were: i) identify aspects that influence cooperation between EEE
producers and distributors; ii) visualize producer-distributor cooperation and PCP results
implemented in terms of quantity of WEEE collected; and, iii) identify variables that influence
consumer dynamics in terms of WEEE delivered.
Next, the tools were described to the group, starting with the individual (groups of 2 or 3 people);
to instruct participants in the usage of Coop4SWEEM, in the T-T’s function and logic, Scenario 1
(of 8 total) was simulated in as shown in Figure 3-14.
Figure 3-14: Scenarios simulated in Coop4SWEEEM within the DES
The multi-criteria table was outlined, as well as the final decision exercise as a whole group. In
this table, the eight scenarios run in Coop4SWEEE corresponded to the alternatives. In addition,
each team observed different simulation results in terms of the criteria included in the
complementary decision-making tool.
The last part of the individual decision exercise was guided by information in Table 3-11. The
main goal was to elicit discussion of the criteria and their weights as part of the decision-making
Escenario Simulado
1 5
2 6
3 7
4 8
Escenario Simulado
1
2
3
4
5
6
7
8

55
process. Each team was able to propose different (additional) weight combinations to reflect their
own interests and opinions.
Table 3-11: Last individual decision-making exercise within the DES
The results of the individual phase were shared with the rest of the attendees in order to generate
constructive debate to conclude (if possible) with a single group decision regarding PCP design
and define the best criteria and weights to make related decisions. In the end, the validation
instrument of the Technology Acceptance Model (TAM) was developed by attendees, including a
yes/no question aimed at verifying whether or not the decision-making process was more systemic
than the “traditional” approach. See Chapter 4 for more details related to validation.
3.6 The Decision-Enhancement Studio in Action
The DES was developed at the Pontificia Universidad Javeriana on October 25, 2015. The 16
attending institutions, organizations and companies, listed in Table 3-12, represented the main
WEEE management decision makers in Colombia who have taken part in the milestones identified
in the case study (Chapter 2).
Simulated scenario
Criterion weight
#
Criterion weight
#
Criterion weight
#
Criterion weight
#
Criterion weight
#
The 2 best alternatives
Explanation of the reasons for choosing each alternative
The 2 best alternatives
Explanation of the reasons for choosing each alternative
0 0 0 100
The 2 best alternatives
Explanation of the reasons for choosing each alternative
0 0 100 0
The 2 best alternatives
Explanation of the reasons for choosing each alternative
0 100 0 0
The 2 best alternatives
Explanation of the reasons for choosing each alternative
100 0 0 0
% WEEE Collected Years Motivation gap (% ) Potential polution (% )
25 25 25 25

56
Table 3-12: DES attendees
MADS - Ministerio de Ambiente y Desarrollo
Sostenible
CI Recyclables SAS - (Authorized WEEE recycler)
ANDI – Asociación de Industriales de Colombia Click on Green - (Authorized WEEE recycler)
WRF - World Resources Forum (Switzerland) OCADE SAS - (Authorized WEEE recycler)
Empa - Swiss Federal Laboratory for Material
Science and Technology (Switzerland)
LITO SAS - (Authorized WEEE recycler)
Red Verde – Post-consumer program (home appli-
ances)
Trade pro escrap SAS - (Authorized WEEE recycler)
CNPML - Centro Nacional de Producción Más
Limpia
Lasea Soluciones - (Authorized WEEE recycler)
EcoCómputo Corporation - PCP (computers) Megaserviciosplus SAS - (Authorized WEEE recycler)
Pontificia Universidad Javeriana Gaia Vitare SAS - (Authorized WEEE recycler)
Protocol development is shown in the pictures below (Figure 3-15). The moderator—the author of
this doctoral thesis—explained the main concepts under consideration, such as systems approach,
PCP cooperation and T-Ts (Row 1 in Figure 3-15 below).
It is important to highlight that two of the four main PCPs attended the DES: EcoComputo was the
first PCP implemented (2012) after legal regulations went into effect (2010) and Red Verde is the
most recent PCP (2014).
The estimated time needed to develop the DES’s agenda (Table 4-1) was fulfilled almost as
exactly as planned. However, the use of the simulation for individual decision making took longer
than expected, leaving the group decision-making portion of the DES only 30 minutes (Row 4 in
Figure 3-15 below). In spite of time pressure, the group managed to discuss the key elements and
achieve the DES’s goals, which are developed below (see Section 3.6.4).

57
Figure 3-15: DES development in images
3.6.1 Using Coop4SWEEEM
The eight scenarios included in Figure 3-16 were simulated. The first two (shown in Figure 3-14
above) sought to determine if PCPs should include incentives. All scenarios produced different
designs for incentives within the PCPs and concomitant cooperation of producers, distributors and
consumers. To illustrate two opposite scenarios, the results of the first two are included in Figures
3.16 and 3.17. A comparison of these two figures leaves no doubt that PCPs with incentives
(Scenario 2) achieve greater consumer participation than those without incentives (Scenario 1). It
is also worth adding that potential pollution is inversely proportional to consumer participation.
Consequently, when the former is lower when the latter is higher, as was the case for Scenario 2.

58
Figure 3-16: Simulation outputs for scenarios 1 and 2 in Figure 3-14 (above)6
Conversely, the motivation to cooperate in producers and distributors plummets rapidly when
consumers do not participate. This fact can be observed in the Animation Area (Figure 3-17).
6 This figure is in Spanish, given that it is a screenshot of the simulation used for the Case Study in Colombia, a Spanish-
speaking country.

59
Figure 3-17: Results of simulation of scenarios 1 (left) and 2 (right) in the “Animation Area” of Co-
op4SWEEEM7
3.6.2 The Multi-Criteria Decision-Making Process
The results of the eight scenarios run in Coop4SWEEEM (in triplicate to observe the tendencies)
were registered in MCDT as seen in Figure 3-18.
7 This figure is in Spanish, given that it is a screenshot of the simulation used for the Case Study in Colombia, a Spanish-
speaking country.
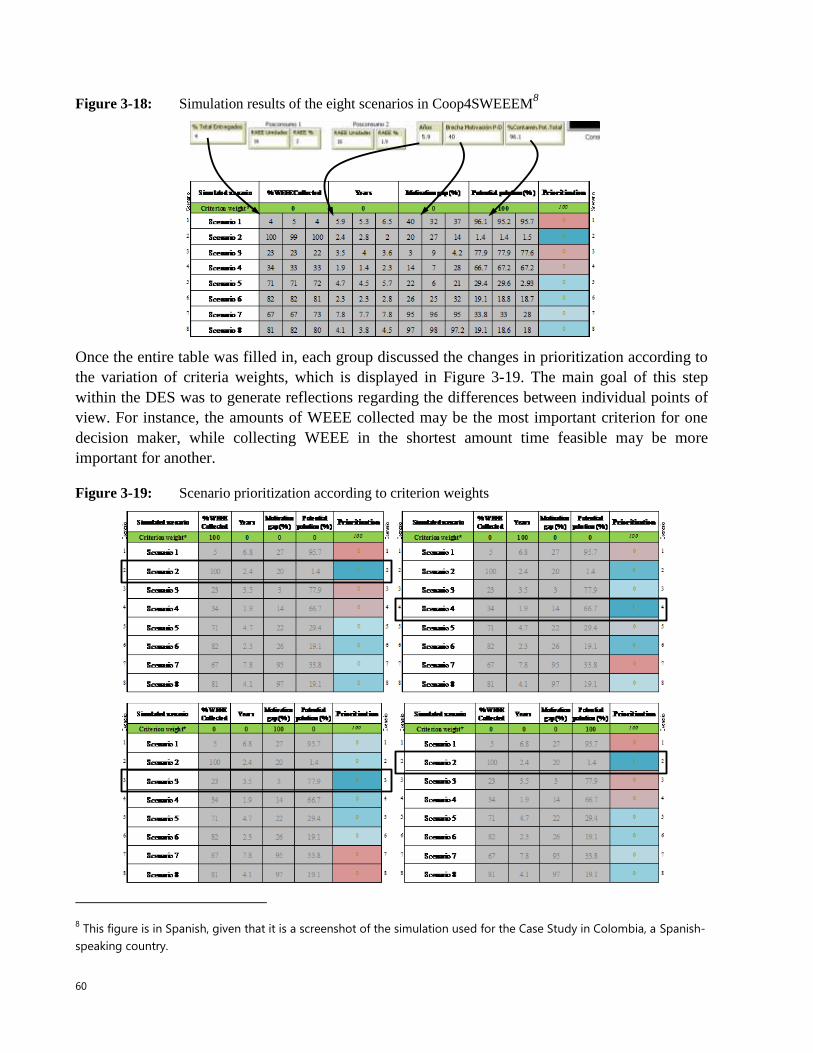
60
Figure 3-18: Simulation results of the eight scenarios in Coop4SWEEEM8
Once the entire table was filled in, each group discussed the changes in prioritization according to
the variation of criteria weights, which is displayed in Figure 3-19. The main goal of this step
within the DES was to generate reflections regarding the differences between individual points of
view. For instance, the amounts of WEEE collected may be the most important criterion for one
decision maker, while collecting WEEE in the shortest amount time feasible may be more
important for another.
Figure 3-19: Scenario prioritization according to criterion weights
8 This figure is in Spanish, given that it is a screenshot of the simulation used for the Case Study in Colombia, a Spanish-
speaking country.
The worstThe best The best
Prioritization scale

61
3.6.3 The Decision
This 9-group individual decision exercise, which formed the basis for full group discussion,
culminated in the two following questions: i) based on the previous steps, what elements should be
integrated into a post-consumer program (PCP)?; and, ii) which criterion (or criteria) included in
the discussion would promote greater sustainability of the proposed strategy, and what should its
corresponding weight be? The votes broke down as shown in Table 3-13.
Table 3-13: Results of the voting on the best PCP design
PCP design (scenario) Voting
6
Include an incentive to support social and environmental pro-
jects rather than economic incentives; also include media dis-
semination of the program
53.80%
2
Include support for socio-environmental projects and an eco-
nomic incentive; also include media dissemination of the pro-
gram
30.80%
3
Include an economic incentive
7.70%
5
Include an incentive to support social and environmental pro-
jects
7.70%
Looking at each component individually (the two kind of incentives and media dissemination of
the program), the incentive to support a social/environmental project and include dissemination
received the most votes (92% and 84%, respectively), while the economic incentive garnered
38.5% of votes.
Finally, the criteria were prioritized as follows: amount of collected WEEE (average assigned
weight: 49%), time needed for collection (average assigned weight: 29%), percentage of potential
environmental pollution (average assigned Weight: 13%) and motivation gap between producers
and distributors (average assigned weight: 9%).
3.6.4 Decisions are about Concepts and Interests
In this subsection, select narratives and opinions extracted from notes and records of the results
from the last part of the DES are shared here to demonstrate attendees’ grasp of the elements of the
systems approach definition.
a) The representative for Click on Green, a formal recycler, said that “the main obstacle to effec-
tively collecting and managing WEEE is the lack of consumer awareness and participation;
that’s why the current system is unsustainable.” The representative went on to add, “to develop
Escenario Simulado
1 5
2 6
3 7
4 8
Escenario Simulado
Escenario Simulado
1 5
2 6
3 7
4 8
Escenario Simulado
Escenario Simulado
1 5
2 6
3 7
4 8
Escenario Simulado
Escenario Simulado
1 5
2 6
3 7
4 8
Escenario Simulado

62
strategies to tackle this obstacle and informal recycling, illegal practices and technical deficien-
cies, the involvement of actors is required”.
b) The MADS representative said that, “homo economicus must be considered when designing
incentives, especially since the informal sector takes advantage of this facet of human beings.”
Nevertheless, “economic incentives might work at first, but, in the long-term, may become un-
sustainable. Given that people in the Colombian context always expect money, environmental
education should be complementary and continually implemented to guarantee sustainability.”
The representative for CI Recyclables SAS, a formal recycler, echoed the MADS’s representa-
tive, saying that “the day there isn’t any money to buy WEEE, the system will collapse.”
c) The MADS representative also proposed that “sustainable WEEE management should include
strategies to minimize waste generation instead of solely looking at the collection of already
generated waste. Strategies, then, could include, for example, both environmental education for
children in schools and young people in universities, and economic incentives for adults.”
d) According to the representative of EcoComputo, a PCP, “it is necessary to make it clear to con-
sumers that environmentally responsible management comes with a cost, which means it isn’t
true that only recyclers earn money.” In this sense, “when consumers deliver their WEEE to the
system, they’re actually making a contribution to the protection of the environment, instead of
just supporting recycling businesses.”
e) The representative for Lito SAS, a formal recycler, said that Colombians “are deeply moved by
both social causes and social recognition. That is why supporting social/environmental projects
is a powerful incentive. Additionally, an interesting complementary incentive could be, for in-
stance, the promotion of the most responsible consumer of the month in media.”
f) According to the representative of the National Cleaner Production Center, a nationally-
recognized expert in WEEE management, “the question should not be about how to avoid pro-
gram costs, because implementing more sustainable WEEE management programs necessarily
entails financial investment. For that reason, the question should refer to where the money is
going to come from and where it will go (within the management processes).”
Previous narratives include the four elements of the systems approach proposed in this research
(see Table 3-14).

63
Table 3-14: Elements of the systems approach to WEEE management included in the narratives com-
prising the last part of the DES
a)
b)
c)
d)
e)
f)
Dif
fere
nt
dim
en
sio
ns o
f th
e
pro
ble
m
Tech
nic
al,
insti
tuti
on
al, leg
al
Eco
no
mic
, cu
ltu
ral
Cu
ltu
ral, e
co
no
mic
,
so
cia
l
En
vir
on
men
tal,
eco
no
mic
, so
cia
l
So
cia
l, c
ult
ura
l,
en
vir
on
men
tal
Eco
no
mic
, lo
gis
tic
Dif
fere
nt
sta
keh
old
er
targ
ets
Co
nsu
mers
, acto
rs
art
icu
lati
on
Co
nsu
mers
, in
form
al
recy
cle
rs,
Co
nsu
mers
,
recy
cle
rs, acad
em
ia
Co
nsu
mers
,
recy
cle
rs
Co
nsu
mers
, so
cie
ty" w
ho
will g
ive t
he
mo
ney
…"
Pro
cesses w
ith
in
WE
EE
man
ag
em
en
t
Co
llecti
on
, re
cy
clin
gC
ollecti
on
, re
cy
clin
g,
man
ag
em
en
t
Gen
era
tio
n,
co
llecti
on
Recy
clin
g,
man
ag
em
en
t
Co
llecti
on
Co
llecti
on
,
man
ag
em
en
t ("
…an
d
wh
ere
…")
Cir
cu
lar
cau
se-e
ffect
rela
tio
nsh
ips
ste
mm
ing
fro
m
cu
rren
t d
ecis
ion
s in
bo
th t
he s
ho
rt-,
med
ium
- an
d lo
ng
-
term
s
" …
th
at
is w
hy
th
e
sy
ste
m is
un
su
sta
inab
le …
" "
… t
o d
ev
elo
p …
en
gag
em
en
t is
req
uir
ed
"
".. w
ork
in
th
e s
ho
rt
term
bu
t …
" "
..
Co
uld
beco
me
un
su
sta
inab
le" "
…
co
nti
nu
ally
imp
em
en
ted
… "
" …
the d
ay
th
ere
is n
o
mo
ney
…" "
… t
he
sy
ste
m w
ill co
llp
ase"
" …
sh
ou
ld in
clu
de
… t
o m
inim
ize …
" "
… t
hen
, th
e
str
ate
gie
s s
ho
uld
inclu
de …
an
d ..."
" …
wh
en
co
nu
sm
ers
deliv
er
…
" "
… m
akin
g a
co
ntr
ibu
tio
n t
o t
he
en
vir
on
men
t …
su
pp
ort
ing
recy
cle
rs"
" …
are
deep
ly
mo
ved
by
…" "
" …
to
im
ple
men
t
mo
re s
usta
inab
le …
it is n
ecessary
…"
Elementstomakemoresystemicdecisionstoachievea
more sustainable WEEE management
Narrati
ve

64
Furthermore, the discussion of criteria and their weights helps paint other perspectives and, in turn,
is conducive to a more systemic understanding of the WEEE management, which is reinforced by
the fact that some attendees proposed additional criteria according to their own worldview as
follows: socio-economic level and geographical origin (e.g. rural, urban) of consumers, additional
incentives such as an advance recycling fee and different types of WEEE (large appliances, for
example).
Although the producer-distributor motivation gap and potential pollution were the least important
criteria for the whole group, two important facts merit highlighting. On one hand, a recycler stated
that the motivation to cooperate should be the most important criterion, for there may be
significant discrepancies between producers and distributors that limit the system’s sustainability.
On the other hand, the representative for the producers chose environmental pollution as the main
criterion within the DES, which aligned with what was learned during activities prior to this
participatory design, in particular the interview (March 2014) and the strategy design (April 2015).

65
4 The Decision-Enhancement Studio (DES) for More Systemic
Decisions
4.1 Introduction
In Chapter 1, the simulation-based approach was proposed as a way to tackle the lack of a systems
approach in decision-making processes. In Chapter 2, the results of the case study laid out the
requirements needed to achieve more sustainable WEEE management, particularly the
requirements needed to design a decision-enhancement studio (DES) that includes people (policy-
makers as the decision makers, and the facilitator), processes guiding the DES as the main
facilitative environment for decisions, technological-tools (T-T) and protocols.
Chapter 3 presented and discussed the DES design, as well as the results of its implementation.
Here, in Chapter 4, the validation is presented. A discussion of validation results supports: i) the
design’s reliability; ii) the utility of a simulation-based approach as part of the T-Ts; and, iii)
provides elements needed to answer the main questions of this doctoral research. For a description
of the scientific and practical contributions of this doctoral research, readers are referred to the
Epilogue (Chapter 5).
4.2 Instruments for Validating the DES
Design science research (DScR) dictates that research cycles include relevance, design, and rigor
(see Section 1.4.2); applying the tenets of DScR, iterative validation processes were developed. In
the relevance cycle, requirements were identified and tested with the main actors involved in
WEEE management in the case studies. To obtain a conceptual model that sufficiently represented
reality, the design cycle relied on a continuous validation not only with real actors in the system,
but also with experts.
First and foremost, the conceptual model of the ABM (as part of the T-T), which was structured
following the ODD protocol and then implemented with the Software NetLogo, was validated at
different moments. Initially, validation was performed pre-DES, which included the evaluation
described in Chapter 3. Then, validation was performed “during;” that is, the DES, the ABM and
simulation, in addition to other tools, were validated during the development of the DES. This
validation employed the technology acceptance model (TAM) instrument, as well as notes and
tapes of key moments of process (e.g. when each group shared individual results before a whole
group discussion of proposed decisions). Finally, validation was performed after the DES: all of
the questionnaires, validation instruments and main group discussions were gathered and analyzed
in order to identify the concepts and arguments of the actors involved.
Some of the instruments used the Likert scale, which ranges from strongly disagree to strongly
agree, as well as a number of Yes/No questions. These were applied to different constructs related
to the artifact under validation. The Likert scale was defined as follows: Strongly disagree (1

66
point), disagree (2 points), neither disagree nor agree (3 points), agree (4 points) and strongly
agree (5 points). Results were analyzed by median and interquartile range (IQR) to obtain a more
accurate representation of the central tendency and the variability in responses. In addition,
analysis focused on the percentage of agree (4) and strongly agree (5) answers given the nature of
Likert scale responses, for as Susan Jamieson (2004) argues, intervals between Likert values
cannot be considered equal, essentially rendering the mean and standard deviation inappropriate
statistics (Jamieson, 2004).
Pre-DES validation focused on Coop4SWEEEM; it was developed with five national and
international experts from two primary fields: WEEE management and agent-based modeling. The
16 DES attendees evaluated both the DES and T-Ts in line with the TAM.
4.2.1 Instrument for Validating Coop4SWEEEM
The validation of the conceptual agent-based model was used to verify that the simulation was
sufficient to elicit the expected discussions within the DES. The constructs, Statements 1 to 13, are
shown in Tables 4.1 and 4.2.
Table 4-1: The constructs (and their arguments) included in the validation of the conceptual model
and its operationalization
Statement Argument
Conceptual model and operationalization
1
The assumptions and theories that constitute the
conceptual model of COOP4SWEEEM-1.0 allow
for the reasonable representation of the model’s
purpose
Theoretical background is important to properly
characterize human decisions in ABM (Feola and
Binder, 2010; Grimm et al., 2010; Müller et al.,
2013)
2
Agent behaviors reasonably represent reality This ABM will support decisions by representing
possible real cooperative scenarios; hence, the accu-
rate representation of reality is important (Grimm et
al., 2010).
3
COOP4SWEEEM-1.0 allows for the identifica-
tion of emergent properties defined in the conceptual
model
To support policy makers in decision making, the
patterns they would like to maximize with the deci-
sion is defined as emergence (Koen H. van Dam,
2013)
Specific statements related to the animation and the output data displayed in the simulation were
tested with the same ABM and WEEE management experts; see Table 4-2.

67
Table 4-2: The constructs (and their arguments) included in the validation of the animation and out-
put data of the computer-based simulation
Statement Argument
Animation Animation is an important communica-
tion tool (Nikolic, I. et al., 2013)
4
Animation allows you to identify the moments when
producers and distributors are most active, that is, when
they are more motivated to cooperate (top of the screen)
In order to successfully implement EPR
strategies, producers and distributor
cooperation is relevant (Kiddee et al.,
2013; Widmer et al., 2005)
5
The animation allows you to identify producers in charge
of PCPs with low rates of WEEE collection from con-
sumers (i.e. malfunctioning PCP), which is a behavior
reflected by low cooperative activity
In a EPR program, the producer is di-
rectly responsible for meeting collection
goals (Lindhqvist, 2000)
6
The simulation allows you to determine which consum-
ers delivered WEEE and which did not in each simulated
scenario
In any waste management program that
implies reverse logistics, it is important
to analyze consumer behavior (Bai and
Sarkis, 2013; Li and Tee, 2012)
Output data Proper visualization caveats are im-
portant communication goals in a ABM
(Nikolic, I. et al., 2013)
7
Changes in producer and distributor motivation to coop-
erate depend on the dynamics of WEEE returned by
consumers
In order to successfully implement EPR
strategies, producers and distributor
cooperation is relevant (Kiddee et al.,
2013; Widmer et al., 2005). Data col-
lected in the exploratory case study, as
well as specific papers, were used to
design these behaviors
8
Distributor motivation to cooperate depends on the in-
crease in potential customers, which is represented as
consumers utilizing the PCP
9
Changes in producer and distributor motivation to coop-
erate are evident at different times: for producers annual-
ly; for distributors, weekly
10
The implementation of post-consumer incentive pro-
grams generates greater consumer return of WEEE
Incentives are important to motivate
consumers participation (Bacot et al.,
1994; Griskevicius and Kenrick, 2013;
Hernandez and Martin-Cejas, 2005). In
addition, economic incentives (Dopfer,
2005; Henrich et al., 2005); socio-
economic causes (Kerr et al., 2012) are
the main motivations—verified in the
massive survey
11
The implementation of economic incentives influences
consumers less than incentives in the form of supporting
socio-environmental projects (compare scenarios)
12
The implementation of post-consumer incentive pro-
grams to consumers generates less potential pollution
than if not offered

68
Statement Argument
Animation Animation is an important communica-
tion tool (Nikolic, I. et al., 2013)
13
The implementation of post-consumer incentive pro-
grams influences the motivation to cooperate in produc-
ers and distributors (circularity of influence)
Causal relationships are relevant in a
systems approach (Andrade et al., 2007;
Nikolic, I. et al., 2013), especially circu-
lar causality: in contrast to systems
thinking, conventional thinking assumes
single causality, rather than multiple,
interrelated causality (Reynolds, 2010)
In the pre-DES evaluations, Coop4SWEEEM’s utility with regard to its support of more systemic
decisions as part of the DES was tested with the following “yes/no” questions (Table 4-3).
Table 4-3: The constructs (and their arguments) included as “yes/no” questions in the validation of
the T-Ts
Y/N Question Argument
14
In your opinion, does the simulation elicit discussion
about more than one process (or stage) within the WEEE
management system as regards the decision-making
process? (e.g. production, generation, collection, pre-
treatment, recycling, recovery, final disposal)
To ensure the inclusion of more than
one WEEE management process as
part of the definition of systems ap-
proach in this research
15
In your opinion, does the simulation elicit discussion
about more than one dimension within the WEEE man-
agement system as regards the decision-making process?
(e.g. technical, social, cultural, environmental, political,
institutional, economic)
To ensure the inclusion of more than
one WEEE management dimension as
part of the definition of systems ap-
proach in this research
16 In your opinion, does the simulation help include the
interests of more than one actor within the WEEE man-
agement system as regards the decision-making process?
(e.g. producer, distributor, consumer, recycler, regulator)
To ensure the inclusion of the interests
of more than one WEEE management
actor as part of the definition of sys-
tems approach in this research
17 In your opinion, does the simulation lead to reflection on
cause-effect relationships as regards the decision-making
process?
To ensure the inclusion of circular
cause-effect way of thinking as part of
the definition of systems approach in
this research
18 In your opinion, does the simulation support the process
to assign weights (in the multi-criteria decision table) to
the criteria used to choose PCP alternatives (designs)?
To ensure a link between the computer-
based simulation and the multi-criteria
decision tool

69
Constructs 14 to 17 are tied to the definition of systems approach to WEEE management proposed
in the present doctoral research.
4.2.2 Technology Acceptance Model (TAM)
The extensively incorporated TAM methodology is based on the Theory of Reasoned Action
model (Ajzen & Fishbein, 1980, cited in Rigopoulos et al., 2008). A fundamental concept of this
theory is that individuals adopt specific behavior if they perceive possible positive outcomes
related to its adoption (Rigopoulos et al., 2008). Figure 4-1 visually represents this theory; as far as
the DES is concerned, the most important part of the figure is the behavioral intention of use.
Figure 4-1: TAM research model (Rigopoulos et al., 2008).
To measure user (read: policy makers) attitudes towards adoption of the DES, TAM was applied
as part of this research to validate the DES of the T-Ts (guideline, Coop4SWEEEM computer-
based simulation, MCDM multi-criteria decision table and questionnaires).
George Rigopoulos, et. al. (2008) used TAM to evaluate user attitudes towards adopting decision
support systems. The researcher’s methodology supported the following hypotheses:
Table 4-4: Hypotheses supported by the TAM (Rigopoulos et al., 2008)
H1 Perceived usefulness will have a positive relationship to behavioral intention
H2 Perceived ease-of-use will have a strong indirect positive relationship to behavioral intention
H3 Perceived ease-of-use will have a less strong direct positive relationship to behavioral intention
H4 Behavioral intention will have a strong positive relationship to system usage
H5 Perceived usefulness and perceived ease-of-use will have a strong positive relationship to behav-
ioral intention
H6 Perceived usefulness and perceived ease-of-use will have a strong positive relationship to actual
usage
The constructs and statements defined to test the hypotheses and validate the DES using
Rigopoulos’ TAM methodology are presented in Table 4-5.
Perceived
usefulness
Perceived
ease of use
Behavioral
intention of useActual usage

70
Table 4-5: TAM constructs. Adapted from (Rigopoulos et al., 2008).
Construct
Perceived Usefulness
19 With the DES decisions are easier
20 With the DES decisions are more accurate
21 With the DES decision are faster
Perceived easy-to-use
22 The tools of the DES are easy to use
23 The tools and methodology of the DES are easy to understand
Behavioral intention to use
24 I think that using the tools of the DES is a good idea
25 I think that using the DES is beneficial for me
26 I have positive perception about using the tools of the DES
Usage
27 I intend to use the tools of the DES
28 I intend to use the DES instead of the traditional procedure
In addition to Constructs 1 to 13, these TAM statements are measured with the aforementioned
Likert scales (strongly disagree, disagree, neither disagree nor agree, agree and strongly agree). As
previously discussed, these data are analyzed using the median and IQR, which allows for a more
accurate representation of the central tendency and variability in responses (Gonzalez, 2010).
The TAM instrument included a question to determine if the systems approach was used in the
DES as part of the decision-making process (Table 4-6).
Table 4-6: “Yes/no” question included in the constructs (and their arguments) for validation of the
decision systemicity
29
In your opinion, the decision was made following a more systems-based approach than tradition-
ally done? (e.g. it took more than one dimension into account, such as the interests of more than
one actor, more than one management phase and the logic of cause-effect)

71
4.3 Validation Results
4.3.1 Coop4SWEEEM
The five experts participating in this portion of the validation represented the following
organizations: the Ministerio de Ambiente y Desarrollo Sostenible (MADS), the Centro Nacional
de Producción Más Limpia (CNPML), the Swiss Federal Laboratory for Materials, Technology
and Society (Empa) and Los Andes University (in Bogotá, Colombia).
Important adjustments were made to the conceptual design of Coop4SWEEEM on the basis of the
first two validations. Specifically, as part of the initialization and input data, the diffusion of
information was put into effect in order to increase consumer awareness of PCPs. Furthermore, in
the Animation Area, the color and size of consumer agents were improved to more clearly indicate
which consumers delivered WEEE to the PCPs. The third and final adjustment consisted of
displaying the WEEE collected by each PCP instead of the total amount. The first 2 validations—
of 5 total—served to modify the model, a sort of pre-validation, before the final three validations
were performed (see Table 4-7 below). Due to the low number of evaluators (5 national and
international experts), the IQR was not included in this part of the analysis.
After making these adjustments, Constructs 1, 2 and 3 were evaluated with an expert in agent-
based modeling. The expert concurred (“strongly agree”) that “the assumptions and theories that
constitute the conceptual model of Coop4SWEEEM allow for the reasonable representation of the
model’s purpose.” Moreover, the expert “strongly agrees” that it “allows for the identification of
emergent properties defined in the conceptual model.” Moreover, the expert agreed with the
statement that “Agent behaviors reasonably represent reality.”
Table 4-7: Pre-DES validation of Coop4SWEEEM
Construct
SD
(1)
D
(2)
nAn
D
(3)
A
(4)
SA
(5) Median %4-5
The animation
4
The animation allows you to identify the mo-
ments when producers and distributors are most
active, in terms of a greater motivation to coop-
erate (top of the screen animation)
2 1 4 100
5
The animation allows you to identify producers
who lead the post-consumption program that has
low rates of collection of WEEE from consum-
ers (that is malfunctioning PCP), behavior re-
flected in the low cooperative activity
1 1 1 4 67
6
The simulation allows you to differentiate consumers
that deliver WEEE and not in each simulated scenario
1 2 5 100

72
Construct
SD
(1)
D
(2)
nAn
D
(3)
A
(4)
SA
(5) Median %4-5
The output data
7
Changes in producer and distributor motivation
to cooperate depend on the dynamics of WEEE
returned by consumers
1 2 5 67
8
Distributor motivation to cooperate depends on
the increase in potential customers, which is
represented as consumers utilizing the PCP
1 2 5 100
9
Changes in producer and distributor motivation
to cooperate are evident at different times: for
producers annually; for distributors, weekly
3 5 100
10
The implementation of post-consumer incentive
programs generates greater consumer return of
WEEE
3 5 100
11
The implementation of economic incentives
influences consumers less than incentives in the
form of supporting socio-environmental projects
(compare scenarios)
2 1 4 100
12
The implementation of post-consumer incentive
programs to consumers generates less potential
pollution than if not offered
3 5 100
13
The implementation of post-consumer incentive
programs influences the motivation to cooperate
in producers and distributors (circularity of in-
fluence)
1 2 5 67
SD: Strongly disagree; D: Disagree; nAnD: neither Agree nor Disagree; A: Agree; SA: Strongly agree
As evinced by the high percentage of 4 and 5 answers, signifying “agree” and “strongly agree,”
respectively, experts manifested their support of the animation and output data. However, the
results of the Constructs 5, 7 and 13, all related to producer and distributor cooperation, had 67%
of experts respond with 4 or 5, revealing a relatively less clear judgment regarding these outputs.
The three neutral opinions that led to this percentage were assigned by the same expert who,
despite the inclusion of a cooperation sub-model in Coop4SWEEEM, failed to understand the prior
validation, which became patently clear when the expert answered the TAM evaluation as follows:
T-Ts were easy to use (“strongly agree) and easy to understand (“agree”).

73
Moreover, the median of 4 and 5 in all constructs further supports the fact that none of the experts
disagreed; in other words, the unambiguous consensus was that the simulation represented the
intended behaviors included in the ABM.
Looking at the validation of the model’s systemicity, per the definition of systems approach to
WEEE management included in this part of the validation (Table 4-8), only Construct 14 failed to
obtain 100% positive responses, which proved coherent with the specific goal of the simulation.
To remind readers, the specific goal of this simulation was to address the urgent decision of “How
to influence consumer behavior in order to increase WEEE collected,” which refers only to the
collection process. However, the DES’s goal is broader than that of the T-Ts; the DES aimed to
“Decide on aspects that affect sustainability in WEEE management in Colombia.” In any case, the
low response to Construct 14 is logical and, in fact, along with other aspects, was validated and
supported by TAM results.
Table 4-8: Results for yes/no questions included in the pre-DES validation instruments
Question %Yes
14
In your opinion, does the simulation elicit discussion about more than one pro-
cess (or stage) within the WEEE management system as regards the decision-
making process? (e.g. production, generation, collection, pre-treatment, recy-
cling, recovery, final disposal)
60
15
In your opinion, does the simulation elicit discussion about more than one dimen-
sion within the WEEE management system as regards the decision-making pro-
cess? (e.g. technical, social, cultural, environmental, political, institutional, eco-
nomic)
100
16
In your opinion, does the simulation help include the interests of more than one
actor within the WEEE management system as regards the decision-making pro-
cess? (e.g. producer, distributor, consumer, recycler, regulator) 100
17 In your opinion, does the simulation lead to reflection on cause-effect relation-
ships as regards the decision-making process? 100
18
In your opinion, does the simulation support the process to assign weights (in the
multi-criteria decision table) to the criteria used to choose post-consumer pro-
gram alternatives (designs)? 100
4.3.2 TAM results
The 16 validations arrived at upon concluding the DES meant it was possible to calculate the IQR,
median and percentage of 4 (agree) and 5 (strongly agree) answers; these data were included in the
TAM analysis (Table 4-9).

74
Table 4-9: TAM results
Construct SD D nAnD A SA Median IQR % 4
and 5
Perceived Usefulness
20 With the DES decisions are easier 1 2 8 5 4 - 0.81
21 With the DES decisions are more
accurate
2 3 11 4 1.5 0.69
22 With the DES decision are faster 1 5 8 2 4 2 0.63
Perceived ease-of-use
23 The tools of the DES are easy to use 9 7 4 - 1.00
24 The tools and methodology of the
DES are easy to understand
1 1 8 6 4 - 0.88
Behavioral intention to use
25 I think that using the tools of the DES
is a good idea
9 7 4 - 1.00
26 I think that using the DES is beneficial
for me
12 4 4 - 1.00
27 I have positive perception about using
the tools of the DES
1 11 4 4 - 0.94
Usage
28 I intend to use the tools of the DES 1 11 4 4 - 0.94
29 I intend to use the DES instead of the
traditional procedure
5 6 5 4 1 0.69
SD: Strongly disagree; D: Disagree; nAnD: neither Agree nor Disagree; A: Agree; SA: Strongly agree
On one hand, the attendees agreed on the perceived ease-of-use and their behavioral intention to
use the DES and T-Ts. On the other, some attendees either disagreed or were neutral about the
perceived usefulness and usage. At first, the majority of the attendees agreed that making decisions
was easier with the DES (Construct 20). Nevertheless, despite a median answer of 4—a sign that
the decision was more accurate and faster—both the IQR (1.5 and 2 respectively) and the
percentage of 4 and 5 (69 and 63 %, respectively) answers speak to some level of disagreement.
According to the opinions expressed by attendees who disagreed or were neutral, this low rating is
connected to their perception that the technological tools require users to come from the specific
context of WEEE management and/or hail from a metropolitan area.
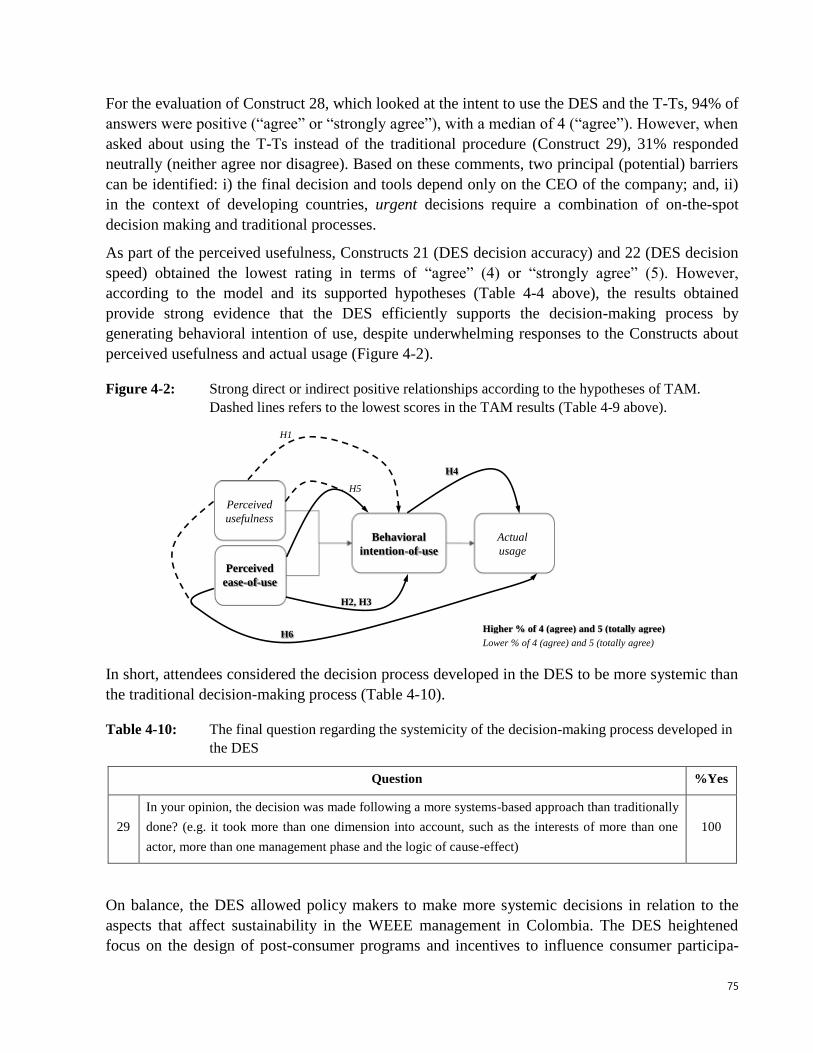
75
For the evaluation of Construct 28, which looked at the intent to use the DES and the T-Ts, 94% of
answers were positive (“agree” or “strongly agree”), with a median of 4 (“agree”). However, when
asked about using the T-Ts instead of the traditional procedure (Construct 29), 31% responded
neutrally (neither agree nor disagree). Based on these comments, two principal (potential) barriers
can be identified: i) the final decision and tools depend only on the CEO of the company; and, ii)
in the context of developing countries, urgent decisions require a combination of on-the-spot
decision making and traditional processes.
As part of the perceived usefulness, Constructs 21 (DES decision accuracy) and 22 (DES decision
speed) obtained the lowest rating in terms of “agree” (4) or “strongly agree” (5). However,
according to the model and its supported hypotheses (Table 4-4 above), the results obtained
provide strong evidence that the DES efficiently supports the decision-making process by
generating behavioral intention of use, despite underwhelming responses to the Constructs about
perceived usefulness and actual usage (Figure 4-2).
Figure 4-2: Strong direct or indirect positive relationships according to the hypotheses of TAM.
Dashed lines refers to the lowest scores in the TAM results (Table 4-9 above).
In short, attendees considered the decision process developed in the DES to be more systemic than
the traditional decision-making process (Table 4-10).
Table 4-10: The final question regarding the systemicity of the decision-making process developed in
the DES
Question %Yes
29
In your opinion, the decision was made following a more systems-based approach than traditionally
done? (e.g. it took more than one dimension into account, such as the interests of more than one
actor, more than one management phase and the logic of cause-effect)
100
On balance, the DES allowed policy makers to make more systemic decisions in relation to the
aspects that affect sustainability in the WEEE management in Colombia. The DES heightened
focus on the design of post-consumer programs and incentives to influence consumer participa-
H1
H2, H3
H4
H5
H6
Perceived
usefulness
Perceived
ease-of-use
Behavioral
intention-of-use
Actual
usage
Higher % of 4 (agree) and 5 (totally agree)
Lower % of 4 (agree) and 5 (totally agree)

76
tion. Nevertheless, based on the author of this doctoral research’s experience as facilitator (while
simultaneously being a researcher) and suggestions made by attendees in the validation forms, two
points merit further attention in similar exercises. First, if the time required to implement the DES
is less than 4 hours, this should suffice to adequately address 4 scenarios (rather than the eight
proposed in Chapter 3). Second, the primary cause of the 5 “neutral” (and 1 “disagree”) answers to
the Construct referring to decision speed (“the decision was faster”) was the delay in understand-
ing how to use the T-Ts. Thus, to streamline this process, instead of explaining the tools pre-DES
implementation, the simulation and the multi-criteria decision table should be explained through
the development of one complete exercise (simulation and prioritization with the T-Ts).

77
5 Epilogue
The biggest issue facing management of the Waste Electrical and Electronic Equipment(WEEE) in
developing countries is the lack of a systems approach in decision making. The unsustainability of
WEEE management systems can be seen in the presence of WEEE discarded in public areas and
sanitary landfills, informal recycling, public health hazards, pollution, equipment smuggling, lack
of cooperation among stakeholders and low rates of WEEE collection.
Working from the hypothesis that more systemic decision making improves the sustainability of
WEEE management systems, this chapter presents answers to the proposed research questions, the
contributions of this doctoral research and areas that merit further investigation.
5.1 Findings
Using the Design Science Research (DScR) as methodological strategy, the cycles of relevance,
design and rigor were linked as part of the progressive problem solving process.
The first research question (RQ1) posed the following: “How can we design decision-enhancement
studios (DES) to support policy-makers in the creation of sustainable WEEE Management
programs in developing countries?” First of all, the idea of designing the design problem helps
designers arrive at deeper understanding of the problematic situation. Likewise, it emphasizes the
importance of clearly defining the problem, clearly delimiting the criteria to be used in the
evaluation of proposed solutions and clearly defining the solution space.
To facilitate the understanding of the problem situation, Actor-Network Theory (ANT) is
recommended to recognize the knowledge gleaned from related experiences, whether successful or
not.
Given that a DES engages people (decision makers and the facilitator), processes (protocols and
guidelines) and technology (technological tools, or T-T), it is crucial to involve relevant actors that
participate in all the design process. Relevant actors were defined in this thesis as policy makers
within the WEEE management system.
The DES structure allows designers to tackle two levels of goals: i) the general DES goal; and ii)
the specific assigned goals of the T-Ts used in the DES. Due to this two-level goal, the DES
accounts for constraints deemed capable of hindering the design of the solution. Example
constraints include: the implausible, but required involvement, of all relevant actors (e.g.
consumers in the case study) or pragmatic requirements, such as the definition of boundaries in the
conceptual and computational model used in the technological tools.
Once the understanding and design of the problematic situation has been achieved, the design of
the T-Ts becomes a relevant facet of the DES design, notably computer-based simulations in
which relevant actors also took part. In general terms, the technological tools aimed to facilitate an
understanding of what it means to adopt a “systems-based approach” about a problem situation,
which, in turn, was ultimately geared towards sparking dialogue among policy makers. ANT

78
provided the opportunity for understanding the problem and using elements to design the tools. In
addition, ANT facilitated the identification of the role played by regulations and laws in terms of
aligning relevant actors’ interests. Verification of ANT’s contributions came in the form of the
motivation and active participation of policy makers in the design of the national policy for WEEE
management in the country as part of the case study.
In the case of this doctoral research, the goal of the solution arrived at via the proposed design was
to highlight the system’s effects on the aggregation of individual interests and on the decisions of
different actors by showing emergent phenomena. In so doing, the solution stimulates learning
processes in decision-makers, which frames an agent-based model (ABM) as the best option. This
research further proposes the use of ANT to the design of an ABM; the two naturally prove a
productive combination in light of their conceptual similarities, such as parallels between Actor-
Networks (A-N) and agents or A-N moments of translation and agent decision making.
To motivate the active participation and thereby obtain better results, a shared common
understanding of the most important concepts related to the problem situation and the solution
must be attained. In particular, as pertains to the DES designed in this research, the systems
approach concept was proposed to policy makers, and duly accepted. Additionally, concepts such
as Extended Producer Responsibility (EPR), cooperation and post-consumer programs (PCP) were
also accepted during the design activities and in the implementation of the DES.
The second research question focuses on the essential elements that enhance systemicity in
decision-making for WEEE management (RQ2: What are the essential elements needed to
enhance systemicity in decision-making for WEEE management?). WEEE management is a socio-
technical system that relies on technical artifacts to achieve material goals, and it is strongly
influenced by human behaviors and the decisions of several social actors. Thus, to strengthen its
sustainability a systems approach is required not only for the design of solutions, but also in the
identification and structuring of the problem situation. DES design in this doctoral research
involved policy makers using a policy design process that operated from a shared understanding of
the concept of systems approach. Readers should recall the definition of systems approach in this
doctoral research: systemic decision making requires the comprehension of the entire (WEEE
management) system and its behavior over time. For that reason, policy makers should include the
following elements in the decision-making process:
i) Different dimensions of the problem. Despite the seemingly one-dimensional nature of
the problematic situation to which a policy decision is destined, e.g. “just” a social issue
or “just” an economic one, in the case of the WEEE management, policy makers should
include socio-cultural, environmental, technical, economic, institutional and legal di-
mensions.
ii) Different stakeholders’ targets. The whole system is constituted by different stakehold-
ers; in other words, the entire system is made up of a multitude of perspectives. To reach
a decision that supports more sustainable strategies, the concepts, knowledge and inter-
ests of these different stakeholders cannot be ignored. If, say, the decision is about how
to strengthen consumption responsibility in consumers, three different sets of targets
79
must be considered: Consumer targets (Why they use or buy equipment? What do they
usually do with the WEEE? What motivations/incentives would get them to participate
in PCPs?); producer targets (What criteria are used to design new equipment? What are
the goals of media campaigns and marketing strategies? What motivations/incentives
would get them to consider strategies related to the waste generated by the equipment
they sell? Are responsible consumption strategies actually beneficial for producers?);
and environmental authority targets (Are they interested in environmental protection in
order to preserve natural resources or to respond to international pressure? Do they have
sufficient capacity to support the implementation, monitoring and control of the strate-
gy?).
iii) Processes within WEEE management. The generic stages of waste management are
generation, segregation, collection, transfer, treatment, recovery and disposal. However,
the systems approach and the nature of the WEEE demand the inclusion of processes
that precede WEEE generation, including production, distribution, use and reuse of elec-
trical and electronic equipment, as well as mining to extract raw materials used for the
production of this equipment.
iv) Circular cause-effect relationships resulting from current decisions focused on the short-
and long-terms. As part of this way of thinking, discussions about past facts, regardless
of their success, are key to understanding the motivations of actors and encouraging re-
flection in policy makers about the possible future effects of current decisions.
Pragmatically speaking, not all aspects of each element described above can be included. Yet, to
increase systemicity in decision-making processes, policy makers should include at least some of
them the aforementioned four elements. As demonstrated by the validation procedure described in
the previous chapter, the DES designed herein helped bring about a systemic process.
5.2 Contributions
Insofar as this research tackles a real-world problem and WEEE management involves several
actors inside and outside of academia, understanding the problem situation requires identifying
actors’ participation not only for the relevance cycle addressed by the research method, but also
for the design; the importance of including actor participation was discussed in Chapter 1.
Furthermore, the methodological strategy applied facilitated mutual-learning processes and
allowed for the creation of solution-oriented knowledge that led to practical and theoretical results.
Taken together, these characteristics point to the value of employing a transdisciplinary approach
when it comes to solving real-world problems, for this type of approach allows researchers to
deliver three levels of contributions: outputs (short-term, immediate contributions), impacts
(medium-term, intermediate contributions) and outcomes (long-term contributions). Even though
the distinction between outputs, impacts and outcomes was not easy, these distinctions supported
reflections on the short-, medium- and long-term effects of decisions. Table 5-1 presents the
tangible and intangible outputs of this doctoral research.

80
Table 5-1: Outputs, or short-term contributions
Contribution Tangible Intangible
Outputs (short-term
contributions)
Workshops and reports Defining boundaries and participatory poli-
cy design methods
Presentations at international conferences
and publications ANT in the design of ABM
EEE consumer characterization
Systems approach to WEEE management
seen in processes, actors, dimensions and
multi-causality (knowledge of the system
and transformation of this knowledge into
desired knowledge)
Pontificia Universidad Javeriana’s Eco-
logical and Environmental Policy
Policy for Integral WEEE management
in Colombia
The decision-enhancement studio (DES)
Tangible outputs were identified as the workshops as part of the participatory policy design and
reports on partial workshops and interview results, which were aimed at increasing the interest of
actors involved.
In addition, tangible outputs included presentations at relevant conferences (Méndez-Fajardo et al.,
2015; S. Méndez-Fajardo et al., 2013; S Méndez-Fajardo et al., 2013; Méndez-Fajardo and
Gonzalez, 2014; Ortega R., M. et al., 2013), through which the use of ANT with regard to
Colombia’s WEEE management, the agent-based model designed and systemic decisions on
WEEE management were shared with different scientific communities. In addition, three non-
scientific publications formed part of the case study at the university and were published in the
monthly university magazine “Hoy en la Javeriana” (Mejía, 2013; Méndez-Fajardo, 2013a,
2013b). Looking at scientific publications, a paper (Méndez-Fajardo and González, 2014) and a
book chapter (Méndez-Fajardo, et al., 2016 - in press) on the use of ANT in the design of ABMs
stemmed from this research. Likewise, the two policies designed were also tangible short-term
contributions, not to mention the DES as designed artifact. The DES includes the ABM and
Coop4SWEEEM simulation, as well as the multi-criteria table.
The virtual survey made it possible to characterize EEE consumers as part of the tangible outputs.
Parameters included were related to re-use behaviors, changing and storing equipment, as well as
discarding WEEE and motivations to participate in existing and future PCPs.
Turning attention to intangible outputs (see Table 5-1 above), the methodological experience was
important in the following moments: the definition of the focal problem to address with the
technological tools (the urgent decision); in turn, this defined the boundaries of the system to
model and simulate. Both the definition of structural causes and policy strategy design were
methodological and social experiences. Organizational experience increases the opportunity to
bring different actors into the decision-making process, and the continuous interaction of
participation built trust among the actors. This latter contribution is categorized here as a social
experience because positive interactions build trust.

81
Impacts and outcomes are included in Table 5-2 below. In the table, tangible impacts refer mainly
to the influence of tangible outputs on actions, decisions or plans after the transdisciplinary
project. Along with actor participation, changes in language and concepts related to the systems
approach on WEEE management and sustainability are the most important tangible impact. The
experience of one of the formal recyclers participating in all workshops exemplifies this impact: at
the beginning of the second workshop, three months after which the systems approach was
initially broached, the formal recycler said that, “in order to illustrate to our friends who could not
make it to the first workshop, I would like to hear the explanation of a systems approach again.”
During discussion in the same workshop, he highlighted the relevance of “taking into account the
ideas geared towards minimizing WEEE generation,” even though, as a recycler, it would be in his
best interest to increase WEEE. In the DES (9 months later), he was one of the most active actors,
notably asking, “How can these technological tools help us to achieve more sustainable WEE
management?” Following the session, he wrote, “Strategies that only consist of economic
incentives or dissemination of information are bound to have a very poor effect on the amount of
WEEE collected.” Thus, he proposed “the most important criterion to design a post-consumer
program should be strengthening environmental awareness in consumers.”
A review of this actor’s initial statements, coupled with his participation, is a testament to the
effect of the design process and DES on his decision-making process, which began with the
definition of a systems approach as “one that takes different actors into account.”
Table 5-2: Impacts (medium-term contributions) and outcomes (long-term contributions)
Contribution Tangible Intangible
Impacts (medium-term
contributions)
Transform actors’ concepts
Improved actor understand-
ing of the system and other
actors’ viewpoints
Create Pontificia Universidad Javeriana’s Environmen-
tal Committee
Develop system knowledge and target knowledge for
policy design from a systems-based approach
Outcomes (long-term
contributions)
Fulfillment of the goal of the thesis
Increased decision-making
capacity of practitioners and
scientists
Implement the Pontificia Universidad Javeriana’s Envi-
ronmental Management Plan
Implement (future) the decision reached in this doctoral
research; future decision-enhancement studios imple-
mented to support different policy decisions
Looking at the university context, in spite of successful projects born out of scholars’ interests,
these scholars have not been actively involved in decision-making. Nevertheless, recent policy has
led to a number of scholars forming part of the new environmental committee; the organizational
change proposed by the Pontificia Universidad Javeriana’s rector was instrumental in this respect.
In 2016, the rector explicitly designated this committee with designing an action plan to

82
implement the policy’s strategies, which guarantees the future emergence of new milestones on the
path to a more sustainable campus.
An intangible impact of the outputs (Table 5-1) is the cultivation of system knowledge and its
application to policy design, not to mention the alignment of target knowledge and a systems
approach. The achievement of this intangible impact entailed moments of participation and,
perhaps more importantly, the shared concepts of a systems approach. In line with the specific
topic for which the policy (i.e. decision to be made) was developed, the aspects of each of the four
elements are subject to change, though the elements (dimensions, actors’ interests, processes and
circular cause-effect in time) are not necessarily subject to change.
Intangible impacts refer to cognitive impacts. The DES improved systemic knowledge; moreover,
participants may leverage their experience(s) to promote skills such as the deeper understanding of
others’ viewpoints. This is a key part of achieving more successful decisions in the future and
developing more stable and reliable networks.
Beyond the scope of this doctoral thesis, outcomes include the future implementation of the
University Environmental Management Plan. There are two ways to enact the tangible outcome of
Future (potential) DES implementation. First, the characterization of consumers offers additional
attributes of consumers (as agents) and potential new rules in the ABM that can be implemented to
simulate alternative PCP properties. In fact, this represents a potential tangible output insofar as
the additional DES could support future decisions related to WEEE management at the country
level. Second, there is the opportunity to implement the vision at the university level, as well as
some of the scenarios discussed within the DES, e.g. a pilot project for the design of more
effective strategies at the local, regional or national levels.
Last but not least, another output is the author of this work’s increased knowledge of WEEE
management, decision-making, systems approach, modeling and programming. As a civil
engineer—academically speaking, the highest growth discipline—the author was educated in the
concepts and tools of systems engineering and social sciences, such as ANT and the development
of ABMs. Undoubtedly, these skills will allow the author to lead interdisciplinary projects in other
environmental and civil engineering fields aimed at sustainability.
5.3 Reflections on the research strategy and techniques employed herein
Among the multiple influences that have shaped the contemporary systems approach, the soft
systems tradition (mores than the hard or the critical traditions) is the closest to a conceptual frame
for this doctoral research. In addition to the explicit use of a systems approach in the DES, which
was as the main artifact designed, the methodological strategy used in this doctoral research, the
Design Science Research (DScR), may also be systemic. Both the strategy and techniques
employed herein contain elements of the following systemic strategies: the ‘soft systems
methodology’ (SSM) proposed by Checkland (2001; 1984), or the ‘inductive-hypothetical
strategy’ (IHS) proposed by Sol (Sol, 1982) and based on Churchman’s Singerian Inquiry
Systems; IHS can be characterized by arriving at an understanding pre-design, whereas DScR

83
stresses understanding through design (Diggelen, 2011). DScR shares the SSM goal of intervening
in a problematic situation and embracing divergent views about the definition of the problem
itself, which even may not be easily agreed upon (Reynolds, 2010).
In this doctoral research, the DScR also included an important level of researcher participation, as
is the case for action research. Yet, researcher participation pales in comparison to the importance
of achieving participation by the relevant actors, especially given the time required to conduct
interviews, workshops and meetings. Fortunately, however, the exploratory case study in this
doctoral research coincided with the actual policy design process, which helped ensure relevant
actor participation.
Critical realism, the philosophical approach of this research, relies on a broad range of techniques,
and this research was no exception. Some techniques were interpretive (ANT) and some positivist
(the Technology-Acceptance Model), yet all had pragmatic goals. In the face of the limitations
associated with the dearth of statistical data related to the WEEE management, the methods used
herein included participative simulation as action and as a learning strategy. The ABM made this
possible, for it represents complexity with limited information, limited material resources and
limited computational capabilities.
5.4 Further research
Real-world problems, in this case WEEE management, can be tackled two ways, which can be
considered opposing or complementary. One is the preventive approach focused on reducing
WEEE generation and, correspondingly, decreasing EEE consumption. The other is the reactive
approach, which guides actions towards the responsible collection and treatment of already
generated waste.
Responsible consumption involves both approaches. A responsible consumer should decide to buy
or reuse equipment based on economic and aesthetic criteria and on environmental and ecological
criteria, the latter two being related to the minimization of waste generation. A responsible
consumer should also make an informed decision regarding WEEE disposal, that is, disposal
through formal systems (part of their behavior). Invariably, emotions play a crucial role in
consumer decisions. As a result, these decisions are intimately connected to the consumer
characterization performed in this doctoral research with the hope of arriving at a profound
comprehension of consumers and thereby exploring additional incentives to strengthen the
responsible consumption.
When combining the EPR principle and the two types of approach (preventive or reactive), the
result is two differing “directions”: the preventive is upstream, focusing on green design, design
for recycling and cleaner production, and the reactive is downstream, focusing on collection and
recycling programs and technology recovery. The DES designed in this doctoral research
emphasized the latter approach, the downstream direction, in light of the pressing (urgent) decision
to address WEEE management in developing countries. However, that does not mean upstream-
oriented policies were ignored, for these are required to strengthen a systemic approach to policy

84
design, and the present doctoral research invites future policies aimed at addressing needs beyond
the urgent (precisely the philosophy of a preventive approach).
As part of the preventive approach, research that aims to involve policy makers and relevant
operational actors related to mining activities should be carried out for, in light of mining’s
relevance as one of the most significant problems in Colombia (e.g. informal recycling) and other
developing countries. In fact, urban mining, aimed at incorporating informal recyclers into the
formal system, becomes the opportunity to minimize the exploitation of virgin materials needed
for EEE production.
Finally, extensions of Coop4SWEEEM could be used to examine the differences between
collective and individual PCPs, as well as the ways in which the methods of WEEE collection, and
subsequent storage, affect distributor motivation (e.g. when delays occur). Furthermore, the
Coop4SWEEEM could be of use in the exploration of the effect of different regulatory scenarios
on motivation to cooperate as pertains to sustainability, especially in the case of developing
countries.

85
6 References
Abu Qdais, H.A., 2007. Techno-economic assessment of municipal solid waste management in Jordan.
Waste Manage. 27, 1666–1672. doi:10.1016/j.wasman.2006.08.004
Achillas, C., Vlachokostas, C., Moussiopoulos, N., Banias, G., 2010. Decision support system for the
optimal location of electrical and electronic waste treatment plants: A case study in Greece. Waste
Manage. 30, 870–879. doi:10.1016/j.wasman.2009.11.029
Agamuthu, P., Victor, D., 2011. Policy trends of extended producer responsibility in Malaysia RID B-8145-
2010. Waste Management & Research 29, 945–953. doi:10.1177/0734242X11413332
Ahluwalia, P.K., Nema, A.K., 2007. A life cycle based multi-objective optimization model for the
management of computer waste. Resour. Conserv. Recycl. 51, 792–826.
doi:10.1016/j.resconrec.2007.01.001
Ajzen, I., 1991. The theory of planned behavior. Organizational Behavior and Human Decision Processes,
Theories of Cognitive Self-Regulation 50, 179–211. doi:10.1016/0749-5978(91)90020-T
Alves, M.C.M., Lima, B.S.L.P., Evsukoff, A.G., Vieira, I.N., 2009. Developing a fuzzy decision support
system to determine the location of a landfill site. Waste Manage. Res. 27, 641–651.
doi:10.1177/0734242X09103832
Amoyaw-Osei, Y., Agyekum, O.O, Pwamang, J.A., Mueller, E, Fasko, R., Schluep, M., 2011. Ghana e-
Waste Country Assessment.
Andrade, H., Dyner, I., Espinosa, A., López Garay, H., Sotaquirá, R., 2007. Pensamiento sistémico:
Diversidad en búsqueda de unidad. Ed. Universidad Industrial de Santander.
Antanasijevic, D., Pocajt, V., Popovic, I., Redzic, N., Ristic, M., 2013. The forecasting of municipal waste
generation using artificial neural networks and sustainability indicators. Sustainability Science 8,
37–46. doi:10.1007/s11625-012-0161-9
Araújo, M.G., Magrini, A., Mahler, C.F., Bilitewski, B., 2012. A model for estimation of potential
generation of waste electrical and electronic equipment in Brazil. Waste Management 32, 335–342.
doi:10.1016/j.wasman.2011.09.020
Armijo de Vega, C., Ojeda Benitez, S., Ramirez Barreto, M.E., 2008. Solid waste characterization and
recycling potential for a university campus. Waste Management 28, Supplement 1, S21–S26.
doi:10.1016/j.wasman.2008.03.022
Armstrong, R., Baillie, C., Cumming-Potvin, W., 2014. Mining and Communities: Understanding the
Context of Engineering Practice. Synthesis Lectures on Engineers, Technology and Society 8, 1–
148. doi:10.2200/S00564ED1V01Y201401ETS021
Bacot, H., Bowen, T., Fitzgerald, M.R., 1994. Managing the solid waste crisis: exploring the link between
citizen attitudes, policy incentives, and siting landfills. Policy Studies Journal 22, 229–244.
Bai, C., Sarkis, J., 2013. Flexibility in reverse logistics: a framework and evaluation approach. Journal of
Cleaner Production 47, 306–318. doi:10.1016/j.jclepro.2013.01.005
Bauman, Z., 2007a. Vida de consumo (Sociologia), 1st ed. Fondo de Cultura Económica.
Bauman, Z., 2007b. Tiempos líquidos: Vivir una época de incertidumbre, Edición: Tra. ed. Tusquets
Editores S.A., Barcelona.
Benitez, S.O., Lozano-Olvera, G., Morelos, R.A., de Vega, C.A., 2008. Mathematical modeling to predict
residential solid waste generation. Waste Manage. 28, S7–S13. doi:10.1016/j.wasman.2008.03.020
Bialowas, Y.D., Sullivan, E.C., Schneller, R.D., 2006. Designing a Low-Cost Pollution Prevention Plan to
Pay Off at the University of Houston. Journal of the Air & Waste Management Association 56,
1320–1324.

86
Binder, C.R., Absenger-Helmli, I., Schilling, T., 2015. The reality of transdisciplinarity: a framework-based
self-reflection from science and practice leaders. Sustain Sci 10, 545–562. doi:10.1007/s11625-
015-0328-2
Böni, H., Schluep, M., Widmer, R., 2015. Recycling of ICT Equipment in Industrialized and Developing
Countries, in: Hilty, L.M., Aebischer, B. (Eds.), ICT Innovations for Sustainability, Advances in
Intelligent Systems and Computing. Springer International Publishing, pp. 223–241.
Briones, G., 2003. Metodos y tecnicas de investigacian para las ciencias sociales / Research Methods and
Techniques for the Social Sciences. Editorial Trillas Sa De Cv.
Brunner, P.H., 2011. Urban Mining A Contribution to Reindustrializing the City. Journal of Industrial
Ecology 15, 339–341. doi:10.1111/j.1530-9290.2011.00345.x
Callon, M., 1986a. Some elements of a sociology of translation: domestication of the scallops and the
fishermen of St Brieuc Bay. Sociological Review Monograph 32.
Callon, M., 1986b. Some elements of a sociology of translation: domestication of the scallops and the
fishermen of St Brieuc Bay.
Carter, C.R., Rogers, D.S., 2008. A framework of sustainable supply chain management: Moving toward
new theory. International Journal of Physical Distribution and Logistics Management 38, 360–387.
Caterino, N., 2009. Comparative Analysis of Multi-Criteria Decision-Making Methods for Seismic
Structural Retrofitting. Comput. -Aided Civil and Infrastructure Engineering 24.
CEPAL, Pacheco, J.F., Ortegón, E., Prieto, A., 2005. Metodología del marco lógico para la planificación, el
seguimiento y la evaluación de proyectos y programas.
Chang, Y., Chang, N., Ma, G., 2001. Internet Web-based information system for scrap vehicle disposal in
Taiwan. Environ. Model. Assess. 6, 237–248. doi:10.1023/A:1013369514320
Checkland, P., 2001. Soft systems methodology: a 30-year retrospective. John Wiley, New York.
Checkland, P., P., 1984. Rethinking a Systems Approach. Pergamon Press, Oxford, UK, pp. 43–60.
Chi, X., Streicher-Porte, M., Wang, M.Y.L., Reuter, M.A., 2011. Informal electronic waste recycling: A
sector review with special focus on China. Waste Manage. 31, 731–742.
doi:10.1016/j.wasman.2010.11.006
Chiou, C.Y., Chen, H.C., Yu, C.T., Yeh, C.Y., 2012. Consideration Factors of Reverse Logistics
Implementation -A Case Study of Taiwan’s Electronics Industry. Procedia - Social and Behavioral
Sciences 40, 375–381. doi:10.1016/j.sbspro.2012.03.203
Christensen, T.H., Simion, F., Tonini, D., Moller, J., 2009. Global warming factors modelled for 40 generic
municipal waste management scenarios. Waste Manage. Res. 27, 871–884.
doi:10.1177/0734242X09350333
Correa-Moreira, G.M., 2011. El concepto de mediación tecnológica en Bruno Latour. Una aproximación a
la Teoría del Actor Red. Technological mediation in Bruno Latour. An approach at Actor Network
Theory. Psicología, Conocimiento y Sociedad 2, 54–79.
Craig R. Carter, Dale S. Rogers, 2008. A framework of sustainable supply chain management: moving
toward new theory. Int Jnl Phys Dist & Log Manage 38, 360–387.
doi:10.1108/09600030810882816
Dam, K.H. van, Nikolic, I., Lukszo, Z., 2012. Agent-Based Modelling of Socio-Technical Systems.
Springer.
DANE, 2016. Contador de Poblacion [WWW Document]. URL
http://www.dane.gov.co/reloj/reloj_animado.php (accessed 2.2.16).
Davis, F.D., 1993. User acceptance of information technology: system characteristics, user perceptions and
behavioral impacts. doi:http://dx.doi.org/10.1006/imms.1993.1022

87
Desa, A., Kadir, N.B.A., Yusooff, F., 2011. A Study on the Knowledge, Attitudes, Awareness Status and
Behaviour Concerning Solid Waste Management. Procedia - Social and Behavioral Sciences 18,
643–648. doi:10.1016/j.sbspro.2011.05.095
Diggelen, W. van, 2011. Changing face-to-face communication : collaborative tools to support small-group
discussions in the classroom.
Dopfer, K., 2005. The Economic Agent As Rule Maker and Rule User: Homo Sapiens Oeconomicus
(SSRN Scholarly Paper No. ID 721590). Social Science Research Network, Rochester, NY.
Duan, H., Huang, Q., Wang, Q., Zhou, B., Li, J., 2008. Hazardous waste generation and management in
China: A review. Journal of Hazardous Materials 158, 221–227. doi:10.1016/j.jhazmat.2008.01.106
Empa, CNPML, 2010. Manejo de los RAEE a través del Sector Informal en Bogotá, Cali y Barranquilla.
Empa, CNPML, 2008a. Gestión de Residuos Electrónicos en Colombia. Diagnóstico de compcomputadores
y teléfonos celulares.
Empa, CNPML, 2008b. Gestión de Residuos Electrónicos en Colombia: Diagnóstico de Computadores y
Teléfonos Celulares.
Eriksson, O., Bisaillon, M., 2011. Multiple system modelling of waste management. Waste Manage. 31,
2620–2630. doi:10.1016/j.wasman.2011.07.007
Eriksson, O., Reich, M.C., Frostell, B., Bjorklund, A., Assefa, G., Sundqvist, J.O., Granath, J., Baky, A.,
Thyselius, L., 2005. Municipal solid waste management from a systems perspective. J. Clean Prod.
13, 241–252. doi:10.1016/j.jclepro.2004.02.018
Espinoza, O., Villar, L., Villaverde, H., 2008. Diagnóstico del manejo de los residuos electrónicos en el
Perú.
Ezeah, C., Roberts, C.L., 2012. Analysis of barriers and success factors affecting the adoption of
sustainable management of municipal solid waste in Nigeria. J. Environ. Manage. 103, 9–14.
doi:10.1016/j.jenvman.2012.02.027
Feola, G., Binder, C.R., 2010. Towards an improved understanding of farmers’ behaviour: The integrative
agent-centred (IAC) framework. Ecological Economics 69, 2323–2333.
Fernández P., G., 2007. Estudio sobre los circuitos formales e informales de gestión de Residuos de
Aparatos Eléctricos y Electrónicos en Sudamérica.
Fishburn, P.C., 1967. Additive utilities with incomplete product sets: Application to priorities and
assignements, in: Operations Research. Informs.
Gardner, G.T., Stern, P.C., 2002. Environmental Problems and Human Behavior, Edición: 0002. ed.
Pearson Ptr.
Gassara, F., Brar, S.K., Pelletier, F., Verma, M., Godbout, S., Tyagi, R.D., 2011. Pomace waste
management scenarios in Québec—Impact on greenhouse gas emissions. Journal of Hazardous
Materials 192, 1178–1185. doi:10.1016/j.jhazmat.2011.06.026
Gilbert, N., 2007. Agent-Based Models. SAGE Publications, Inc, Los Angeles.
Godet, M., 1993. From Anticipation to Action: A Handbook of Strategic Prospective. Unesco Publishing.
Gonzalez, R.A., 2010. Sistema de información ScienTI Artefacto central del Sistema Nacional de Ciencia y
Tecnología.
Gonzalez, R.A., 2010. A Framework for ICT-Supported Coordination in Crisis Response.
Grimm, V., Berger, U., DeAngelis, D.L., Polhill, J.G., Giske, J., Railsback, S.F., 2010. The ODD protocol:
A review and first update. Ecological Modelling 221, 2760–2768.
doi:10.1016/j.ecolmodel.2010.08.019
Grimm, V., Berger, U., Bastiansen, F., Eliassen, S., Ginot, V., Giske, J., Goss-Custard, J., Grand, T., Heinz,
S.K., Huse, G., 2006. A standard protocol for describing individual-based and agent-based models.
Ecological Modelling 198.
88
Griskevicius, V., Kenrick, D.T., 2013. Fundamental motives: How evolutionary needs influence consumer
behavior. Journal of Consumer Psychology. doi:10.1016/j.jcps.2013.03.003
GSMA TM, 2015. eWaste en Colombia: El aporte de los operadores móviles en la reducción de la basura
electrónica - Estudio de caso.
GSMA TM, UNU-IAS, 2015. eWaste in Latin America. Statistical analysis and policy recommendations.
Guerrero, L.A., Maas, G., Hogland, W., 2013. Solid waste management challenges for cities in developing
countries. Waste Manage. 33, 220–232. doi:10.1016/j.wasman.2012.09.008
Hassanvand, M.S., Naddafi, K., Nabizadeh, R., Momeniha, F., Mesdaghinia, A., Yaghmaeian, K., 2011.
Hazardous waste management in educational and research centers: A case study. Toxicological and
Environmental Chemistry 93, 1636–1642.
Hay, L., Duffy, A., Whitfield, R.I., 2014. The Sustainability Cycle and Loop: Models for a more unified
understanding of sustainability. Journal of Environmental Management 133, 232–257.
doi:10.1016/j.jenvman.2013.11.048
Henrich, J., Boyd, R., Bowles, S., Camerer, C., Fehr, E., Gintis, H., McElreath, R., Alvard, M., Barr, A.,
Ensminger, J., Henrich, N.S., Hill, K., Gil-White, F., Gurven, M., Marlowe, F.W., Patton, J.Q.,
Tracer, D., 2005. “Economic man” in cross-cultural perspective: behavioral experiments in 15
small-scale societies. Behav Brain Sci 28, 795-815-855. doi:10.1017/S0140525X05000142
Herat, S., Agamuthu, P., 2012. E-waste: a problem or an opportunity? Review of issues, challenges and
solutions in Asian countries. Waste Manage. Res. 30, 1113–1129. doi:10.1177/0734242X12453378
Herdiana, D.S., Pratikto, Sudjito, Fuad, A., 2014. Policy of extended producer responsibility (case study).
International Food Research Journal 21, 873–881.
Hernandez, M.G., Martin-Cejas, R.R., 2005. Incentives towards sustainable management of the municipal
solid waste on islands. Sustain. Dev. 13, 13–24. doi:10.1002/sd.241
Hevner, A.R., 2007. A Three Cycle View of Design Science Research. Scandinavian Journal of
Information Systems 19.
Hevner, A.R., Ram, S., March, S.T., Park, J., 2004. Design science in information systems research. MIS
Quarterly 28, 75–105.
Hilty, L.M., Aebischer, B., 2015. ICT for Sustainability: An Emerging Research Field, in: Hilty, L.M.,
Aebischer, B. (Eds.), ICT Innovations for Sustainability, Advances in Intelligent Systems and
Computing. Springer International Publishing, pp. 3–36.
Intergovernmental Panel on Climate Change. Working Group III, 2000. Emissions scenarios. a special
report of IPCC Working Group III Summary for policymakers. Intergovernmental Panel on
Climate Change, [Geneva].
Jain, S., Pant, P., 2010. Environmental management systems for educational institutionsA case study of
TERI University, New Delhi. International Journal of Sustainability in Higher Education 11, 236–
249. doi:10.1108/14676371011058532
Jamieson, S., 2004. Likert scales: how to (ab)use them. Medical Education 38, 2.
Karak, T., Bhagat, R.M., Bhattacharyya, P., 2012. Municipal Solid Waste Generation, Composition, and
Management: The World Scenario. Crit. Rev. Environ. Sci. Technol. 42, 1509–1630.
doi:10.1080/10643389.2011.569871
Keen, P.G.W., 2011. Decision support systems: a research perspective. Nabu Press.
Keen, P.G.W., Sol, H.G., 2008. Decision Enhancement Services: Rehearsing the Future for Decisions that
Matter. IOS Press.
Kerr, J., Vardhan, M., Jindal, R., 2012. Prosocial behavior and incentives: Evidence from field experiments
in rural Mexico and Tanzania. Ecological Economics 73, 220–227.
doi:10.1016/j.ecolecon.2011.10.031

89
Khetriwal, D.S., Kraeuchi, P., Widmer, R., 2009. Producer responsibility for e-waste management: Key
issues for consideration – Learning from the Swiss experience. Journal of Environmental
Management 90, 153–165. doi:10.1016/j.jenvman.2007.08.019
Kiddee, P., Naidu, R., Wong, M.H., 2013. Electronic waste management approaches: An overview. Waste
Manage. 33, 1237–1250. doi:10.1016/j.wasman.2013.01.006
Kinyua, R., 2012. Status of Kenya’s environmental management and protection, in: Kenya: Political, Social
and Environmental Issues. pp. 119–134.
Knoeri, C., Binder, C.R., Althaus, H.-J., 2010. An Agent Operationalization Approach for Context Specific
Agent-Based Modeling. JASSS 14, 4.
Koen H. van Dam, 2013. Agent-Based Modelling of Socio-Technical Systems. Springer.
Kollikkathara, N., Feng, H., Yu, D., 2010. A system dynamic modeling approach for evaluating municipal
solid waste generation, landfill capacity and related cost management issues. Waste Manage. 30,
2194–2203. doi:10.1016/j.wasman.2010.05.012
Kroes, P., 2012. Technical artefacts creations of mind and matter: a philosophy of engineering design.
Springer, Dordrecht; New York.
Kurdve, M., Shahbazi, S., Wendin, M., Bengtsson, C., Wiktorsson, M., 2015. Waste flow mapping to
improve sustainability of waste management: a case study approach. Journal of Cleaner Production,
Special Volume: Support your future today! Turn environmental challenges into opportunities. 98,
304–315. doi:10.1016/j.jclepro.2014.06.076
Lang, D.J., ScholZ, R.W., Binder, C.R., Wiek, A., Stdubli, B., 2007. Sustainability Potential Analysis
(SPA) of landfills - a systemic approach : theoretical considerations a systemic RID B-2076-2008
RID A-4382-2008 RID C-6714-2008. J. Clean Prod. 15, 1628–1638.
doi:10.1016/j.jclepro.2006.08.004
Latour, B., 2005. Reassembling the Social: An Introduction to Actor-Network-Theory. OUP Oxford.
Leigh, N.G., Choi, T., Hoelzel, N.Z., 2012. New Insights into Electronic Waste Recycling in Metropolitan
Areas. Journal of Industrial Ecology 16, 940–950. doi:10.1111/j.1530-9290.2012.00525.x
León, J., 2010. Modelling computer waste flows in the formal and the informal sector - a case study in
Colombia. Swiss Federal Institute of Technology (EPFL) / Swiss Federal Laboratories for
Materials Testing and Research (Empa), Lausanne / St. Gallen, Switzerland.
Li, R.C., Tee, T.J.C., 2012. A Reverse Logistics Model for Recovery Options of E-waste Considering the
Integration of the Formal and Informal Waste Sectors. Procedia - Social and Behavioral Sciences
40, 788–816. doi:10.1016/j.sbspro.2012.03.266
Lindhqvist, T., 2000. Extended Producer Responsibility in Cleaner Production Policy Principle to Promote
Environmental Improvements of Product Systems.
LUMA Institute, 2012. Innovating for People Handbook of Human-Centered Design Methods, 1st edition.
ed. LUMA Institute, Pittsburgh, Pennsylvania.
Maddox, P., Doran, C., Williams, I.D., Kus, M., 2011. The role of intergenerational influence in waste
education programmes: The THAW project. Waste Management 31, 2590–2600.
doi:10.1016/j.wasman.2011.07.023
Maguire, S., Ojiako, U., Said, A., 2010. ERP implementation in Omantel: a case study. Industr Mngmnt &
Data Systems 110, 78–92. doi:10.1108/02635571011008416
Maldonado, L., 2006. Reducción y reciclaje de residuos sólidos urbanos en centros de educación superior:
Estudio de caso. Ingeniería 59–68.
Marcelino-Sádaba, S., González-Jaen, L.F., Pérez-Ezcurdia, A., 2015. Using project management as a way
to sustainability. From a comprehensive review to a framework definition. Journal of Cleaner
Production 99, 1–16. doi:10.1016/j.jclepro.2015.03.020

90
Marshall, R.E., Farahbakhsh, K., 2013. Systems approaches to integrated solid waste management in
developing countries. Waste Manag 33, 988–1003. doi:10.1016/j.wasman.2012.12.023
Martens, M.L., Carvalho, M.M., 2015. The Challenge of Introducing Sustainability into Project
Management Function: Multiple-Case Studies. Journal of Cleaner Production.
doi:10.1016/j.jclepro.2015.12.039
Marthaler, Christian, 2008. Computers for Schools: Sustainability Assessment of Supply Strategies in
Developing Countries: A case study in Colombia - Master Thesis, Department of Environmental
Science Swiss Federal Institute of Technology of Zurich (ETH); Empa, Switzerland.
Mayers, C.K., 2007. Strategic, Financial, and Design Implications of Extended Producer Responsibility in
Europe: A Producer Case Study. Journal of Industrial Ecology 11, 113–131.
doi:10.1162/jiec.2007.1228
McManners, P.J., 2016. Developing policy integrating sustainability: A case study into aviation.
Environmental Science & Policy 57, 86–92. doi:10.1016/j.envsci.2015.11.016
Meijers, A.W.., 2008. Philosophy of Technology and Engineering Sciences. Elsevier, Amsterdam.
Mejía, P.P., 2013. Hacia una política de la gestión ambiental en la Javeriana. Hoy en la Javeriana.
Méndez-Fajardo, S., 2013a. Tratamiento diferenciado de residuos eléctricos y electrónicos: La javeriana
está implementando estrategias alineadas con lo que establece la Ley 1672. Hoy en la Javeriana.
Méndez-Fajardo, S., 2013b. Bogotá Basura Cero: historia y retos. Hoy en la Javeriana.
Méndez-Fajardo, S., Gonzalez, R., 2014. Decision Making in WEEE Management: the Contribution of the
Actor-Network Theory.
Méndez-Fajardo, S., González, R.A., 2014. Actor-Network Theory on Waste Management: a university
case study. IJANTTI, Issue 4 6. doi:10.4018/IJANTTI
Méndez-Fajardo, S., González, R.A., Barros, R., 2016. Using Actor-Network Theory in Agent-Based
Modelling, in: Social Systems Engineering: The Design of Complexity. Willey.
Méndez-Fajardo, S., González, R.A., Binder, C.R., Neuwirth, C., Böni, H., 2015. Agent-based modeling of
cooperation in WEEE management: The case of Colombia.
Méndez-Fajardo, S., González, R.A., Gómez Méndez, L.D., Vela Mantilla, R., Cáceres Medina, A., 2013.
Actor-network analysis of solid waste management at Javeriana University Campus, Bogotá,
Colombia. Presented at the Solid Waste & Landfil Symposium Sardinia, Sardinia, Italy.
Méndez-Fajardo, S., Gonzalez, R., Aya, M., Lloreda, C., 2013. The Actor-Network Theory as a Strategy to
Analyze and Design Sustainable Hazardous Waste Management Systems.
Milutinovic, B., Stefanovic, G., Dassisti, M., Markovik, D., Vuckovic, G., 2014. Multi-criteria analysis as a
tool for sustainability assessment of a waste management model. Energy 74, 190–201.
doi:10.1016/j.energy.2014.05.056
Mingers, J., 2015. Helping business schools engage with real problems: The contribution of critical realism
and systems thinking. European Journal of Operational Research 242, 316–331.
doi:10.1016/j.ejor.2014.10.058
Mingers, J., Mutch, A., Willcocks, L., 2013. Critical Realism in Information Systems Research.
Management Information Systems Quarterly 37, 795–802.
Ministerio de Hacienda y Crédito Público, DNP, Ministerio de Ambiente, Vivienda y Desarrollo Territorial,
Ministerio de Minas y Energía, Ministerio de Comunicaciones, 2005. Documento Conpes 3386.
Mirvis, P., Googins, B., Kinnicutt, S., 2010. Vision, mission, values: Guideposts to sustainability.
Organizational Dynamics, Special Issue: Organizing for Sustainability 39, 316–324.
doi:10.1016/j.orgdyn.2010.07.006
Müller, B., Bohn, F., Dreßler, G., Groeneveld, J., Klassert, C., Martin, R., Schlüter, M., Schulze, J., Weise,
H., Schwarz, N., 2013. Describing human decisions in agent-based models – ODD + D, an

91
extension of the ODD protocol. Environmental Modelling & Software 48, 37–48.
doi:10.1016/j.envsoft.2013.06.003
Müller, E., Hilty, L.M., Widmer, R., Schluep, M., Faulstich, M., 2014. Modeling Metal Stocks and Flows:
A Review of Dynamic Material Flow Analysis Methods. Environ. Sci. Technol.
doi:10.1021/es403506a
Nikolic, I., Kasmire, J., 2013. Theory, in: Dam, K.H. van, Nikolic, I., Lukszo, Z. (Eds.), Agent-Based
Modelling of Socio-Technical Systems, Agent-Based Social Systems. Springer Netherlands, pp.
11–71.
Nikolic, I., van Dam, K.H., Kasmire, J, 2013. Chapter 3: Practice, in: Agent-Based Social Systems.
Springer.
Omran, A., El-Amrouni, A.O., Suliman, L.K., Pakir, A.H., Ramli, M., Aziz, H.A., 2009. Solid Waste
Management Practices in Penang State: A Review of Current Practices and the Way Forward.
Environ. Eng. Manag. J. 8, 97–106.
Ongondo, F.O., Williams, I.D., 2011. Greening academia: Use and disposal of mobile phones among
university students. Waste Management 31, 1617–1634. doi:10.1016/j.wasman.2011.01.031
Ongondo, F.O., Williams, I.D., Cherrett, T.J., 2011. How are WEEE doing? A global review of the
management of electrical and electronic wastes. Waste Manage. 31, 714–730.
doi:10.1016/j.wasman.2010.10.023
Ortega R., M., Méndez-Fajardo, S., Choles, V., García, D., Preciado, C., Torres, C., 2013. Promoción de la
gestión resposable de residuos como estrategia de educación ambiental en ingeniería. Presented at
the WEEF 2013, Cartagena, Colombia.
Ott, D., 2014. WEEE management in Latin America. Presented at the World Resources Forum, Arequipa,
Peru.
Oyoo, R., Leemans, R., Mol, A.P.J., 2011. Future Projections of Urban Waste Flows aand their Impacts in
African Metropolises Cities. Int. J. Environ. Res. 5, 705–724.
Perkoulidis, G., Karagiannidis, A., Kontogianni, S., Diaz, L.F., 2011. SOLID WASTE MANAGEMENT
IN DEVELOPING COUNTRIES. PRESENT PROBLEMS AND FUTURE PERSPECTIVES. J.
Environ. Prot. Ecol. 12, 570–580.
Platt, J., 1983. The development of the “participant observation” method in sociology: Origin myth and
history. Journal of the History of the Behavioral Sciences 19, 379–393. doi:10.1002/1520-
6696(198310)19:4<379::AID-JHBS2300190407>3.0.CO;2-5
Premalatha, M., Tabassum-Abbasi, Abbasi, T., Abbasi, S.A., 2013. The Generation, Impact, and
Management of E-Waste: State of the Art. Critical Reviews in Environmental Science and
Technology 44, 1577–1678. doi:10.1080/10643389.2013.782171
Pronet, G., 2013. Desarrollo de los elementos técnicos y jurídicos para la definición de un modelo de
gestión integral para los residuos de aparatos eléctricos y electrónicos raee en colombia.
Przybyla, D., Pegah, M., 2007. Dealing with the veiled devil: Eco-responsible computing strategy, in:
Proceedings ACM SIGUCCS User Services Conference. pp. 296–301.
Railsback, S.F., Grimm, V., 2011. Agent-Based and Individual-Based Modeling: A Practical Introduction.
Princeton University Press, Princeton.
Rathi, S., 2006. Alternative approaches for better municipal solid waste management in Mumbai, India.
Waste Manage. 26, 1192–1200. doi:10.1016/j.wasman.2005.09.006
Reuter, M., Van Schaik, A., 2012. Opportunities and limits of WEEE Recycling - Recommendations to
product design from a recyclers perspective, in: Electronics Goes Green 2012+ (EGG), 2012.
Presented at the Electronics Goes Green 2012+ (EGG), 2012, pp. 1–8.
Reynolds, M. (Ed.), 2010. Systems Approaches to Managing Change: A Practical Guide, 2010 edition. ed.
Springer, London ; New York.

92
Rigopoulos, G., Psarras, J., Askounis, D., 2008. A TAM Model to Evaluate User`s Attitude Towards
Adoption of Decision Support Systems. Journal of Applied Sciences.
Saphores, J.-D.M., Ogunseitan, O.A., Shapiro, A.A., 2012. Willingness to engage in a pro-environmental
behavior: An analysis of e-waste recycling based on a national survey of U.S. households.
Resources, Conservation and Recycling 60, 49–63. doi:10.1016/j.resconrec.2011.12.003
Scholz, R.W., Binder, C.R., 2004. Principles of Human-Environment Systems (HES) Research (Thesis).
International Environmental Modelling and Software Society.
Sharholy, M., Ahmad, K., Mahmood, G., Trivedi, R.C., 2008. Municipal solid waste management in Indian
cities – A review. Waste Management 28, 459–467. doi:10.1016/j.wasman.2007.02.008
Shrivastava, P., 1995. The Role of Corporations in Achieving Ecological Sustainability. Acad. Manage.
Rev. 20, 936–960. doi:10.2307/258961
Simon, H.A., 1996. The Sciences of the Artificial - 3rd Edition, 3rd edition. ed. The MIT Press, Cambridge,
Mass.
Simoni, M., Kuhn, E.P., Morf, L.S., Kuendig, R., Adam, F., 2015. Urban mining as a contribution to the
resource strategy of the Canton of Zurich. Waste Management 45.
Sinha-Khetriwal, D., Kraeuchi, P., Schwaninger, M., 2005. A comparison of electronic waste recycling in
Switzerland and in India. Environmental Impact Assessment Review 25, 492–504.
doi:10.1016/j.eiar.2005.04.006
Sol, H.G., 1982. Simulation in information systems development (Doctoral Thesis). University of
Groningen, U.K.
Srivastava, R., Sahu, G.P., 2014. Interpretive Structural Modeling of Critical Success Factors in e-Waste
Take Back System. Management Trends Vol. 11, No. 1 & 2.
Stanforth, C., 2006. Using Actor-Network Theory to Analyze E-Government Implementation in
Developing Countries. Information Technologies & International Development 3, 35–60.
Stern, P.C., Dietz, Th., Abel, T, Guagnano, G.A., Kalof, L., 1999. A Value-Belief-Norm Theory of Support
for Social Movements: The Case of Environmentalism. Research in Human Ecology 6.
Streicher-Porte, M., Marthaler, C., Böni, H., Schluep, M., Camacho, Á., Hilty, L.M., 2009. One laptop per
child, local refurbishment or overseas donations? Sustainability assessment of computer supply
scenarios for schools in Colombia. Journal of Environmental Management 90, 3498–3511.
doi:10.1016/j.jenvman.2009.06.002
Streicher-Porte, M., Widmer, R., Jain, A., Bader, H.-P., Scheidegger, R., Kytzia, S., 2005. Key drivers of
the e-waste recycling system: Assessing and modelling e-waste processing in the informal sector in
Delhi. Environmental Impact Assessment Review 25, 472–491. doi:10.1016/j.eiar.2005.04.004
Swiss Contact, CAINTEC, Delfin Consultoría, 2009. Diagnóstico de Residuos Electrónicos en Bolivia.
Swiss e-waste programme, FEAM, 2009. Diagnóstico da Geração de Resíduos Eletroeletrônicos no Estado
de Minas Gerais Belo Horizonte, Brazil.
Tchobanoglous, G., 1994. Gestion Integral de Residuos Solidos, 1a. ed. McGraw-Hill.
Tchobanoglous, G., Theisen, H., Vigil, S.A., 1993. Integrated Solid Waste Management: Engineering
Principles and Management Issues. McGraw-Hill.
Thanh, N.P., Matsui, Y., 2011. Municipal Solid Waste Management in Vietnam: Status and the Strategic
Actions. Int. J. Environ. Res. 5, 285–296.
The European Parliament, The Council on Waste Electrical and Electronic Equipment, 2012. Directive
2012/19/EU.
Troschinetz, A.M., Mihelcic, J.R., 2009. Sustainable recycling of municipal solid waste in developing
countries. Waste Management 29, 915–923. doi:10.1016/j.wasman.2008.04.016

93
U.N., 2015. Sustainable Development Goals .:. Sustainable Development Knowledge Platform [WWW
Document]. U.N., Department of Economic and Social Affairs. URL
https://sustainabledevelopment.un.org/?menu=1300 (accessed 2.10.16).
U.N., 1993. Agenda 21: Earth Summit - The United Nations Programme of Action from Rio.
Widmer, R., Oswald-Krapf, H., Sinha-Khetriwal, D., Schnellmann, M., Böni, H., 2005. Global perspectives
on e-waste. Environmental Impact Assessment Review 25, 436–458.
doi:10.1016/j.eiar.2005.04.001
Wilensky, U., 1999. NetLogo [WWW Document]. URL https://ccl.northwestern.edu/netlogo/ (accessed
3.4.16).
Wilson, D.C., Rodic, L., Scheinberg, A., Velis, C.A., Alabaster, G., 2012. Comparative analysis of solid
waste management in 20 cities. Waste Manage. Res. 30, 237–254.
doi:10.1177/0734242X12437569
Yeomans, J., 2004. Improved policies for solid waste management in the municipality of Hamilton-
Wentworth, Ontario. Can. J. Adm. Sci. 21, 376–393.
Yin, R.K., 2003a. Applications of Case Study Research, Third Edition. ed. SAGE Publications, Inc.
Yin, R.K., 2003b. Case Study Research: Design and Methods, 3rd Edition. ed. SAGE.
Zero Waste Europe, 2014. Zero Waste is a Climate Solution at the COP20. Zero Waste Europe.
Zhang, X., Huang, G.H., Nie, X., Chen, Y., Lin, Q., 2010. Planning of municipal solid waste management
under dual uncertainties. Waste Manage. Res. 28, 673–684. doi:10.1177/0734242X09345273
Zurbrügg, C., Gfrerer, M., Ashadi, H., Brenner, W., Küper, D., 2012. Determinants of sustainability in solid
waste management – The Gianyar Waste Recovery Project in Indonesia. Waste Management.
doi:10.1016/j.wasman.2012.01.011


95
Appendix A. Paper: Actor-Network Theory on Waste Management: A University
Case Study

A96

97

A98

99

A100

101

A102

103

A104

105

A106

107


109
Appendix B. Chapter: Using Actor-Network Theory in Agent-Based Modelling

A110

111

A112

113

A114

115

A116

117

A118

119

A120

121

A122

123

A124

125


127
Appendix C. Participatory design of the policy for the integral WEEE Manage-
ment in Colombia
The problem tree method proposed by CEPAL (2005) as part of the logical framework for design-
ing and evaluating projects (CEPAL et al., 2005) has been used to design public policies in Co-
lombia on the basis of the identification of causes and effects constellated around a focal problem.
In this research, three main participatory activities were included in this design: i) the identifica-
tion of the focal issue and causes and effects; ii) the identification of the structural causes; and, iii)
the design of potential strategies to address structural causes and the focal issue.
The design of this policy already began in 2010 under the leadership of the Ministerio de Ambiente
y Desarrollo Sostenible (MADS), with the involvement of some relevant actors. Nevertheless, the
delay in the alignment of their interests led the MADS to publish a similar law (2013) instead of
the policy. This Appendix describes the participatory policy design developed in 2014 and 2015 as
part of the single-case study “WEEE Management in Colombia.”
As Figure AC1 shows, this design was developed in different workshops and activities. Stronger
participation of the relevant actors centered on the three first steps (see gray portions of Figure
AC1) and the final document review.
Figure AC1. Methodology for policy design for integral WEEE management in Colombia
The relevant actors in this design included members of the National WEEE Management Commit-
tee (NWM-Committee), which is made up of guilds of producers (ANDI – the Asociación de In-
dustriales de Colombia, and CCIT – Cámara Colombiana de Telecomunicaciones) and distribu-
tors (FENALCO – the Federación Nacional de Comerciantes), as well as the MADS, the Minis-
terio de Protección Social, the Ministerio of TICs, and the Ministerio de Comercio, Industria y
Turismo. To round out the committee, delegates from Authorized WEEE Managers (formal recy-
clers) and two advisers, one national (the Centro Nacional de Producción Más Limpia, CNPML),
and one international (the Swiss Government represented by the World Resources Forum – WRF,
and the Swiss Federal Laboratory for Materials, Technology and Society - Empa) were included.
Methods applied in the first participatory steps are described below.
Step 1: Identify causes
The first workshop was developed on October 14, 2014 with a total of 14 attendees who represent-
ed the organizations included in the table AC1 (Figure AC2 - left). In order to use the problem
POLICY FOR
WEEE
MANAGEMENT
IN COLOMBIA
Workshops and activities with relevant WEEE management actors*
Identify Causes Identify Structural CausesDesign
Strategies Action Plan
2014 2015 2016 2017
Year
Implementation

A128
tree, relevant actors defined the focal problem to be addressed: “the insufficient and inadequate
WEEE management in the country.” Then, actors identified causes and effects through a think
tank, classifying them into the following dimensions: environmental, socio-cultural, economic,
technical, and political (Figure AC2 - center). Additionally, the method of visualizing the vote was
used to prioritize the identified causes (Figure AC2 - right).
Figure AC2. Visual results of the workshop to identify causes and effects related to the focal
problem
Table AC1. Organizations represented at the first workshop, “Identification of the focal problem
and its causes and effects (October 14, 2014)”
Organization WEEE actor represented
MADS (3 representatives) Government
Red Verde Post-consumer program
CI Recyclables Formal recyclers
Empa, Switzerland International expert
Lasea Soluciones Formal recyclers
WRF, Switzerland International expert
CNPML National expert
ANDI Producers association
UNE (Telecom service provider) Distributor
Eco Cómputo Post-consumer program
Lúmina Post-consumer program
Each attendee evaluated the concept of systems approach at the end of this first workshop. As a
result, the following keywords were obtained: interactions (71.4%), parts (42.9%), analysis
(35.7%), cause-effect (35.7%), influences (35.7%), holistic (28.6%), actors (14.3%) and method-
ology (14.3%).
Participant votes traced the main cause of the focal problem to consumer behaviors (14 votes), the
lack of a systems approach in decision making (10 votes) and the lack of monitoring and control
by authorities (7 votes). Likewise, the most important solution was identified as the

129
implementation of environmental education (8 votes), followed by institutional strengthening (3
votes). To avoid confusion, readers should note that consumer behavior here includes two
approaches: increasing EEE consumption while simultaneously generating more WEEE; and, a
lack of consumer participation, that is, consumers failing to deliver their WEEE to formal WEEE
management programs.
Table AC2 displays all identified causes and effects; the presentation of causes and effects in the
table does not reflect subsequent prioritization.
Table AC2. List of causes of the “the insufficient and inadequate WEEE management in the coun-
try”, according to actors involved in the first workshop
Failure of selective waste collection mechanisms
Insufficient dissemination of information from producers/distributors to consumers (regarding collection and
management programs)
Insufficient monitoring-controlling of formal and informal sectors by the environmental authority
Insufficient technical capacity and related research
Lack of ongoing training of public staff
Lack of control of exports and foreign trade by the environmental authority
Lack of Information Systems to support monitoring-controlling activities
Lack of surveillance at Customs (EEE imports)
Lack of technical standards for recycling WEEE
Lack of technical standards related to EEE (import and domestic assembly)
Lack of regulations for disposal of EEE/WEEE used by public institutions
Lack of Law´s regulations
Non-recognition of consumer costs (externalities)
Poor public-private cooperation
Poor general dissemination of information (related to differentiated WEEE management) to consumers
(including the obligation to deliver WEEE to the formal system)
Poor information from producers to managers regarding potentially hazardous components
Poor integration of WEEE management in federal educational programs
Poor inter-institutional coordination
Poor monitoring of Extended Producer Responsibility to implement post-consumer programs
Consumer expectation of positive economic valorization
Lack of reverse logistics

A130
Existent opportunity to generate direct-income strength informal recycling
Upon completing the workshop, the main suggestions to increase the systems approach in the
subsequent steps were to identify the links between effects (problematic situations), causes and
actors, as well as to prioritize the identified causes.
Step 2: Identify structural causes
To identify structural causes, the structural analysis method based on the matrix of influences—
MICMAC (Godet, 1993)—was used (Figure AC3 - left). Relying on MICMAC allowed actors to
map both direct and indirect influences among different causes (in a meeting of the NWM-
Committee). Therefore, actors reached a consensus on the most dependent and influencer facts. To
achieve the active participation, and avoid misunderstandings or different interpretations by
participants, the matrix was translated into tables, emailed after the meeting and collected one
week later.
Figure AC3. Matrix of influences. Adapted from (Godet, 1993)
Structural causes (Figure AC3 – right) are the most dependent and most easily impressionable
causes. More direct influences mean a cause is more conflictive. However, if a cause has few de-
Causas 1 2 … … n S %
1 Causa 1 - 0 1 1 0 2 25
2 Causa 2 1 - 1 1 1 4 50
… ….. 0 0 - 0 0 0 0
… ….. 0 0 1 - 0 1 12.5
n Causa n 0 0 1 0 - 1 12.5
1 0 4 2 1 100
13 0 50 25 13 100
S
%
Influence
Dependency
Causes
Cause 1
Cause 2
Cause n
Zona de poder Zona de conflicto
Zona de variables autónomas Zona de salida
Infl
uen
cia
Dependencia
Power zone Conflict zone
Most
dependent
Causes
Structural
Causes
Autonomous zone
Infl
uen
ce
Dependency

131
pendencies, it can be considered an autonomous cause (if it does not influence several other caus-
es) or a structural one (if it does influence several other causes).
The final matrix of influences is shown in Figure AC4 (left), as well as the diagram in which the
conflictive, autonomous and power (structural) causes were visualized.
Figure AC4. The final matrix of influences and the graph used visualize cause tendencies
In the same sense, the net of direct influences is depicted in Figure AC5.
Figure AC5. The net of direct influences
The causes that emerged as structural as a result of the matrix of influence exercise are shown in
Table AC3.
1 : 1
Coor.P
ubl
2 : 2
.CoopP
rPu
3 : 3
InfP
rAC
on
4 : 4
Vig
AuA
mb
5 : 5
ReconC
ons
6 : 6
NoR
egla
mL
7 : 7
InfP
rGest
8 : 8
InfR
eto
ma
9 : 9
Vig
ilAE
E
10 : 1
0O
porIn
gr
11 : 1
1In
fConG
D
12 : 1
2E
xpE
conC
13 : 1
3V
igilR
EP
14 : 1
4C
apTeIn
n
15 : 1
5In
foV
igi
16 : 1
6N
oLogIn
v
17 : 1
7N
oP
rogE
d
18 : 1
8E
sta
nA
EE
19 : 1
9E
naje
BE
s
20 : 2
0E
sta
nR
AE
21 : 2
1V
igE
xpor
22 : 2
2C
apaF
unc
1 : 1Coor.Publ
2 : 2.CoopPrPu
3 : 3InfPrACon
4 : 4VigAuAmb
5 : 5ReconCons
6 : 6NoReglamL
7 : 7InfPrGest
8 : 8InfRetoma
9 : 9VigilAEE
10 : 10OporIngr
11 : 11InfConGD
12 : 12ExpEconC
13 : 13VigilREP
14 : 14CapTeInn
15 : 15InfoVigi
16 : 16NoLogInv
17 : 17NoProgEd
18 : 18EstanAEE
19 : 19EnajeBEs
20 : 20EstanRAE
21 : 21VigExpor
22 : 22CapaFunc
0 2 1 2 0 2 0 1 2 1 1 1 2 1 2 0 2 1 2 2 2 2
1 0 1 1 1 0 1 2 1 2 2 1 1 1 1 2 1 0 1 0 1 1
0 1 0 0 1 0 0 1 0 1 2 2 0 1 0 1 1 0 1 1 0 0
1 1 1 0 1 1 1 1 1 2 1 1 1 1 1 1 0 0 1 1 1 1
0 0 0 0 0 0 0 0 0 1 0 1 0 0 0 1 1 0 0 0 0 0
2 2 1 1 1 0 2 1 2 1 1 1 2 1 1 1 1 2 1 2 2 1
0 0 1 0 1 0 0 0 0 1 1 1 0 1 0 0 1 0 0 1 1 1
0 1 1 0 1 0 0 0 0 1 1 0 0 0 0 1 0 0 0 0 0 0
1 1 1 1 1 0 0 0 0 1 0 0 1 1 1 1 0 0 0 0 1 1
1 1 0 1 1 0 0 1 0 0 0 2 0 1 0 1 0 0 1 0 0 0
1 1 2 1 1 1 1 2 0 1 0 2 0 1 0 1 1 0 1 0 0 1
0 1 1 1 1 0 1 1 0 2 0 0 0 1 0 1 0 0 0 0 0 0
1 1 1 1 1 0 1 1 1 1 2 0 0 1 1 1 0 0 0 0 1 1
0 1 0 0 1 0 1 1 0 1 1 0 0 0 1 1 0 0 0 1 0 0
1 1 0 2 0 0 1 0 2 1 1 0 2 1 0 1 1 0 1 1 2 1
0 1 1 0 1 1 0 2 0 1 1 1 0 1 0 0 0 0 0 0 0 0
1 1 1 1 2 1 1 1 1 1 2 2 1 2 0 1 0 0 1 0 0 1
0 0 0 0 0 1 1 0 1 0 0 0 1 1 1 1 0 0 0 1 0 0
1 1 1 1 0 1 0 0 0 1 1 1 0 0 0 1 0 0 0 0 0 0
1 1 1 1 0 1 1 0 1 1 1 1 0 1 0 0 0 1 0 0 0 1
1 1 0 2 1 0 0 0 1 1 0 1 1 1 1 1 0 0 0 0 0 1
1 1 1 1 1 0 1 1 2 2 1 1 2 1 2 1 1 0 1 1 1 0
© L
IPS
OR
-EP
ITA
-MIC
MA
C

A132
Table AC3. Structural (or the more dependent) causes prioritized through the MICMAC method
Cause
Poor inter-institutional coordination
Lack of legal regulations
Lack of ongoing training of public staff
Poor public-private cooperation
Poor integration of WEEE management in federal educational programs
Insufficient monitoring-controlling of formal and informal sectors by the environmental authority
Lack of Information Systems to support monitoring-controlling activities
Poor general dissemination of information (related to differentiated WEEE management) to consumers
(including the obligation to deliver WEEE to the formal system)
Poor monitoring of Extended Producer Responsibility to implement post-consumer programs
Step 3: Design strategies
The third participatory activity worked off of the prioritized causes. Its goal was to design poten-
tial strategies. This workshop took place on April 15, 2015 at the Pontificia Universidad Javeriana
in Bogotá, Colombia. A total of 27 people attended, representing the organizations described in
Steps 1 and 2 above.
The round robin method (LUMA Institute, 2012) was adapted here to ensure the integration of
different actors and their opinions. This method facilitates the construction of solutions in the form
of written strategies, which are developed via a two-round process that critically engages attendees
put into different groups. Inputs for this activity were structural causes and five strategic objec-
tives; these strategic objectives were defined prior to the meeting in collaboration with the MADS
and the CNPML and were based on the relevant law (passed in 2013). The five objectives are as
follows:
Objective 1: Minimize public health and environmental impacts potentially caused by inef-
ficient WEEE management.
Objective 2: Increase cleaner production and responsible consumption through more sus-
tainable WEEE management by primarily focusing on minimizing generation and offering
socio-economic incentives for properly discarding of WEEE.
Objective 3: Promote the engagement of actors involved in the EEE and WEEE production
chain, especially with regard to the design and implementation of strategies, plans and pro-
jects related to WEEE management.

133
Objective 4: Facilitate consumer participation through collection programs and infrastruc-
ture to prevent informal activities and the presence of WEEE in public areas and sanitary
landfills.
Objective 5: Improve the functional efficiency, transparency and reliability of Extended
Producer Responsibility systems.
An additional input was a list of possible strategic media to achieve goals emerging from both the
law and previous activities to identify and prioritize causes and effects, above all the structural
causes.
Attendees at the round robin meeting were organized into five groups and the two rounds were
broken down thusly: in the first round (Figure AC4 - left), each team proposed a maximum of four
media from the list, wrote the strategy that integrates those media and described related responsi-
bilities of public and private sectors, as well as civil society. Then, in the second round (Figure
AC4 - right), each team reviewed a form filled out by a different team to review and subsequently
gave their opinion about whether or not they believed the strategy proposed was viable from eco-
nomic, legal, technical, and institutional points of view. If this last step improved the strategy, spe-
cific changes proposed were reported on the form. At the end of the workshop, a list of strategies
was proposed for each strategic goal. These were taken into account in the final design of the poli-
cy, a process led by the MADS.
Figure AC4. Materials and dynamics employed in the round robin method
A
AStrategy to
achieve goal 1
B
C
D
BStrategy to
achieve goal 2
DStrategy to
achieve goal 4
CStrategy to
achieve goal 3
E
EStrategy to
achieve goal 5
A
EEvaluation of the Strategy
for goal 5
B
C
D
AEvaluation of the Strategy
for the 1
CEvaluation of the Strategy
for goal 3
BEvaluation of the Strategy
for goal 2
E
DEvaluation of the Strategy
for goal 4
First round Second round


135
Appendix D. Participatory design of the ecological and environmental policy for
the Pontificia Universidad Javeriana
A review of the case history showed two past attempts to obtain the approval of an environmental
policy for the campus (2002 and 2008); the designs for these policies did not include participatory
methods. This Appendix describes the participatory design developed in 2014 and 2015 as part of
the single-case study “WEEE Management at the Pontificia Universidad Javeriana.”
Figure AD1 shows the general design process led by the Javeriana Environmental Group. The
group included representatives of the Vice-President of Social Welfare, the Campus Administra-
tion Office and the faculties of Engineering, Environmental Sciences, Architecture and Design,
Sciences and Theology.
Figure AD1. Methodology used to design the Javeriana’s policy
In addition to the document review, there were two main participatory activities; see Steps 1 and 2
below for more details. The approved policy has also been included (see Step 3). The design pro-
cess was maintained up-to-date via different university media, mostly monthly magazines and the
official Javeriana website. Figure AD2 displays two examples of publications regarding policy
design and the implementation of the battery post-consumer program (Pilas con el Ambiente).
These two facets formed part of the strategies for environmental education on the campus, which,
in turn, was part of the participatory design.
Figure AD2. Publications related to policy design as part of the strategies to engage university
actors.
JAVERIANA
UNIVERSITY’ S
ECOLOGICAL AND
ENVIRONMENTAL
POLICY
Past action
identification
2002 – 2013
Action line
definitionCouncil Approval
Directors/professors
consultation
Action
PlanImplementation
2013 2014 2015 2016
Year
Massive
virtual survey
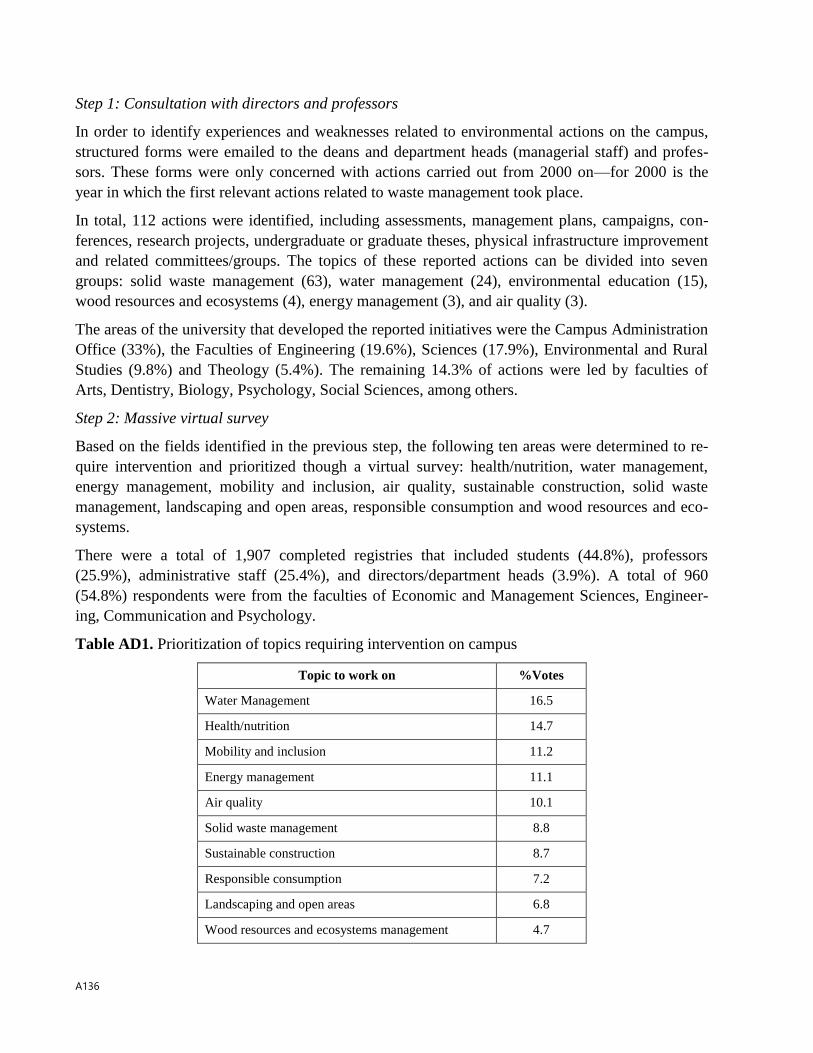
A136
Step 1: Consultation with directors and professors
In order to identify experiences and weaknesses related to environmental actions on the campus,
structured forms were emailed to the deans and department heads (managerial staff) and profes-
sors. These forms were only concerned with actions carried out from 2000 on—for 2000 is the
year in which the first relevant actions related to waste management took place.
In total, 112 actions were identified, including assessments, management plans, campaigns, con-
ferences, research projects, undergraduate or graduate theses, physical infrastructure improvement
and related committees/groups. The topics of these reported actions can be divided into seven
groups: solid waste management (63), water management (24), environmental education (15),
wood resources and ecosystems (4), energy management (3), and air quality (3).
The areas of the university that developed the reported initiatives were the Campus Administration
Office (33%), the Faculties of Engineering (19.6%), Sciences (17.9%), Environmental and Rural
Studies (9.8%) and Theology (5.4%). The remaining 14.3% of actions were led by faculties of
Arts, Dentistry, Biology, Psychology, Social Sciences, among others.
Step 2: Massive virtual survey
Based on the fields identified in the previous step, the following ten areas were determined to re-
quire intervention and prioritized though a virtual survey: health/nutrition, water management,
energy management, mobility and inclusion, air quality, sustainable construction, solid waste
management, landscaping and open areas, responsible consumption and wood resources and eco-
systems.
There were a total of 1,907 completed registries that included students (44.8%), professors
(25.9%), administrative staff (25.4%), and directors/department heads (3.9%). A total of 960
(54.8%) respondents were from the faculties of Economic and Management Sciences, Engineer-
ing, Communication and Psychology.
Table AD1. Prioritization of topics requiring intervention on campus
Topic to work on %Votes
Water Management 16.5
Health/nutrition 14.7
Mobility and inclusion 11.2
Energy management 11.1
Air quality 10.1
Solid waste management 8.8
Sustainable construction 8.7
Responsible consumption 7.2
Landscaping and open areas 6.8
Wood resources and ecosystems management 4.7

137
Step 3: Final document approval and publication
The committee responsible for the design of the policy translated the aforementioned data into ten
strategies:
1. Articulate and incorporate the environmental and ecological dimension into processes of
teaching, research, extension, university social welfare and campus administration.
2. Lead the educational community habits and sustainable behavior in order to preserve the
environment.
3. Maintain a relationship of dialogue and collaboration with public and private institutions,
as with the projects of the Company of Jesus, NGOs and other social actors with responsi-
bilities or interests in ecological and environmental.
4. Increase community awareness and education to achieve more active participation in the
environmental management of the University and strengthen Citizen Culture, which opti-
mizes the community’s commitment to environmental preservation.
5. Prevent, reduce and compensate negative impacts that may arise from University activities,
in accordance with the standards of responsible consumption and efficient use of supplies,
goods and services.
6. Promote a sustainable campus, with environmental standards and criteria which reflect the
proper management of resources, infrastructure, and our commitment to the natural and ur-
ban environment.
7. Promote conditions of clean production, in the purchase of supplies, receipt of donations,
building infrastructure and the relationship with suppliers.
The final document was approved by the Directing Council of the University and involved both
sectionals of the institution which are located in Bogotá (the main sectional), and in Cali. The pub-
lication was made on November 4th of 2015.


139
Appendix E. Interviews instrument and results
The structured interview (Figure AE1) collected data related to WEEE management in Colombia
and other developing countries; it was applied to the relevant actors identified in the literature re-
view.
Figure AE.1. Structure of the interview of relevant actors in the single-case study of Colombia´s
WEEE management
The actors interviewed actors are shown in Table AE1; the table includes interview date, time and
medium.
Table AE.1. Actor interviewed
Interviewed person Institution Date Time (min.)
Medium
Edwin Camelo Ministerio de Ambiente y Desarrollo
Sostenible – MADS
30.4.2014; 3.5.2014 240 Skype
Angel Camacho 7.5.2014 180 Face interview
Florencia Leal Industrial Association of Colombia –
ANDI
4.5.2014 120 Face interview
Edgar Erazo 6.5.2014 120 Face interview
María Cristina
Camejo
Federación Nacional de Comerciantes - FENALCO
9.3.2015
Skype
Carlos Hernández Centro Nacional de Producción Más
Limpia - CNPML (National Expert) 7.2.2014; 12.2.2014 240 Face interview
Part 1
Name, institution, experience related to WEEE management
Part 2
2000 2013
Milestone1 Milestone2 Milestone3 Milestone n
Timeline of WEEE Management in Colombia
Part 3
Opinions about:
• Current system function
• Actors interactions
• How system should be in Short-term (1 year)
Medium-term (1 to 4 years)
Long-term (more than 4 years)
Part 4
Prioritizing decision-making criteria

A140
Interviewed person Institution Date Time (min.)
Medium
Darío Villa Computers for Schools (part of the Minis-
try of ICT) 27.3.2014 120 Face interview
Alberto Riaño Gaia Vitare (authorized recycler) 6.3.2014 90 Face interview
Daniel Ott International expert 2.4.2014 180 Skype
Heinz Böni The Swiss Federal Laboratory for Mate-
rials Sciences - Empa 12.4.2014 120 Face interview
Mathias Schluep World Resources Forum, Switzerland
(international expert) 18.4.2014 90 Face interview
Part 2: the timeline of the WEEE management in Colombia
Figure AE.2 contains the main facts recalled by the actors interviewed; interviewees identified the
creation of Computers for Schools program as the first milestone.
Figure AE.2. General timeline of WEEE management in Colombia
Part 3: Current System Function
Interviewed experts gave their opinion about the current WEEE management in the country. In
consensus, in spite of the existent post-consumption programs are considered successful, these are
just collecting small devices and they are not enough to collect important amounts of WEEE. In
addition, there is a very low participation of consumers as well as an important amount of informal
recyclers.
Actor Interactions
To explore actors’ relationships, two questions were proposed. First, if you want to propose or
carry out a project related to waste management, which actors must be involved (negotiating ob-
jectives or resources, receive authorization or support, ensure cooperation) at the federal level?
Second, if you want to propose or carry out a project related to waste management, which actors
The program
“Computadores
para Educar”
(Computers for
Schools)
started
2000 2015 … 2007 … 2010 2012 2013
Swiss
Technical
support in
WEEE
management
started
Regulations for
some WEEE
was passed
(computers,
lighting, alkaline
batteries)
Take-back
programs (for
computers,
lighting, and
alkaline
batteries
started)
The national
Law for
WEEE
management
was passed
The national
Committee for
WEEE management
was consolidated
2014
The participatory
design of the policy
for WEEE
management was
made
A voluntary take-
back program for
mobile phones
started
A technical
committee was
created
The technical
committee
was dissolved

141
must be involved (negotiating objectives or resources, receive authorization or support, ensure
cooperation) at the city (Bogotá) level?
Table AE.2. Actor relationships (interviewee responses)
Re
cycle
rsN
ati
on
al
ex
pe
rts
En
vir
on
me
nta
l
Au
tho
rity
Po
st-
co
nsu
mp
tio
n
pro
gra
ms
Dis
trib
uto
rs
Pro
du
ce
rsC
ollecti
on
Lo
gis
tics,
cam
paig
ns
Acco
rdin
g t
o t
he g
oal
to b
e s
up
po
rted
Su
pp
ort
in
decis
ion
s
an
d m
on
ito
rin
g
Eco
no
mic
su
pp
ort
Eco
no
mic
su
pp
ort
an
d
co
op
era
tio
n
Co
nsu
me
rsC
ollect
their
WE
EE
Acco
rdin
g t
o t
he g
oal
to b
e s
up
po
rted
Dis
trib
uto
rsC
am
paig
ns
Acco
rdin
g t
o t
he g
oal
to b
e s
up
po
rted
Su
pp
ort
in
mo
nit
ori
ng
Co
llecti
on
part
ners
As g
uild
: d
efi
ne s
trate
gie
s,
defe
nd
in
tere
sts
, ev
alu
ate
En
vir
on
me
nta
l au
tho
rity
Cam
paig
ns
Acco
rdin
g t
o t
he g
oal
to b
e s
up
po
rted
Su
pp
ort
part
ners
hip
s.
Mo
nit
ori
ng
an
d
co
ntr
ol
ICT
s a
uth
ori
tyS
up
po
rt in
mo
nit
ori
ng
Imp
ort
/Ex
po
rt A
uth
ori
tyC
om
bat
sm
ug
glin
g
Re
cycle
rsC
om
peti
tiv
en
ess
Acco
rdin
g t
o t
he g
oal
to b
e s
up
po
rted
Support
in m
onitori
ng
Nati
on
al
co
mm
itte
eT
ech
nic
al su
pp
ort
Nati
on
al
ex
pe
rts
Tech
nic
al su
pp
ort
Acco
rdin
g t
o t
he g
oal
to b
e s
up
po
rted
Tech
nic
al su
pp
ort
Tech
nic
al su
pp
ort
Inte
rnati
on
al
ex
pe
rts
Tech
nic
al an
d
eco
no
mic
al su
pp
ort
Tech
nic
al su
pp
ort
Tech
nic
al su
pp
ort
Acad
em
yT
ech
nic
al su
pp
ort
En
vir
on
me
nta
l A
uth
ori
tyC
am
paig
ns
To
im
ple
men
t p
ilo
t
pro
jects
Info
rmal re
cy
cle
r
inclu
sio
n
Su
pp
ort
in
pu
blic
ed
ucati
on
Pu
bli
c u
tili
tie
s o
ffic
eT
o im
ple
men
t p
ilo
t
pro
jects
Info
rmal re
cy
cle
r
inclu
sio
n
Mo
nit
ori
ng
an
d
co
ntr
ol o
f re
cy
cle
rs
At national level Bogota
Ge
ne
ric a
cto
r (e
xp
ert
) in
tev
iew
ed
(M
ain
go
al
in t
he i
den
tify
ed
rela
tio
nsh
ip)
Acto
rs i
de
nti
fie
d b
y
inte
rvie
we
d e
xp
ert
s

A142
The representative for producers (ANDI) stated that producers are autonomous, i.e. they can de-
velop their own projects.
How the system should be in…?
Twelve WEEE management elements were prioritized by each expert, according to the issues to
tackle in Colombia in the short- (high importance), medium- (medium importance) and long- (low
importance) term. Results are shown in Tables AE.3 and AE.4 below.
Table AE.3.
Based on the answers above, short-term strategies were prioritized as follows:
H M L H M L H M L H M L H M L H M L H M L H M L H M L H M L H M L
Reduction of WEEE linked to responsible
consumption of EEE (less WEEE generating)X X X X X X X X X X X
Strategies to increase the take-back of WEEE
from users: awareness, education, incentives and
fines
X X X X X X X X X X X
Strengthen producer incentive system to promote
recycling (cleaner production, responsible design,
eco-design, etc.)
X X X X X X X X X X
Strengthen strategies to producers and marketers
penalty for non-participation in the take-back X X X X X X X X X X
Implement take-back points and strategies
related to market chains and related service
providers to end users
X X X X X X X X X X X
Design and implement selective routes to collect
WEEE, public or privateX X X X X X X X X X X
Design and implement new recycling plants X X X X X X X X X X X
Formalize recycling business (formal / semi-
formal)X X X X X X X X X X X
Implementf economic-tax incentives for the
collecting / recycling / disassembling / re-
conditioner businesses to increase their
technological capabilities
X X X X X X X X X
Strengthen the role of guilds of producers and
marketersX X X X X X X X X X X
Strengthen the role of educational institutions in
the country - education, research (high schools
and universities)
X X X X X X X X X X X
Implement strategies to educate citizens in
environmental awareness elated to WEEE X X X X X X X X X X X
Interviewed Person
MANAGEMENT ELEMENT MCC
Par
tici
pat
ion
an
d E
du
catio
n
EC AC HBDO
Gen
erat
ion
an
d tak
e-b
ack
pro
cess
Collec
tio
n a
nd
rec
ycl
ing
CHFL EE ARDV MSch

143
Table AE.4. Prioritizing WEEE management elements
Part 3: Prioritizing Decision-Making Criteria
Based on the literature review, the following criteria were included in the third part of the inter-
view (listed alphabetically): economic, environmental, legislative, logistical, social and technical.
Per the prioritization of each interviewed actor, the order of these criteria as pertains to WEEE
management decision making should be (in descending order of importance): economic, environ-
mental, technical, social, legislative and logistical.
Priority Elements Priority Elements
1
Strategies to increase the take-back of WEEE
from users: awareness, education, incentives
and fines
7
Reduction of WEEE linked to responsible consumption of
EEE (less WEEE generating)
2
Strengthen the role of educational institutions in
the country - education, research (high schools
and universities)
8
Strengthen the role of guilds of producers and marketers
3Formalize recycling business (formal / semi-
formal)9
Design and implement new recycling plants
4
Implement strategies for environmental
education and awareness about WEEE to
citizens
10
Strengthen producer incentive system to promote recycling
(cleaner production, responsible design, eco-design, etc.)
5
Strengthen strategies to producers and
marketers penalty for non-participation in the
take-back
11
Design and implement selective routes to collect WEEE,
public or private
6
Implement take-back points and strategies
related to market chains and related service
providers to end users
12
Implement economic-tax incentives for the collecting /
recycling / disassembling / re-conditioner businesses to
increase their technological capabilities


145
Appendix F. Consumer Behavior: The Massive Virtual Survey at the Pontificia
Universidad Javeriana in Bogotá, Colombia
This virtual survey was titled “Opinómetro Ambiental Javeriano,” which roughly translates from
Spanish to English as “Environmental Opinion Meter at the Javeriana.” The survey was done us-
ing SurveyMonkey®, a service contracted by the Pontificia Universidad Javeriana. It was applied
to students, professors, researchers, deans and department heads and administrative staff in 2014.
According to (Gardner and Stern, 2002), the results of studies looking at actions to preserve the
environment, such as energy and water saving behaviors in households, can be divided into two
main groups: efficiency behaviors (e.g. installing heating systems or low-flush toilets) and cur-
tailment behaviors (e.g. lowering room temperatures or switching off appliances). The first catego-
ry, efficiency behaviors, corresponds to the theory of planned behavior of Ajzen (1991); it is
aligned with the consumer decisions when buying appliances, etc. The second category, curtail-
ment behaviors, corresponds to repetitive actions, that is, habits. In order to deeply understand
consumer behavior, both theories were employed in the development of the massive virtual survey
(Table AF1). Aligned with the sub-model designed within the agent-based model (see Chapter 3),
the WEEE included here were mobile phones and computers. The most recent post-consumer pro-
gram (PCP) implemented in Colombia was Red Verde, which collected home appliances. For that
reason, the survey included questions about refrigerator management, as well as general questions
to gauge awareness of existing PCPs in Colombia.
Table AF.1. Virtual survey structure
As figure AF.1 shows, the heading of the survey included the environmental and social responsi-
bility as motivation.
Part 1: Respondent data
The survey started by asking about the faculty or institute to which the respondent belonged (as
employee or student), as well as about their age range and city of origin.
The total number of completed registries was 2,139 (84%), of which 1,615 (75.5%) were filled out
by people from Bogotá. The completed registries can be broken down by “social” group as fol-
Part 1
Role within the University, unit (faculty or institute), age, city of origin
Part 2
Behavior about mobile phones and accesories
• Frequency of changing
• Storing
• Reasons to change the equipment
• What do they do with the old equipment
Part 3
Behavior about computers and accesories
• Frequency of changing
• Reasons to change the equipment
• What do they do with the old equipment
Part 4
Behavior about home appliances (fridges)
• Age of the equipment
• Reasons to change it
• What do they do with the old equipment
Part 5
WEEE management in Colombia
• Awareness about the WEEE management potential risks
• Knowledge about existance post-consumption programs
• Factors that motivate the participation

A146
lows: professors (16.9%), undergraduate and graduate students (62.6%), administrative staff
(16.2%), and alumni (4.3%). A total of 697 of the respondents from Bogotá were younger than 22.
The units or dependencies to which the respondents belong are shown in the following table:
Table AF.2. Units or dependencies to the respondents belong.
Faculty % Faculty %
Architecture & Design, and Arts 10.2 Theology & Philosophy, and Education 5.7
Environmental Sciences, and Sciences 9.8 Psychology, Medicine and Odontology 12
Economic and Business Sciences 17.8 Engineering 14.2
Juridical Sciences and Policies $ International Rela-
tions
5.5 Institutes 0.7
Social Sciences and Communication and Language 14.1 Rectory and Vice-Presidents 10
Part 2: Mobile Phones and Accessories Behavior
The survey included 8 questions on the practices related to the WEEE generated by the use of mo-
bile phones.
Table AF.3. Questions related to mobile phone and accessories behavior
Question Options
How often do you change
your mobile phone?
Over twice in 1 year Ones in a year Once every 2 years
Do you have mobile phones
stored at home?
Yes No
How many? 1 Between 2 and 4 More than 4
Do you have accessories like
batteries or chargers stored at
home or in your office?
Yes No
How many? 1 Between 2 and 4 More than 4
Choose 2 of the following
motivations for changing
your mobile phone:
No longer works Despite it still works, it
is limited in functions
A new ones is cheap
The newer version is more powerful, lighter and
more fashionable
I received one as a gift
What do you usually do with
the discarded mobile phone?
(Choose 2 options)
I discard it along with
ordinary waste
I keep it because, alt-
hough it still works, I
do not know what to do
with it
I keep it because, alt-
hough no longer works,
I think it still has finan-
cial value
Since it still works, I
keep it for future reuse it
I immediately pass it
along to a relative
I donate it to social
causes

147
or give it to somebody
The main results are shown in the following three figures:
Figure AF.1. Changing equipment (mobile phones)
As seen in Figure AF.1, the two age groups usually use their mobile phones for more than 2 years.
And the primary reason for changing is that the device no longer works. Nevertheless, the second
reason was related to the speed of technological innovation rhythm and concomitant fashions,
which may demonstrate the role of advertisements insofar as they tend to play on consumer emo-
tions to increase equipment consumption.
Figure AF.2. Storage of equipment and accessories
Figures AF.2 and AF.3 capture the important consumer tendency to store equipment and accesso-
ries. The design of collection programs and collection regulations should take this tendency into
account.
0
100
200
300
400
500
600
700
800
900
more than
twice/Y
Once/Y Once in
more than2 Years
Stopped
working
Functions
and design
New is
cheap
Received
one gifted
<22
>22
Frequency Motivation
Received
as gift
0
50
100
150
200
250
300
350
400
450
1 2 to 4 > 4 1 2 to 4 > 4
<22
>22
Equipment Accessories

A148
Figure AF.3. What they do with the WEEE from mobile phones?
However, Figure AF.3 also demonstrates the importance of mobile phone reuse in developing
countries, which is seen in the actions of giving it away (especially in the older age range) and
keeping it for reuse.
Part 3: Computer and accessories behavior
To verify behavior related to the use of mobile phones, the following questions were included re-
garding the use of computers (Table AF.2).
Table AF.2. Questions related to behaviors about computers
Question Options
How often have you changed your
computer over the last 4 years?
Zero times Ones Twice More than twice
Choose 2 of the following motivations
for changing your computer:
No longer
works
Despite still working, its
functions are limited
A new one is cheap
The newest version is more powerful, lighter
and more fashionable
Received one as a
gift
What do you usually do with the dis-
carded computer? (Choose 2 options)
I discard it
along with
ordinary waste
Because, although it still
works, I do not know what to
do with it
Because, although
no longer works, I
think it still has
financial value
Since it still works, I keep it
for reuse or give it away
I immediately
pass it along to
a relative
I donate it to social
causes
0
50
100
150
200
250
300
350
400
450
500
Discarded
withordinary
Keep it
(does notknow what
to do with it)
Keep it
(economicvalue)
Keep it (to
reuse it)
Give it to
other person
Donation
<22
>22
Discard with
ordinary
waste
Keep it (not
sure what to
do with it)
Keep it
(financial
value)
Keep it
(reuse it)
Give it
away
Donate it

149
As Figure AF.4 displays, change computers is a less frequent habit than changing mobile phones.
However, the main motivations proved the same the equipment stopped working or technological
and design innovations.
Figure AF.4. Changing equipment (computers)
Comparing what people do with the oldest equipment in Figures AF.3 (mobile phones) and AF.5
(computers), in both cases, disposal along with ordinary waste is the most harmful habit, whereas
storage and giving the equipment away others was similar both WEEE. However, donations were
higher for computers than mobile phones.
Figure AF.5. What do consumers do with computer WEEE?
Part 4: Home appliance (refrigerator) behavior
Given that behavior stemming from use of large equipment, such as house appliances, may be dif-
ferent from behavior stemming from use of smaller EEE, the survey included questions about hab-
its related to refrigerator management (Table AF.3). In addition, the latest PCP implemented in
Frequency Motivation
0
100
200
300
400
500
600
700
Twice More tha
twice
Once Not once Stopped
working
Functions
and
design
New is
cheap
Received
one gifted
<22
>22
Zero Received
as gift
0
50
100
150
200
250
300
350
400
450
Discarded
withordinary
Keep it
(does notknow what
to do with
it)
Keep it
(economicvalue)
Keep it (to
reuse it)
Give it to
other person
Donate it
<22
>22
Discard with
ordinary
waste
Keep it (not
sure what to
do with it)
Keep it
(financial
value)
Keep it
(reuse it)
Give it
away
Donate it

A150
Colombia (2014) is Red Verde (Spanish for Green Network), which collected and managed this
kind of EEE. The pilot phase was developed with refrigerators; therefore, the data collected here
may be of use in terms of supporting Red Verde’s objective.
Table AF.3. Questions related to behaviors about fridges
Question Options
How old is the refrigerator in your
home?
Less than 2
years
Between 2 and 10
years
More than 10 years
When you got the refrigerator, it was: New Used Do not know
For what reasons have you changed or
would you change your fridge?
It no longer
works
Despite still working, it
does not enough space
or is inefficient
Received (or could re-
ceive) another one
cheaper or for free
What do you usually do with the dis-
carded refrigerator (Choose 2 options
I discard it
along with
ordinary waste
Because, although still
working, I do not know
what to do with it
Because, although no
longer working, I think it
still has financial value
If you wanted to change your refriger-
ator, what would you do with the
discarded one? (Choose 2 options)
Since it still
works, I would
give it away
I would sell it (even if
it no longer works)
I would deliver it to a
collection system, even
without receiving any
payment
I would deliver it to receive a credit towards a new refrigerator
First of all, the results related to changing dynamics (Figure AF.6) show that reuse (in shorter pe-
riods) is much lower relative to the reuse of mobile phones or computers, which can be attributed
to the fact that almost all refrigerators are purchased as new, and their end-of-life is 2-4 years,
longer than the average end-of life for ICTs.
Figure AF.6. Changing equipment
0
100
200
300
400
500
600
700
800
900
< 2
yea
rs
2 t
o 1
0 y
ears
> 1
0 y
ears
New
Use
d
do
not
know
<22
>22
Frefrigerator age It was bought …

151
Second of all, leaving aside the reason “stopped working” in Figure AF.7, both size and efficiency
were the most common motivations to change refrigerators. It is a clear demonstration of efficien-
cy behavior in consumers, since old fridges consume much more energy than new ones, which is
reflected in public utility costs.
Figure AF.7. Motivations to change the fridge
Despite the fact that Figure AF.6 shows the consumer tendency to prefer to buy new refrigerators,
Figure AF.7 provides evidence of an important tendency for consumers to hold on to old equip-
ment, give it away or sell it. However, approximately 30% (in both age groups) would deliver it to
formal collection programs, even without receiving a payment as incentive.
Figure AF.7. What would you do (or have you done) with your discarded refrigerator?
Part 5: WEEE Management in Colombia and Post-Consumer Programs
In order to gauge awareness of the potential danger caused by uncontrolled management of WEEE
and awareness of the existence of post-consumer programs (PCP), as well as motivation to partici-
pate, the following questions were included in the last part of the survey (Tale AF.4).
0
100
200
300
400
500
600
Size andefficiency
Recievedanother one
Stoppedworking
I've neverchanged it
<22
>22
0
100
200
300
400
500
600
Since it stillworks, I could
give it tosomebody
I could sell it(even if it no loger
works)
I could deliver itto a collection
system, even if Ido not receive
any payment forit
I could deliver itas part of the
payment of a newone
<22
>22I would deliver it to
receive a credit
towards a new
refrigerator
Since it still
works, I would
give it away
I would sell it
(even if it no
longer works)
I would deliver it
to a collection
system, even if I
do not receive any
payment for it

A152
Table AF.4. Questions related to awareness of PCPs implemented in Colombia
Question Options
Are you aware of the potential hazards and impacts gener-
ated by uncontrolled WEEE management? Yes No
Are you aware of the existence of the post-consumer pro-
grams in Colombia? Yes No
If yes to the previous question: Which post-consumer
programs specifically?
EcoComputo Pilas con el Ambiente
Lumina Red Verde
Which incentives would motivate you the most? (Choose
2)
Proximity In retail stores
Receive mon-
ey
Support social-
environmental project (SEP)
Receive In-
formation
Set an example for others
A As Figure AF.8 shows, 70.8% of the respondents were aware of the hazards presented by
WEEE. However, only 35.6% of them had heard of PCPs.
Figure AF.8. Awareness of risks and PCPs
Of the PCPs implemented in Colombia, the most well received at the Pontificia Universidad
Javeriana has been Pilas con el Ambiente, which was implemented on campus in 2013. The suc-
cess of this campaign demonstrates the importance of the support of educational institutions with
regard to local, regional and national waste management initiatives.
See Figure AF.9 for motivations to participate in the PCPs.
% of “Yes”
answers
PCPs
0.0
10.0
20.0
30.0
40.0
50.0
60.0
70.0
80.0
Hazards PCPs
existance
Eco
Computo
Lúmina Pilas con
el Amb.
Red
Verde
<22
>22
Awareness
of …
PCPs
existence

153
Figure AF.9. Motivations to participate in PCPs.
Finally, extracting only answers that correspond to those who prefer to have PCPs in retail stores,
the consumer’s main interest was to support socio-environmental projects, even more than receiv-
ing money.
Table AF.5. Consumer main interests
Main Interest %*
Receive money (economic incentive) 21,7
Support socio-environmental projects 70,8
Finding the box is sufficient (proximity) 3,7
Receive information about the PCP** 3,7
* Of the 53.3% who is motivated by PCP in shops
** About what to do with WEEE and the impacts prevented
0.0
10.0
20.0
30.0
40.0
50.0
60.0
70.0
80.0
Closeness In shops Receive $ Support
SEP
Receive
Info
As example
to others
<22
>22
% of people who
picked the option as
one of the two main
motivations
Proximity I would
change
shops to
retail stores
Set
example
for others


155
Appendix G. Coop4SWEEEM code: Soon available at
http://ccl.northwestern.edu/netlogo/models/community/


157
Summary
Environmental problems in urban areas are mainly associated with air and water pollution, which,
in turn, are often triggered by unsustainable Solid Waste Management (SWM). The management
of Waste Electrical and Electronic Equipment (WEEE) is a prominent issue in urban waste
systems due to the related toxic substances, such as mercury and PCB (Polychlorinated
Biphenyls). This importance is only reinforced by the economic opportunities offered by valuable
components contained in WEEE. Put simply, WEEE is a crucial part of the discussion revolving
around urban sustainability, especially in developing countries. The principal causes of ineffective
and inefficient WEEE management are poor or absent infrastructure, in addition to deficient
coordination and cooperation among actors. Taken together, these issues result in meager WEEE
collection rates via the official return network. The lack of a systems approach in policy making is
one of the main hurdles to effective waste management, as evidenced by a number of prominent
authors studying this socio-technical system in an extensive literature review, an exploratory
multiple-case study and the author of this doctoral thesis’ own experience. A non-systems-based
approach is often responsible for, or fails to address, a lack of coordination among stakeholders
and the failure to design and implement sustainable education strategies.
In this doctoral thesis, systemicity in decision-making for policy design used to increase
sustainability in WEEE management, specifically targeting developing countries by designing and
implementing of a Decision-Enhancement Studio (DES). The two main research questions that
form the basis of this thesis are: (RQ1) How can we design Decision-Enhancement Studios to
support policy makers in the creation of sustainable WEEE Management programs in developing
countries? (RQ2) What are the essential elements needed to enhance systemicity in decision-
making for WEEE management? The methodological approach to answer these questions was
Design Science Research, which links relevance and design with rigor as part of the progressive
problem-solving process.
Rigor cycle. The majority of worldwide regulations for WEEE management are based on the
principle of Extended Producer Responsibility (EPR), geared towards promoting the improvement,
in environmental terms, of production and manufacturing systems (Agamuthu and Victor, 2011;
Herdiana, D.S. et al., 2014; Lindhqvist, 2000). According to Lindhqvist (2000), EPR aims to
influence production processes in one of two directions (upstream or downstream): shifting
responsibility to downstream procedures that involve different actors in collection, recycling and
treatment processes and providing upstream incentives to producers to incorporate environmental
considerations in the design of their products. An attempt to design more integral solutions for
waste management is manifested in the concept of Integrated Solid Waste Management (ISWM).
ISWM focuses on integrating processes (generation, segregation, transfer, collection, treatment,
recovery and disposal of waste). It has been widely applied in municipal waste management
planning and public policy (Tchobanoglous, 1994; Tchobanoglous et al., 1993). Based on the
concept of ISWM, Decision-Support Systems have integrated simulation-based models to study
waste generation dynamics (Antanasijevic et al., 2013; Benitez et al., 2008; Maddox et al., 2011),

A158
determine landfill allocation (Alves et al., 2009; Antanasijevic et al., 2013; Kollikkathara et al.,
2010) and ascertain optimal SWM planning (Yeomans, 2004), among other things.
Relevance cycle. To study the current state of WEEE management in the context of developing
countries, an exploratory multiple-case study composed of two single-cases was developed. The
two single-cases were WEEE management in the South American nation of Colombia and WEEE
management at the Pontificia Universidad Javeriana in Bogotá, Colombia. Actor-Network Theory
(ANT) was applied to analyze the data collected. Findings from the two cases indicated that,
although the main decision-makers incorporated different dimensions and (occasionally) different
actors, programs and strategies regarding WEEE management failed to include multi-causal
analysis, multiple management stages and knowledge gained from past experiences in an explicitly
methodological way. In addition, informal recycling, WEEE discarded in public areas and sanitary
landfills, low rates of WEEE collection, low consumer participation, high levels of smuggling and
low EEE quality in markets collectively demonstrate the absence of a systems-based approach in
decision-making and system design.
Design cycle. Requirements obtained from the multiple-case study include information technology
(IT) infrastructure-related aspects, as well as aspects related to physical infrastructure. Others are
associated with human activities, such as education, participation, cooperation and decision-
making. Public policies are advantageous when bringing together these requirements to form the
basis for strategy and program development. The DES designed herein included three main
elements: people (decision-makers and facilitator), processes that guided the studio as the main
facilitative environment for decisions and a set of technological tools and protocols (Keen and Sol,
2008).
The general goal of the DES was to provide answers to the research questions formulated in this
doctoral thesis, whereas the goals of the technological tools were more specific and tailored to the
structural causes of insufficient and inefficient WEEE management in Colombia. Thus, the DES’s
goal was formulated as follows: “Decide on aspects that affect sustainability in WEEE
management in Colombia.” The goal of the technological tools, identified by the relevant actors,
was to answer the following question: “How can consumer behavior be influenced?” This question
corresponds to an urgent decision. As part of the technological tools, an agent-based model - ABM
(Coop4SWEEEM) was designed using the ODD (Overview, Design concepts and Details) protocol
and implemented as a computer-based simulation in NetLogo. In addition, a multi-criteria decision
table was developed using the weighted sum method (implemented in Excel).
Applying the tenets of Design Science Research, iterative validation processes were developed. In
the relevance cycle, requirements were identified and tested with the main actors involved in
WEEE management case studies. The conceptual model of the ABM was validated in different
moments: initially, validation was performed prior to the DES, which included the evaluation
described in Chapter 3. Then, validation was performed during the DES; the ABM and simulation,
in addition to other tools, were validated during the development of the DES. The validation used
the technology acceptance model (TAM) instrument, as well as notes and tapes of key moments of
the process. Finally, the DES validation was performed after its implementation: all the
questionnaires, validation instruments and main group discussions were gathered and analyzed in

159
order to identify the concepts and arguments of the actors involved. Validation results provided
additional elements to achieve a more sustainable WEEE management.
RQ1. This question is related to how to design DES in order to support policy-makers in the
creation of sustainable WEEE Management programs in developing countries. In answering this
question, this doctoral research identified various elements. First of all, the idea of designing the
design problem helps designers arrive at deeper understanding of the problematic situation. To
facilitate the understanding of the problematic situation, ANT is recommended (as part of the rigor
cycle) to recognize the knowledge gleaned from related experiences, whether successful or not.
Second of all, and given that a DES engages people (decision-makers and the facilitator),
processes (protocols and guidelines) and technology (technological tools, or T-T), it is crucial to
get relevant actors to participate in all the design process. In addition, the structure of the DES
allows designers to tackle two levels of goals: i) the general DES goal; and ii) the specific assigned
goals of the technological tools used in the DES. By virtue of this two-level goal, the DES
accounts for constraints deemed capable of hindering the design of the solution.
Once the understanding and design of the problematic situation has been achieved, the design of
the technological tools becomes a relevant facet of the DES design, notably computer-based
simulations. In brief, the goal of the solution arrived at via the proposed design was to highlight
the system’s effects on the aggregation of individual interests and on the decisions of different
actors by showing emergences. In so doing, the solution stimulates learning processes in decision-
makers, which frames an agent-based model (ABM) as the best option. This research further
proposes the use of ANT to the design of an ABM; the two naturally prove a productive
combination in light of their conceptual similarities, such as parallels between Actor-Networks (A-
N) and agents or A-N moments of translations and agent decision making.
RQ2. The second research question focused on the essential elements that enhance systemicity in
decision-making for WEEE management. In this regard, a systems approach is required not only
for the design of solutions, but also in the identification and structuring of the problematic
situation. Systemic decision-making requires the comprehension of the entire (WEEE
management) system and its behavior over time. For this reason, policy makers should include the
following elements in the decision-making process: i) Different dimensions of the problem, ii)
Different stakeholders’ targets, iii) Processes within WEEE management; and, iv) Circular cause-
effect relationships resulting from current decisions focused on the short- and long-terms.
In light of the trans-disciplinary nature of this doctoral research, contributions were described in
short-, medium- and long-terms, and divided into tangible or intangible ones. Tangible outputs (or
short-term contributions) were identified as workshops, reports and interview results, which were
aimed at increasing the interest of actors involved. Likewise, presentations at relevant conferences,
publications, consumer characterization, policies designed and DES also form part of this
category. For their part, intangible outputs were, to name two examples, methodological
experience, such as the participatory definition of the focal problem to work on, or social
experience, such as the continuous and active participation of policy-makers. In the medium and
long-terms, contributions were related to the implementation of the results, as well as the

A160
transformation of concepts and knowledge in the actors involved, which will surely influence
processes beyond the scope of this doctoral thesis.

161
Curriculum Vitae
Sandra Méndez Fajardo (Bogotá, 1976) obtained her degree in Civil Engineering in the year 2000
from Pontificia Universidad Javeriana (PUJ) in Bogotá, Colombia. Since 2001 she has been
working as Professor in the Department of Civil Engineering at the PUJ, in the fields of Solid
Waste Management, Impacts Assessment and Sustainable Development. In 2007 she obtained her
MSc in Civil Engineering focused on environmental issues, from the Universidad de los Andes,
Bogota. Also since 2001, she has integrated the research group “Ciencia e Ingeniería del Agua y el
Ambiente” at the PUJ, in which has developed projects focused on environmental problems with
poor and indigenous communities in Colombia. In addition, she has taken part of different policy
committees at the Ministerio de Ambiente y Desarrollo Sostenible (2005 – 2015).
In 2010, she led the conceptualization, design, and implementation of the Social Program
PROSOFI which is still developing projects with poor communities in locality of Usme, in the
south of Bogota. She led the project “Community appropriation for the conservation of streams in
Usme” which obtained the award Goldenseal Environmental Responsibility , in 2012. During her
doctoral research she worked as academic guest at Empa, St Gallen, Switzerland (for 6 months in
2014; and for 5 months in 2015), and at the Ludwig-Maximilian University in Munich, Germany
(for 2 months in 2015, with the support of a grant obtained from DAAD).


![WEEE Directive[1]](https://img.dokumen.tips/doc/110x75/577d35a31a28ab3a6b90ff41/weee-directive1.jpg)


