Embed Size (px)
Citation preview
SYSTEMATICS, ECOLOGY AND
PLANT ASSOCIATIONS OF
AUSTRALIAN SPECIES OF THE
GENUS METARHIZIUM
Shah Mohammad Naimul Islam
MS in Biotechnology
Submitted in fulfilment of the requirements for the degree of
Doctor of Philosophy
Earth, Environmental and Biological Sciences
Science and Engineering Faculty
Queensland University of Technology
2018


i
Keywords
Australia, ecology, endophyte, entomopathogen, haplotype, Metarhizium, MzIGS3,
new species, plant associations, Queensland, rhizosphere, strigolactone, systematics,
5’-TEF.

ii
Abstract
Fungi of the genus Metarhizium (Family: Clavicipitaceae, Order: Hypocreales) are
pleomorphic entomopathogens that are widely used as biocontrol agents. As with
many Hypocrealean fungi, they are saprophytes in soil and colonisers of the
rhizosphere in a mutualistic relationship with plants that can result in improved plant
growth, nutrient uptake, protection from invertebrate herbivores and suppression of
plant pathogens. Inoculation of the rhizosphere of crops with Hypocrealean fungi may
have significant benefits to agriculture, but establishment of fungal inoculum in the
rhizosphere has been inconsistent. Establishment might be improved by analysis of
the biological and ecological factors in the plant/fungus relationship, and the
identification of strains or species with improved rhizospheric competence in crops.
This study collected and described Metarhizium isolates from agricultural fields,
grasslands and forests soils in three locations in Queensland, Australia. Multi-locus
analysis of concatenated sequence data sets of MzIGS3 and 5’-TEF sequences was
used to determine the systematic relationships of 164 Metarhizium isolates. Five
clades with strong support values were identified: three known species (M. robertsii,
M. pingshaense and M. anisopliae) and two previously unidentified ‘indeterminate’
clades (provisionally annotated as M. indet. 1 and M. indet 2). Systematic and
population genetic analyses indicated strongly that the two indeterminate clades
represent two new Metarhizium species. Moderate genetic differences and gene flow
were observed between populations from different locations and ecotypes.
Factors that might affect the diversity of Metarhizium species in soils of different
ecotypes, crops and locations were analysed using multivariate and univariate
analyses. The distribution of Metarhizium species varied with location, ecotype and
crop. The reconstructed phylogenetic relationships, population and ecological
analyses of Metarhizium isolates from soil in legume and maize fields identified
associations between specific clades with legume and maize crops. M. anisopliae and

iii
M. robertsii isolates were significantly associated with soil from legume crops and
forests, and with higher nitrogen and carbon content in soil. Isolates of the M. indet. 1
clade were associated with maize and grassland soils and with low nitrogen and
carbon content. The isolates of M. robertsii and M. indet. 1 were more abundant in
iron rich soil. There was no relationship between phosphate and occurrence of any
species.
The relationship of isolates with legumes and maize plants was investigated. M.
robertsii, M. anisopliae, M. pingshaense were found to be abundant in soils of legume
crops, whereas the 2 new taxonomic clades M. indet. 1 and M. indet. 2 were only
isolated only from soils in which maize had been recently grown. Colonisation of pea
and maize roots was quantified for six fungal isolates from legume crops and six
isolates from maize. Colonisation of pea roots was significantly higher than those of
maize for all isolates, but isolates differed significantly in their colonisation of roots
of the two plant types. The results support the proposal that the host plant influences
both the Metarhizium species found in soil and colonisation of the plant roots.
Finally, the effect of the plant hormone strigolactone on early stages in root
colonisation by M. anisopliae was examined indirectly, through exposure to selected
pea mutants with differing levels of strigolactone expression. Conidium germination
in root exudates, and fungal colony forming units on the roots, were compared in wild
type pea (Pisum sativum L. cv Torsdag) and two pea mutants, rms 5-3 ‘strigolactone
deficient’, and rms 4-1 ‘strigolactone overproducing’ mutants. Plant varieties with
known higher production of strigolactone resulted in increase in both conidium
germination and root colonisation by Metarhizium.
These research findings suggest that selection of Metarhizium species or strains may
enhance the establishment of beneficial inocula in the rhizosphere of crops.

iv
Table of Contents
KEYWORDS.................................................................................................................................. I
ABSTRACT................................................................................................................................... II
TABLE OF CONTENTS ........................................................................................................... IV
LIST OF FIGURES .................................................................................................................... VI
LIST OF TABLES ...................................................................................................................... IX
LIST OF ABBREVIATIONS .................................................................................................... XI
STATEMENT OF ORIGINAL AUTHORSHIP .................................................................. XII
ACKNOWLEDGEMENTS .................................................................................................... XIII
CHAPTER 1 : GENERAL INTRODUCTION ....................................................................... 1 1.1 INTRODUCTION AND BACKGROUND ............................................................................................................. 2 1.2 AIMS AND OUTLINE OF THIS THESIS ............................................................................................................. 4
CHAPTER 2 : LITERATURE REVIEW ................................................................................ 6 2.1 THE ENTOMOPATHOGENIC FUNGI OF THE GENUS METARHIZIUM. ....................................................... 7 2.2 TAXONOMY OF METARHIZIUM ....................................................................................................................... 9 2.3 METARHIZIUM ABUNDANCE ........................................................................................................................ 15 2.4 SOIL AND ENVIRONMENTAL FACTORS AFFECTING METARHIZIUM ABUNDANCE ........................... 15 2.5 METARHIZIUM, A RHIZOSPHERE ASSOCIATE ........................................................................................... 16 2.7 SIGNALLING DURING COLONISATION OF THE RHIZOSPHERE .............................................................. 19 2.8 SUMMARY ........................................................................................................................................................ 20
CHAPTER 3 : SYSTEMATICS OF AUSTRALIAN METARHIZIUM ISOLATES ...... 21 ABSTRACT ............................................................................................................................................................... 22 3.1 INTRODUCTION ............................................................................................................................................... 23 3.2 MATERIALS AND METHODS ........................................................................................................................ 27
3.2.1 Collection of soil samples .............................................................................................................. 27 3.2.2 Isolation of fungal isolates ........................................................................................................... 27 3.2.3 Genomic DNA extraction, PCR amplification, and sequencing .................................... 28 3.2.4 Phylogenetic tree construction .................................................................................................. 30 3.2.6 Haplotype distribution analysis ................................................................................................. 33 3.2.7 Statistical analysis ........................................................................................................................... 34
3.3 RESULTS ........................................................................................................................................................... 35 3.3.1 Occurrence of Metarhizium isolates ........................................................................................ 35 3.3.2 ITS phylogeny ..................................................................................................................................... 39 3.3.3 Phylogenetic analysis...................................................................................................................... 39 3.3.4 DNA divergence, genetic differentiation and gene flow ................................................. 46 3.3.5. Haplotype analysis .......................................................................................................................... 52
3.4 DISCUSSION ..................................................................................................................................................... 59 3.7 SUPPLEMENTARY DATA ............................................................................................................................... 65
CHAPTER 4 : FACTORS AFFECTING THE OCCURRENCE AND DIVERSITY OF
METARHIZIUM SPECIES IN AGRICULTURAL, GRASSLAND AND FOREST
SOILS ........................................................................................................................................... 81 ABSTRACT ............................................................................................................................................................... 82 4.1 INTRODUCTION ............................................................................................................................................... 83 4.2 MATERIALS AND METHODS ......................................................................................................................... 85

v
4.2.1 Soil collection, isolation and description ............................................................................... 85 4.2.2 Soil analysis ......................................................................................................................................... 85 4.2.3 Colony forming unit (CFU)............................................................................................................ 86 4.2.5 Statistical analysis ............................................................................................................................ 87
4.3 RESULTS ........................................................................................................................................................... 88 4.3.1 Fungal species distribution in soil samples........................................................................... 88 4.3.2 Ecological association .................................................................................................................... 94 4.3.3 Soil factors............................................................................................................................................ 96
4.4 DISCUSSION................................................................................................................................................... 101
CHAPTER 5 : ASSOCIATION OF METARHIZIUM SPECIES WITH
AGRICULTURAL CROPS AND EVALUATION OF COLONISATION OF
SELECTED ISOLATES IN PEA AND MAIZE. ............................................................... 105 ABSTRACT ............................................................................................................................................................. 106 5.1 INTRODUCTION ............................................................................................................................................ 107 5.2 MATERIALS AND METHODS ...................................................................................................................... 109
5.2.1 Collection of soil samples, fungal isolation, Genomic DNA extraction, PCR amplification, and sequencing ............................................................................................................ 109 5.2.3 Phylogenetic tree construction ................................................................................................ 109 5.2.4 Genetic differentiation and gene flow studies .................................................................. 109 5.2.5 Metarhizium colonisation in pea and maize ..................................................................... 110 5.2.6 Data analysis .................................................................................................................................... 112
5.3 RESULTS ........................................................................................................................................................ 113 5.3.1 Metarhizium abundance in agricultural soils .................................................................. 113 5.3.2 Multilocus phylogenetic analysis ............................................................................................ 113 5.3.3 Genetic differentiation studies ................................................................................................. 116 5.3.4 Ecotype association study .......................................................................................................... 120 5.3.5 Plant colonisation .......................................................................................................................... 121
5.4 DISCUSSION................................................................................................................................................... 126 5.8 SUPPLEMENTARY DATA ............................................................................................................................. 129
CHAPTER 6 : THE EFFECT OF STRIGOLACTONE ON CONIDIUM
GERMINATION AND ROOT COLONISATION BY METARHIZIUM ANISOPLIAE
..................................................................................................................................................... 131 ABSTRACT ............................................................................................................................................................. 132 6.1 INTRODUCTION ............................................................................................................................................ 133 6.2 MATERIALS AND METHODS...................................................................................................................... 136
6.2.1 Fungus material ............................................................................................................................. 136 6.2.2 Plant material ................................................................................................................................. 136 6.2.3 In vitro germination experiment ............................................................................................ 137 6.2.4 Root colonisation experiment .................................................................................................. 137 6.2.5 Data analysis .................................................................................................................................... 138
6.3 RESULTS ........................................................................................................................................................ 139 6.3.1 M. anisopliae conidium germination .................................................................................... 139 6.3.2 Root colonisation ........................................................................................................................... 141
6.4 DISCUSSION................................................................................................................................................... 142 6.5 SUPPLEMENTARY DATA ............................................................................................................................. 144
CHAPTER 7 : CONCLUSIONS ........................................................................................... 146 7.1 KEY FINDINGS............................................................................................................................................... 147 7.2 FUTURE DIRECTIONS .................................................................................................................................. 152
REFERENCES ............................................................................................................................ 154

vi
List of Figures
Figure 2.1 Cadaver of green vegetable bug, Nezzara viridula, infected by
Metarhizium anisopliae and covered in green conidia produced following death of the
host (Photo: K. Knight & C. Hauxwell) .......................................................................................... 7 Figure 3.1 Mean percentage of occurrence of Metarhizium in soil samples collected
from different locations (above) and ecotypes (below) of Queensland. Bar plot (mean
percentageSEM) with different lowercase letter indicates statistical differences on
Tukey’s post hoc test (GLM, p < 0.05). ........................................................................................ 37 Figure 3.2 Mean percentage of occurrence of Metarhizium in soil samples collected
from different disturbed and natural habitats (above) and disturbed and natural
habitats of three locations of Queensland (below). Bar plot (mean percentageSEM)
with different lowercase letter indicates statistical differences on Tukey’s post hoc test
(GLM, p < 0.05). .................................................................................................................................... 38 Figure 3.3 Phylogenetic tree of concatenated data set of 5’TEF and MzIGS3 of 164
isolates of the genus Metarhizium with reference strains. Clades containing multiple
sequences were collapsed and are presented as triangles marked by the clade name
with number of isolates retained by each clade in parenthesis. Clade supporting value
obtained from maximum likelihood (above) and Bayesian (below) analyses were
presented in the node. ........................................................................................................................... 43 Figure 3.4 Maximum likelihood tree of concatenated data set of MzIGS3 and 5’-TEF
of 164 Australian Metarhizium isolates with reference strains ............................................ 45 Figure 3.5 Haplotype networks for the Metarhizium populations from five groups of
isolates based on combined sequence data. Different ‘pie’ colours in the circles
indicate the location of haplotype origin, with size of the circles indicating number of
specimens; pie-segmentation is proportional to haplotype frequency. Perpendicular
tick marks on the lines represent the mutations between the linked haplotypes. Clades
within the ‘M. pingshaense’ complex (M. indet. 1, M. indet. 2 and M. pingshaense)
shared haplotypes, and clades within the ‘M. robertsii/M. anisopliae’ complex shared
1 haplotype, but there were no shared haplotypes between the two complexes. ........... 56 Figure 3.6 Haplotype networks for the Metarhizium populations from three locations
based on combined sequence data. Different ‘pie’ colours in the circles indicate the
location of haplotype origin, with size of the circles indicating number of specimens;
pie-segmentation is proportional to haplotype frequency. Perpendicular tick marks on
the lines represent the mutations between the linked haplotypes. ....................................... 57 Figure 3.7 Haplotype networks for the Metarhizium populations from four ecotypes
based on combined sequence data. Different ‘pie’ colours in the circles indicate the
location of haplotype origin, with size of the circles indicating number of specimens;
pie-segmentation is proportional to haplotype frequency. Perpendicular tick marks on
the lines represent the mutations between the linked haplotypes. None of the 11
grassland haplotypes (purple) were shared with any other ecotype. .................................. 58 Figure 3.8 Maximum likelihood tree of ITS sequence data. Three sequences from
genus Pochonia that are listed on MycoBank under the synonyms Metacordyceps
chlamydosporia UCR3, Metacordyceps chlamydosporia IAM14700, and Cordyceps
chlamydosporia (Syn Metacordyceps chlamydosporia) NBRC9249 were included in
genus/clade Pochonia. The six isolates that aligned with this clade were excluded
from subsequent analysis. ................................................................................................................... 66 Figure 3.9 Bayesian tree of concatenated data set of 5'-TEF and MzIGS3 for
Metarhizium isolates ............................................................................................................................. 68 Figure 3.10 Maximum likelihood tree of MzIGS3 data of Metarhizium isolates ......... 70

vii
Figure 3.11 Maximum likelihood of 5'-TEF data of Metarhizium isolates ..................... 72 Figure 3.12 Bayesian tree of MzIGS3 data of Metarhizium isolates ................................. 74 Figure 3.13 Bayesian tree of 5’-TEF data of Metarhizium isolates .................................... 76 Figure 3.14 Maximum Likelihood tree of combined data set of MzIGS3, 5’-TEF and
ITS for Metarhizium isolates ............................................................................................................. 78 Figure 3.15 Bayesian tree of combined data set of MzIGS3, 5’-TEF and ITS for
Metarhizium isolates ............................................................................................................................ 80 Figure 4.1: Occurrence of each clade as a proportion of the soil samples in which at
least one colony forming units was identified. The number of soil samples in which
each clade was identified is in brackets. ....................................................................................... 90 Figure 4.2 The occurrence of Metarhizium species as a proportion of soil samples at
different locations (above) and ecotypes (below). No statistical significant difference
was observed. .......................................................................................................................................... 92 Figure 4.3 Geographical representation of soil samples of different locations of
Queensland in which different species of Metarhizium were detected. Pie charts
showing species level distribution of Metarhizium relative abundance (%) in the soil
samples in which Metarhizium detected in Bundaberg, Kingaroy and Gatton. ............. 93 Figure 4.4 Heatmap of Metarhizium species associated with locations and ecotypes
based on Czekanowski dissimilarity in DICE analysis of presence-absence data,
R=0.403, significance =0.001. .......................................................................................................... 95 Figure 4.5 Scree plot: percentages of variables explained by dimension of principal
component analysis ............................................................................................................................... 97 Figure 4.6 Separation of Metarhizium species identified in soil samples using
principal component 1 and 2. Separation of species along Dimension 1 axis is due to
variation in Cu, Fe, Mn, Ti, S, Si and Al. Soil elements Zn, Ba, Ca, K, Zr, Mg and Na
contribute in Dimension 2 2 axis. .................................................................................................... 99 Figure 4.7 Densities (CFU/g dry soil) of Metarhizium observed in the numbers of soil
samples ................................................................................................................................................... 101 Figure 5.1 Phylogenetic tree obtained from maximum likelihood analysis of
concatenated data of MzIGS3 and 5'-TEF.Taxon label colour indicates the source of
the isolates, red for maize and blue for legume field. Taxon within blue box was used
for colonisation experiment. ........................................................................................................... 114 Figure 5.2 Phylogenetic tree obtained from Bayesian inference analysis of
concatenated data of MzIGS3 and 5'-TEF.Taxon label colour indicates the source of
the isolates, red for maize and blue for legume field. ........................................................... 115 Figure 5.3 Haplotype networks for the Metarhizium populations from five clades
based phylogenetic analysis of combined sequence data. Different pie colours in the
circles indicate the location of haplotype origin with size of the circles and pie-
segment is proportional to haplotype frequency. Perpendicular tick marks on the lines
represent the mutations between the linked haplotypes. ...................................................... 118 Figure 5.4 Haplotype networks for the Metarhizium populations from two ecotypes.
Different pie colours in the circles indicate the location of haplotype origin with size
of the circles and pie-segment is proportional to haplotype frequency. Perpendicular
tick marks on the lines represent the mutations between the linked haplotypes. Only
one haplotype was shared between isolates from the two crop types. ............................ 119 Figure 5.5 Heatmap of Metarhizium species associated with maize and legume
ecotypes based on Czekanowski dissimilarity in DICE analysis of presence-absence
data, R=0.5339, significance =0.001. .......................................................................................... 120 Figure 5.6 Colonization of legume (pea) and maize roots by Metarhizium isolates
from maize fields (colonisation experiment 1). Bar plot (meanSEM) with different

viii
lowercase letters indicates statistical differences on Tukey’s post hoc test, p < 0.05.
.................................................................................................................................................................... 122 Figure 5.7 Colonization of legume (pea) and maize roots by 3 Metarhizium clades
isolated from maize fields (colonisation experiment 1). Bar plot (meanSEM) with
different lowercase letters indicates statistical differences on Tukey’s post hoc test,
p < 0.05. BMA2 is the only isolate of M. robertsii from maize. BMD20 is clade M.
indet 1. All other isolates are clade M. indet 2. ....................................................................... 122 Figure 5.8 Effects of plant types and Metarhizium legume field isolates on root
colonisation (colonisation experiment 2). Bar plot (meanSEM) with lowercase letter
indicates statistical differences using Tukey’s post hoc test, p < 0.05. Isolates
KLA15.2 and KLD 17 are M. robertsii, KLA17.1 and KLA17.2 are M. pingshaense,
KLB7 and KLD 5.1 are M. anisopliae. ...................................................................................... 124 Figure 5.9 Effects of plant types and Metarhizium clades from legume field isolates
on root colonisation (colonisation experiment 2). Bar plot (meanSEM) with different
lowercase letter indicates statistical differences on Tukey’s post hoc test, p < 0.05. 124 Figure 5.10 Effects of plant types on root colonisation : A: Mean cfu of Metarhizium
isolates from maize fields, B: Mean cfu of Metarhizium isolates from legume fields
(Bar plot (meanSEM) with asterisk mark indicates statistical differences on Tukey’s
post hoc test, p < 0.05. ....................................................................................................................... 125 Figure 5.11 Maximum likelihood tree of ITS data sets of isolated entomopathogens
from agricultural fields ..................................................................................................................... 130 Figure 6.1 Effects of pea plant varieties and root exudate concentrations on M.
anisopliae conidium germination after 24 hours. Bar plot (mean±SEM) with different
lowercase letters indicates statistical differences on Tukey’s post hoc test (p < 0.05).
.................................................................................................................................................................... 140 Figure 6.2 Spore germination of M. anisopliae as a function of concentration of RE of
wild, rms4-1 and rms5-3 pea plants. Spore germination was assessed after 24 hours.
.................................................................................................................................................................... 140 Figure 6.3 Effect of pea plant varieties (wild, rms4-1 and rms5-3) on mean cfu of M.
anisopliae at 3 days and 7 days post inoculation. Bar plot (mean±SEM) with different
lowercase letter indicates statistical differences on Tukey’s post hoc test (p < 0.05).
.................................................................................................................................................................... 141

ix
List of Tables
Table 2:1 Current Metarhizium species and their synonyms (Kepler et al., 2014,
http://www.naro.affrc.go.jp/org/fruit/epfdb/syn/esyn-de.htm) ............................................. 11 Table 3:1 Description of primers used in polymerase chain reactions (PCR)................ 31 Table 3:2 The number of soil samples with Metarhizium isolates in different locations
and ecotypes. ........................................................................................................................................... 36 Table 3:3 Summary tables of phylogenetic analyses showed the number of isolates
included in the clade with its support values (in parenthesis). NR denotes clade not
resolved in the analysis. Table 3.3A shows the value for three major clades: M.
robertsii, M. pingshaense plus Metarhizium indet. spp. and M. anisopliae. Table 3.3B
shows the values for M. pingshaense and Metarhizium indet. clades. Table 3.3C
shows the values for M. pingshaense and Metarhizium indet. 1 and Metarhizium indet.
2 clades. ..................................................................................................................................................... 41 Table 3:4 DNA divergence data between the clades of Metarhizium in the two
analysed loci and combined data set............................................................................................... 47 Table 3:5 DNA divergence data between the populations of Metarhizium in different
locations for combined MzIGS3 and 5’-TEF data set ............................................................. 48 Table 3:6 DNA divergence data between the populations of Metarhizium in different
ecotypes for combined MzIGS3 and 5’-TEF data set .............................................................. 48 Table 3:7 Genetic differentiation and gene flow of combined MzIGS3 and 5’-TEF
genes between different Metarhizium clades. ............................................................................. 49 Table 3:8 Genetic differentiation and gene flow of combined MzIGS3 and 5’-TEF
genes between Metarhizium populations in different locations ........................................... 50 Table 3:9 Genetic differentiation and gene flow of combined MzIGS3 and 5’-TEF
genes between Metarhizium populations in different ecotypes. Isolates from forest and
legume showed no low differentiation. ......................................................................................... 51 Table 3:10 Distribution of haplotypes within Metarhizium clades and isolates ............ 53 Table 3:11 Number of shared haplotypes of Metarhizium populations between the
groups of clades (A), locations (B) and ecotypes (C) .............................................................. 55 Table 4:1 Metarhizium species and number of colony observed in a plate in 58 soil
samples from different ecotypes and locations by transect. .................................................. 88 Table 4:2 Binomial logistic regression analysis shows the relationship between the
species of Metarhizium in soils as a function of location and ecotype ............................. 96 Table 4:3 Eigenvalue and variance extracted from PCA analysis for soil factors ........ 97 Table 4:4 Loading value by principal components showing significant differences in
soil components across 11 sites & ecotypes. Mauve coloured cells show a significant
positive relationship and orange coloured cells show a significant negative
relationship. .............................................................................................................................................. 98 Table 4:5 Point biserial correlation between the presence of Metarhizium species and
the soil elements. Only statistically significant relationships (both positive and
negative) are presented. ** and * indicate that the correlation is significant at the 0.01
and 0.05 level (respectively). ......................................................................................................... 100 Table 5:1 Metarhizium isolates selected for root colonisation experiments ................ 111 Table 5:2 DNA divergence data between the populations of Metarhizium in
phylogenetic clades and ecotypes ................................................................................................. 117 Table 5:3 Genetic differentiation and gene flow estimates between the populations of
Metarhizium in phylogenetic clades and ecotypes ................................................................. 117 Table 5:4 Generalised linear model for experiment 1 showing the effects of plant,
fungus and their interaction on colonisation............................................................................. 129

x
Table 5:5 Generalised linear model for experiment 2 showing the effects of plant,
fungus and their interaction on colonisation............................................................................. 129 Table 6:1 Logistic regression analysis for plant variety and root exudate (RE)
concentration on conidium germination of Metarhizium .................................................... 144 Table 6:2 Regression analysis of percent conidium germination as a function of
concentration of root exudates of wild, rms4-1, rms5-3 pea plants. ............................... 144 Table 6:3 Generalised liner model showing effect of plant variety on colonisation of
M. anisopliae after 3 days of conidium inoculation .............................................................. 145 Table 6:4 Generalised liner model showing effect of plant variety on colonisation of
M. anisopliae after 7 days of conidium inoculation .............................................................. 145

xi
List of Abbreviations
SM= Selective Medium
SDAY= Sorbitol Dextrose Agar Yeast medium
ML= Maximum Likelihood
MSN= Minimum Spanning Network
RE= Root Exudate
GLM= Generalised Linear Model

xii
Statement of Original Authorship
The work contained in this thesis has not been previously submitted to meet
requirements for an award at this or any other higher education institution. To the best
of my knowledge and belief, the thesis contains no material previously published or
written by another person except where due reference is made.
QUT Verified Signature
Signature: Shah Mohammad Naimul Islam
Date: April 2018

xiii
Acknowledgements
First, I would like to thank my principal supervisor, A/Professor Caroline Hauxwell,
for her great support to initiate and complete my higher studies in QUT. Thank you
very much for your invaluable advice, encouragement and patience throughout this
research. I also appreciate the excellent support, helpful comments, guidance and
advice given by my associate supervisor, Dr. Tanya Scharaschkin.
I gratefully acknowledge financial support from the QUT Postgraduate Research
Award (QUTPRA) scholarship. I would like to acknowledge the research facilities by
QUT. Thanks to Centre for Analytical Research Facility (CARF) for their
experimental facilities.
I thank Neil V. Halpin, John D. Duff, and Hugh Brier of the Department of
Agriculture and Fisheries (DAF), Queensland, for facilitating the collection of soil
samples from, respectively, the Bundaberg, Gatton and Kingaroy research stations.
Some of the data reported in this paper was generated in the Central Analytical
Research Facility (CARF) operated by the Institute for Future Environments (QUT).
Access to CARF was supported by generous funding from the Science and
Engineering Faculty (QUT).
Special thanks to my best friend and wife, Dr. Razia Sultana, for bearing with me all
during this study and sharing all the stresses of my PhD life. Thanks to our boys
Tawseef Tahmeed Aaryan (two years) and Tayif Tareem Adrian (one month) who are
colouring our life and inspiring me always. I would also like to express my love and
gratitude to my beloved family members, for their understanding and endless love. In
particular, my mother for her patience for his encouragement to completion of this
thesis although being constantly sick since I left Bangladesh. I am really proud of my
younger brother, Rakibul Islam, for taking care of the parents during this time.
Furthermore, I would like to thank all my colleagues and friends for motivation,
advice and help rendered: special thanks to Anne-Marie McKinnon, Vincent Chand,
Robert Spence, Andrew Dickson, Shane Russell, for their continued support during
my candidature especially with experiments. Thanks a lot, to Sarie Gould, Courtney
Innes and Tiziana LaMendola (SEF) for their very friendly helpful supports in
financial and administrative issues. I would like to thank Dr. Paul Melloy, Christopher
Noune, Boyd Tarlinton, Nathaniel Crane, Lille Gill, Purnika Ranasinghe, Tharanga
Niroshini, Dr. Melodina Fabillo, Karma Wangchuck, Dr. Joshua Comrade Buru, Thita
Soonthornvipat, for their fruitful suggestion and help at different stages of my PhD
journey. Special thanks to Dr. Mostafizur Rahman and Dr. Md. Farhad Hossain for
helping me in soil sample collection from remote places. Many thanks to QUT-
Bangladeshi Association.
Not but the least, I am thankful to my motherland Bangladesh and beautiful Australia.


1
Chapter 1 : General introduction

2
1.1 Introduction and background
Global food production is facing increasing challenges, including crop losses from
insect pests. Many insecticides have been deregistered due to health and
environmental concerns (Hawke, 2010), and many insect pests have developed
resistance to them (Chandler et al., 2011). New technologies such as more selective
chemistry and genetic modification of plants have been used to reduce crop losses
(Casida and Quistad, 1998). However, these also face challenges from resistance as
the number of control options is reduced, and the costs of developing and registering
new controls increases (“APVMA” 2014).
Entomopathogenic fungi of the order Hypocreales (phylum Ascomycota) frequently
cause disease in insects. These entomopathogens have been used as biological control
agents (biopesticides) for management of insect pests (Zimmermann, 2007) and as an
alternative to chemical insecticides in crop protection (Lacey et al 2015, Lacey and
Goettel, 1995). Hypocrealean fungi of the genus Metarhizium Metschnikoff Sorokin
are widely distributed in soil, and cause ‘green muscardine disease’ in a wide range of
insects (Zimmermann, 2007). The genus has become a model for basic research on
fungal entomopathogens (St. Leger, 2008).
Fungi of the genus Metarhizium are, like many Hypocrealean fungi, saprophytes in
soil and colonisers of the rhizosphere in a mutualistic relationship with plants that can
result in improved plant growth and nutrient uptake, protection from invertebrate
herbivores, and induction of plant systemic resistance leading to reduced
susceptibility to plant diseases (Jaber and Ownley, 2017, Behie et al., 2012, Wyrebek
et al., 2011, Harman, 2006, Hu and St. Leger, 2002). Inoculation of the rhizosphere of
crops with Hypocrealean fungi may have significant benefits to agriculture including
the potential to control insect pests if inoculation of the plants can be successfully

3
achieved under field conditions (Jaber & Ownley 2017, Sasan, 2012, Parsa et al.,
2013).
The experimental inoculation of plants with entomopathogenic fungi has produced
inconsistent results, with the fungus failing to colonise the majority of plants (Parsa et
al., 2013). This is a significant limit to their potential use as rhizospheric inocula.
Research on the evolutionary and ecological association of Metarhizium with plants
may identify strains that increase the consistency and efficacy of the inoculation of
Metarhizium spp. in crops.
Colonisation of the plant may be affected by a number of factors, including plant
nutrition, plant and fungal signalling, host specificity and ecological adaptation.
Phosphate availability and secretion of growth hormones as signalling molecules
(strigolactones) by plants play an important role in the colonisation of plant roots by
symbiotic fungi (Harrison, 2005). However, the plant and fungal signals involved in
successful colonisation of plant roots by Metarhizium are not known.
Metarhizium species exhibit ecological and plant-specific association. For example,
different species of Metarhizium are associated with different habitats such as the
rhizospheres of grasses, shrubs and trees (Wyrebek et al., 2011, Bidochka et al.,
2001). These species or strain-specific associations probably arise from the long-term
associations of the fungi with plant species in certain ecotypes (Bruck, 2010). These
associations could be used as criteria to select Metarhizium species or strains for use
in biological control (Bidochka, 2001). They may also have significant impacts on the
success of colonisation of particular crop types.

4
1.2 Aims and outline of this thesis
The aims of this research were to determine:
1. The natural occurrence, diversity and population genetics of Metarhizium in
Queensland’s soils, particularly in agricultural crops, grassland and forest
ecotypes.
2. Factors affecting the distribution and abundance of Metarhizium species in
different ecotypes and soils.
3. The association of Metarhizium species with agricultural crops and their
colonisation potential in different crops, specifically monocots (maize) and
Eudicots (bean) systems.
4. The possible role of the plant hormone strigolactone on the germination and
colonisation by Metarhizium in plant roots.
Following the General Introduction of Chapter 1, Chapter 2 provides a literature
review, followed by four research Chapters (Chapter 3-Chapter 6) and a final
conclusion, Chapter 7. Materials and methods are discussed in their respective
research Chapters.
Chapter 3 focuses on the diversity and systematics of Australian Metarhizium isolates.
This study includes the isolation of Metarhizium isolates from soils in Queensland.
Multilocus phylogenetic analyses were used to identify the taxonomic position of
Metarhizium isolates. A population genetic study also describes the structure of the
Metarhizium population and gene flow in the ecotypes and locations studied.
Chapter 4 analyses the soil factors affecting the abundance and diversity Metarhizium
species in agricultural, grassland and forest soils using multivariate and univariate
statistical analyses.

5
In Chapter 5, the germination and rhizospheric colonisation of selected Metarhizium
species and strains in pea and maize plants was evaluated in laboratory.
Chapter 6 evaluates the role of the plant hormone, strigolactone, on the germination of
Metarhizium and colonisation by Metarhizium in plant roots using strigolactone pea
mutants.
Finally, Chapter 7 provides a general conclusion to the thesis, arguments for its
significance, and offers future directions for research.

6
Chapter 2 : Literature review

7
2.1 The entomopathogenic fungi of the genus Metarhizium.
Entomopathogenic fungi of the order Hypocreales (Phylum Ascomycota) frequently
cause disease a wide range of host insects, including major pests of agriculture such
as coleoptera and lepidoptera, thrips and aphids (Lacey et al 2015).
Entomopathogenic fungi have attracted interest as bio-control agents worldwide due
to their minimal impacts on non-target organisms and increasing use in insecticide
resistance management strategies (Lacey et al 2015, Strasser et al., 2010,
Zimmermann 2007).
Among the members of the order Hypocreales (Phylum: Ascomycota), the
entomopathogenic fungi belonging to genus Metarhizium of Family Clavicipitaceae
are under intense research for their potential traits favouring their use as microbial
control agents against invertebrate pests (Strasser et al., 2010, Bruck, 2010).
Metarhizium spp. infect insects by their conidia (asexual spores) and cause fatal
‘green muscardine’ disease (Figure 2.1).
Figure 2.1 Cadaver of green vegetable bug, Nezzara viridula, infected by
Metarhizium anisopliae and covered in green conidia produced following death of the
host (Photo: K. Knight & C. Hauxwell)

8
The process of infection in a suitable host by Metarhizium spp. follows several well-
documented steps (for example, Thomas and Read 2007). Firstly, fungal conidia
adhere to the host cuticle using adhesion protein and hydrophobic interaction. Conidia
germinate on the host cuticle and form an appressorium, followed by penetration of
cuticle by mechanical force and cuticle degrading enzymes including, chitinases,
proteases and lipases. Within the host, transmission of infection proceeds via
production of blastospores or hyphal growth in the haemocoel and production of
secondary metabolites. Following death of the host and under favourable conditions
of humidity, hyphae emerge from the cadaver and conidia are produced (Fig 2.1)
Metarhizium spp. infect a wide range of insects, including (amongst others)
Coleoptera, Lepidoptera, Hemiptera, Orthoptera and Isoptera (Lacey et al 2015,
Goettel et al., 1990). Their potential is enhanced by direct infection of the host by
germination on and penetration of the insect cuticle, which removes the requirement
for the host to ingest the pathogen (as is required with, for example, the use of
Bacillus thuringiensis or baculoviruses as biopesticides), and their saprophytic growth
on semiartificial media enables relatively straight forward industrial production
(Lacey et al 2015, Dorta et al., 1996). Commercial formulations have been registered
and used in a number of countries including Australia, which includes the registration
and use of M. acridium (Driver and Milner) J.F. Bisch, Rehner & Humber (2009) in
the product ‘Green Guard’ to control the Australian plague locust (Chortoicetes
terminifera Walker) (Hauxwell et al 2010, Faria and Wraight, 2007).

9
2.2 Taxonomy of Metarhizium
Elias Metschnikoff first described Entomophthora anisopliae as a pathogen of the
scarab beetle, Anisoplia austriaca, in 1879 (Zimmermann et al., 1995). A year later,
he renamed the fungus Isaria destructor. In 1883, Metschnikoff placed the fungus
under a new genus, Metarhizium, and called the fungus M. anisopliae (Zimmermann
et al., 1995).
Tulloch (1976) carried out a major revision of Metarhizium taxonomy based on its
morphological characteristics, accepting only two species, M. anisopliae
(Metschnikoff) Sorokin and M. flavoviride (W. Gams and Rozspal), and two varieties:
a short-spored form of M. anisopliae (Metschnikoff) Sorokin var. anisopliae and a
long-spored form, M. anisopliae (Metschnikoff) Sorokin var. major (Johnston)
(Tulloch, 1976). However, the taxonomic classification based on the morphology
faced challenges, as many of the identifying characters (phialide and conidia) varied
within the same fungal isolates and on different culture media (Glare et al., 1996,
Driver et al., 2000, Kamat et al., 1952).
The first molecular taxonomic revision of Metarhizium used the internal transcribed
spacer (ITS) sequence and identified ten distinct phylogenetic clades and several
Metarhizium varieties, but the taxonomic relationship among the taxa was poorly
resolved due to the limited resolution of the sequence analysis (Kepler et al., 2014,
Driver et al 2000,). Subsequently, the first multilocus analysis of the genus was
conducted using a number of other molecular markers (EF-1α, RPB1, RPB2 and β-
tubulin markers), which promoted several varieties to species status, and described
some new species of Metarhizium (Bischoff et al. 2009). The taxonomy was
subsequently revised using a multigene approach to clarify Metarhizium systematics
10
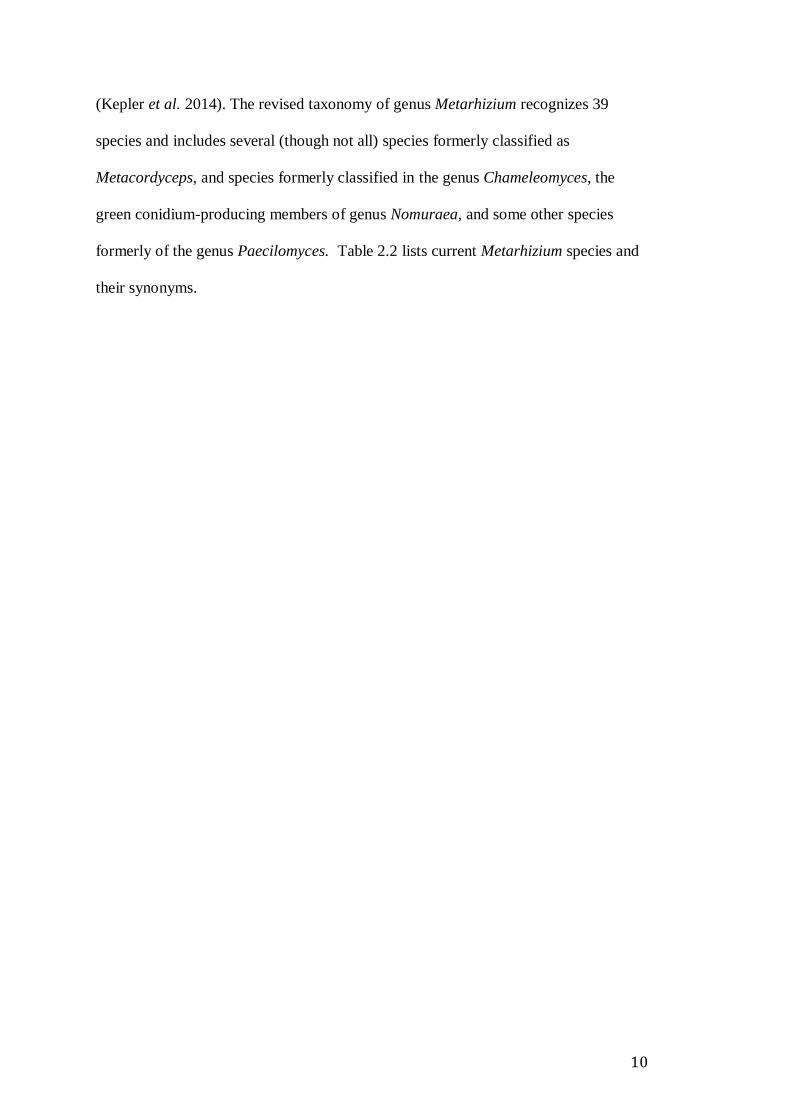
(Kepler et al. 2014). The revised taxonomy of genus Metarhizium recognizes 39
species and includes several (though not all) species formerly classified as
Metacordyceps, and species formerly classified in the genus Chameleomyces, the
green conidium-producing members of genus Nomuraea, and some other species
formerly of the genus Paecilomyces. Table 2.2 lists current Metarhizium species and
their synonyms.

11
Table 2:1 Current Metarhizium species and their synonyms (Kepler et al., 2014,
http://www.naro.affrc.go.jp/org/fruit/epfdb/syn/esyn-de.htm)
Species name, authorities and year of
description
Synonym(s) Voucher collection
1 Metarhizium anisopliae
(Metsch.) Sorok., (1883)
Isaria destructor Metsch. (1880)
Entomophthora anisopliae Metch. (1883) Oospora destructor (Metsch.) (1893)
Isaria anisopliae (Metsch.) Pettit, (1895)
Isaria anisopliae var. americana Pettit, (1895) Penicillium anisopliae (Metsch.) Vuill. (1904)
Penicillium cicadinum Hohn. (1909)
Metarhizium cicadinum (Hohn.) Petch, (1931)
Sporotrichum paranense Marchionatto, (1933) Beauveria paranesis (Marchion) Gosswald (1939)
Paecilomyces paranensis (Marchion) Gunth. Muller (1965)
ARSEF 7487
2 Metarhizium brunneum
Petch, (1935)
ARSEF 2107
3 Metarhizium
guizhouense Q.T. Chen
& H.L. Guo, (1986)
CBS 258.90
4 Metarhizium
pingshaense Q.T. Chen
& H.L. Guo,
(1986).
CBS 257.90
5 Metarhizium acridum
(Driver & Milner) J.F.
Bisch., Rehner & Humber, (2009)
Metarhizium anisopliae var. acridum Driver & Milner,
(2000)
ARSEF 7486
6 Metarhizium robertsii
J.F. Bisch., Rehner &
Humber (2009)
ARSEF 7501
7 Metarhizium globosum
J.F. Bisch., Rehner &
Humber (2009)
ARSEF 2596
8 Metarhizium lepidiotae (Driver & Milner) J.F.
Bisch., Rehner &
Humber (2009)
Metarhizium anisopliae var. lepidiotae Driver & Milner (2000)
ARSEF 7488
9 Metarhizium majus (J.R. Johnst.) J.F.
Bisch., Rehner &
Humber (2009)
Metarhizium anisopliae f. major J.R. Johnst. (1915) Metarhizium anisopliae f. oryctophagum Friederichs,
(1990)
Metarhizium anisopliae var. major (J.R. Johnst.) M.C. Tulloch, (1976)
ARSEF 1914
10 Metarhizium frigidum J.
Bisch. & S. A. Rehner,
(2006)
ARSEF 4124
11 Metarhizium
flavoviridae Gams &
Rozsypal, (1973)
CBS 218.56

12
Species name,
authorities and year of
description
Synonym(s) Voucher collection
12 Metarhizium atrovirens
(Kobayasi & Shimizu) Kepler,
S.A. Rehner & Humber,
(2014)
Cordyceps atrovirens Kobayasi & Shimizu, (1978)
Metacordyceps atrovirens (Kobayasi & Shimizu) Kepler, G.H. Sung & Spatafora, (2012)
NBRC
103797
13 Metarhizium brittlebankisoides (Zuo
Y. Liu, Z.Q.
Liang, Whalley, Y.J. Yao & A.Y. Liu) Kepler,
S.A.
Rehner & Humber,
(2014)
Cordyceps brittlebankisoides Zuo Y. Liu, Z.Q. Liang, Whalley, Y.J. Yao & A.Y. Liu, (2001)
Metacordyceps brittlebankisoides (Zuo Y. Liu, Z.Q.
Liang, Whalley, Y.J. Yao & A.Y. Liu) G.H. Sung, J.M. Sung, Hywel-Jones & Spatafora, (2007)
ARSEF 3145
14 Metarhizium brasiliense
Kepler, S.A. Rehner &
Humber, (2014)
ARSEF 2948
15 Metarhizium
campsosterni (W.M. Zhang & T.H. Li)
Kepler, S.A. Rehner &
Humber, (2014)
Cordyceps campsosterni W.M. Zhang & T.H. Li, (2004)
Metacordyceps campsosterni (W.M. Zhang & T.H. Li) G.H. Sung, J.M. Sung, Hywel-Jones & Spatafora,
(2007)
HMIGD
200885
16 Metarhizium carneum (Duche´ & R. Heim)
Kepler,
S.A. Rehner & Humber, (2014)
Spicaria carnea Duche´ & R. Heim (1931) Paecilomyces carneus (Duche ́& R. Heim) A.H.S. Br. &
G. Sm., (1957)
Penicillium nopporoense Y. Sasaki & Nakane, (1943)
Penicillium nopporoensum Y. Sasaki & Nakane, (1943)
Spicaria carnosa J.H. Mill., Giddens & A.A. Foster,
(1957) Spicaria decumbens Oudem., (1902)
CBS 239.32
17 Metarhizium
cylindrosporum Q.T. Chen & H.L. Guo,
1986
Nomuraea cylindrospora (Q.T. Chen & H.L. Guo)
Tzean, L.S. Hsieh, J.L. Chen & W.J. Wu, (1993)
CBS 256.90
18 Metarhizium
granulomatis (Sigler) Kepler, S.A. Rehner
& Humber, (2014)
Chamaeleomyces granulomatis Sigler, (2010) UAMH 11176
19 Metarhizium
guniujiangense (C.R. Li, B. Huang, M.Z.
Fan & Z.Z. Li) Kepler,
S.A. Rehner & Humber, (2014)
Metacordyceps guniujiangensis C.R. Li, B. Huang, M.Z.
Fan & Z.Z. Li, (2010)
RCEF 2001
20 Metarhizium indigoticum
(Kobayasi & Shimizu)
Kepler,
S.A. Rehner & Humber,
(2014)
Cordyceps indigotica Kobayasi & Shimizu, (1978)
Metacordyceps indigotica (Kobayasi & Shimizu) Kepler,
G.H. Sung & Spatafora, (2012)
NBRC 100684
Table 2.2 (Continued) Current Metarhizium species and their synonyms

13
Species name, authorities and year of description
Synonym(s) Voucher collection
21 Metarhizium khaoyaiense
(Hywel-Jones) Kepler, S.A.
Rehner & Humber, (2014)
Cordyceps khaoyaiensis Hywel-Jones, (1994)
Metacordyceps khaoyaiensis (Hywel-Jones) Kepler,
G.H. Sung & Spatafora, (2012)
BCC 14290
22 Metarhizium koreanum
Kepler, S.A. Rehner &
Humber, (2014)
ARSEF 2038
23 Metarhizium kusanagiense (Kobayasi & Shimizu)
Kepler, S.A. Rehner &
Humber, (2014)
Cordyceps kusanagiensis Kobayasi & Shimizu, (1983)
Metacordyceps kusanagiensis (Kobayasi & Shimizu)
Kepler, G.H. Sung & Spatafora, (2012)
NBRC109322
24 Metarhizium marquandii
(Massee) Kepler, S.A.
Rehner & Humber
Verticillium marquandii Massee, (1898)
Paecilomyces marquandii (Massee) S. Hughes,
(1951)
Spicaria violacea E.V. Abbott, (1926)
CBS 182.27
25 Metarhizium martiale (Speg.)
Kepler, S.A. Rehner &
Humber, (2014)
Cordyceps martialis Speg., (1889)
Metacordyceps martialis (Speg.) Kepler, G.H. Sung
& Spatafora, (2012)
MB#806087
26 Metarhizium minus (Rombach, Humber & D.W.
Roberts) Kepler, S.A. Rehner
& Humber, (2014)
Metarhizium flavoviride var. minus Rombach, Humber & D.W. Roberts, (1986)
ARSEF 2037
27 Metarhizium
novozealandicum Kepler,
S.A. Rehner &
Humber, (2014)
Metarhizium flavoviride var. novozealandicum Driver
& R.J. Milner, (2000)
ARSEF 4674
28 Metarhizium owariense
(Kobayasi) Kepler, S.A.
Rehner & Humber, (2014)
Cordyceps owariensis Kobayasi, (1939)
Ophiocordyceps owariensis (Kobayasi) G.H. Sung,
J.M. Sung, Hywel-Jones & Spatafora, (2007)
NBRC
33258
29 Metarhizium owariense f.
viridescens (Uchiy. &
Udagawa) Kepler, S.A. Rehner & Humber, (2014)
Cordyceps owariensis f. viridescens Uchiy. &
Udagawa, (2002)
Ophiocordyceps owariensis f. viridescens (Uchiy. & Udagawa) G.H. Sung, J.M. Sung, Hywel-Jones &
Spatafora, (2007)
Metacordyceps owariensis f. viridescens (Uchiy. & Udagawa) Kepler, G.H. Sung & Spatafora, (2012)
Nomuraea owariensis Uchiy. & Udagawa (2002)
NBRC 33258
30 Metarhizium pemphigi
(Driver & R.J. Milner) Kepler,
S.A. Rehner & Humber,
(2014)
Metarhizium flavoviride var. pemphigi Driver & R.J.
Milner, (2000)
CABI 177416
31 Metarhizium pseudoatrovirens (Kobayasi
& Shimizu)
Kepler, S.A. Rehner & Humber, (2014)
Cordyceps pseudoatrovirens Kobayasi & Shimizu, (1982)
Metacordyceps pseudoatrovirens (Kobayasi &
Shimizu) Kepler, G.H. Sung & Spatafora, (2012)
NBRC 103797
14
Species name, authorities and year of
description
Synonym(s) Voucher collection
32 Metarhizium rileyi
(Farl.) Kepler, S.A. Rehner &
Humber, (2014)
Botrytis rileyi Farl., (1883)
Spicaria rileyi (Farl.) Charles, (1936) Beauveria rileyi (Farl.) Gösswald, (1939)
Nomuraea rileyi (Farl.) Samson, (1974)
Nomuraea prasina Maubl., (1903)
ARSEF 1972
33 Metarhizium taii Z.Q. Liang & A.Y. Liu, Acta
Mycologica Sinica,
10:260, 1991
Cordyceps taii Z.Q. Liang & A.Y. Liu, (1991) Metacordyceps taii (Z.Q. Liang & A.Y. Liu) G.H.
Sung, J.M. Sung, Hywel-Jones & Spatafora, (2007)
RCEF0772
34 Metarhizium yongmunense (G.H.
Sung, J.M. Sung &
Spatafora) Kepler, S.A.
Rehner & Humber, (2014)
Metacordyceps yongmunensis G.H. Sung, J.M. Sung & Spatafora, (2007)
EFCC 2131
35 Metarhizium viridulum
(Tzean, L.S. Hsieh, J.L. Chen
& W.J. Wu) B. Huang
& Z.Z. Li,
(2004)
Nomuraea viridula Tzean, L.S. Hsieh, J.L. Chen &
W.J. Wu, (1992)
ARSEF 6927
36 Metarhizium viride
(Segretain, Fromentin,
Destombes, Brygoo & Dodin ex
Samson) Kepler, S.A.
Rehner & Humber,
(2014)
Paecilomyces viridis Segretain, Fromentin, Destombes,
Brygoo & Dodin ex Samson, (1974)
Chamaeleomyces viridis (Segretain, Fromentin, Destombes, Brygoo & Dodin ex Samson) Sigler,
(2010)
ARSEF 2456
37 Metarhizium alvesii
Lopes, Faria, Montalva
& Humber sp. nov. (2017)
ARSEF 13308
38 Metarhizium
bibionidarum O. Nishi, H. Sato, sp. nov. (2017)
NBRC
112661
39 Metarhizium
purpureogenum O.
Nishi, S. Shimizu, H.
Sato, sp. nov. (2017)
ARSEF 12571
Abbreviations for collections: ARSEF, USDA-ARS Collection of Entomopathogenic Fungal Cultures, Ithaca, New York, USA;
BCC, Biotech Culture Collection, KlongLuang, Thailand; CABI, CAB International Bioscience, Oxfordshire, UK; CBS,
Centraalbureau voor Schimmelcultures, Utrecht, the Netherlands; EFCC, Entomopathogenic Fungal Culture Collection,
Chuncheon, Korea; NBRC, Biological Resource Centre, National Institute of Technology and Evaluation, Japan; RCEF,
Research Centre for Entomopathogenous Fungi, Anhui Agricultural University, Hefei, Anhui, China; UAMH, University of
Alberta Microfungus Collection and Herbarium, Alberta, Canada.
Table 2.2 (continued) Current Metarhizium species and their synonyms
15
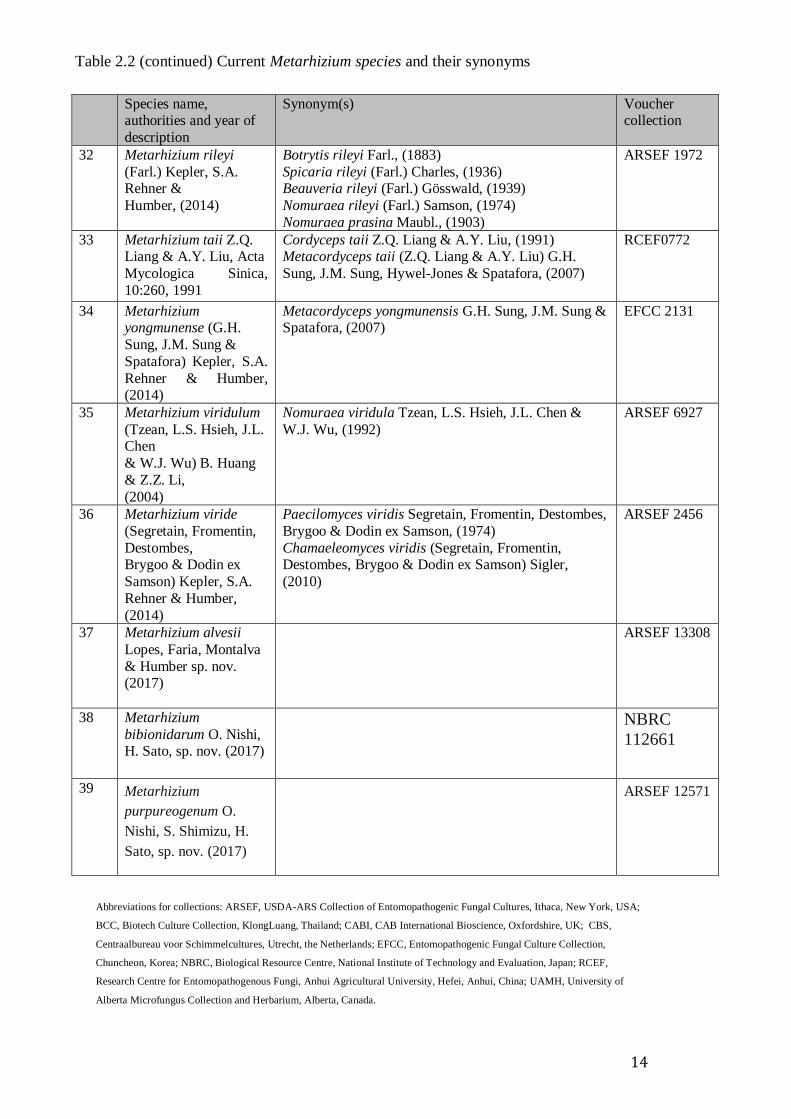
2.3 Metarhizium abundance
The natural occurrence and abundance of Metarhizium have been studied by several
researchers in different countries. The presence of Metarhizium in soil samples was
reported in 28% of samples in Tasmania, Australia (Rath et al., 1992), 17.5% in the
UK (Chandler et. al., 1998), 44.6% in Finland (Vanninen et al., 1989), 91% in Canada
(Bidochka et al., 1998), 71.7% in Spain (Quesada-Moraga et al., 2007) and 19.3% in
Switzerland (Schneider et al., 2011). However, these recovery percentages are not
comparable, as the fungal isolation techniques for Metarhizium varied across studies.
For instance, the Tasmanian study used an agar plate isolation technique from soils,
whereas the studies in Spain, Canada and UK used insect bait methods.
2.4 Soil and environmental factors affecting Metarhizium abundance
Understanding the factors determining the species distribution in Metarhizium may
provide useful agronomical and ecological information into the successful application
of Metarhizium in agricultural settings and help to identify species or strains with a
high likelihood of success.
Soil is the main source of isolates of Metarhizium spp. (Meyling et al., 2011). The
distribution of Metarhizium spp. in the soil environment, however, is not random, and
is associated with habitat and environmental factors (Bidochka et al., 2001, Wyrebek
et al., 2011), although specific associations of the different species have not been
fully determined. Soil type and annual rainfall were reported to influence the
distribution of Metarhizium strains in Tasmania but based only morphological
identification of strains (Rath et al., 1992). Several soil factors, including higher
organic matter, soil acidity, and texture, were reported to be associated with the
presence of Metarhizium spp. in cultivated habitats in Spain (Quesada-Moraga et al.,

16
2007). In contrast, geographic location but not soil factors was reported to determine
the occurrence of Metarhizium in Finland (Vanninen, 1996).
The abundance of Metarhizium spp. can be higher in agricultural (disturbed habitat)
or meadows (semi-disturbed habitat) soils compared to other entomopathogens
(Vanninen, 1996, Quesada-Moraga et al., 2007). Agricultural practices such as tillage
might increase the dispersion of Metarhizium propagules, thus lead to higher
occurrence of some Metarhizium species that tolerate disturbance in agricultural soils
(Kepler et. al., 2015). The effect of soil tillage and disturbance may affect species
differently, though the associations have not been conclusively established. In one
study M. robertsii was the dominant species in agricultural fields but M. brunneum
was mostly isolated species in an undisturbed forest habitat in Canada, but in
Denmark M. brunneum was the most frequent species isolated from agricultural soil
(Bidochka et al., 2001; Wyrebek et al., 2011, Steinwender et al., 2014). Bidochka et
al. (2001) describe “cold active” and “heat active” Metarhizium species that were
abundant in (respectively) forest and agricultural fields in Canada.
These results indicate that ecological factors influence the occurrence and diversity of
Metarhizium species in local habitats and agro-ecosystems may have important
effects on Metarhizium species distribution (Quesada-Moraga et al., 2007, Bidochka
et al., 1998, Steenberg, 1995).
2.5 Metarhizium, a rhizosphere associate
The plant rhizosphere is a narrow region of soil influenced by plant roots, where root
exudates control the activities of microbial populations (St. Leger, 2008).
Metarhizium spp. are found in a wide range of ecosystems and are abundant in the
rhizosphere (Hu and St. Leger, 2002). The rhizospheric competence of Metarhizium
spp. was first identified following released a genetically modified M. anisopliae

17
expressing the green fluorescent protein (GFP) reporter gene (Hu and St. Leger 2002).
The transgenic isolate was released in a cabbage field and the distribution in the soil
monitored over a period of time using the reporter gene to identify the released strain,
during which it was observed that that the fungus was more frequently found
colonizing the cabbage root rather than in bulk soil. In another study, the persistence
and ecology of M. anisopliae was tracked in pots growing spruce (P. abies) for a year
and a higher population of M. anisopliae was again observed in the rhizosphere than
in the bulk soil (Bruck, 2005).
The rhizospheric competence of different Metarhizium species is dependent on the
host plant, with a significant degree of plant-specific association (Bruck, 2010). In
several studies M. guizhouense was reported to be exclusively associated with tree
species (Fisher et al, 2011, Wyrebek et al., 2011). However, the data on host plant
associations is not yet conclusive: in one study M. brunneum and M. robertsii were
found associated only with, respectively, shrubs and grasses (Wyrebek et al., 2011),
but in another, M. robertsii was significantly associated with ‘Christmas’ trees. M.
brunneum was found to be the dominant species in grassland in Switzerland
(Steinwender et al., 2014), but also in strawberry and blueberry crops in the USA
(Fisher et al. 2011). This plant-specific association is further supported by research
reporting that Metarhizium spp. evolved from plant-associated fungi (Gao et al.,
2011).
Colonisation of the rhizosphere by Metarhizium spp. is beneficial to plant growth.
The colonisation of roots of switchgrass (Panicum vigratum L.) and haricot beans
(Phaseolus vulgaris L.) resulted in increased formation of higher number of root hairs
on the plant (Sasan and Bidochka, 2012). In tomato (Solanum lycopersicum) plant
height, root length, shoot and root dry weight increased when colonised by M.
18
anisopliae (Elena et al., 2001). M. robertsii has been shown to play an important role
in nutrient uptake, promoting plant growth by translocation of nitrogen directly from
dead insects to the plant (Behie et al., 2012).
Colonisation of the rhizosphere by Metarhizium spp. has significant additional
benefits, protecting the plant from both insect pests and pathogens. Endophytic
Metarhizium retains pathogenicity against insect pests including mealworm (Tenebrio
molitor L.) in wheat (Keyser et al., 2014) and black vine weevil (Otiorhynchus
sulcatus F.) in Norway spruce (Picea abies) (Bruck, 2005). Application of the
Metarhizium brunneum in strawberry protects plants from spider mite damage (Dara,
2015). Sweet potato weevil, Cylas formicarius (Fab.) were repelled by plants when a
virulent isolate of Metarhizium anisopliae was present in roots (Dotaona et al., 2017).
Colonisation of the rhizosphere by Metarhizium spp may have other benefits.
Colonization of soybean plants with M. anisopliae-increased isoflavonoid
phytoalexins with antifungal, antibacterial, and antiviral properties that beneficial to
soybean productivity and also elevated proline and reduced superoxide dismutase and
malondialdehyde contents in soybean plants showed mitigation of salt stress
compared with control plants. (Khan et al., 2012). Bean plants colonised by M.
robertsii exhibited protection against root rot disease caused by Fusarium solani and
showed healthier plant growth (Sasan and Bidochka, 2013). Treatment of wheat seeds
with Metarhizium and Clonostachys rosea, which is antagonistic to other fungi, was
found to be highly effective at controlling the wheat pathogen Fusarium culmorum
(Keyser et al., 2014). M. brunneum produced antifungal compounds that reduce the
number of the pathogen propagules in the soil and the severity of Verticillium wilt
(Lozano-Tovar, et al., 2017). These research findings suggest that inoculation of the
roots with Metarhizium spp. may provide multiple benefits for agriculture.
19
2.7 Signalling during colonisation of the rhizosphere
Plant-fungal symbioses can be antagonistic, mutualistic or neutral. In a mutualistic
interaction, fungi translocate minerals and water to the plant (Walton et al., 1994).
Plants produce root exudates into the rhizosphere that include carbohydrates, amino
acids, organic acids, phenolic compounds, proteins, and mucilage (Bais et al., 2001,
Walker et al., 2004). The exudates also contain plant hormones and signalling
molecules that are involved in regulation of plant-plant, plant-insect or plant-microbe
interactions in the rhizosphere (Davies et al., 2010), and initiate interaction between
plants and soil microorganisms (Walker et al., 2004).
Arbuscular mycorrhizal (AM) fungi, the typical examples of plant-fungus mutualism,
form a highly branched structure in the cortex of plant roots (the arbuscule) for
nutrient exchange (Selosse and Rousset, 2011). Plant hormones and soil nutrient
levels are associated with mycorrhizal formation in plants. Phosphate deficient
conditions in plant, regulates strigolactone, a signalling molecule by which the AM
fungi detect the host plant (Oldroyd, 2013, Kohlen et al., 2011, Akiyama et al., 2005,
Harrison, 2005). Species of Trichoderma Pers. (Order: Hypocreales, Family:
Hypocreaceae), a genus closely related to Metarhizium, are known as facultative
symbionts able to colonise the plant root, and have been used as antagonists to reduce
plant pathogenic infections (Viterbo and Horwitz, 2010, Hermosa et al., 2012). It was
reported that T. harzianum Rifai could detect and metabolise strigolactone, thus
enhancing the establishment of the fungus on the plant (Vurro, pers. comm. March
2014).
M. anisopliae uses adhesin (a cell-surface protein) to adhere to roots during the
colonisation process in plant (Wang and St. Leger, 2007). The fungus hydrolyses the
root epidermal cell wall by secreting hydrolytic enzymes (Prade et al., 1999) and
20
enters into the epidermis and further enters into the outer cortex of roots (Liao et al.
2013). A recent phylogenetic study of two different genes for Metarhizium adhesin-
like proteins, MAD1 and MAD2, showed that the plant host is the main factor in
Metarhizium species divergence rather than the insect host (Wyrebek and Bidochka,
2013). However, the signalling molecules and potential role of plant hormones
involved in colonisation of the rhizosphere by Metarhizium, are still unknown.
Further understanding of these processes may lead to greater success in the use of the
fungus as a beneficial inoculant for crops.
2.8 Summary
Fungi of the genus Metarhizium are well-known insect pathogens, and have been
shown to form a symbiotic relationship with plants via the rhizosphere, supporting
plant growth by transporting nutrients from insect cadavers and providing protection
from insect herbivores and plant pathogens. Ecological factors are an important factor
in the distribution of Metarhizium spp. in different ecotypes and host plants. Plant
signals may play an important role in establishing Metarhizium in plant systems.
Studies of Metarhizium ecology, host-associations and plant factors that regulate the
Metarhizium colonisation may lead to identification of strains or species that enhance
the establishment of Metarhizium spp. in crop plants and thus maximise multiple
benefits in nutrient uptake, drought tolerance, and protection from insects and plant
pathogens in agriculture.

21
Chapter 3 : Systematics of Australian
Metarhizium isolates

22
Systematics of Australian Metarhizium isolates
Abstract
Metarhizium acridium (Driver & Milner) J. F. Bisch., Rehner & Humber (2009) has
been registered and used as a biopesticide, and M. anisopliae isolates have been
identified, but little is known about the occurrence and diversity of Metarhizium
species in Australia. Legislative restrictions on the introduction of new species of
microorganism into Australia is a significant hurdle to the registration and use of new
biopesticides and inocula. Identification of species already present can facilitate
import and registration.
This study isolated Metarhizium strains from agricultural fields, grassland and forest
soils at three locations in Queensland, Australia. A total of 164 isolates were
identified as Metarhizium spp. based on their appearance on selective agar and ITS
sequence results. A multi-locus analysis of concatenated data sets of MzIGS3 and 5’-
TEF inferred the taxonomic position of these isolates in five well supported clades.
Three of the clades were assigned to known species: M. robertsii, M. pingshaense and
M. anisopliae. Two other indeterminate clades represent probable new Metarhizium
species. Population genetic analysis showed that the Metarhizium clades were
strongly genetically differentiated. Moderate genetic differences and gene flow were
observed between the Metarhizium populations from different locations and ecotypes.
This research established a baseline on species present in Australia for future
introduction of Metarhizium species in biocontrol programs.
Keywords: Entomopathogen, Metarhizium, markers, phylogenetic analysis, genetic
differentiation, gene flow.

23
3.1 Introduction
Members of the genus Metarhizium (Family: Clavicipitaceae, Order: Hypocreales),
are natural enemies of insects and have been historically used as a biopesticide
(Zimmermann, 1993, Zimmermann et al., 1995, Meyling and Eilenberg, 2007, Sasan,
2012). These insect pathogens have a broad host range including many species of
Coleoptera, Hemiptera, Orthoptera etc. (Goettel et al., 1990, Veen, 1968, Zimmerman,
2007, Hauxwell et al., 2010). Several commercial biopesticides based on Metarhizium
have been registered and used in many countries including Australia, Africa, USA,
Brazil, the EU and India (Hauxwell et al., 2010, Wraight et al., 2001, Copping, 2004,
Zimmermann, 2007, Kabaluk and Gazdik, 2005). In Australia, research on the
application of Metarhizium as a biopesticide began in the early 1990s by the
Commonwealth Scientific and Industrial Research Organisation (CSIRO) and a
commercial formulation of Metarhizium acridum Bisch., Rehner & Humber (syn.
Metarhizium anisopliae var. acridum) was developed to control the Australian plague
locust (Chortoicetes terminifera Walker). The fungus resulted in a high percentage
(80%) reduction of the locust population and led to the aerial application of
Metarhizium in Australia against plague locusts (reviewed in Hauxwell et al., 2010).
M. anisopliae is has also been described and tested as a potential biopesticide
(Hauxwell et al., 2010).
Despite the recognized potential of Metarhizium species for biological control and as
a root inoculant for agricultural crops, the import and release of exotic species and
strains of microorganisms in Australia is very strictly regulated under biosecurity
legislation (Biosecurity act 2015, https://www.legislation.gov.au/). The identification
of species already present in Australia can facilitate the import and release of new
isolates of the same species from overseas, but the identity and distribution of
24
Australian Metarhizium species and especially the molecular characterization of
cryptic species, is still to be investigated (Hauxwell et al 2010).
The species of Metarhizium exhibit a complex pleomorphic life cycle and show
cryptic diversity in their lineage. Metarhizium spp. may have different morphology in
different life stages (telomorph, anamorph), their morphology may change in response
to environmental factors, and many of the identifying features overlap among the
species or even within the other members of the order Hypocreales (Glare et al.,
1996, Driver et al., 2000). Early taxonomic classification of Metarhizium spp. based
on morphology has proved inconsistent because of variation in the appearance of
features such as phialides and conidia within the same isolate and in response to
culture on different media (Kamat et al., 1952, Glare et al., 1996, Driver et al., 2000).
Recently, the International Code of Nomenclature (ICN) for algae, fungi, and plants
has revised the regulations for nomenclature of pleomorphic fungus (article 59)
stating that one name is applicable for one fungus, regardless of its sexual and asexual
life stages (McNeil et al., 2012). Molecular approaches are now extensively used in
the classification and taxonomy of fungi, especially for the cryptic fungal species
(Douhan et al., 2008). Accurate identification of the Metarhizium species requires
diagnostic molecular data (Bischoff et al. 2009, Steinwender et al. 2014).
The taxonomy of Metarhizium spp. was initially revised using internal transcribed
spacer (ITS) sequence and identified ten distinct phylogenetic clades and several
Metarhizium varieties (Driver et al. 2000). However, the taxonomic relationship
between the taxa was poorly resolved due to the limited resolution of the ITS
sequence analysis (Kepler et al., 2014).

25
Bischoff et al. (2009) identified nine species of Metarhizium by multilocus
phylogenetic analysis using five gene regions (5’-TEF, RPB1, RPB2, β-tubulin and
ribosomal intergenic spacer region (IGS). Among the markers, Bischoff et al. (2009)
reported that 5’ end of elongation factor (5’-TEF) could be used as a single reliable
marker for Metarhizium species discrimination. However, this region did not produce
sufficient resolution to resolve Metarhizium phylogeny at the species level
(Steinwender et al., 2014).
In a recent study, new phylogenetically-informative nuclear intergenic sequence
markers have been developed to describe the species of the genus Metarhizium, with
MzIGS3 recommended as a reliable single marker to describe previously unknown
Metarhizium species in the complex (Kepler and Rehner 2013). These intergenic
sequence markers were compared with the 5’-Transcription elongation factor (5’-
TEF) marker was used for taxonomic identification and diversity analysis of Brazilian
Metarhizium species (Rezende et al. 2015), on the basis of which it was suggested
that MzIGS3 was not suitable as a stand-alone marker, but that 5’-TEF may be used
alone or in combination with MzIGS3 to resolve species identification.
The molecular typing tool ‘single sequence repeat (SSR) markers’ have been used for
analysis of population structure of seven Metarhizium species: M. anisopliae, M.
brunneum, M. guizhouense, M. lepidiotae, M. majus, M. pingshaense and M. robertsii.
However, this approach is not sufficiently powerful to differentiate new species or to
establish phylogenetic relationships (Mayerhofer et al., 2015; Castro et al., 2016).
In recent year, matrix assisted laser desorption ionization-time of flight mass
spectrometry (MALDI-TOF MS), a molecular based taxonomic tool, has been used to
identify and discriminate Metarhizium species rapidly and accurately (Lopes et al.
2014). However, the MALDI-TOF MS has limitation to identify new isolates as it

26
requires the spectral database contains peptide mass fingerprints (PMF) of the type
strains of specific species/strains (Singhal et al. 2015).
Species of Metarhizium are frequently isolated from the soil and are widely
distributed all over the world. As reviewed in Chapter 1, their distribution may be
associated with environmental and ecological factors, including plant hosts and soil
disturbance. The few studies conducted so far are not always consistent in describing
these factors. In Canada, a greater abundance of Metarhizium isolates were found in
cultivated sites (disturbed habitat) than in permanent forests (Bidochka et al. 1998),
while another study in Switzerland found that permanent grassland and field margins
contained a higher density of Metarhizium species than either forest or cultivated
arable land (Schneider et al. 2012). These differences may be due to differences in
methodology and analysis, but also suggest that different species or strains of
Metarhizium may adapt to ecotypes of different local habitats or regions under
different management conditions.
In this study, multilocus phylogenetic and population genetics analyses were used to
investigate the occurrence, diversity, systematics and gene flow of Metarhizium
species in three different habitats (arable crops, grassland and forests) at three
different locations of Queensland, Australia. The aim was to identify the species
found using DNA sequencing and to determine any apparent associations with habitat.

27
3.2 Materials and Methods
3.2.1 Collection of soil samples
Soil samples were collected from three of the Department of Agriculture and
Fisheries (DAF) research sites in Bundaberg (24.8471 S, 152.405 N), Gatton
(27.54445 N, 152.33157 E) and Kingaroy (26.57888 N, 151.83638 E) in Queensland,
Australia.
Three ecotypes were sampled at Bundaberg sites: maize field, grassland and forest.
Four ecotypes were sampled at both Gatton and Kingaroy: maize field, legume field,
grassland and forest.
All sampling sites in each location were located within 500 m of each other to
minimise factors other than ecotype. At each sampling site, four parallel transects
were made 10 m apart, and 20 samples per transect were collected at a separation of 5
m. For each sample, approximately 250-300 g of soil was collected with a soil trowel
to a depth of 10-15 cm. Eighty soil samples from each of the ecotype were collected
from each of the sites, a total of 880 samples. Soil samples were kept in individual zip
lock bags, labelled and stored at 4°C in a cold room until analysed.
3.2.2 Isolation of fungal isolates
Fungus isolation from soil samples was conducted as per the method described by
Kepler et al. (2014) with some modification. Soil samples were sieved through a 5-
mm mesh and 5 g of soil was suspended in 50 mL of sterile 0.1% Tween 80, in a 50-
mL screw cap plastic tube, and incubated at room temperature for 3 hours. The tubes
were inverted five times every 30 minutes. Following incubation, the tubes were kept
for sedimentation for 20 seconds. A volume of 100 µL of supernatant from each tube
was plated on a Petri plate with selective medium (SM) containing peptone 10g/L,

28
glucose 20 g/L, agar 18 g/L, cycloheximide 50 mg/L, streptomycin 100 mg/L,
tetracycline 50 mg/L and dodine 100 mg/L (Strasser et al., 1996).
Plates were incubated at 22° C for two weeks and examined for characteristic
Metarhizium growth) every 2-3 days. Isolates likely to be Metarhizium sp. were
identified by a characteristic amorphous, parallel, and compact mycelium with dark
green to yellow spores. The soil samples with characteristic Metarhizium colonies
were counted.
Typically, one colony was selected from each plate. However, if the morphology of
probable Metarhizium colonies were different (for example: spore colour), then
representative colonies of each variant were selected from each plate. The
characteristic fungal colonies were then sub-cultured to a fresh SDA plate without
antibiotics and given an identification number. The first letter of the sample identifier
indicates the location of sampling (B=Bundaberg, G=Gatton, K=Kingaroy); second
letter denotes the ecotypes (M= maize field, L= legume field, G=grassland, F= Forest),
the third letter denotes the transect letter (A, B, C, D) and the numbers are the
isolate’s serial number.
3.2.3 Genomic DNA extraction, PCR amplification, and sequencing
Fungal sub cultures were grown on Sabouraud dextrose agar with yeast (SDAY)
medium without antibiotics and further screened by ITS sequence analysis. DNA was
extracted as follows: approximately 200 mg of fungal mycelium was harvested off the
plate into a microcentrifuge tube, homogenised under liquid nitrogen with a pestle,
resuspended in 1 mL lysis buffer (400 mM Tris-HCl, pH 8.0, 60 mM EDTA, 150 mM
NaCl and 1% SDS) and incubated at 50°C for 1 hour in a water bath. A volume of
150 μl of precipitation buffer (5 M potassium acetate 60.0 mL, glacial acetic acid 11.5
mL, distilled water 28.5 mL) was added and vortexed and incubated on ice for 5

29
minutes. The aqueous layer was separated from the precipitated organic phase by
centrifugation at 10000 rcf for 1 minute. Following the centrifugation, 500 μl of
supernatant was transferred to a new microcentrifuge tube and an equal volume of
isopropanol was added to precipitate DNA. The DNA pellet was collected after
centrifugation at 18,000 rcf for 20 minutes and washed with 1 mL of 70% ethanol.
The DNA pellet was air dried for 10 minutes and dissolved in 100 μl of Tris-EDTA
(TE) buffer. The quality of the DNA was checked by electrophoresis through a 1.5%
agarose gel in 1x Tris-Borate-EDTA (TBE) buffer with gel red dye and 1kb plus
hyper-ladder, for 40 minutes at 90 volts.
The Internal transcribed spacer (ITS) region, intergenic sequence (MzIGS3) and 5’-
Transcription elongation factor (5’-TEF) regions of the fungal isolates were amplified
by polymerase chain reaction (PCR) and sequenced. The primer information and their
thermal PCR profiles are summarised in Table 3.1.
PCR products were subjected to electrophoresis in 1% agarose in 1x TBE buffer at
120 volts with GelRed nucleic acid stain and visualised under UV light using a
‘Molecular Imager® (Gel DocTM). The PCR products were purified using an ‘Isolate
DNA Kit’ (Bioline) following the standard manufacturer protocol. The purified PCR
products were prepared for sequencing using Big Bye Terminator V3.1 kit (ABI) with
forward sequencing primers ITS_1F, MzIGS3_2F and EF1T (Table 3.1). The samples
were cleaned using the ethanol/EDTA precipitation process as per the kit’s instruction.
Sequencing was conducted in the Central Analytical Research Facility (CARF),
Queensland University of Technology (QUT), Australia and Macrogen Corporation,
South Korea.

30
3.2.4 Phylogenetic tree construction
The Sanger sequence results were edited in Geneious v9.0.4 and compared to the
National Centre for Biotechnology Information (NCBI) database using Basic Local
Alignment Search Tool (BLAST) (BLAST result not shown) (Altschup et al., 1990,
Tatusova et al., 2014). The available reference nucleotide sequences for the three loci
were retrieved from NCBI. Multiple alignments of the nucleotide sequences were
done separately with their respective reference strains using a multiple sequence
alignment program MAFFT v7.2.8 in the Geneious v9.0.4 Plugin (Katoh and
Standley, 2013).

31
Table 3:1 Description of primers used in polymerase chain reactions (PCR).
Mark
er
Pri
mers
Nu
cle
oti
de s
eq
uen
ce
Init
ial
den
atu
rati
on
Den
atu
rati
on
An
nealin
g
Ext
en
sio
nT
ota
l
Cy
cle
Fin
al
Ext
en
sio
nR
efe
ren
ce
ITS
_1F
5’-
CT
TG
GT
CA
TT
TA
GA
GG
AA
GT
AA
ITS
_4R
5’-
TC
CT
CC
GC
TT
AT
TG
AT
AT
GC
MzI
GS
3_
2F
5’-
GT
GG
CT
CC
TG
AC
CA
TG
GT
TG
C
MZ
IGS
3_
3R
5’-
CG
GG
GG
AG
CC
GA
CT
TG
GA
TT
T
EF
1T
5’-
AT
GG
GT
AA
GG
AR
GA
CA
AG
AC
EF
2T
5’-
GG
AA
GT
AC
CA
GT
GA
TC
AT
GT
T72°C
, 10 m
Bis
ch
off
et
al.
(2009)
TE
F95°C
, 15 m
94°C
, 40 s
65°C
, 40 s
72 °
C, 2 m
45
72°C
, 15 m
Tu
inin
ga e
t al.
(2010)
MzI
GS
3 9
0°C
, 2 m
95°C
, 30 s
58°C
, 30 s
72 °
C, 1 m
40
72°C
, 15 m
Kep
ler
an
d
Reh
ner
(2013)
ITS
90°C
, 2 m
95°C
, 30 s
58°C
, 30 s
72 °
C, 1 m
40
Tab
le 3
.1 D
escr
ipti
on o
f pri
mer
s use
d i
n p
oly
mer
ase
chai
n r
eact
ions
(PC
R).

32
ITS phylogeny was conducted using the maximum likelihood (ML) analysis with the
available reference taxa: M. pingshaense ARSEF1009, M. guizhouense ARSEF977,
M. brunneum ARSEF820, M. anisopliae isolate 68, M. anisopliae isolate 69, M.
anisopliae isolate 251, M. anisopliae XL5001, M. robertsii ARSEF2575, Beauveria
bassiana 1040, Beauveria bassiana KSUBK54276, Isaria farinosa HNE3,
Lecanicillium sp. ID05 F0200 and Trichoderma viride ATCC28038. Three sequences
from genus Pochonia listed on MycoBank under the synonyms Metacordyceps
chlamydosporia UCR3, Metacordyceps chlamydosporia IAM14700, Cordyceps
chlamydosporia (Syn Metacordyceps chlamydosporia) NBRC9249 were included.
ML analyses were conducted for ITS data set using the software RAxML (Stamatakis,
2006) to search best-scoring tree under the GTRGAMMA model with 1000 replicates.
The individual data set of MzIGS3and 5’-TEF were aligned separately and trimmed
to include the first 729 bp (Kepler et al., 2014) and 549 bp, respectively. Phylogenetic
trees for single and concatenated data sets of MzIGS3 and 5’-TEF were developed
using the maximum likelihood (ML) and Bayesian inference analyses with the
currently recognized reference strains (M. globosum ARSEF 2596, M. acridum
ARSEF 7486, M. majus ARSEF 1914, M. lepidiotae ARSEF 7488, M. guizhouense
CBS 258.90, M. anisopliae ARSEF 7487, M. anisopliae 68, M. anisopliae 69, M.
anisopliae 251, M. pingshaense CBS 257.90 and M. robertsii ARSEF 7501). The
support values on the best-scoring ML tree, for each individual data set, was drawn in
RAxML with a rapid bootstrap (1000 replicates) under GTRGAMMA substitution
model. The multigene analysis combined the MzIGS3 and 5’-TEF data in a matrix
and ML analysis was done using the above parameters with each locus run in a
different partition. The software Mr. Bayes (Huelsenbeck and Ronquist, 2001,
Ronquist and Huelsenbeck, 2003) was used to determine posterior probabilities under
the GTR substitution model for single and combined data. The posterior output from

33
Mr. Bayes was obtained by running 4 MCMC heated chains with 1,000,000 generations,
sampling at every 1,000 after discarding the first 25% (burn-in value). The
phylogenetic trees were visualised and edited by TreeGraph 2 (Stover and Muller,
2010) and ‘ape’ package in R (Paradis et al., 2004).
3.2.5 DNA divergence, genetic differentiation and gene flow analysis
Nucleotide polymorphism, fixed, shared mutations, nucleotide diversity between the
M. anisopliae (Mani), M. robertsii (Mrob), M. pingshaense (Mpin), Metarhizium
indet. 1 (Mindet1) and Metarhizium indet. 2 (Mindet2) clades identified in multilocus
(MzIGS3 and 5’-TEF) phylogenetic analysis were calculated using DNAsp 5.10.01
(Rozas et al., 2003). In order to calculate the genetic differentiation within the
Metarhizium linages, haplotype-based statistics such as Hs and Hst (Hudson et al.,
1992a and 1992b) and nucleotide sequence-based statistics such as Ks, Kst and Snn
(Hudson’s statistic of genetic differentiation, Hudson et al., 2000) were estimated
with permutation tests using 1000 randomization to get the statistical significance in
DNAsp. The software also used to calculate the gene flow estimates, Nst and Fst
value, the indirect measurement of effective number of migrants (Nm) (Hudson et al.,
1992b) among the populations. DNA sequences from three locations and four
ecotypes were also used for genetic differentiation and gene flow studies.
3.2.6 Haplotype distribution analysis
Nucleotide sequence alignment of combined data set of MzIGS3 and 5’-TEF of
Metarhizium isolates was imported into DnaSP 5.10.01 for haplotypes analysis and
generation of haplotype data file in nexus file format. The nexus file was edited to add
clade, location and ecotype information in a character matrix and a minimum
spanning network (MSN) was constructed in PopART (http://popart.otago.ac.nz) to
determine the relationships among haplotypes for Metarhizium population in different

34
clades, locations and ecotypes. The MSN is based on a minimum spanning tree where
a set of sequence types connects all given types without creating any cycles where the
total length (sum of distance between linked sequences) is minimum (Bandelt et al.,
1999).
3.2.7 Statistical analysis
The mean percent presence of Metarhizium in soil samples data were compared using
a generalised linear model (GLM) with the logit link function in ‘R’ (R core team,
2016). Tukey’s post-hoc test was conducted using ‘lsmeans’ package to determine
statistical significant differences among locations and ecotypes
35
3.3 Results
3.3.1 Occurrence of Metarhizium isolates
Metarhizium isolates were recovered from all 3 locations, and from all ecotypes:
agricultural crops, grasslands and forest soils. A total of 313 isolates were obtained
from 880 soil samples using the selective medium and preliminary isolation based on
morphology. BLAST analysis of the ITS data showed that out of these 313 isolates,
164 were from the genus Metarhizium, 29 from the genus Beauveria and Isaria, 2
from genus Lecanicillium, and 6 from genus Pochonia. The rest of the isolates were
members of the genera Penicillium, Purpureocillium and Spiromastix.
As discussed above, several species of the Metacordyceps have been recognised as
members of Metarhizium genus; for example, Metarhizium atrovirens, Metarhizium
brittlebankisoides etc. (Kepler et al. 2014). The species Pochonia chlamydosporia,
(synonymously Cordyceps chlamydosporia, and Metacordyceps chlamydosporia), is
not within the boundaries of Metarhizium and remain classified in genus Pochonia
(Kepler et al. 2014). The 6 isolates identified as genus Pochonia (Syn Metacordyceps,
Cordyceps) were excluded from subsequent analysis (fig 3.8, supplementary data).
Table 3.2 shows the presence of the Metarhizium isolates in the number of soil
samples in sampling locations and sites.

36
Table 3:2 The number of soil samples with Metarhizium isolates in different
locations and ecotypes.
Location Ecotypes Number of
soil samples
collected
Number of soil samples in which Metarhizium
colony observed
Bundaberg
Maize field 80 10
Grassland 80 1
Forest 80 12
Gatton
Maize field 80 0
Legume field 80 1
Grassland 80 3
Forest 80 5
Kingaroy
Maize field 80 13
Legume field 80 13
Grassland 80 0
Forest 80 0
Metarhizium was recovered from just 6.60% of soil samples from 880 total soil
samples. The highest percentage of soil samples within a location that contained
Metarhizium were found in Bundaberg (9.58%) and Kingaroy (8.13%) (Figure 3.1).
Metarhizium was recovered from a significantly smaller number of soil samples in
Gatton (2.81%).
When ecotypes were compared, there was no significant difference between the mean
percentage of soil samples containing Metarhizium in agricultural soils or forests, but
a significantly lower occurrence in grassland (p < 0.05). The agricultural and forest
soils had the higher percentages of samples containing Metarhizium: 9.58% of soil
samples in maize, 8.75% of soil samples from legume fields and 7.10% of samples
from forest. Grassland had a significantly lower proportion of soil samples (1.67%)
containing Metarhizium isolates than either crops or forests. (Figure 3.1).

37
Figure 3.1 Mean percentage of occurrence of Metarhizium in soil samples
collected from different locations (above) and ecotypes (below) of Queensland.
Bar plot (mean percentageSEM) with different lowercase letter indicates
statistical differences on Tukey’s post hoc test (GLM, p < 0.05).
Overall, a higher percentage of occurrence of Metarhizium was observed in samples
from disturbed (crop) habitat (9.25%) than from natural (grassland, forest) habitats
(4.38%) (Figure 3.2). The result was not consistent across locations: higher
percentages of isolate occurrence were observed in soil samples from disturbed
habitats in Kingaroy and Bundaberg, and no isolates were recovered from undisturbed
habitats in Kingaroy. In contrast, occurrence of Metarhizium in samples from Gatton
and Bundaberg samples was not significantly different in samples natural habitat from

38
those in the disturbed (crop), and only a very small proportion of samples from crops
at Gatton contained any isolates.
Figure 3.2 Mean percentage of occurrence of Metarhizium in soil samples
collected from different disturbed and natural habitats (above) and disturbed and
natural habitats of three locations of Queensland (below). Bar plot (mean
percentageSEM) with different lowercase letter indicates statistical differences
on Tukey’s post hoc test (GLM, p < 0.05).

39
3.3.2 ITS phylogeny
A maximum likelihood phylogenetic analysis was conducted using the ITS sequence
information of 164 field isolates with entomopathogenic reference strains of the
genera Metarhizium, Beauveria, Isaria, and Lecanicillium, with Trichoderma viride
as an outgroup. Reference sequences of the genus Pochonia, which are published on
Mycobank as ‘Cordyceps chlamydosporia’ and its synonym ‘Metacordyceps
chlamydosporia’ that have been reclassified as Pochonia chlamydosporia, are
identified by the Mycobank species labels but the cluster is labelled genus ‘Pochonia’
(supplementary data Figure 3.8). The result shows four major clades with very high
bootstrap support values (supplementary data Figure 3.8). The Metarhizium clade
includes 164 fungal isolates, whereas the other three clades (including genus
Pochonia) are distinct from the Metarhizium clade with high support values.
3.3.3 Phylogenetic analysis
A total of 164 Metarhizium isolates from different locations and sites were selected
for the single locus and multilocus phylogenetic analyses based on the ITS sequence.
Phylogenetic analyses using MzIGS3 and 5’-TEF were not congruent and showed a
number of phylogenetic groups with less number of isolates and polytomies in single
gene analyses. Analysis of the 5’-TEF locus differentiated 1 clade (M. anisopliae)
using ML analysis and 2 clades (M. anisopliae and M. pingshaense) using Bayesian
analysis. The MzIGS3 marker differentiated more clades than 5’-TEF: 3 clades
(Metarhizium sp. indet. 1, Metarhizium sp. indet. 2 and M. pingshaense) using ML
analysis and 5 clades (M. robertsii, Metarhizium sp. indet. 1, Metarhizium sp. indet. 2,
M. pingshaense and M. anisopliae) using Bayesian analysis.

40
The combined two-gene (MzIGS3 and 5’-TEF) dataset totalled 1278 bp and included
MzIGS3 (729bp) and 5’-TEF (549bp) partition. Maximum likelihood and Bayesian
trees of combined analysis of two-gene (MzIGS3 and 5’-TEF) resolved the taxonomic
relationships of all isolates and showed similar topology (Figure 3.3). Both the
analyses identified five major clades of Metarhizium species, three of which grouped
with reference M. robertsii, M. anisopliae and M. pingshaense and two taxonomically
unassigned clades named as Metarhizium indet. 1 (indeterminate 1) and Metarhizium
indet. 2 (indeterminate 2) with high support values (>70%). In both cases, M.
robertsii clade includes the highest number of isolates (n=83), followed by
Metarhizium sp. indet. 1 clade (n=48) and Metarhizium sp. indet. 2 clade (n=11). M.
pingshaense and M. anisopliae clades included 6 and 16 isolates respectively. Figure
3.3 shows the maximum likelihood tree of the combined data set of two genes. The
Bayesian tree is in supplementary data (Figure 3.9).
The combined data of three-gene (MzIGS3, 5’-TEF and ITS) contained a total of
1905 bp and included MzIGS3 (729bp), 5’-TEF (549bp) and ITS (627bp) partition.
The three-gene phylogenetic tree produced similar topology of two-gene tree only in
ML analysis and but fewer clades in Bayesian analysis (Supplementary data Figure
3.14 and 3.15). However, both ML and Bayesian trees that included ITS resulted in
lower statistical supports compared to two-gene trees. The ITS locus and its
combination with other two loci were excluded from further population genetics
analysis.
The summary information retrieved from the single gene and multi-gene analyses of
the Queensland Metarhizium isolates is given in Table 3.3. Phylogenetic trees for
MzIGS3 and 5’-TEF data sets and three- gene-combined data sets (ITS, MzIGS3 and
5’-TEF) are provided as supplementary data (Figure 3.10: ML tree of MzIGS3 data,

41
Figure 3.11: ML tree of 5’-TEF data, Figure 3.12: Bayesian tree of MzIGS3 data,
Figure 3.13: Bayesian tree of 5’-TEF data, Figure 3.14: ML tree of three-gene
combined data, Figure 3.15: Bayesian tree of three-gene combined data).
Table 3:3 Summary tables of phylogenetic analyses showed the number of isolates
included in the clade with its support values (in parenthesis). NR denotes clade not
resolved in the analysis. Table 3.3A shows the value for three major clades: M.
robertsii, M. pingshaense plus Metarhizium indet. spp. and M. anisopliae. Table
3.3B shows the values for M. pingshaense and Metarhizium indet. clades. Table
3.3C shows the values for M. pingshaense and Metarhizium indet. 1 and
Metarhizium indet. 2 clades.
A.
Marker Clade Maximum
likelihood Bayesian inference
5’-TEF
M. robertsii NR NR
M. pingshaense &
Metarhizium indet. NR 28 (0.71)
M. anisopliae 17 (81%) 17 (0.70)
MzIGS3
M. robertsii NR 38 (0.99)
M. pingshaense &
Metarhizium indet. spp. 65 (98%) 65 (1.00)
M. anisopliae NR 16 (0.89)
Combined
(MzIGS3 & 5’-
TEF)
M. robertsii 83 (75%) 83 (0.72)
M. pingshaense &
Metarhizium indet. spp. 65 (100%) 65 (1.00)
M. anisopliae 16 (93%) 16 (0.76)
Combined
(MzIGS3, 5’-TEF
and ITS)
M. robertsii 83 (71%) NR
M. pingshaense &
Metarhizium indet. spp. 65 (100%) 65 (1.00)
M. anisopliae 16 (87%) 16 (0.76)
(Continued)

42
Table 3.3 (Continued)
B.
Marker Clade Maximum
likelihood Bayesian inference
5’-TEF Metarhizium indet. spp. NR NR
M. pingshaense NR 28 (0.71)
MzIGS3 Metarhizium indet. spp. 59 (92%) 59 (1.00)
M. pingshaense 6 (100%) 6 (1.00)
Combined
(MzIGS3 & 5’-
TEF)
Metarhizium indet. spp. 59 (82%) 59 (1.00)
M. pingshaense 6 (84%) 6 (1.00)
Combined
(MzIGS3, 5’-TEF
and ITS)
Metarhizium indet. spp. 59 (85%) 59 (0.78)
M. pingshaense 6 (84%) 6 (1.00)
C.
Marker Clade Maximum likelihood Bayesian inference
5’-TEF
Metarhizium indet. 1 NR NR
Metarhizium indet. 2 NR NR
M. pingshaense NR 28 (0.71)
MzIGS3
Metarhizium indet. 1 48 (96%) 48 (1.00)
Metarhizium indet. 2 11 (98%) 11 (1.00)
M. pingshaense 6 (100%) 6 (1.00)
Combined
(MzIGS3 & 5’-
TEF)
Metarhizium indet. 1 48 (91%) 48 (1.00)
Metarhizium indet. 2 11 (84%) 11 (1.00)
M. pingshaense 6 (84%) 6 (1.00)
Combined
(MzIGS3, 5’-TEF
and ITS)
Metarhizium indet. 1 48 (87%) 48 (0.79)
Metarhizium indet. 2 11 (83%) 11 (1.00)
M. pingshaense 6 (84%) 6 (1.00)

43
(83)
(48)
(11)
(16)
((6)M. pingshaense Clade (6)
Figure 3.3 Phylogenetic tree of concatenated data set of 5’TEF and MzIGS3 of 164
isolates of the genus Metarhizium with reference strains. Clades containing multiple
sequences were collapsed and are presented as triangles marked by the clade name
with number of isolates retained by each clade in parenthesis. Clade supporting
value obtained from maximum likelihood (above) and Bayesian (below) analyses
were presented in the node.

44
Figure 3.4 (continued)

45
M. pingshaense CBS257.90
M. pingshaense
M. anisopliae isolate 68M. anisopliae isolate 69M. anisopliae isolate 251
Metarhizium indet. 1
Metarhizium indet. 2
Figure 3.4 Maximum likelihood tree of concatenated data set of MzIGS3 and 5’-
TEF of 164 Australian Metarhizium isolates with reference strains

46
3.3.4 DNA divergence, genetic differentiation and gene flow
The summary statistics of DNA divergence in the comparison between the
Metarhizium clades for MzIGS3, 5’-TEF and combined MzIGS3 and 5’-TEF loci are
presented in Table 3.4. A greater number of polymorphic sites and nucleotide
differences were observed in the combined data set in data for an individual locus. In
combined gene analysis, the lowest value of the average number of nucleotide
differences (k) value, 6.59, was observed for M. robertsii-M. indet. 2 pair, while the
highest value, 30.44, was observed for M. anisopliae-M. indet. 2 pair. The highest
value of nucleotide diversity (π), 0.043, was found in M. anisopliae- M. indet. 2
comparisons and the lowest, 0.012, was found in M. pingshaense- M. indet. 1
comparison in combined locus analysis.
In the comparisons between the Bundaberg, Gatton and Kingaroy populations, the
number of polymorphic sites, nucleotide differences (k) and nucleotide diversity (π)
were higher in Bundaberg-Kingaroy comparison, and lower in the Gatton-Kingaroy
and Bundaberg-Gatton comparisons (Table 3.5).
The DNA divergence results in comparisons between the ecotypes populations were
presented in Table 3.6. The highest number of polymorphic site, nucleotide
differences (k) and nucleotide diversity (π) were observed between Legume-Forest
populations and the lowest value observed between the Grassland-Forest comparison.

47
Locu
sC
lad
es
No. of
poly
morp
hic
site
No. of
fixed
dif
fere
nce
s
No. of
site
s
poly
morp
hic
vs
mon
om
orp
hic
*
No. of
site
s
poly
morp
hic
vs
mon
om
orop
hic
**
Sh
ared
mu
tati
on
s
Avera
ge n
o. of
nu
celo
tid
e
sub
stit
uti
on
(Dxy)
Avera
ge
nu
mb
er o
f
nu
celo
tid
e
dif
fere
nce
s (k
)
Nu
cleo
tid
e
div
ers
ity
(π)
M. anis
opli
ae-
M. ro
ber
tsii
00
00
00
00
M. anis
opli
ae-
M. pin
gsh
aen
se175
20
163
10
0.0
5613
24.7
23
0.0
4176
M. anis
opli
ae-
M.
indet.
1142
19
66
66
50.0
7523
12.9
18
0.0
3618
M. anis
opli
ae
-M. in
det.
2140
16
130
00
0.0
9281
19.6
07
0.0
6557
M. ro
bert
sii-
M. pin
gsh
aen
se0
00
00
00
0
M. ro
bert
sii-
M.
indet.
10
00
00
00
0
M. ro
bert
sii-
M.
indet.
20
00
00
00
0
M. pin
gsh
aense
-M.
indet.
185
12
077
00.0
3968
6.5
79
0.0
1649
M. pin
gsh
aense
-M.
indet.
211
11
00
00.0
3056
5.3
38
0.0
1483
M.
indet.
1-M
. in
det.
230
327
00
0.0
1528
2.0
97
0.0
0859
M. anis
opli
ae-
M. ro
ber
tsii
192
01
214
80.0
2994
8.6
17
0.0
2329
M. anis
opli
ae-
M. pin
gsh
aen
se25
910
35
0.0
2521
7.0
87
0.0
1392
M. anis
opli
ae-
M.
indet.
166
77
51
60.0
2447
7.3
45
0.0
1457
M. anis
opli
ae
-M. in
det.
279
37
69
80.0
3558
10.8
32
0.0
2655
M. ro
bert
sii-
M. pin
gsh
aen
se194
2217
05
0.0
2845
8.2
24
0.0
2223
M. ro
bert
sii-
M.
indet.
1197
1199
823
0.0
2835
8.4
44
0.0
2282
M. ro
bert
sii-
M.
indet.
2153
0131
26
20
0.0
6464
6.5
86
0.0
2217
M. pin
gsh
aense
-M.
indet.
158
01
51
70.0
0794
4.4
39
0.0
0876
M. pin
gsh
aense
-M.
indet.
273
00
69
80.0
32
13.3
68
0.0
326
M.
indet.
1-M
. in
det.
281
014
48
26
0.0
3091
6.8
73
0.0
1697
M. anis
opli
ae-
M. ro
ber
tsii
192
01
214
80.0
2994
8.6
17
0.0
2329
M. anis
opli
ae-
M. pin
gsh
aen
se200
29
173
45
0.0
4184
31.8
10.0
2889
M. anis
opli
ae-
M.
indet.
1208
26
73
117
11
0.0
4552
20.2
63
0.0
2353
M. anis
opli
ae
-M. in
det.
2219
19
137
69
80.0
5978
30.4
39
0.0
4305
M. ro
bert
sii-
M. pin
gsh
aen
se194
2217
05
0.0
2845
8.2
24
0.0
2223
M. ro
bert
sii-
M.
indet.
1197
1199
823
0.0
2835
8.4
44
0.0
2282
M. ro
bert
sii-
M.
indet.
2153
0131
26
20
0.0
3464
6.5
86
0.0
2217
M. pin
gsh
aense
-M.
indet.
1143
12
1128
70.0
2192
11.0
18
0.0
1216
M. pin
gsh
aense
-M.
indet.
284
11
069
80.0
3133
18.7
06
0.0
2429
M.
indet.
1-M
. in
det.
2111
341
48
26
0.0
2503
8.9
70.0
1382
MzI
GS
3
5'-
TE
F
Com
bin
ed
MzI
GS
3
and 5'-
TE
F
Table 3:4 DNA divergence data between the clades of Metarhizium in the two analysed
loci and combined data set

48
Table 3:5 DNA divergence data between the populations of Metarhizium in different
locations for combined MzIGS3 and 5’-TEF data set
Table 3:6 DNA divergence data between the populations of Metarhizium in different
ecotypes for combined MzIGS3 and 5’-TEF data set

49
Table 3.7 shows the genetic differentiation and gene flow estimates for the
comparisons between the Metarhizium clades. The genetic differentiation was
evaluated by calculating both haplotype indices (Hs and Hst) and nucleotide indices
(Ks, Kst and Snn). The Kst value close to zero indicates no differentiation and Snn
value close to one indicates differentiation (Hudson, 2000). The statistical significant
values for Ks, and Kst were observed for all comparisons between the Metarhizium
clades revealed the presence of strong genetic differentiation. The highly significant
(P<0.001) Snn value ranged from 0.977 to 1.000, indicating high genetic
differentiation between the clades. The higher Fst values between M. anisopliae-M.
robertsii (0.58), M. anisopliae –M. pingshaense (0.70), M. anisopliae –M. indet. 1
(0.75), M. anisopliae –M. indet. 2 (0.58), M. robertsii - M. pingshaense (0.51), M.
pingshaense - M. indet. 1 (0.68) and M. pingshaense – M. indet. 2 (0.59) indicate
restricted gene flow between the populations. In contrast, the lower Fst values
between M. robertsii - M. indet. 1 (0.49), M. robertsii - M. indet. 2 (0.27) and M.
indet. 1 - M. indet. 2 (0.36) indicates moderate gene flow between the populations.
Table 3:7 Genetic differentiation and gene flow of combined MzIGS3 and 5’-TEF
genes between different Metarhizium clades.
Clades Genetic differentiation estimate
Gene flow
estimate
Hs Hst Ks Kst Snn Nst Fst
M. anisopliae-M. robertsii 0.85*** 0.067*** 6.85*** 0.20*** 0.97*** 0.54 0.58
M. anisopliae-M. pingshaense 0.88* 0.048* 18.46*** 0.42*** 1.00*** 0.69 0.70
M. anisopliae-M. indet. 1 0.87*** 0.067*** 9.01*** 0.56*** 1.00*** 0.75 0.75
M. anisopliae-M. indet. 2 0.90** 0.051** 18.24*** 0.04*** 1.00*** 0.57 0.58
M. robertsii-M. pingshaense 0.89** 0.016** 7.55*** 0.08*** 0.99*** 0.47 0.51
M. robertsii-M. indet. 1 0.85*** 0.083*** 6.05*** 0.28*** 0.99*** 0.46 0.49
M. robertsii-M. indet. 2 0.89*** 0.026*** 6.01*** 0.09*** 0.98*** 0.25 0.27
M. pingshaense-M. indet. 1 0.89** 0.025** 8.28*** 0.25*** 1.00*** 0.69 0.68
M. pingshaense-M. indet. 2 0.92* 0.044* 11.85*** 0.37*** 1.00*** 0.59 0.59
M. indet. 1-M. indet. 2 0.90** 0.027** 7.18*** 0.20*** 0.98*** 0.36 0.36
Probability obtained by the permutation test with 1000 replicates:
*=0.01<P<0.05; **= 0.001<P<0.01; ***= P<0.001

50
The Ks, Kst and Snn values observed in the comparisons between the Metarhizium
populations from different locations indicate low genetic differentiations between the
populations (Table 3.8). This is supported by the low Fst values observed in all
comparison, which indicates high gene flow between the locations.
Table 3:8 Genetic differentiation and gene flow of combined MzIGS3 and 5’-TEF
genes between Metarhizium populations in different locations
Location Genetic differentiation estimate Gene flow estimate
Hs Hst Ks Kst Snn Nst Fst
Bundaberg-Gatton 0.92** 0.018** 4.86*** 0.072*** 0.82*** 0.15 0.17
Bundaberg-Kingaroy 0.94*** 0.019*** 18.62* 0.025* 0.83*** 0.06 0.06
Gatton-Kingaroy 0.88*** 0.051*** 7.45*** 0.149*** 0.81*** 0.23 0.26
Probability obtained by the permutation test with 1000 replicates
*, 0.01<P<0.05; **, 0.001<P<0.01; ***, P<0.001
The genetic differentiation and gene flow estimates between the Metarhizium
populations in the ecotypes were also obtained (Table 3.9). The strong genetic
differentiation and moderate gene flow were observed between Maize-Grassland,
Maize-Forest, Legume-Grassland and Grassland-Forest populations supported by
significant Ks, Kst and Snn indices and Fst values. Low genetic differences and
moderate gene flow observed in Maize-Legume comparison. The insignificant Kst
value (0.075, close to zero) and low Fst (0.01957) observed between isolates from
Legume-Forest denote the low genetic differences and high gene flow between the
populations.

51
Table 3:9 Genetic differentiation and gene flow of combined MzIGS3 and 5’-TEF
genes between Metarhizium populations in different ecotypes. Isolates from forest
and legume showed no low differentiation.
Probability obtained by the permutation test with 1000 replicates:
*= 0.01<P<0.05; **= 0.001<P<0.01; ***= P<0.001; ns= not significant
Ecotypes Genetic differentiation estimate Gene flow estimate
Hs Hst Ks Kst Snn Nst Fst
Maize-Legume 0.91*** 0.038*** 14.02*** 0.030*** 0.97*** 0.42 0.44
Maize-Grassland 0.81*** 0.104*** 4.78*** 0.390*** 0.95*** 0.55 0.56
Maize-Forest 0.89*** 0.057*** 9.33*** 0.344*** 0.92*** 0.50 0.50
Legume-Grassland 0.87*** 0.060*** 12.38*** 0.129*** 0.97*** 0.19 0.21
Legume-Forest 0.92ns 0.007ns 25.39ns 0.075ns 0.60* 0.02 0.02
Grassland-Forest 0.84*** 0.089*** 4.59*** 0.092*** 0.95*** 0.17 0.17

52
3.3.5. Haplotype analysis
The combined nucleotide sequences identified 50 haplotypes in 164 Metarhizium
isolates from Queensland. Table 3.10 is showing the clades and isolates from which
haplotypes were detected. The clade-haplotype analysis found one haplotype (number
9) shared by three clades: M. pingshaense, M. indet. 1 and M. indet. 2. Haplotype
numbers 8 and 9 were common in M. pingshaense and M. indet. 1 populations. M.
anisopliae and M. robertsii shared one haplotype (number 1). Clades within the ‘M.
pingshaense’ complex (M. indet. 1, M. indet. 2 and M. pingshaense) shared
haplotypes, and clades within the ‘M. robertsii/M. anisopliae’ complex shared 1
haplotype, but there were no shared haplotypes between the two complexes. The
haplotype network presented in Figure 3.4 showed the haplotype distribution in
among the Metarhizium populations of different Metarhizium taxonomic groups. The
number of shared haplotypes in comparisons of the populations of different groups of
phylogenetic clades, locations and ecotypes are presented in Table 3.11.
The location-haplotype analysis found that all the locations, Bundaberg, Gatton and
Kingaroy shared three common haplotypes (haplotype numbers 4, 7 and 17).
Haplotype numbers 12 and 16 were common in Bundaberg and Kingaroy populations,
whereas two haplotypes (number 18 and 27) were common in Gatton and Kingaroy
populations. The haplotype network presented in Figure 3.5 showed the haplotype
distribution in among the Metarhizium populations of different locations.
The ecotype-haplotype relationship analysis found two common haplotypes (numbers
1 and 8) among the Metarhizium populations of maize, legume and forest. Two
haplotypes (numbers 2 and 9) was shared between maize and legume populations; and

53
Table 3:10 Distribution of haplotypes within Metarhizium clades and isolates
Haplotype
number
Species Isolate
Haplotype 1 M. anisopliae GFA1.1, GFA1.2, GFA1.3, GFA1.4, GFA1.5, GFA6.1,
KLB11, KLC3.1, KLC3.2, KLA17.5
M. robertsii KLC3.3
Haplotype 2 M. anisopliae KLB7
Haplotype 3 M. anisopliae KLB16
Haplotype 4 M. anisopliae KLD5.1
Haplotype 5 M. anisopliae KLA17.4
Haplotype 6 M. anisopliae KLA17.6
Haplotype 7 M. anisopliae KLA17.8
Haplotype 8 M. pingshaense KLA17.1
M. indet. 1 KMA12.5, KMC9.6
Haplotype 9 M. pingshaense KLA17.2, KLD5.2
M. indet. 2 BMB5
M. indet. 1 KMA4.4, KMA12.3, KMA13.2, KMC7.4, KMC9.7, KMC9.8,
KMD5.1, KMD5.2, KMD11.3, KMD17.2, KMD17.3,
KMD17.4
Haplotype 10 M. pingshaense KLA17.3, GFB1.2
M. indet. 1 BMD20, KMA4.1, KMA4.2, KMA4.3, KMA12.1, KMA12.2,
KMA12.4, KMA17, KMC1.1, KMC1.2, KMC5.2, KMC7.1,
KMC7.2, KMC7.3, KMC9.1, KMC9.3, KMC9.4, KMC9.5,
KMD17.1
Haplotype 11 M. pingshaense GFB1.1
Haplotype 12 M. indet. 2 BMB10
Haplotype 13 M. indet. 2 BMC1
Haplotype 14 M. indet. 2 BMC10, BMD1, BMD2.1, BFA12.1
Haplotype 15 M. indet. 2 BFA11
Haplotype 16 M. indet. 2 BFA20.1
Haplotype 17 M. indet. 2 BFB10.1
Haplotype 18 M. indet. 2 BFB13
Haplotype 19 M. indet. 1 GGB19.1
Haplotype 20 M. indet. 1 GGB19.2, GGB19.3
Haplotype 21 M. indet. 1 GGB19.4
Haplotype 22 M. indet. 1 BFC12
Haplotype 23 M. indet. 1 BMD5
Haplotype 24 M. indet. 1 BMD9, KMC1.3, KMD9, KMD11.2
Haplotype 25 M. indet. 1 KMA13.1
Haplotype 26 M. indet. 1 KMC5.1
Haplotype 27 M. indet. 1 KMC9.2
Haplotype 28 M. indet. 1 KMC17, KMD11.1
(Continued)
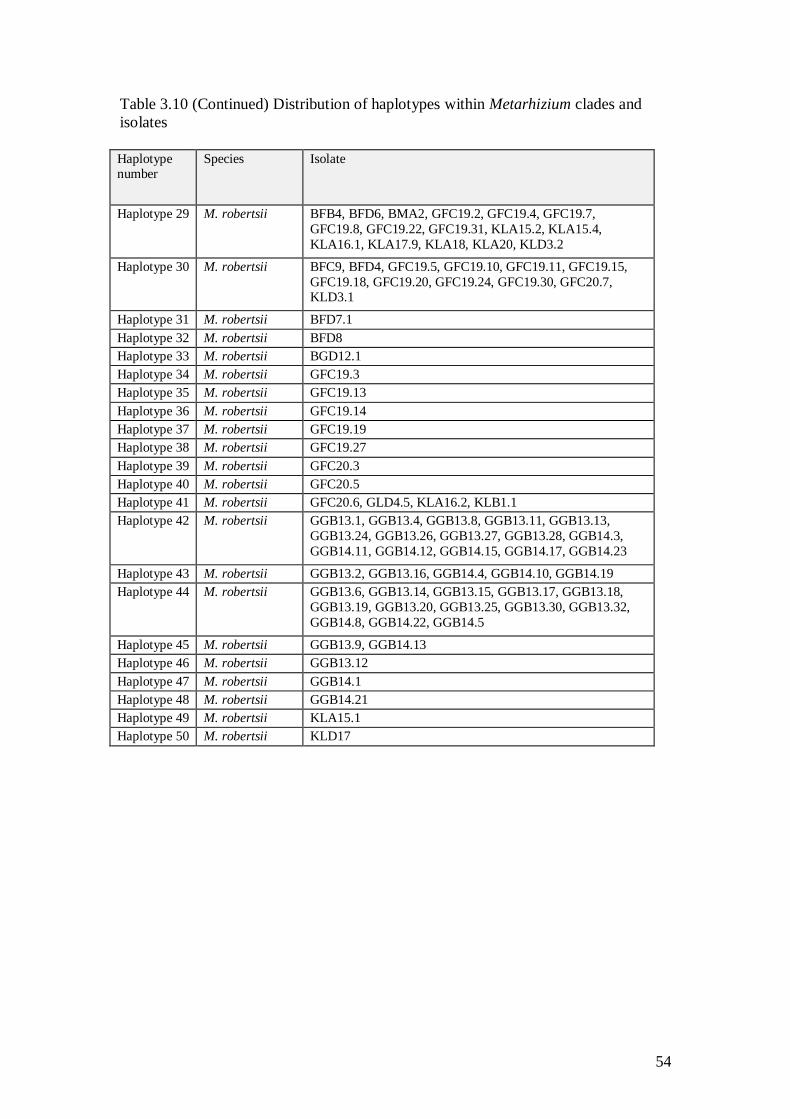
54
Table 3.10 (Continued) Distribution of haplotypes within Metarhizium clades and
isolates
Haplotype number
Species Isolate
Haplotype 29 M. robertsii BFB4, BFD6, BMA2, GFC19.2, GFC19.4, GFC19.7,
GFC19.8, GFC19.22, GFC19.31, KLA15.2, KLA15.4,
KLA16.1, KLA17.9, KLA18, KLA20, KLD3.2
Haplotype 30 M. robertsii BFC9, BFD4, GFC19.5, GFC19.10, GFC19.11, GFC19.15,
GFC19.18, GFC19.20, GFC19.24, GFC19.30, GFC20.7, KLD3.1
Haplotype 31 M. robertsii BFD7.1
Haplotype 32 M. robertsii BFD8
Haplotype 33 M. robertsii BGD12.1
Haplotype 34 M. robertsii GFC19.3
Haplotype 35 M. robertsii GFC19.13
Haplotype 36 M. robertsii GFC19.14
Haplotype 37 M. robertsii GFC19.19
Haplotype 38 M. robertsii GFC19.27
Haplotype 39 M. robertsii GFC20.3
Haplotype 40 M. robertsii GFC20.5
Haplotype 41 M. robertsii GFC20.6, GLD4.5, KLA16.2, KLB1.1
Haplotype 42 M. robertsii GGB13.1, GGB13.4, GGB13.8, GGB13.11, GGB13.13,
GGB13.24, GGB13.26, GGB13.27, GGB13.28, GGB14.3,
GGB14.11, GGB14.12, GGB14.15, GGB14.17, GGB14.23
Haplotype 43 M. robertsii GGB13.2, GGB13.16, GGB14.4, GGB14.10, GGB14.19
Haplotype 44 M. robertsii GGB13.6, GGB13.14, GGB13.15, GGB13.17, GGB13.18,
GGB13.19, GGB13.20, GGB13.25, GGB13.30, GGB13.32,
GGB14.8, GGB14.22, GGB14.5
Haplotype 45 M. robertsii GGB13.9, GGB14.13
Haplotype 46 M. robertsii GGB13.12
Haplotype 47 M. robertsii GGB14.1
Haplotype 48 M. robertsii GGB14.21
Haplotype 49 M. robertsii KLA15.1
Haplotype 50 M. robertsii KLD17

55
haplotype number 5 was common in maize and forest populations. Three haplotypes
(numbers 14, 17 and 22) were shared between in legume and forest. There was no
shared haplotype between the grassland haplotypes and haplotypes from other
ecotypes. Figure 3.6 illustrated the haplotype distribution among the Metarhizium
populations from different ecotypes.
Table 3:11 Number of shared haplotypes of Metarhizium populations between the
groups of clades (A), locations (B) and ecotypes (C)
A.
Clades Shared haplotype
M. anisopliae-M. robertsii 1
M. anisopliae-M. pingshaense 0
M. anisopliae-M. indet. 1 0
M. anisopliae-M. indet. 2 0
M. robertsii-M. pingshaense 0
M. robertsii-M. indet. 1 0
M. robertsii-M. indet. 2 0
M. pingshaense-M. indet. 1 3
M. pingshaense-M. indet. 2 1
M. indet. 1-M. indet. 2 1
B.
Locations Shared haplotype
Bundaberg-Gatton 3
Bundaberg-Kingaroy 5
Gatton-Kingaroy 3
C.
Ecotypes Shared haplotype
Maize-Legume 3
Maize-Grassland 0
Maize-Forest 3
Legume-Grassland 0
Legume-Forest 5
Grassland-Forest 0

56
M. pingshaense
M. anisopliae
M. robertsii
M. indet. 1
M. indet. 2
Figure 3.5 Haplotype networks for the Metarhizium populations from five groups of
isolates based on combined sequence data. Different ‘pie’ colours in the circles
indicate the location of haplotype origin, with size of the circles indicating number of
specimens; pie-segmentation is proportional to haplotype frequency. Perpendicular
tick marks on the lines represent the mutations between the linked haplotypes. Clades
within the ‘M. pingshaense’ complex (M. indet. 1, M. indet. 2 and M. pingshaense)
shared haplotypes, and clades within the ‘M. robertsii/M. anisopliae’ complex shared
1 haplotype, but there were no shared haplotypes between the two complexes.

57
Figure 3.6 Haplotype networks for the Metarhizium populations from three locations
based on combined sequence data. Different ‘pie’ colours in the circles indicate the
location of haplotype origin, with size of the circles indicating number of specimens;
pie-segmentation is proportional to haplotype frequency. Perpendicular tick marks on
the lines represent the mutations between the linked haplotypes.

58
Figure 3.7 Haplotype networks for the Metarhizium populations from four ecotypes
based on combined sequence data. Different ‘pie’ colours in the circles indicate the
location of haplotype origin, with size of the circles indicating number of specimens;
pie-segmentation is proportional to haplotype frequency. Perpendicular tick marks on
the lines represent the mutations between the linked haplotypes. None of the 11
grassland haplotypes (purple) were shared with any other ecotype.

59
3.4 Discussion This study has six major findings.
1. Metarhizium species were widely distributed in the Queensland’s soils and
recovery of isolates from soil samples from disturbed (crop) soils were overall
significantly higher than in samples from undisturbed (forest, grassland),
though the results were not consistent across sites.
2. Multilocus phylogenetic analysis with 5’-TEF and MzIGS3 nuclear regions
were found to be suitable for taxonomic identification and analysis of cryptic
species amongst the field isolates of Metarhizium.
3. Two new Metarhizium indeterminate species (provisionally named M. indet. 1
and M. indet. 2) were identified in a complex with M. pingshaense, and their
species status was strongly supported by the genetic differentiation.
4. Clades within the ‘M. pingshaense’ complex (M. indet. 1, M. indet. 2 and M.
pingshaense) shared haplotypes, and clades within the ‘M. robertsii/M.
anisopliae’ complex shared 1 haplotype, but there were no shared haplotypes
between the two groups.
5. Moderate genetic differences were observed between the Metarhizium
population from different location, with moderate gene flow between
Metarhizium populations across geographical location.
6. There was significant genetic differentiation between isolates from grassland
and those from other ecotypes, and none of the 11 haplotypes from grassland
were shared with any other ecotype. In contrast, there was very low genetic
differentiation between isolates from forest and legume crops, with 5 shared
haplotypes.
Metarhizium isolates were recovered from all 3 locations, and from all ecotypes:
agricultural crops, grasslands and forest soils. However, Metarhizium was recovered

60
from just 6.70% of soil samples from 880 total soil samples which is a lower rate of
recovery than the occurrence of Metarhizium reported elsewhere. The recovery rate
was reported as 28% in Tasmania, Australia (Rath et al., 1992), and outside of
Australia at 17.5% in the UK (Chandler et. al., 1998), 19.3% in Switzerland
(Schneider et al., 2011), 44.6% in Finland (Vanninen et al., 1989), 71.7% in Spain
(Quesada-Moraga et al., 2007), and 91% in Canada (Bidochka et al., 1998). However,
these recovery percentages are not comparable, as the fungal isolation techniques for
entomopathogens were different in different studies. For instance, the Tasmanian soil
study used the agar plate isolation technique, whereas the studies in Spain, Canada
and UK used the insect bait method.
The proportion of samples containing Metarhizium was significantly higher in
agricultural soils than from grassland, but there was no significant difference between
forest and agricultural soils. Overall there was a significantly higher recovery of
isolates from soils from disturbed habitats (crops) than from undisturbed (grassland,
forest), but these results were not consistent across locations. Results are also
inconsistent globally: Metarhizium spp. were more frequently isolated from
agricultural soils than from undisturbed or semi-disturbed habitats in Canada, Finland,
the Netherlands and China (Bidochka et al., 1998, Vanninen, 1996, Steenberg, 1995,
Meyling and Eilenberg, 2007). However, a study in Switzerland found that permanent
grassland and field margins contained a higher density of Metarhizium species than
either forest or cultivated arable land (Schneider et al. 2012).
The reasons for the higher recovery of Metarhizium species in agricultural and forest
soil are still not clear. Long term persistence of Metarhizium spores in agricultural
soils (Latch and Fallon, 1976) and wide dispersion of Metarhizium propagules by
agricultural tools (Kepler et al., 2015) might be the causes of higher occurrence of

61
Metarhizium species in agricultural soils. The very low percentage of Metarhizium
observed in grassland soil samples in Queensland might result from movement of
heavy agricultural machineries and greater compaction of soils than in forests or tilled
cropping. It may be that there is a more consistent association with other factors (such
as plant types, e.g. legumes) than with disturbance, or that there may be species
specific associations by different fungal clades, which are discussed below.
The internal transcribed region (ITS) marker was found to be a useful tool in
preliminary screening of isolates. However, ITS sequences were used only in an
initial screen to characterise a large number of isolates to the genus level. Later, those
identified as Metarhizium spp. were characterised by more appropriate markers
analysis to determine identity at the species level.
Single locus phylogenetic analysis with MzIGS3 and 5’-TEF gene were conducted
here with different phylogenetic inference tools, maximum likelihood and Bayesian
inference. The resultant trees for both individual markers produced polytomies and
could not fully resolve the taxonomic position of our isolates. MzIGS3 was found to
be more informative than 5’-TEF in resolving the phylogeny of the Australian isolates,
but neither were found to be suitable as a single tool for taxonomic validation of the
Metarhizium species. In this thesis, the MzIGS3 marker was sufficient to resolve the
three clades in the M. pingshaense complex (M. pingshaense and the two new
indeterminate clades) but not to resolve M. robertsii and M. anisopliae, which could
only be resolved using a combined analysis of the MzIGS3 and 5’-TEF markers.
Intergenic sequence markers were compared with the 5’-Transcription elongation
factor (5’-TEF) marker in the taxonomic identification of Brazilian Metarhizium
species (Rezende et al. 2015), on the basis of which it was suggested that MzIGS3
was not suitable as a stand-alone marker, but that 5’-TEF may be used alone or in
combination with MzIGS3 to resolve species identification. From our results, we

62
conclude that single locus phylogenetic analysis with current markers cannot be used
to identify Metarhizium species and that a multilocus analysis should be used.
The study identified two new, phylogenetically indeterminate clades that are sister
groups of M. pingshaense. The multilocus phylogenetic analysis differentiates the two
indeterminate clades from M. pingshaense with high support values (Table 3), values
that are higher than for the differentiation of M. robertsii from M. anisopliae.
The multi-locus analysis (ML) of concatenated data sets of MzIGS3 and 5’-TEF
identified five principal clades of Metarhizium with very high bootstrap supports for
the Queensland’s isolates. Among the members of the “PARB” clade, which includes
M. pingshaense, M. anisopliae, M. robertsii, and M. brunneum, described by Bischoff
et al. (2009), this study identified five species: M. pingshaense, M. anisopliae and M.
robertsii, with two additional new and previously undescribed ‘indeterminate’
Metarhizium clades. All the clades and the reference M. brunneum (ARSEF 2107)
formed the inner core of the phylogenetic tree, produced a similar topology to the
phylogenetic tree using the classified Metarhizium species by Bischoff et al. (2009)
and Kepler et al. (2015). The phylogenetic position of the authenticated reference taxa
presented in our two-gene (MzIGS3 and 5’-TEF) analysis is also supported by the
three-gene (MzIGS3, MzFG543igs and 5’-TEF) analysis of Rezende et al. (2015).
Overall, the results of this study demonstrated the usefulness of multi-locus analysis
of the nuclear markers MzIGS3 and 5’-TEF for identification Metarhizium species.
This study used statistical methods to investigate the genetic differentiation of the five
clades identified in phylogenetic analysis. The genetic differentiation statistical tests,
Ks and Kst were performed with a null hypothesis: “that there is no genetic difference
between the Metarhizium clades”. All the tests rejected the null hypothesis (P<0.001)
to conclude that the clades are genetically different from each other. In addition, the
nearest-neighbour statistics Snn (Hudson, 2000) test showed the value for all the

63
comparisons were close to one (1). More importantly the Snn values in the
comparison between M. pingshaense-Metarhizium indet. 1, M. pingshaense-
Metarhizium indet. 2 and Metarhizium indet. 1- Metarhizium indet. 2 were 1.000,
1.000 and 0.98305, again indicates that the clades are strongly genetically different.
Moreover, commonly used fixation estimates Nst and Fst between M. pingshaense-
Metarhizium indet. 1 and M. pingshaense-Metarhizium indet. 2 were 0.68 and 0.59
respectively; indicate high degree of genetic differentiations. In contrast, the Nst and
Fst values between Metarhizium indet. 1- Metarhizium indet. 2 was comparatively
low (0.35805) denotes the moderate genetic differentiation.
The possible reason of low genetic differentiation observed between Metarhizium
indet. 1- Metarhizium indet. 2 in compare to other comparisons is that both the
isolates were recovered from similar ecological niches (fields of maize, a
monocotyledon). Clades within the ‘M. pingshaense’ complex (M. indet. 1, M. indet.
2 and M. pingshaense) shared haplotypes, and clades within the ‘M. robertsii/M.
anisopliae’ complexes shared one (1) haplotype, but there were no shared haplotypes
between the two complexes. Overall, the phylogenetic, genetic differentiation and
haplotype evidence presented in this paper, suggests that the two new clades are new
Metarhizium species within a complex of sister species including M. pingshaense.
These two-new species will be fully described, deposited in reference collections and
the results published subsequent to the submission of this thesis.
This study showed that the haplotypes of Metarhizium populations not significantly
associated with location, which suggests that gene flow among Metarhizium
populations is not reduced by location. There was significant genetic differentiation
between isolates from grassland and those from other ecotypes, and none of the 11
haplotypes from grassland were shared with any other ecotype. In contrast, there was
very low genetic differentiation between isolates from forest and legume crops, with 5

64
shared haplotypes. The high genetic similarity between the legume crop and forest
populations may be as a result of the rhizospheric association of the Metarhizium
strains with broad-leaf Eudicots, and specifically with legumes, since Australian
forests contain a high proportion of Acacia spp. (Fam. Fabacea, Sub Fam.
Mimosoideae).
Though this study did not explain the possible mechanism (or limits to) gene flow
between locations and ecotypes, this information is valuable in the application of
commercial Metarhizium isolates in an ecosystem to evaluate the risk of gene flow
from released biocontrol agents with the indigenous populations (Wang et al., 2011).
Kepler et al. (2015) suggested that there is a low chance of gene flow between
Metarhizium populations. However, the high levels of gene flow in Australian isolates
suggests that this requires further study.
The influence of plant habitat for the evolution and distribution of Metarhizium
population also reported (Wyrebek and Bidochka, 2013, Bidochka et al., 1998). The
species in the genus Metarhizium show evidence of ecological speciation (Douhan et
al., 2008). Bidochka et al. (2001) found “cold active’ M. robertsii and “heat active”
M. brunneum in two different ecotypes: forest and agricultural fields, respectively, in
Canada. This association of species with plant and ecotype will be explored in more
detail in Chapters 4 and 5.

65
Figure 3.8 (continued)
Metarhiz ium anisopliae isolate 69
Metarhizium anisopliae isolate 251
Metarhizium anisopliae isolate 68
3.7 Supplementary data

66
Metarhizium pingshaense ARSEF1009
Pochonia ( Syn. Metacordyceps)
Figure 3.8 Maximum likelihood tree of ITS sequence data. Three sequences from genus
Pochonia that are listed on MycoBank under the synonyms Metacordyceps chlamydosporia
UCR3, Metacordyceps chlamydosporia IAM14700, and Cordyceps chlamydosporia (Syn
Metacordyceps chlamydosporia) NBRC9249 were included in genus/clade Pochonia. The
six isolates that aligned with this clade were excluded from subsequent analysis. .

67
Figure 3.9 (continued)

68
M. anisopliae isolate 68
M. pingshaense CBS257.90
M. pingshaense
M. anisopliae isolate 69
M. anisopliae isolate 251
Figure 3.9 Bayesian tree of concatenated data set of 5'-TEF and MzIGS3 for
Metarhizium isolates

69
Figure 3.10 (continued)
Metarhizium indet. 1
M. anisopliae isolate 69
M. anisopliae isolate 251
M. anisopliae isolate 68
Metarhizium indet. 2
M. pingshaense CBS257.90

70
Figure 3.10 Maximum likelihood tree of MzIGS3 data of Metarhizium isolates

71
Figure 3.11 (continued)
M. anisopliae isolate 69
M. anisopliae isolate 68
M. pingshaense CBS257.90
M. anisopliae isolate 251

72
Figure 3.11 Maximum likelihood of 5'-TEF data of Metarhizium isolates

73
Figure 3.12 (continued)
Metarhizium indet. 1
M. anisopliae isolate 69
M. anisopliae isolate 251
M. anisopliae isolate 68
Metarhizium indet. 2
M. pingshaense CBS257.90
M. pingshaense

74
Figure 3.12 Bayesian tree of MzIGS3 data of Metarhizium isolates

75
Figure 3.13 (continued)

76
M. anisopliae isolate 69
M. anisopliae isolate 251
M. anisopliae isolate 68
M. pingshaense CBS257.90
M. pingshaense
Figure 3.13 Bayesian tree of 5’-TEF data of Metarhizium isolates

77
Metarhizium indet. 1
M. anisopliae isolate 69
M. anisopliae isolate 251
M. anisopliae isolate 68
Metarhizium indet. 2
M. pingshaense CBS257.90
M. pingshaense
Figure 3.14 (continued)

78
Figure 3.14 Maximum Likelihood tree of combined data set of MzIGS3, 5’-TEF and
ITS for Metarhizium isolates

79
Metarhizium indet. 1
M. anisopliae isolate 69
M. anisopliae isolate 251
M. anisopliae isolate 68
Metarhizium indet. 2
M. pingshaense CBS257.90
M. pingshaense
Figure 3.15 (contined)

80
Figure 3.15 Bayesian tree of combined data set of MzIGS3, 5’-TEF and ITS for
Metarhizium isolates

81
Chapter 4 : Factors affecting the
occurrence and diversity of Metarhizium
species in agricultural, grassland and forest
soils
82
Factors affecting the occurrence and diversity of Metarhizium species in
agricultural, grassland and forest soils
Abstract The fungi of the genus Metarhizium are both soil saprophytes and insect pathogens, and have
recently been identified associated with the rhizosphere. The factors influencing
Metarhizium species occurrence and distribution in ecotypes, however, are poorly
understood. To identify factors that might determine Metarhizium species diversity in
agriculture, grassland and forest, soil samples were characterised and their relationships with
previously identified Metarhizium clades analysed using multivariate and univariate
analyses. Regression analysis showed that the ecotype associated with crop or plant
rhizosphere predicted the occurrence of M. anisopliae and M. robertsii and location
predicted the occurrence of M. indet. 1 in soil samples. M. anisopliae and M. robertsii were
predominantly recovered from legume and forest soils and associated with high nitrogen and
carbon contents in soil. Isolates of the M. indet. 1 clade were predominantly found in maize
and grassland and associated with low nitrogen and carbon. M. robertsii and M. indet. 1
were more abundant in Fe rich soil. A minor soil element zirconium was positively
associated with M. anisopliae, M. robertsii and M. indet. 1 isolates. These results suggest
that the use of Metarhizium as rhizospheric inocula may be enhanced by selection species or
strains for use in specific conditions.
Keywords: Metarhizium, occurrence, diversity, soil factors, multivariate, univariate.

83
4.1 Introduction
Entomopathogenic fungi of the genus Metarhizium (Order Hypocreales) are common
saprophytes found in soil and play an important role as entomopathogens in regulating the
insect population in terrestrial ecosystems (Keller and Zimmerman, 1989). Several
commercial formulations have been made from the species of Metarhizium and used as
biocontrol agent against soil-dwelling insects worldwide (Faria and Wraight, 2007).
Knowledge of naturally occurring species of biological control agents and their distribution
in an ecosystem is required for their application in conservation biological control strategies
(Steinwender et al., 2014).
Recent studies showed that Metarhizium species are associated with plants in the rhizosphere
(Hu and St. Leger, 2002, Sasan and Bidochka, 2012) and their distribution is more clearly
determined by the specific soils and plant hosts than by their insect host (Bidochka et al.,
1998). However, understanding the factors governing the distribution of species of
Metarhizium in local habitats is important to find the best suitable species for each specific
environment to conserve and increase the benefits of biological control agents (Quesada-
Moraga et al., 2007).
A few studies have been conducted to identify the effect of ecological and soil factors such
as disturbance, annual rainfall, temperature, elevation and soil properties on the distribution
of entomopathogenic Hypocrealean fungi including Metarhizium (Sun and Liu, 2008.
Quesada-Moraga et al., 2007, Meyling and Eilenberg, 2006. Bidochka, et al., 1998, Chandler
et al., 1997, Vanninen, 1996, Rath et al., 1992). These studies had limitations, as they
identified the species of entomopathogens based on morphology or using the internal
transcribed sequence (ITS) marker, which have been subsequently found to be inadequate for
differentiating pleomorphic Metarhizium species (Steinwender et al., 2014). Moreover, the
studies only took into consideration the effects of only a few factors on the occurrence of the

84
fungi considering only genus, for example, a comparison between the genera Beauveria and
Metarhizium. The taxonomy of the genus Metarhizium has been recently revised and nine
species were accepted based on the multilocus phylogenetic analysis on nuclear markers
(Bischoff et al., 2009). The revised taxonomy will give new insights to understand the
ecological factors affecting the Metarhizium species isolation, distribution and application in
a specific habitat as an effective biological control agent.
Chapter 3 described the isolation of Metarhizium spp. from four ecotypes (maize field,
legume field, grassland and forest) in three locations (Bundaberg, Gatton and Kingaroy) in
Queensland, Australia, and used multilocus analysis to identify five clades of Metarhizium
species based on the recent revision. Haplotypes within the Metarhizium populations were
not significantly associated with location, which suggests that gene flow among Metarhizium
populations is not reduced by location. However, there was significant genetic differentiation
between isolates from grassland and those from other ecotypes, and none of the 11
haplotypes from grassland were shared with any other ecotype. In contrast, there was overall
no statistically significant genetic differentiation between isolates from forest and legume
crops, with 5 shared haplotypes between the two habitats.
Chapter 4 investigates the relationships between the five Australian species with location,
ecotype, soil properties and soil elements using multivariate and univariate analyses. To our
knowledge, this study reports for the first time the relationship between the species of
Metarhizium and ecological and soil characteristics, which may be useful for selection of
Metarhizium species to improve their potential use as rhizospheric inocula in agriculture.

85
4.2 Materials and methods
4.2.1 Soil collection, isolation and description
Soil samples were collected from 4 ecotypes and three locations in Queensland, Australia
(Bundaberg, Gatton and Kingaroy) as described in Chapter 3. The species of Metarhizium
were isolated and identified using multilocus phylogenetic analysis reported in Chapter 3.
4.2.2 Soil analysis
In general, 1 composite soil sample represents properties of 2.5 acres of land (Peters and
Laboski, 2013). Each sampling site in this research covered 0.74 acres (3000sqm) of land.
Two composite soil samples were made by mixing soil samples from transects A and B, and
C and D from each ecotype to give a total of 22 composite soil samples for soil properties
and elemental analysis. Composite soil samples were sieved by 5mm sieve to remove plant
debris, air-dried and finely ground using soil mill before analysing their properties and
elements.
Soil moisture
The soil moisture (dry basis) was determined by following the standard procedure described
by Standards Association of Australia (1990). Samples were weighed, then dried in an oven
at 105°C overnight and weighed again.
pH
The pH of the soil samples was determined in 1:5 soil: water suspension using a pH meter
(Rayment and Higginson, 1992). After mechanically shaking the soil suspension for 1 hour
at 15 rpm, three pH-readings were recorded from each sample and the mean value of pH was
calculated.

86
Soil elements
Carbon (C) and Nitrogen (N) were measured in LECO TruMac Elemental Analyser. A mass
of 0.1 g of soil was placed into a large ceramic boat, loaded into a ceramic high temperature
furnace (1300C), and combusted in a pure oxygen environment to ensure complete
oxidation. Combustion gases were directed through several columns to remove moisture. A
small aliquot of sample was taken and passed through an infrared detector for carbon and
nitrogen determination.
Major and trace elements in soil samples were determined by X-ray Fluorescence (XRF)
technique by preparing 40 mm diameter fused glass discs from soil samples. The XRF discs
were prepared using standard disc preparation procedure, and are reported briefly here.
Approximately 1.15 g of soil sample was fused with approximately 8.85 g of a 50:50 mix of
lithium metaborate and lithium tetraborate flux containing 0.5% LiBr (by mass) as a wetting
agent in an Ox automated fusion machine for 25 minutes at 1050°C.
The elements were measured on a 40mm PANAlytical Axios wavelength dispersive (WD)
X-ray Fluorescence (XRF) spectrometer equipped with a 1kW Rh tube was used for all XRF
analyses. The elements were acquired using PANalytical’s WROXI application and
calibration standard procedures. Loss-On-Ignition data derived from a separate analysis
procedure were incorporated for each sample for matrix correction purposes. XRF major
element data are reported as oxide%.
4.2.3 Colony forming unit (CFU)
The number of colonies per plate of each Metarhizium isolate on selective agar medium was
counted for each soil sample where fungus was observed (Chapter 3). The CFU per g of dry
soil was calculated after the soil moisture determination for each sampling site.

87
4.2.5 Statistical analysis
The presence-absence data of Metarhizium species in the 880 soil samples from different
ecotypes and locations were arranged in a matrix and analysed using binomial logistic
regression to identify the association of Metarhizium species occurrence in soil samples with
location and ecotypes. Analysis of similarity (ANOSIM) with a permutation test for
significance was also conducted using “Vegan” package in Rv3.3.1 (R Core team, 2016).
A complete data set was developed for the 58 soil samples, representing 5 Metarhizium
species from 164 Metarhizium isolates. Principal component analysis (PCA), a multivariate
analysis, was used with the aim was to reduce the large number of variables to a small set
containing most of the information. Biplot analysis was used to separate the Metarhizium
species using principal components. Generalised Linear Model (GLM) with logit link was
conducted to identify the effect of the significant soil factors identified in PCA on the
presence of Metarhizium species in all soil samples. The statistical software programs
‘R’v3.3.1 (R core team, 2016) were used for the analyses.

88
4.3 Results
4.3.1 Fungal species distribution in soil samples
A total of 164 Metarhizium isolates were recovered in this study, and phylogenetic analysis
reported in Chapter 3 showed that the isolates represented five groups or clades of species.
Three clades were identified as M. robertsii, M. anisopliae, M. pingshaense and 2 new clades
were identified: Metarhizium clades indeterminate 1 (indet. 1) and indeterminate 2 (indet. 2).
As reported in Chapter 3 (table 3.2), Metarhizium species were identified in 58 of the 880
soil samples (6.59%). Table 4.1 lists occurrence of clades by soil transect and sample
number.
Table 4:1 Metarhizium species and number of colony observed in a plate in 58 soil samples
from different ecotypes and locations by transect.
Location Ecotype Transect Species Number of
colony/plate
Bundaberg Maize A2 M. robertsii 1
Bundaberg Maize B5 Metarhizium indet. 2 1
Bundaberg Maize B10 Metarhizium indet. 2 1
Bundaberg Maize C1 Metarhizium indet. 2 1
Bundaberg Maize C10 Metarhizium indet. 2 1
Bundaberg Maize D1 Metarhizium indet. 2 1
Bundaberg Maize D2 Metarhizium indet. 2 1
Bundaberg Maize D5 Metarhizium indet. 1 1
Bundaberg Maize D9 Metarhizium indet. 1 1
Bundaberg Maize D20 Metarhizium indet. 1 1
Bundaberg Grassland D12 M. robertsii 1
Bundaberg Forest A11 Metarhizium indet. 2 1
Bundaberg Forest A12 Metarhizium indet. 2 1
Bundaberg Forest A20 Metarhizium indet. 2 1
Bundaberg Forest B4 M. robertsii 1
Bundaberg Forest B10 Metarhizium indet. 2 1
Bundaberg Forest B13 Metarhizium indet. 2 1
Bundaberg Forest C9 M. robertsii 1
Bundaberg Forest C12 Metarhizium indet. 1 1
Bundaberg Forest D4 M. robertsii 1
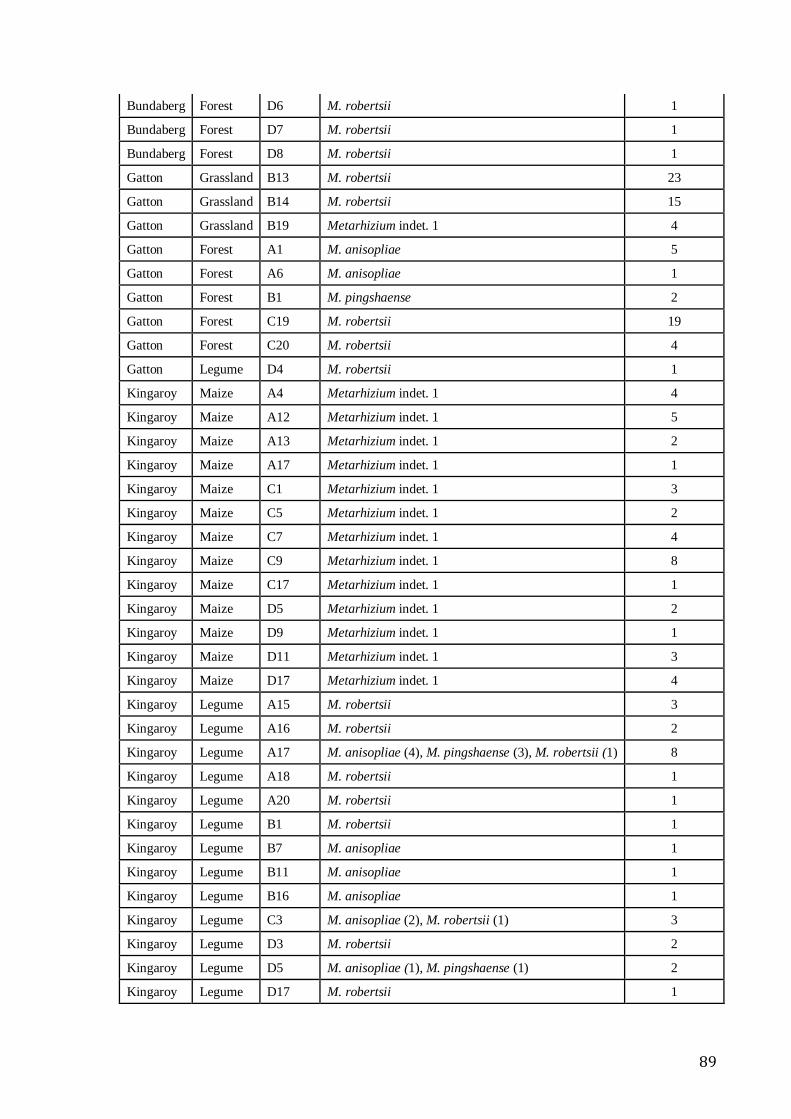
89
Bundaberg Forest D6 M. robertsii 1
Bundaberg Forest D7 M. robertsii 1
Bundaberg Forest D8 M. robertsii 1
Gatton Grassland B13 M. robertsii 23
Gatton Grassland B14 M. robertsii 15
Gatton Grassland B19 Metarhizium indet. 1 4
Gatton Forest A1 M. anisopliae 5
Gatton Forest A6 M. anisopliae 1
Gatton Forest B1 M. pingshaense 2
Gatton Forest C19 M. robertsii 19
Gatton Forest C20 M. robertsii 4
Gatton Legume D4 M. robertsii 1
Kingaroy Maize A4 Metarhizium indet. 1 4
Kingaroy Maize A12 Metarhizium indet. 1 5
Kingaroy Maize A13 Metarhizium indet. 1 2
Kingaroy Maize A17 Metarhizium indet. 1 1
Kingaroy Maize C1 Metarhizium indet. 1 3
Kingaroy Maize C5 Metarhizium indet. 1 2
Kingaroy Maize C7 Metarhizium indet. 1 4
Kingaroy Maize C9 Metarhizium indet. 1 8
Kingaroy Maize C17 Metarhizium indet. 1 1
Kingaroy Maize D5 Metarhizium indet. 1 2
Kingaroy Maize D9 Metarhizium indet. 1 1
Kingaroy Maize D11 Metarhizium indet. 1 3
Kingaroy Maize D17 Metarhizium indet. 1 4
Kingaroy Legume A15 M. robertsii 3
Kingaroy Legume A16 M. robertsii 2
Kingaroy Legume A17 M. anisopliae (4), M. pingshaense (3), M. robertsii (1) 8
Kingaroy Legume A18 M. robertsii 1
Kingaroy Legume A20 M. robertsii 1
Kingaroy Legume B1 M. robertsii 1
Kingaroy Legume B7 M. anisopliae 1
Kingaroy Legume B11 M. anisopliae 1
Kingaroy Legume B16 M. anisopliae 1
Kingaroy Legume C3 M. anisopliae (2), M. robertsii (1) 3
Kingaroy Legume D3 M. robertsii 2
Kingaroy Legume D5 M. anisopliae (1), M. pingshaense (1) 2
Kingaroy Legume D17 M. robertsii 1
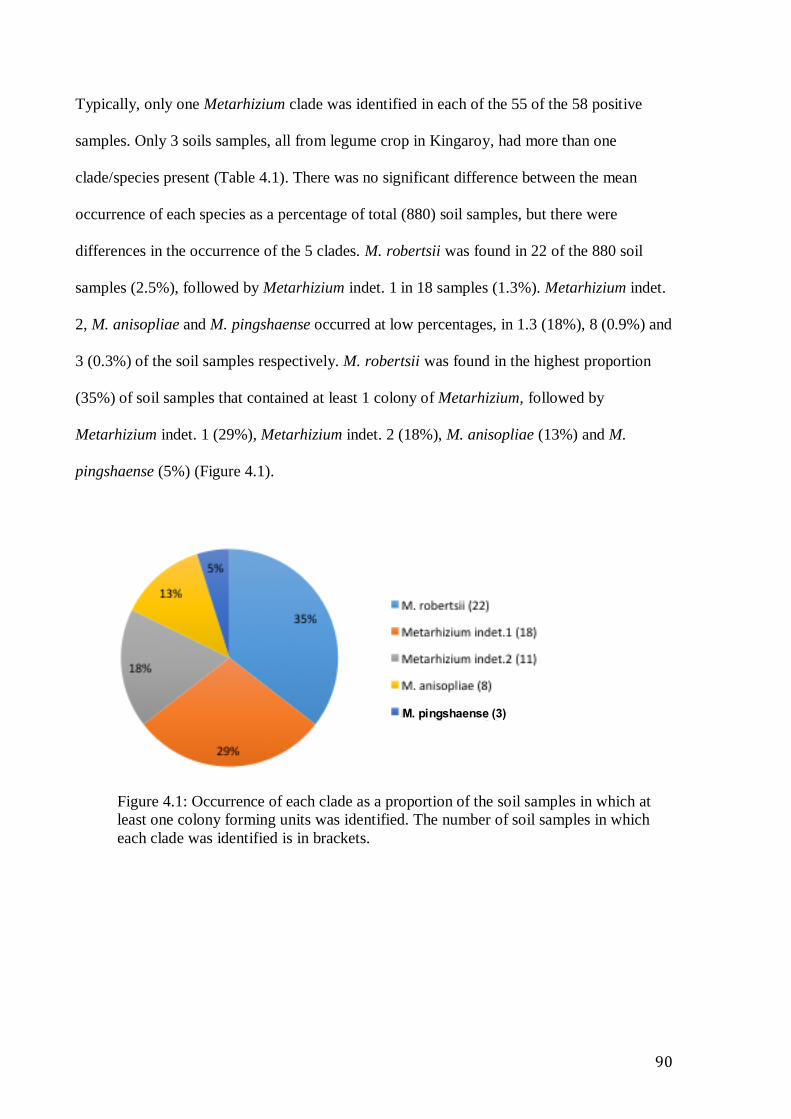
90
M. pingshaense (3)
Typically, only one Metarhizium clade was identified in each of the 55 of the 58 positive
samples. Only 3 soils samples, all from legume crop in Kingaroy, had more than one
clade/species present (Table 4.1). There was no significant difference between the mean
occurrence of each species as a percentage of total (880) soil samples, but there were
differences in the occurrence of the 5 clades. M. robertsii was found in 22 of the 880 soil
samples (2.5%), followed by Metarhizium indet. 1 in 18 samples (1.3%). Metarhizium indet.
2, M. anisopliae and M. pingshaense occurred at low percentages, in 1.3 (18%), 8 (0.9%) and
3 (0.3%) of the soil samples respectively. M. robertsii was found in the highest proportion
(35%) of soil samples that contained at least 1 colony of Metarhizium, followed by
Metarhizium indet. 1 (29%), Metarhizium indet. 2 (18%), M. anisopliae (13%) and M.
pingshaense (5%) (Figure 4.1).
Figure 4.1: Occurrence of each clade as a proportion of the soil samples in which at
least one colony forming units was identified. The number of soil samples in which
each clade was identified is in brackets.

91
Figure 4.2 shows the occurrence of the Metarhizium species in different locations and
ecotypes by percentage of soil samples. In Bundaberg, Metarhizium indet. 2 was found in
4.58% of soil samples, M. robertsii in 3.33% and Metarhizium indet. 1 in 1.67%. In Gatton
soils, M. robertsii was found in 1.25% of samples, M. anisopliae in 0.56%, Metarhizium
indet. 1 and M. pingshaense in just 1 sample (0.28%). At Kingaroy, Metarhizium indet. 1
was found in 3.61% of samples, followed by M. robertsii (2.78%), M. anisopliae (1.67%),
and M. pingshaense in 2 samples (0.56%). Metarhizium indet. 1 was found at all three
locations, while Metarhizium indet 2 was only found at Bundaberg. Figure 4.3 is showing
geographical representation of soil samples of different locations in which different species
of Metarhizium were detected. In Bundaberg, M. indet. 2 was more frequently isolated
followed by M. robertsii and M. indet. 1 from the soil samples. M. indet. 1 was the dominant
clade in Kingaroy soil followed by M. robertsii, M. anisopliae and M. pingshaense. In
Gatton soil, M. robertsii were more frequent than M. anisopliae and M. pingshaense.
Metarhizium indet. 1 was the most common isolate found in maize soil (6.67% of samples),
followed by Metarhizium indet. 2 (2.5%) and M. robertsii in just 1 sample (0.42%). The
highest percentage of soil samples in legumes contained M. robertsii (6.25%), followed by
M. anisopliae (3.75%) and M. pingshaense (1.25%). The two new indeterminate clades were
not found in legume crops at any location. Only two species were isolated from grassland:
M. robertsii (1.25% of soil samples) and one isolate of Metarhizium indet. 1 from Gatton
(0.42% of soil samples). In contrast, all the isolates were found in forest soils, with higher
percentages of soil samples containing M. robertsii (3.33%), followed by Metarhizium indet.
2 (2.08%), M. anisopliae (0.83%), Metarhizium indet. 1 (0.42%) and M. pingshaense
(0.42%).

92
Figure 4.2 The occurrence of Metarhizium species as a proportion of soil samples at
different locations (above) and ecotypes (below). No statistical significant difference was
observed.

93
Figure 4.3 Geographical representation of soil samples of different locations of Queensland
in which different species of Metarhizium were detected. Pie charts showing species level
distribution of Metarhizium relative abundance (%) in the soil samples in which Metarhizium
detected in Bundaberg, Kingaroy and Gatton.
Bundaberg
Gatton
Kingaroy

94
4.3.2 Ecological association
The analysis of similarity (ANOSIM) showed a significant (R=0.403, significance =0.001)
pattern of association of the species of Metarhizium with the location and ecotype. M.
robertsii and M. indet. 1 species were found at all three locations. M. robertsii was found at 6
of the 11 sites (location × ecotype), predominantly in legume and forest but also in grassland
and maize. A trend of habitat preference was observed in M. indet. 1 species, which was
strongly associated with maize at Kingaroy and Bundaberg, and M. indet. 2 species, which
was associated with maize and forest at Bundaberg (the only location at which M. indet. 2
was found) (Figure 4.3). Neither M. indet. 1 or M. indet. 2 were found in legume crop at any
location. The other two species, M. anisopliae and M. pingshaense, were associated with the
Gatton-forest and the Kingaroy-legume ecotypes respectively.

95
M.a
nis
op
liae
M.p
ing
ha
en
se
M.ro
berts
ii
M.in
de
t1
M.in
de
t2
Gatton_ForestKingaroy_LegumeKingaroy_LegumeKingaroy_LegumeKingaroy_LegumeGatton_ForestGatton_ForestKingaroy_MaizeKingaroy_MaizeKingaroy_MaizeKingaroy_MaizeKingaroy_MaizeKingaroy_MaizeKingaroy_MaizeKingaroy_MaizeKingaroy_MaizeKingaroy_MaizeKingaroy_MaizeKingaroy_MaizeKingaroy_MaizeGatton_GrasslandBundaberg_ForestBundaberg_MaizeBundaberg_MaizeBundaberg_MaizeBundaberg_ForestBundaberg_ForestBundaberg_ForestBundaberg_ForestBundaberg_ForestBundaberg_MaizeBundaberg_MaizeBundaberg_MaizeBundaberg_MaizeBundaberg_MaizeBundaberg_MaizeKingaroy_LegumeKingaroy_LegumeKingaroy_LegumeKingaroy_LegumeKingaroy_LegumeKingaroy_LegumeKingaroy_LegumeGatton_LegumeGatton_ForestGatton_ForestGatton_GrasslandGatton_GrasslandBundaberg_ForestBundaberg_ForestBundaberg_ForestBundaberg_ForestBundaberg_ForestBundaberg_ForestBundaberg_MaizeBundaberg_GrasslandKingaroy_LegumeKingaroy_Legume
0
0.2
0.4
0.6
0.8
1
M. a
nis
op
liae
Me
tarh
iziu
m in
de
t. 1
Me
tarh
iziu
m in
de
t. 2
M. ro
berts
ii
M. p
ing
sh
ae
ns
e
Figure 4.4 Heatmap of Metarhizium species associated with locations and ecotypes based on
Czekanowski dissimilarity in DICE analysis of presence-absence data, R=0.403, significance
=0.001.

96
Binomial logistic regression analysis showed only the main effects of the predicted variables
‘ecotype’ and ‘location’ on the occurrence of Metarhizium species in soil samples. Ecotype
was the significant main factor for the occurrence of M. robertsii and M. anisopliae, found
predominantly in legume crops, and with M. indet. 1, found predominantly in maize. The
occurrence of M. indet. 1 could be also predicted by location as this was predominantly
found in Kingaroy. Again, regression analysis could not estimate the significance
relationship with M. indet. 2 and M. pingshaense with the ecotype and location. M. indet. 2
was only recovered from a small number (11 out of 880 soil samples) and only in
Bundaberg-Maize which was too low to obtain sufficient statistical support. The occurrence
of M. pingshaense (3 of 880 soil samples) was also too low for statistical analysis. Table 4.2
shows the Wald chi-square values and significance levels of the logistic regression analysis.
Table 4:2 Binomial logistic regression analysis shows the relationship between the species
of Metarhizium in soils as a function of location and ecotype
Metarhizium species Wald chi-square value
Location Ecotype
M. robertsii 1.299 14.156***
Metarhizium indet. 1 6.383* 13.091***
M. anisopliae 2.606 6.244*
Asterisk marks show significance level, *= p<0.05, ***= p<0.001
4.3.3 Soil factors
Principal component analysis of the soil factors showed that first two principal components
had higher eigenvalues and both together retained more than 70% variance (Table 4.3,
Figure 4.4). Correlation between the soil components and principal components (loading
value) is presented in Table 4.4. The first principal component (Dimension 1) was strongly
positively correlated with titanium (Ti), copper (Cu), iron (Fe), sulphur (S), manganese
(Mn), aluminium (Al) and chromium (Cr) and strongly negatively correlated with potassium
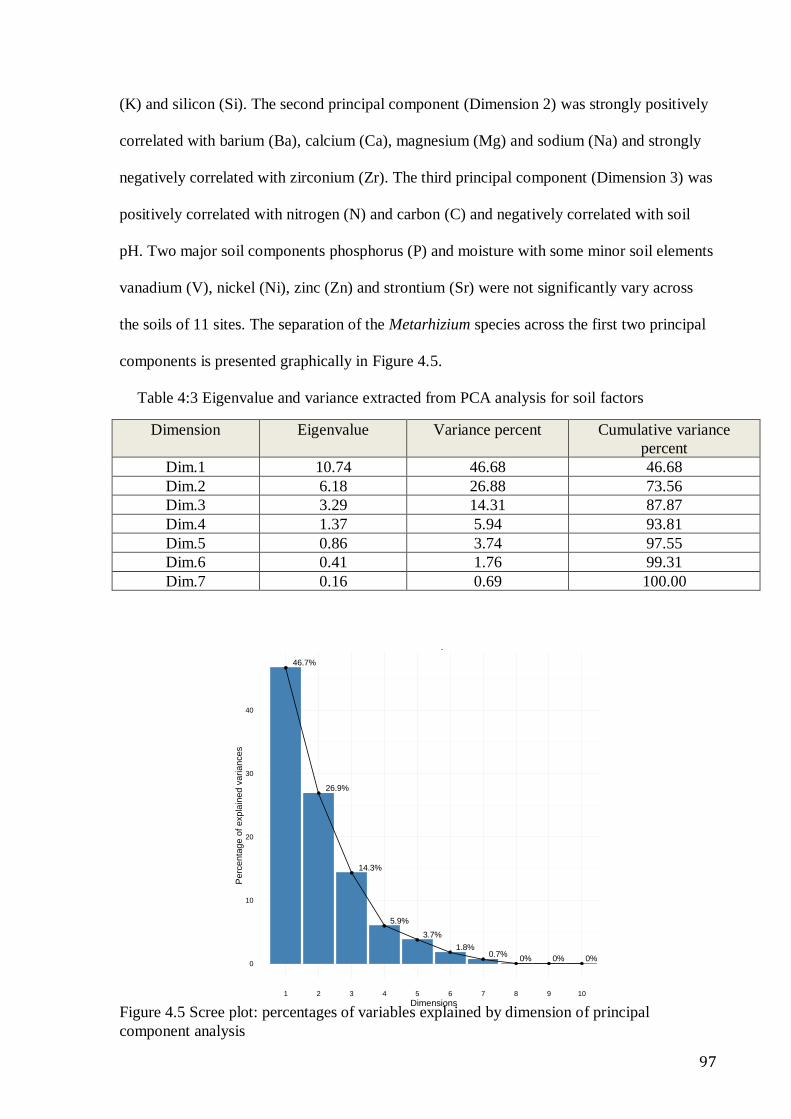
97
46.7%
26.9%
14.3%
5.9%
3.7%
1.8%0.7%
0% 0% 0%0
10
20
30
40
1 2 3 4 5 6 7 8 9 10
Dimensions
Perc
enta
ge o
f expla
ined v
arian
ces
Scree plot
(K) and silicon (Si). The second principal component (Dimension 2) was strongly positively
correlated with barium (Ba), calcium (Ca), magnesium (Mg) and sodium (Na) and strongly
negatively correlated with zirconium (Zr). The third principal component (Dimension 3) was
positively correlated with nitrogen (N) and carbon (C) and negatively correlated with soil
pH. Two major soil components phosphorus (P) and moisture with some minor soil elements
vanadium (V), nickel (Ni), zinc (Zn) and strontium (Sr) were not significantly vary across
the soils of 11 sites. The separation of the Metarhizium species across the first two principal
components is presented graphically in Figure 4.5.
Table 4:3 Eigenvalue and variance extracted from PCA analysis for soil factors
Dimension Eigenvalue Variance percent Cumulative variance
percent
Dim.1 10.74 46.68 46.68
Dim.2 6.18 26.88 73.56
Dim.3 3.29 14.31 87.87
Dim.4 1.37 5.94 93.81
Dim.5 0.86 3.74 97.55
Dim.6 0.41 1.76 99.31
Dim.7 0.16 0.69 100.00
Figure 4.5 Scree plot: percentages of variables explained by dimension of principal
component analysis

98
Table 4:4 Loading value by principal components showing significant differences in soil
components across 11 sites & ecotypes. Mauve coloured cells show a significant positive
relationship and orange coloured cells show a significant negative relationship.
Variable Dimension
1 2 3
Ti 0.92 0.35 -0.04
Cu 0.89 0.23 0.08
Fe 0.89 -0.26 0.25
S 0.84 0.28 0.33
Mn 0.82 0.31 0.11
Al 0.82 0.17 -0.25
Cr 0.71 -0.36 -0.53
V 0.69 -0.37 0.51
Ni 0.68 -0.08 -0.55
P 0.57 0.59 0.47
Ba 0.50 0.84 -0.06
Moisture 0.48 0.56 0.37
Zn 0.44 0.83 0.05
Zr 0.20 -0.93 0.16
pH -0.04 0.41 -0.81
Sr -0.51 -0.48 -0.15
N -0.60 0.12 0.73
Ca -0.62 0.77 0.00
Mg -0.64 0.72 -0.18
Na -0.64 0.75 -0.14
C -0.68 0.06 0.72
K -0.77 0.63 -0.07
Si -0.96 -0.24 -0.09

99
Metarhizium indet. 1
M. pingshaense
Metarhizium indet. 2
Figure 4.6 Separation of Metarhizium species identified in soil samples using principal
component 1 and 2. Separation of species along Dimension 1 axis is due to variation in
Cu, Fe, Mn, Ti, S, Si and Al. Soil elements Zn, Ba, Ca, K, Zr, Mg and Na contribute in
Dimension 2 2 axis.
Correlation studies were conducted after reduction the soil factors by PCA. The correlation
of the presence of M. anisopliae, M. robertsii and M. indet. 1 with the significant soil
elements are summarized in Table 4.5. The presence of M. robertsii and M. anisopliae were
significantly associated with higher soil N and C contents. In contrast, M. indet. 1 species
was associated with low soil N and C contents. A minor soil element Zr was positively
correlated with presence of all the three species.

100
The elements Cu, Fe and Mn showed positive association with the occurrence of M.
robertsii. A negative association was observed between M. anisopliae and Ti. The
occurrence of M. indet. 1 had positive correlation with Cr and weakly significant correlation
with Fe, and significant negative correlation with K, Mg and Na.
M. indet. 2 was only recovered from only one location and excluded from the univariate
analysis. Only three soil samples contained M. pingshaense and the occurrence was again too
low to determine a relationship with the soil factors.
Table 4:5 Point biserial correlation between the presence of Metarhizium species and the
soil elements. Only statistically significant relationships (both positive and negative) are
presented. ** and * indicate that the correlation is significant at the 0.01 and 0.05 level
(respectively).
Element M. robertsii M. anisopliae Metarhizium indet. 1
N 0.07* 0.07* -0.11**
C 0.07* 0.10** -0.12**
Cu 0.07*
Fe 0.10** 0.07*
Mn 0.07*
Cr 0.19**
Ti -0.08*
K -0.1
Zr 0.09* 0.09** 0.12**
Mg -0.09
Na -0.09

101
The density of the Metarhizium species in soil samples was found to be 1126 to 30003
CFU per gram of dry soil and the major portion (86%) of the isolation from the soil
samples was as recorded below 6000 CFU/g of dry soil (Figure 4.10).
Figure 4.7 Densities (CFU/g dry soil) of Metarhizium observed in the numbers of
soil samples
4.4 Discussion
This study found that the occurrence of widely distributed Metarhizium species in the
Queensland soil was influenced by the ecotypes and locations. The recovery of the
species was also associated with soil elements.
M. robertsii was found to be the dominant species by proportion of soil samples in
legume field, grassland and forest, with a single isolate found in maize, whereas M.
indet. 1 was the dominant species in maize fields. The majority of samples recovered
from grassland were M. robertsii, with only 1 other isolate (M. indet. 1) recovered in a
single grassland sample. Wyrebek et al. (2011) similarly found a strong association
between M. robertsii and grassland in a comparison of three Metarhizium species (M.
brunneum Petch, M. robertsii and M. guizhouense Q.T. Chen & H.L. Guo) with plant

102
species categorised as grasses, wildflowers, shrubs and trees respectively. M. robertsii
was the only species associated with grasses. While M. robertsii was also associated
with other ecotypes in this thesis, the strong genetic differentiation of haplotypes
associated with grassland from those found in other ecotypes (as described in Chapter
3) suggests that further work on association of haplotypes and species with grassland
compared to other ecotypes should be conducted.
Very few studies have been conducted to identify the naturally occurring species in
agricultural fields, grasslands and forest ecotypes of a locality. Bidochka et al. (2001)
found “cold active” and “heat active” Metarhizium strains in Canada, which were
abundant in forest and agricultural fields respectively. The strains were later identified
as M. brunneum, and M. robertsii and respectively (Bischoff et al., 2009). Strane
(2014) attempted to isolate Metarhizium species from the forest, grassland and
agricultural fields and only isolated two species form forest, M. pemphigi and M.
guizhouense, due to adverse local weather conditions during the sampling time. In
other studies, M. brunneum was the dominant species in grasslands in Switzerland
(Steinwender et al., 2014), and in agricultural fields in the USA (Fisher et al., 2011).
In Japan, M. pingshaense was frequently isolated from agricultural and forest habitat,
but M. brunneum and M. pemphigi were comparatively abundant in forest habitat
(Nishi et al., 2013). On the other hand, in Denmark, M. brunneum was found
dominant species in agricultural soils (Steinwender et al., 2014). The variation of the
recovery of the Metarhizium species in different soil habitats indicates that the local
soil environment and potentially host plant composition strongly influences the
occurrence of the Metarhizium species.
The binomial regression analysis showed that ecotype dominated by crop or plant
species and location both predicted the occurrence of some of the species. M. robertsii
103
and M. anisopliae were predicted by ecotypes, Metarhizium indet. 1 by both ecotype
and location. Quesada-Moraga et al. (2007) also reported that the occurrence of
Metarhizium spp. was predicted by the field crop habitat and geographical location
(latitude and longitude), but their study broadly reported the occurrence of genus
Metarhizium, and did not study the association of the species of Metarhizium with
location and ecotype. To our knowledge, this is the first study to show the relationship
between the species of Metarhizium and location and ecotype.
The adaptation of M. anisopliae to slightly acidic condition has been reported
elsewhere (Issaly et al., 2005, Quesada-Moraga et al., 2007). Metarhizium spp. were
associated with higher soil pH in Tasmania (Rath et al, 1992). The soil pH of the
studied samples ranged from slightly acidic to slightly alkaline (6.03 to 7.42), but the
presence of Metarhizium species in soil samples showed no relationship with soil pH.
This study did not find any correlation between occurrences of Metarhizium species
with soil moisture. Possibly the soil moisture retained in the soil samples did not limit
germination of Metarhizium conidia.
This study highlighted for the first time the relationship between soil elements and the
presence of Metarhizium species in soil. The occurrences of M. anisopliae and M.
robertsii were positively correlated with the soil elements N, C and Zr, and M.
anisopliae was negatively correlated with Ti. In addition, Cu, Fe, and Mn were
positively correlated with the isolation of M. robertsii. The isolation of Metarhizium
indet. 1 increased with increased soil Fe, Cr and Zr and decreased with greater C, N,
and K. Importantly, M. anisopliae and M. robertsii were isolated mostly from legume
and forest soils that were rich in high N and C. In contrast, M. indet. 1 was
predominantly isolated from maize and (in the case of one isolate) from grassland
soils, with low nitrogen and carbon content. This may be a significant benefit to the
plant, since Metarhizium species in the rhizosphere have been shown to supply insect-

104
derived nitrogen to the plant in exchange of plant-derived carbohydrates (Behie et al.,
2017, Behie et al., 2012).
This study also revealed that M. robertsii and Metarhizium indet. 1 were more
abundant in Fe rich soil. Recent findings showed that Metarhizium
brunneum solubilised Fe from complex form to available form for plant uptake in
calcareous and sandy soils (Raya–Diaz, et al. 2017). The abundance of M. robertsii
and Metarhizium indet. 1 in Fe-rich soil suggests that the relative mobilisation of iron
by these strains should be further investigated.
The results demonstrated that Metarhizium species have the capability to adapt to a
wide range of soils, but also that occurrence of Metarhizium species to different soil
environments may be heavily influenced by dominant plant species, and by crop type,
even though crop type will change from year to year as different crops are rotated.
Forest and grassland ecotypes contain a wide variety of species, including both grass
and legume species, including woody legumes such as Acacia spp. in Australian
forests. Analysis of the composition of plant taxa as well as soil composition and
ecotype or land use should be conducted in future studies to develop a deeper
understanding of Metarhizium ecology and selection and application of Metarhizium
species in the future biological pest management strategies in specific local habitats.
Limitation of this study
Due to time constraints in the PhD timeline, this study did not include any
biogeography and habitat modelling (King et al., 2010) to compare the occurrence of
Metarhizium clades by ecotype and location. Similarly, an ultrahigh-variable selection
algorithm to select co-variates that predict the distribution of Metarhizium populations
(Fitzpatrick et al. 2016). Both these analyses need advance statistical knowledge that
were beyond the timeframe of this PhD. We will complete those analyses before
submitting the manuscript for publication.

105
Chapter 5 : Association of Metarhizium species
with agricultural crops and evaluation of
colonisation of selected isolates in pea and
maize.

106
Association of Metarhizium species with agricultural crops and
evaluation of colonisation of selected isolates in pea and maize.
Abstract
Entomopathogenic fungi of the genus Metarhizium are used as microbial insecticides
and also have a mutually beneficial relationship with the rhizosphere of plants. The
factors that determine the natural occurrence and diversity of Metarhizium species in
agricultural fields and their colonisation of different crops are, however, still unclear
but may have a significant role in selection of Metarhizium species for use in
agriculture. This study used 78 Metarhizium isolates from maize and legume crops
(Chapter 3) and analysed their association with different crops. M. robertsii, M.
anisopliae, M. pingshaense were found to be abundant in soils of legume crops,
whereas the 2 new taxonomic clades M. indet. 1 and M. indet. 2 were only isolated
only from soils in which maize had been recently grown.
Colonisation of the rhizosphere in pea and maize by six isolates isolated from legume
fields and six isolates from maize field were evaluated by quantification of colony
forming units (cfus) in the laboratory. The results showed plant type and fungal
isolates significantly affected root colonisation, with higher cfus in pea than maize
irrespective of crop from which the strain was isolated. The results indicate that the
host plant influences the diversity and colonisation of Metarhizium.
Keywords: Metarhizium, multilocus phylogenetic analysis, agriculture, rhizosphere,
pea, maize.

107
5.1 Introduction
The species of the entomopathogenic fungus genus Metarhizium (Family:
Clavicipitaceae, Order: Hypocreales) are widely distributed in soils and cause ‘green
muscardine disease’ in a wide range of insects (Zimmermann, 2007). Historically
Metarhizium species have been used as a biological control agent (Liao et al., 2014,
Lomer et. al., 2001). Faria et al., (2009) listed 59 commercial products of
Metarhizium that are either registered or used to control insect pest in crops or pasture
in countries including the USA, UK, Australia, Brazil, and India. In addition to this
entomopathogenic life history, Metarhizium species are able to colonise the plant
rhizosphere, and to increase plant growth and development (Wyrebek et al., 2011,
Harman, 2006, Hu and St. Leger, 2002).
Root colonisation by Metarhizium was first observed in a cabbage field by Hu & St.
Leger (2002and was subsequently investigated in many plant systems (Liao et al.,
2014). The association of Metarhizium robertsii J.F. Bisch., Rehner & Humber with
switchgrass (Panicum vigratum L.) and haricot beans (Phaseolus vulgaris L.) resulted
in greater proliferation and formation of a high density of root hairs on the plant roots
(Sasan and Bidochka, 2012). Moreover, Elena et al. (2011) found increased plant
height, root length, shoot and root dry weight in tomatoes following colonisation by
M. anisopliae (Metch.) Sorokin. Furthermore, Metarhizium in the plant rhizosphere
has demonstrated pathogenicity against insect pests, for example, mealworm beetle
(Tenebrio molitor L.) in wheat (Keyser et al., 2014) and black vine weevil
(Otiorhynchus sulcatus F.) in pine (Picea abies) (Bruck, 2005). The beneficial
associations of Metarhizium with the rhizosphere and their entomopathogenicity
makes them worthy growth promoters and bio-pesticides.

108
The distribution and evolutionary divergence of Metarhizium species is closely
associated with certain soils and plant types (Bidochka and Hajek, 1998, Wyrebek
and Bidochka 2013). Wyrebek et al. (2011) showed that the associations of three
Metarhizium species (M. brunneum Petch, M. robertsii and M. guizhouense Q.T.
Chen & H.L. Guo) were not random, but that each was associated with plant species
categorised as grasses, wildflowers, shrubs and trees respectively. M. robertsii was
the only species associated with grasses, while M. guizhouense was found to be
closely associated with trees of the genus Acer. These species’ strain-specific
associations probably arise from long associations of the fungi with plant species in
certain ecotypes (Bruck, 2010) and may have important impacts on the successful
colonisation of particular plant types.
In Chapter 3, Metarhizium isolates were recovered from three different ecotypes:
agricultural fields (maize and legume), grassland and forest from three locations
(Bundaberg, Gatton and Kingaroy). In this Chapter, phylogenetic relationship of
Metarhizium isolates were reconstructed by using MzIGS3 and 5’-TEF sequence data
of isolates recovered only from crops. The colonisation of the rhizosphere of two crop
types, maize and pea, were then compared. The combined ecological and biological
knowledge can be used for efficient Metarhizium species selection for pest control
and plant growth in crop fields in Australia.

109
5.2 Materials and methods
5.2.1 Collection of soil samples, fungal isolation, Genomic DNA extraction, PCR
amplification, and sequencing
A total of 400 soils from 5 agricultural fields (3 maize and 2 legume fields, 80
sample/field) were collected as described in Chapter 3.
Chapter 3 also described the fungal isolation, DNA extraction and PCR amplification
and sequencing of ITS, MzIGS3 and 5'-TEF regions.
5.2.3 Phylogenetic tree construction
Phylogenetic trees for concatenated data sets of MzIGS3 and 5'-TEF were re-
developed using maximum likelihood (ML) and Bayesian inference with the currently
recognised reference strains: M. globosum ARSEF 2596, M. acridum ARSEF 7486,
M. majus ARSEF 1914, M. lepidiotae ARSEF 7488, M. guizhouense CBS 258.90, M.
anisopliae ARSEF 7487, M. anisopliae isolate 68, M. anisopliae isolate 69, M.
anisopliae isolate 251, M. pingshaense CBS 257.90 and M. robertsii ARSEF 7501.
Support Values on best-scoring ML tree for each individual data set was drawn in
RAxML with a rapid bootstrap (1000 replicates) under GTRGAMMA substitution
model. For multigene analysis, the MzIGS3 and 5’-TEF data were combined in a
matrix and ML analysis was done using the above parameters with each locus run in
the different partition.
5.2.4 Genetic differentiation and gene flow studies
Nucleotide polymorphism, fixed, shared mutations, nucleotide diversity between the
M. anisopliae (Mani), M. robertsii (Mrob), M. pingshaense (Mpin), Metarhizium
indet. 1 (Mindet1) and Metarhizium indet. 2 (Mindet2) clades identified in multilocus
(MzIGS3 and 5’-TEF) phylogenetic analysis were calculated using DNAsp 5.10.01

110
(Rozas et al. 2003). In order to calculate the genetic differentiation within the
Metarhizium linages, haplotype based statistics such as Hs and Hst (Hudson et al.
1992a and 1992b) and nucleotide sequence based statistics such as Ks, Kst and Snn
(Hudson’s statistic of genetic differentiation, Hudson et al. 2000) were estimated with
permutation tests using 1000 randomization to get the statistical significance in
DNAsp. The software also used to calculate the gene flow estimates, Nst and Fst
value, the indirect measurement of effective number of migrants (Nm) (Hudson et al.
1992b) among the populations. DNA sequences from three locations and four
ecotypes were also used for genetic differentiation and gene flow studies.
Nucleotide sequence alignment (nexus file) of combined data set of MzIGS3 and 5’-
TEF of Metarhizium isolates was imported into DnaSP 5.10.01 for haplotypes
analysis and generation of haplotype data file in nexus file format. The nexus file was
edited to add location and ecotypes information in a character matrix and a minimum
spanning network (MSN) was constructed in PopART (http://popart.otago.ac.nz) to
determine the relationships among haplotypes for Metarhizium population in different
locations and ecotypes. The MSN is based on a minimum spanning tree where a set of
sequence types connects all given types without creating any cycles where the total
length (sum of distance between linked sequences) is minimum (Bandelt et al. 1999).
5.2.5 Metarhizium colonisation in pea and maize
5.2.5.1 Fungus material
Six isolates of each of legume and maize fields were selected for the plant
colonisation experiments based on their different phylogenetic position in the
cladogram (Table 5.1). One set of isolates, BMA2, BMB5, BMB10, BMC1, BMC10
and BMD20 from maize field and another set of isolates, KLA15.2, KLD17,
KLA17.1, KLA17.2, KLB7 and KLD5.1 from legume field were selected.
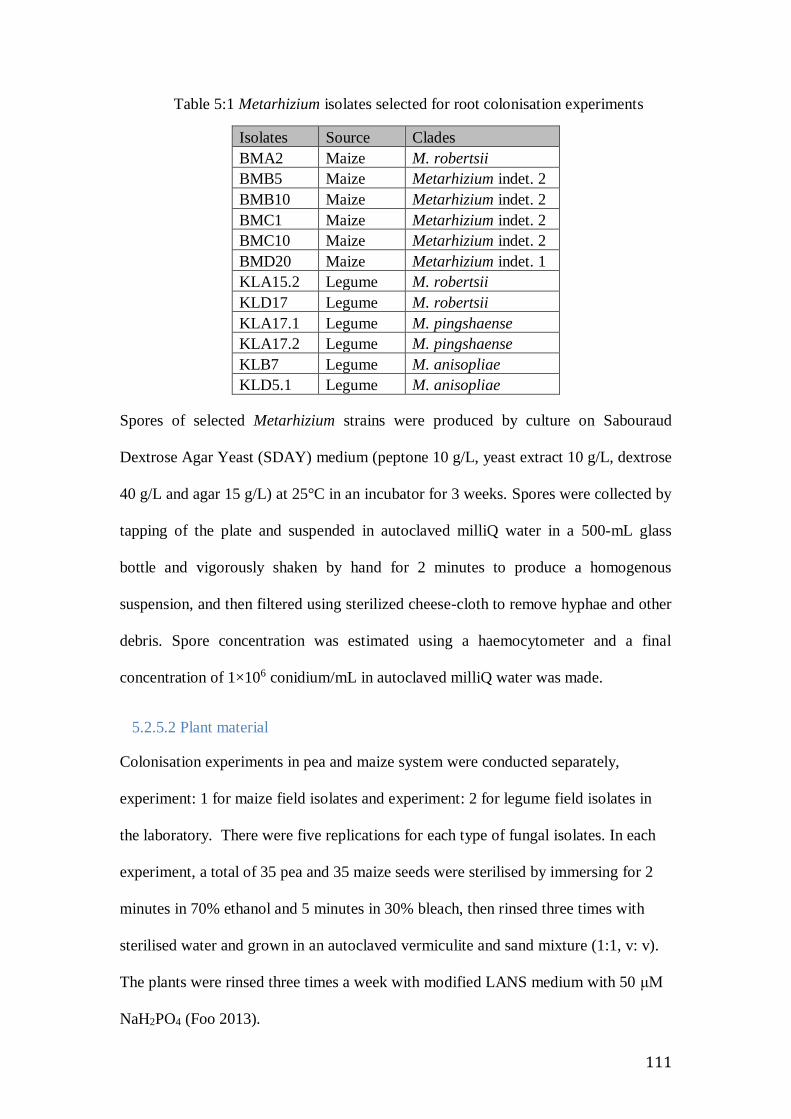
111
Table 5:1 Metarhizium isolates selected for root colonisation experiments
Isolates Source Clades
BMA2 Maize M. robertsii
BMB5 Maize Metarhizium indet. 2
BMB10 Maize Metarhizium indet. 2
BMC1 Maize Metarhizium indet. 2
BMC10 Maize Metarhizium indet. 2
BMD20 Maize Metarhizium indet. 1
KLA15.2 Legume M. robertsii
KLD17 Legume M. robertsii
KLA17.1 Legume M. pingshaense
KLA17.2 Legume M. pingshaense
KLB7 Legume M. anisopliae
KLD5.1 Legume M. anisopliae
Spores of selected Metarhizium strains were produced by culture on Sabouraud
Dextrose Agar Yeast (SDAY) medium (peptone 10 g/L, yeast extract 10 g/L, dextrose
40 g/L and agar 15 g/L) at 25°C in an incubator for 3 weeks. Spores were collected by
tapping of the plate and suspended in autoclaved milliQ water in a 500-mL glass
bottle and vigorously shaken by hand for 2 minutes to produce a homogenous
suspension, and then filtered using sterilized cheese-cloth to remove hyphae and other
debris. Spore concentration was estimated using a haemocytometer and a final
concentration of 1×10⁶ conidium/mL in autoclaved milliQ water was made.
5.2.5.2 Plant material
Colonisation experiments in pea and maize system were conducted separately,
experiment: 1 for maize field isolates and experiment: 2 for legume field isolates in
the laboratory. There were five replications for each type of fungal isolates. In each
experiment, a total of 35 pea and 35 maize seeds were sterilised by immersing for 2
minutes in 70% ethanol and 5 minutes in 30% bleach, then rinsed three times with
sterilised water and grown in an autoclaved vermiculite and sand mixture (1:1, v: v).
The plants were rinsed three times a week with modified LANS medium with 50 μM
NaH2PO4 (Foo 2013).

112
5.2.5.3 Root colonisation
Two weeks after planting, plants were inoculated at the base of the stem with 10ml of
conidium suspension (1×10⁶ conidium/ml in autoclaved milliQ water) of selected
strains. After inoculation, plants were returned to the growth room and arranged in a
randomised block layout in trays. At 2 weeks after inoculation, the plants were
carefully uprooted and gently washed in running deionised water. A mass of 1 g of
root from each plant was taken from the middle of the tap root and surface sterilised
by immersing for 2 minutes in 70% ethanol and 5 minutes in 30% bleach, then rinsed
three times with sterilised water and homogenised in 1 ml of 0.05% Tween 80. The
root suspension was diluted ten-fold (100 µl in 900 ml of 0.05% Tween 80) and 100
µl of root suspension was spread in selective medium containing peptone 10g/L,
glucose 20 g/L, agar 18 g/L, cycloheximide 50 mg/L, streptomycin 100 mg/L,
tetracycline 50 mg/L and dodine 100 mg/L) (Strasser et al. 1996) and incubated in the
dark at 22° C. The agar plates were observed after 7 days and the number of colony
forming units (CFU) was recorded.
5.2.6 Data analysis
The presence of Metarhizium species in soils samples of maize and legume fields was
analysed with analysis of similarity (ANOSIM) with a permutation test for
significance using “Vegan” package in Rv3.3.1 (R Core team, 2016).
The colonisation experiments were conducted in completely randomised design with
five replications. Statistical analyses were performed in ‘R’v3.3.1 (R core team,
2016). Generalised linear model for the poisson data family was used to analyse the
effects of the plant and fungus in colonisation and mean values were compared by
Tukey’s post hoc test using ‘lsmeans’ package.

113
5.3 Results
5.3.1 Metarhizium abundance in agricultural soils
A total of 114 fungal isolates from 400 soil samples of agricultural fields were
identified as members of insect pathogenic fungal groups using the ITS sequence
highest similarity search in NCBI database. The maximum likelihood (ML)
phylogenetic tree for ITS data set showed among the 114 entomopathogens, 28
isolates were from the genera Isaria and Beauveria, 2 isolates from the genus
Lecanicillium, 6 isolates from the genus Pochonia (syn. Metacordyceps) and 78
isolates from the genus Metarhizium with high bootstrap support (>70%)
(Supplementary data, Figure 5.8). The presence of identified 78 Metarhizium isolates
was observed in 37 of 400 soil samples. The total percent occurrence of Metarhizium
was calculated 9.25% in agricultural soil, with 9.58% in maize soil and 8.75% in
legume soils.
5.3.2 Multilocus phylogenetic analysis
The MzIGS3 and 5’-TEF nuclear sequences from 78 field isolates were aligned with
nine recognised and three in-house Metarhizium isolates, yielding 1278 aligned
nucleotide positions. The resulting maximum phylogenetic tree (Figure 5.1) and
Bayesian tree (Figure 5.2) identified five major clades of Metarhizium species with
broad supports (>70%). Among the five clades, three clades were currently defined
taxa, M. robertsii, M. anisopliae and M. pingshaense, and two clades of taxonomic
indeterminate Metarhizium species. The M. robertsii clade included a total 15
isolates; 14 from legume fields and 1 from maize field, whereas, M. anisopliae and M.
pingshaense included 10 and 4 isolates respectively and all were recovered from
legume fields. The indeterminate species were divided into two groups, Metarhizium
sp. indet. 1 and Metarhizium sp. indet. 2 and included 43, and 6 isolates respectively.
All the indeterminate Metarhizium isolates were obtained from maize fields only.

114
M. pingshaense
M. anisopliae isolate 68
M. pingshaense CBS257.90
M. anisopliae isolate 69M. anisopliae isolate 251M. anisopliae ARSEF7487
Metarhizium indet. 1
Metarhizium indet. 2
Figure 5.1 Phylogenetic tree obtained from maximum likelihood analysis of
concatenated data of MzIGS3 and 5'-TEF.Taxon label colour indicates the source of
the isolates, red for maize and blue for legume field. Taxon within blue box was used
for colonisation experiment.

115
M. pingshaense
M. anisopliae isolate 68
M. pingshaense CBS257.90
M. anisopliae isolate 69M. anisopliae isolate 251M. anisopliae ARSEF7487
Metarhizium indet. 1
Metarhizium indet. 2
Figure 5.2 Phylogenetic tree obtained from Bayesian inference analysis of
concatenated data of MzIGS3 and 5'-TEF.Taxon label colour indicates the source
of the isolates, red for maize and blue for legume field.

116
5.3.3 Genetic differentiation studies
The summary statistics of DNA divergence in the comparison between the
Metarhizium clades and ecotypes were presented in Table 5.2. The number of
polymorphic sites and average nucleotide differences (k) were varied from 33- 316
and 6.213 - 34.762 respectively. Table 5.2 shows the genetic differentiation and gene
flow estimates for the comparisons between the Metarhizium clades and ecotypes.
The genetic differentiation was evaluated by calculating both haplotype indices (Hs
and Hst) and nucleotide indices (Ks, Kst and Snn). The Kst value close to zero
indicates no differentiation and Snn value close to one indicates differentiation
(Hudson, 2000). The statistical significant values for Ks, and Kst were observed for
all comparisons between the Metarhizium clades revealed the presence of strong
genetic differentiation. The significant (P<0.001-0.05) Snn value ranged from
0.96667 to 1.00000 also reported the higher genetic differentiation between the
clades. In addition, the higher Fst values in the comparisons between the clades were
varied from 0.46 to 0.86 indicating moderate to strong genetic differentiations among
the clades. The genetic differentiation estimates between the crop types ‘maize’ and
‘legume’ were highly significantly different (P <0.001) (Table 5.3).
The combined nucleotide sequences identified 42 haplotypes in the Metarhizium
clades. The clade-haplotype analysis found no shared haplotype between the
Metarhizium populations in different clades. The haplotype network presented in
Figure 5.3, shows the haplotype distribution in among the Metarhizium populations in
different clades.
Among the 42 haplotypes compared in the ecotype-haplotype analysis, only one
shared haplotype (number 1) was shared between Metarhizium populations from both
maize and legume crops. Figure 5.4 shows the relationship between maize and
legume ecotypes through minimum spanning network.

117
Table 5:2 DNA divergence data between the populations of Metarhizium in
phylogenetic clades and ecotypes
Table 5:3 Genetic differentiation and gene flow estimates between the
populations of Metarhizium in phylogenetic clades and ecotypes
* the number of sites that are polymorphic in the 1st species and monomorphic in 2nd species in the comparison ** the number of sites that are polymorphic in the 2nd species and monomorphic in 1st species in the comparison
Probability obtained by the permutation test with 1000 replicates
*, 0.01<P<0.05; **, 0.001<P<0.01; ***, P<0.001

118
Figure 5.3 Haplotype networks for the Metarhizium populations from five clades
based phylogenetic analysis of combined sequence data. Different pie colours in
the circles indicate the location of haplotype origin with size of the circles and pie-
segment is proportional to haplotype frequency. Perpendicular tick marks on the
lines represent the mutations between the linked haplotypes.

119
Figure 5.4 Haplotype networks for the Metarhizium populations from two
ecotypes. Different pie colours in the circles indicate the location of haplotype
origin with size of the circles and pie-segment is proportional to haplotype
frequency. Perpendicular tick marks on the lines represent the mutations between
the linked haplotypes. Only one haplotype was shared between isolates from the
two crop types.

120
M.a
nis
op
liae
M.p
ingh
ae
nse
M.ro
berts
ii
M.in
det1
M.in
det2
LegumeLegumeLegumeLegumeMaizeMaizeMaizeMaizeMaizeMaizeMaizeMaizeMaizeMaizeMaizeMaizeMaizeMaizeMaizeMaizeMaizeMaizeMaizeMaizeMaizeMaizeLegumeLegumeLegumeLegumeLegumeLegumeLegumeMaizeLegumeLegumeLegume
0
0.2
0.4
0.6
0.8
1
M. a
nis
op
liae
Me
tarh
iziu
m in
de
t. 1
Me
tarh
iziu
m in
de
t. 2
M. ro
berts
ii
M. p
ing
sh
aen
se
5.3.4 Ecotype association study
The analysis of similarity (ANOSIM) showed a significant (R=0.5339, significance
=0.001) pattern of association of the species of Metarhizium with the crop types
‘maize’ and ‘legume’. Two indeterminate species (Metarhizium indet. 1 and 2) were
associated with maize crops, whereas, M. robertsii, M. anisopliae and M. pingshaense
were associated with legume crops (Figure 5.5).
Figure 5.5 Heatmap of Metarhizium species associated with maize and legume
ecotypes based on Czekanowski dissimilarity in DICE analysis of presence-absence
data, R=0.5339, significance =0.001.

121
5.3.5 Plant colonisation
5.3.5.1 Experiment 1: Colonisation of maize field isolates in pea and maize systems
Six Metarhizium isolates from maize field were tested for their colonisation ability in
pea and maize systems in first plant colonisation experiment. Both the main factors,
plant type and fungal strains and their interaction had significant (p<0.001) effect on
root colonisation by fungal isolates of maize fields (Figure 5.6, Supplementary data,
Table 5-4). The colonisation of maize field isolates ranged from a mean of 10410-
19830 CFU per g of fresh root. Four Metarhizium isolates BMC1, BMA2, BMC10
and BMB10 showed higher colonisation in pea than maize. In contrast, two isolates
BMD20 and BMB5 showed higher colonisation in maize plant than pea. Complaining
the root colonisation by different clades of Metarhizium species, all clades except M.
indet. 1 showed higher colonisation in pea than maize. M. indet. 1 colonised higher in
maize (11960±679.41CFU per g fresh root) than pea (1171±1646.4 per g fresh root)
(Figure 5.7). The highest amount of root colonisation was observed in pea by M.
robertsii (16813±2264 CFU per g fresh root).

122
Figure 5.6 Colonization of legume (pea) and maize roots by Metarhizium isolates
from maize fields (colonisation experiment 1). Bar plot (meanSEM) with
different lowercase letters indicates statistical differences on Tukey’s post hoc
test, p < 0.05.
Figure 5.7 Colonization of legume (pea) and maize roots by 3 Metarhizium clades
isolated from maize fields (colonisation experiment 1). Bar plot (meanSEM)
with different lowercase letters indicates statistical differences on Tukey’s post
hoc test, p < 0.05. BMA2 is the only isolate of M. robertsii from maize. BMD20 is
clade M. indet 1. All other isolates are clade M. indet 2.

123
5.3.5.2 Experiment 2: Colonisation of legume field isolates in pea and maize systems
The colonization of maize and legume (pea) plants by six Metarhizium isolates from
legume fields was quantified. The effects of plant type and fungal isolates and their
interaction showed significant differences in colonisation (Figure 5.8, Supplementary
data, Table 5.5). All the Metarhizium isolates from legume field had a higher count of
CFUs on pea than on maize.
When analysed by clade, (Figure 5.9), all three clades had significantly higher cfu
counts per g of fresh root on pea than on maize roots (P<0.05). The highest cfu count
was observed by isolates of the clade M. anisopliae (18450± 1610.5 CFU per g of
fresh root) in pea root.

124
Figure 5.8 Effects of plant types and Metarhizium legume field isolates on root
colonisation (colonisation experiment 2). Bar plot (meanSEM) with lowercase
letter indicates statistical differences using Tukey’s post hoc test, p < 0.05.
Isolates KLA15.2 and KLD 17 are M. robertsii, KLA17.1 and KLA17.2 are M.
pingshaense, KLB7 and KLD 5.1 are M. anisopliae.
Figure 5.9 Effects of plant types and Metarhizium clades from legume field
isolates on root colonisation (colonisation experiment 2). Bar plot (meanSEM)
with different lowercase letter indicates statistical differences on Tukey’s post
hoc test, p < 0.05.

125
Overall, the colonization of pea plant roots was significantly higher than on maize in
both experiments (Figure 5.10). However, the difference between the mean cfu on pea
and the mean cfu on maize was greater in isolates from the soil of legume crops than
in isolates from the soil of maize crops.
Figure 5.10 Effects of plant types on root colonisation : A: Mean cfu of
Metarhizium isolates from maize fields, B: Mean cfu of Metarhizium isolates
from legume fields (Bar plot (meanSEM) with asterisk mark indicates
statistical differences on Tukey’s post hoc test, p < 0.05.

126
5.4 Discussion
This research has three principal findings.
1: Species of the genus Metarhizium were abundant and co-occurred in soil from
agricultural crops.
2: Metarhizium species were diverse in both legume and maize crops but showed a
clear genetic differentiation in the two crops.
3: While colonisation of legume (pea) roots was typically higher than in maize by
most clades and isolates, there was a significant difference in ability to colonise maize
by different fungal taxa.
The agricultural soils of Queensland, Australia are a source of diverse
entomopathogenic fungi. Fungi of the genus Metarhizium occurred with higher
frequency than those of other genera in agricultural soils. This higher abundance of
Metarhizium species in Australian agricultural soils is similar with global patterns.
Among the entomopathogens, Metarhizium was more frequently recovered from
agricultural soils than from forest or grassland habitats in Canada, Finland, the
Netherlands and China (Bidochka et al. 1998, Vanninen 1996, Steenberg 1995,
Meyling and Eilenberg, 2007). The persistence of Metarhizium in agricultural habitats
was also observed by Hu and Leger (2002), Lingg and Donaldson (1989) and Clerk
(1969). However, the factors influencing the agricultural habitat preference of
Metarhizium have not been identified. Kepler et al. (2015) suggested that tillage
operations might increase the dispersion of Metarhizium propagules resulted in higher
recovery of Metarhizium in agricultural field. The long-term viability of Metarhizium
conidia in soils (Latch and Fallon 1976) may be another cause of higher persistence of
Metarhizium species in agricultural soils.

127
This study identified several co-occurring taxonomic groups of Metarhizium in
agricultural fields. This trend was also observed by Steinwender et al. (2014), who
observed several Metarhizium species in a single arable field. In contrast, only a
single clade of Beauveria bassiana was identified by Meyling et al. (2009) in
agricultural soils in Denmark. The results suggest that Metarhizium species are
tolerant of soil disturbance caused by agricultural practices.
This study observed five clades within the genus Metarhizium in the agricultural
fields, which were significantly differentiated by crop. The clades of Metarhizium
isolates showed the crop specific association: Metarhizium robertsii, M. anisopliae,
M. pingshaense were associated with legume crops, while the new taxonomically
indeterminate groups M. indet. 1 and M. indet. 2 were associated with maize. Crop-
specific association of Metarhizium species has also been reported in the USA, where
M. brunneum was found strongly associated with blueberry and strawberry (Fisher et
al. 2011). Little is known about the factors governing local adaptation of
Metarhizium, though rhizosphere associations are reported to stabilize Metarhizium
population through beneficial mutations (Wang et. al. 2011). However, this is the first
study to report crop-specific associations between monocot and Eudicot species, and
particularly between two crops of global significance (maize and legume).
Association of the different Metarhizium taxa with the rhizosphere of legumes and
maize showed significant differences between taxa. Although the fungal isolates were
isolated from different crops, colonisation (as measured by colony forming units per
gram weight fresh root) was overall significantly higher in pea than in maize roots in
the majority of Metarhizium taxa. However, the difference between mean cfu on pea
and mean cfu on maize was greater in isolates from legume crops than those from
128
maize crops. In particular, isolate of the new taxon M. indet. 1, which were isolated
from maize crops, showed a significantly higher colonisation of maize roots than pea
roots.
An understanding of the factors governing association of Metarhizium species with
specific crops may be important in selection of isolates as rhizospheric inocula. Maize
and pea belong the monocot and Eudicots, with significant differences in root
anatomy and in the type and quantity of hormones secreted by roots. Plant hormones
are thought to play an important role in the establishment of symbiotic relationships in
the rhizosphere, and this will be explored in greater detail in Chapter 6.

129
5.8 Supplementary data
Table 5:4 Generalised linear model for experiment 1 showing the effects of plant, fungus
and their interaction on colonisation
Coefficients:
Estimate Std. Error z value Pr (>|z|)
(Intercept) 9.724812 0.008169 1190.445 <2e-16 ***
Plant -0.133327 0.005214 -25.570 <2e-16 ***
Fungus 0.017122 0.002076 8.248 <2e-16 ***
Plant:Fungus -0.016629 0.001336 -12.445 <2e-16 ***
---
Significance values: ‘***’ <0.001, ‘**’ <0.01, ‘*’ <0.05.
(Dispersion parameter for poisson distribution taken to be 1)
Null deviance: 78178 on 58 degrees of freedom
Residual deviance: 70714 on 55 degrees of freedom
AIC: 71388
Number of Fisher Scoring iterations: 4
Table 5:5 Generalised linear model for experiment 2 showing the effects of plant, fungus
and their interaction on colonisation
Coefficients:
Estimate Std. Error z value Pr (>|z|)
(Intercept) 10.165216 0.007197 1412.475 < 2e-16 ***
Plant -0.344890 0.004792 -71.974 < 2e-16 ***
Fungus -0.016849 0.001857 -9.072 < 2e-16 ***
Plant:Fungus 0.007465 0.001235 6.046 1.49e-09 ***
---
Significance values: ‘***’ <0.001, ‘**’ <0.01, ‘*’ <0.05.
(Dispersion parameter for poisson distribution taken to be 1)
Null deviance: 70078 on 59 degrees of freedom
Residual deviance: 46772 on 56 degrees of freedom
AIC: 47466
Number of Fisher Scoring iterations: 4
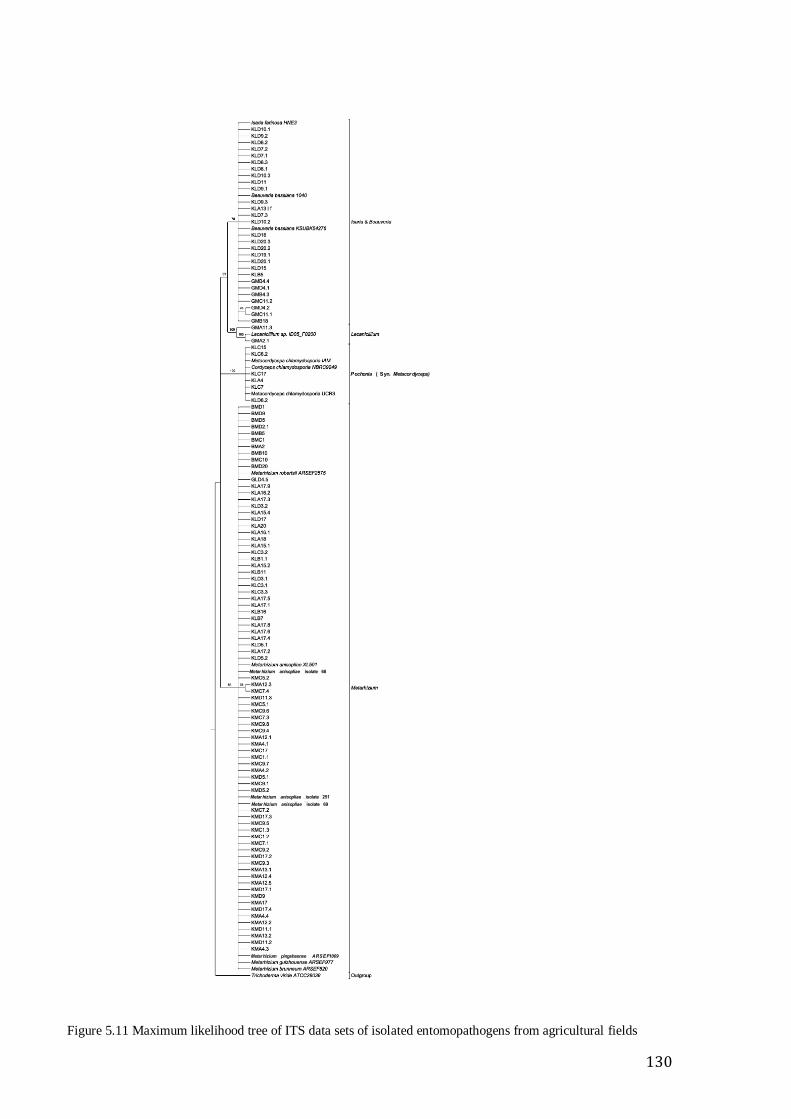
130
Metarhizium anisopliae isolate 68
Metarhizium pingshaense ARSEF1009
Metarhizium anisopliae isolate 69
Metarhizium anisopliae isolate 251
Pochonia ( Syn. Metacordyceps)
Figure 5.11 Maximum likelihood tree of ITS data sets of isolated entomopathogens from agricultural fields

131
Chapter 6 : The effect of strigolactone on
conidium germination and root colonisation
by Metarhizium anisopliae
132
The effect of strigolactone on germination of conidia and root colonisation
by Metarhizium anisopliae
Abstract
Hypocrealean fungi of the genus Metarhizium are known rhizospheric endophytes that support
increased plant growth and development. However, the role of plant: fungal signals and
specifically of plant hormones during colonisation of plant roots by Metarhizium is unknown.
The plant hormone strigolactone is a plant growth hormone known to play an important role in
signalling during rhizospheric colonisation by arbuscular mycorrhizae. Germination of conidia
and colonisation of the root by M. anisopliae were estimated on wild variety pea (Pisum
sativum L. cv Torsdag) and strigolactone pea mutants, rms 5-3: strigolactone deficient and rms
4-1: strigolactone overproducing mutants. Condiospore germination was significantly lower in
root exudates from the strigolactone-deficient pea (rms 5-3) than in exudates from wild and
strigolactone -overproducing (rms 4-1) mutant plants. Colonisation of root segments was
higher in wild and strigolactone -overproducing (rms 4-1) mutant plants than the
strigolactone-deficient (rms 5-3) plants. This is the first report indicating that plant
strigolactone ingresses both conidium germination and colonisation of the root by
Metarhizium.
Keywords: Strigolactone, Metarhizium, symbiosis, rhizosphere, colonisation.

133
6.1 Introduction
The rhizosphere is a narrow zone of soil directly influenced by plant roots and associated
microorganisms into which plants secrete a number of chemical compounds (Bais et al., 2001,
Walker et al., 2004). These root exudates include carbohydrates, amino acids, organic acids,
phenolic compounds, proteins, and mucilage, and a number of plant hormones and signalling
molecules that regulate plant-plant, plant-insect or plant-microbe interactions in the
rhizosphere (Davies et al., 2010). These symbiotic associations may be commensal, mutualist
or parasitic: for example, the associations of some fungi or rhizobia with the rhizosphere
benefit plant hosts through increased nutrient supply, but infection by plant pathogens is
harmful to the plant host. Some chemicals in plant root exudates act as a signalling molecules
to initiate interaction between plants and soil microorganisms (Walker et al., 2004).
Plant hormones and soil nutrient levels influence mycorrhizal formation in plants. The plant
hormone auxin is secreted by fungi and contributes to symbiotic associations, changing root
anatomy and promoting the development of lateral roots that are the site of establishment of
most fungi (Ludwig-Muller and Guther, 2007). Trichoderma virens Persoon produces auxin-
related compounds that enhance lateral root and plant growth through an auxin dependent
mechanism (Contreras-Cornejo et al., 2009). Some fungi produce cytokinins during infection
that induce the root cortical cells to enlarge during symbiotic infection (Kraigher et al., 1991;
Jameson, 2000 and NG et. al. 1982). However, it should be noted that Foo et al. (2013)
concluded that there is no relationship between cytokinins synthesis and mycorrhizal
association in plants.
The plant hormones ‘strigolactones’ are also involved as signalling molecules in the
rhizosphere (Gomez-Roldan et al., 2008, Xie et al., 2010). These carotenoid-derived plant
compounds are synthesized in the lower parts of the stem and roots and are involved in many
aspects of plant developments, such as inhibition of shoot branching, root architecture,

134
adventitious root formation, cambium activity stimulation and elongation of stem (Gomez-
Roldan et al., 2008, Boyer et. al., 2013). Strigolactones also act as signalling molecules for
arbuscular mycorrhizal symbiosis (Gomez-Roldan et al., 2008, Foo et. al., 2013), stimulating
the hyphal branching during spore germination (Besserer et al., 2016, Akiyama et al., 2005,
Akiyama and Hayashi 2006, Harrison, 2005), which increases the probability of root
colonisation by arbuscular mycorrhizae.
Fungi other than arbuscular mycorrhizae can colonise the rhizosphere as endophytes and have
beneficial effects on plant growth and development. Species of Trichoderma (Order:
Hypocreales, Family: Hypocreaceae) are facultative symbionts able to colonise the plant root,
and have been used as antagonists to reduce plant pathogenic infections (Viterbo and Horwitz,
2010, Hermosa et al., 2012). Plant-derived monosaccharides, disaccharides and
polysaccharides excreted by roots facilitate the growth of Trichoderma in the rhizosphere and
enhance root colonisation by the fungus (Vargas et al., 2009). Surprisingly, strigolactone does
not activate response in Trichoderma suggesting that interactions with strigolactone might be
specific to colonisation by arbuscular mycorrhizal fungi (Steinkellner et al., 2007, de-Brujn,
2013, Lopez-Raez and Pozo, 2013). However, Vurro (pers. comm. March, 2014) reported that
Trichoderma harzianum Rifai can detect and metabolize strigolactone, which could enhance
the establishment of the plant/fungus interaction.
The members of the Hypocrealean fungus of genus Metarhizium are known as both pathogens
of invertebrates and also establish as an endophyte in the rhizosphere of plants (Wyrebek et
al., 2011, Harman, 2006, Hu and St. Leger 2002, Behie et al., 2012). This endophytism starts
a symbiotic association between plant and Metarhizium, in where host plant is providing
photosynthates to the fungus, in exchange of insect-derived nitrogen (Behie et al., 2017, Behie
et al., 2012). These symbiotic association of Metarhizium in the plant rhizosphere result in
increased plant growth and development (Keyser et al., 2014), and reducing infection by plant

135
pathogens (Ownley et al., 2010). M. robertsii, stimulated root proliferation and high-density
root hair formation in switchgrass (Panicum vigratum L.) and haricot beans (Phaseolus
vulgaris L.) (Sasan and Bidochka, 2012). Metarhizium systematically colonised the stem of
tomato Lycopersicon esculentum Mill.) after application of fungal mycelium to roots (Parsa et
al., 2018) and increased plant height, root length, shoot and root dry weight (Elena et al.,
2011). M. brunneum systemically colonised different parts of faba bean (Vicia faba L.) and
improvedM plant growth when applied as a seed treatment (Jaber and Enkerli, 2016).
However, the role of plant hormones during establishment of the plant-Metarhizium
association remains little studied.
In this study, the role of strigolactones as plant signals on conidium germination and
colonisation of the rhizosphere in pea (Pisum sativum L.) roots by M. anisopliae was
examined. Pea plants were selected as the model in this study because of the availability of
characterised wild variety (cv. Torsdag) and strigolactones biosynthesis mutants,
strigolactones deficient mutant rms5-3: and strigolactone overproducing mutant rms4-1: (Foo
et al., 2013). Understanding the role of strigolactones has potential impact on further
understanding of the role of rhizospheric signalling in establishment of beneficial
Hypocrealean fungi in plant roots.

136
6.2 Materials and Methods
6.2.1 Fungus material
M. anisopliae isolate 69 was selected for this study. The Metarhizium anisopliae isolate EFD
69 was regularly cultured in our laboratory for bioassay experiment and its genome sequence
was published by Pattemore et al. (2014). The strain was isolated from Kingaroy region,
Queensland and obtained Department of Agriculture and Forestry (DAF). Spores of M.
anisopliae isolate 69 were produced by culture on Sabouraud Dextrose Agar Yeast (SDAY)
medium (peptone 10 g/L, yeast extract 10 g/L, dextrose 40 g/L and agar 15 g/L) at 25°C in an
incubator for 3 weeks. Spores were collected by tapping of the plate and suspended in
autoclaved milliQ water in a 500-mL glass bottle and vigorously shaken by hand for 2 minutes
to produce a homogenous suspension, and then filtered using sterilized cheese-cloth to remove
hyphae and other debris. Spore concentration was estimated using a haemocytometer and a
final concentration of 1×10⁶ conidium/mL in autoclaved milliQ water was made.
6.2.2 Plant material
Seeds of three varieties of pea plants, wild-variety (Torsdag), and the strigolactone-
overproducing (rms4-1, and strigolactone-deficient (rms 5-3) mutants were obtained from
Professor Christine Beveridge, The University of Queensland.
Pea seeds were surface sterilized by immersing for 2 minutes in 70% ethanol and 5 minutes in
30% bleach. After rinsing 3 times with sterile distilled water, the sterilized pea seeds were
grown in a sterile vermiculite and sand mixture (1:1 v: v) and watered twice in a week with a
modified low-phosphate Long Ashton nutrient solution (LANS, Hewitt 1966) for 4 weeks
under 16 h light-8 h dark photoperiod at 24°C (Foo 2013). Two sets of plants were grown, one
for the conidium germination in root exudate experiment and another for the fungal
colonisation in root experiment.

137
6.2.3 In vitro germination experiment
6.2.3.1 Preparation of pea root exudates (RE)
After four weeks, five plants of each strain were carefully uprooted and washed lightly with
water. Roots of each plant were submerged in 100 mL phosphate-free LANS liquid medium
(Foo 2013, Gomez-Roldan et al. 2008) separately. After 24 hours, the roots were separated
from the stem and weighed to determine root fresh weight of each plant. The liquid medium
in which the plants were grown was collected and filtered using Whatman number 1 filter
paper. Partial purification of the root exudates (RE) was conducted by fractionation with ethyl
acetate and water (1/1 v/v) and freeze-dried following the method described by Gomez-
Roldan et al. (2008). Water was then added to the exudate concentrate to a final volume of
1mL of root exudate per gram of fresh root to get stock RE. A dilution series were made at
100%, 75%, 50%, 25% and 10% (v/v) of the stock RE with sterile distilled water.
6.2.3.2 Metarhizium conidium germination in root exudate
For the in vitro conidium germination test, 100 μl of conidium suspension (1×10⁶
conidium/mL) were added to a 1.5 mL-Eppendorf tube containing 900 μl of root exudates of
each100%, 75%, 50%, 25% and 10% of RE of each plant. Spores were also added to 5 tubes
containing 900 μl 0.1% yeast extract to estimate conidium viability. After 24 hours, 50 μl of
each conidium suspension in exudate was placed on a glass microscope slide with a drop of
lactophenol cotton blue stain and spores were counted by a light microscope using x20
objective. The percentage of conidium germination was determined by recording the
percentage of spores that had formed a germ tube.
6.2.4 Root colonisation experiment
This experiment used the method described by Parsa et al. (2013). Metarhizium colonisation
in pea roots was assessed in two time points, 3 and 7 days after fungus inoculation. Two sets
of plants were grown for assay at each of two time points: for the 3-day time point, 25 plants

138
from each pea variety and for 7-day time point, 15 plants from each pea variety were used.
Additional five plants of each variety of each of time points were grown as control. Sterilised
seeds were grown in an autoclaved vermiculite and sand mixture (1:1 v: v). The plants were
watered three times in a week with modified low phosphate LANS medium (Foo 2013). After
4 weeks of planting, plants were inoculated at the base of the stem with 10 mL of conidium
suspension (1×10⁶ conidium/mL in autoclaved milliQ water). The control plants were
inoculated with 10 mL of milliQ water only. Plants were watered to soil capacity 24 hours
before inoculation. After inoculation, plants were kept in growth room and arranged in a
randomised block layout in trays.
At 3 and 7 days after inoculation the plants were carefully uprooted and gently washed in
running deionised water. Two main roots were cut from each plant and a 3cm section was cut
from the middle of the root and surface sterilized by immersing for 2 minutes in 70% ethanol
and 5 minutes in 30% bleach, then rinsed three times with sterilized water and placed on an
autoclaved paper towel for up to 1 minute to remove excess water in a laminar air flow
cabinet. Each 3cm root section was trimmed into six sections of 0.5 cm each and placed on a
Petri dish with selective medium (peptone 10g/L, glucose 20 g/L, agar 18 g/L, cycloheximide
50 mg/L, streptomycin 100 mg/L, tetracycline 50 mg/L and dodine 100 mg/L) (Strasser et al.
1996) and incubated in the dark at 25° C. The plates were observed every 2-3 days for 20 days
and the number of root segments on which characteristics fungal growth was observed was
recorded. The control plants were also uprooted and roots were washed, sterilized trimmed
and placed on selective medium. No fungal growth on control plant section ensured ‘no
contamination’ or ‘no growth of other endophyte’ in plant sections.
6.2.5 Data analysis
The conidium germination (%) and colonisation (%) data were analysed using generalised
linear model and binomial errors with logit link function in statistical software ‘R’ (R core

139
team, 2016). Tukey’s post-hoc test was done to determine statistical significant differences
among the plant varieties (wild variety, rms5-3, rms4-1) for conidium germination and root
colonisation by the fungus using ‘lsmeans’ package. Regression analysis was conducted to
compare the relationship between percent conidium germination and concentration of root
exudates of plant varieties.
6.3 Results
6.3.1 M. anisopliae conidium germination
The conidium viability test showed that 94.81% spores germinated in yeast extract, which
confirmed the conidium viability. No spores germinated in water after 24 hours. Logistic
analysis using a generalised linear model showed that both the main factors, plant variety and
root exudate concentration, had significant effect (p<0.05) on conidium germination of M.
anisopliae (Supplementary data, Table 6.1).
The mean Metarhizium conidium germinations varied from 3.17% to 30.67%. The highest
percentage of conidium germinated (30.61%) in 100% root exudate of wild variety of plant
and lowest number of spores germinated (3.17%) in 10% root exudate of strigolactone
deficient (rms5-3) pea plant after 24 hours (Figure 6.1). In all root exudate concentrations
(100% to 10%), the highest percentage of conidium germination was observed in wild variety
pea followed by strigolactone overproducing mutant (rms4-1). The lowest conidium
germination was observed in strigolactone deficient plant (rms5-3) in all root concentrations.

140
Figure 6.1 Effects of pea plant varieties and root exudate concentrations on M.
anisopliae conidium germination after 24 hours. Bar plot (mean±SEM) with different
lowercase letters indicates statistical differences on Tukey’s post hoc test (p < 0.05).
The linear regression showed a significant positive association between germination of M.
anisopliae spores and concentration of root exudates (RE) for all three varieties of pea plant
(Figure 6.2, supplementary data 6.2). Spore germination increased linearly with the increase
of root exudate concentration of each plant variety. This data also indicated that the chemical
compounds presented in the root exudates were active in very low concentration of 10% RE of
all three types of pea strains.
Figure 6.2 Spore germination of M. anisopliae as a function of concentration of RE of
wild, rms4-1 and rms5-3 pea plants. Spore germination was assessed after 24 hours.

141
6.3.2 Root colonisation
Analysis using a generalised linear model showed that the effect of pea plant variety on mean
colonisation of M. anisopliae in root was significant (p<0.05) at both 3 days and 7 days after
conidium inoculation in root rhizosphere (Supplementary data Table 6.3 and 6.4). The highest
proportion of fungal colonisation was found in the wild variety pea root (17.39% at 3 days and
32.74% at 7 days), followed by the strigolactone overproducing plant (rms4-1) (15.58% at 3
days and 25% at 7 days) (Figure 6.3). The lowest percentages of colonisations (11.46% at 3
days and 20.83% at 7 days) were found in the strigolactone-deficient plants (rms5-3) (Figure
6.3). There was no fungal growth observed in root section in selective medium.
Figure 6.3 Effect of pea plant varieties (wild, rms4-1 and rms5-3) on mean cfu of M.
anisopliae at 3 days and 7 days post inoculation. Bar plot (mean±SEM) with different
lowercase letter indicates statistical differences on Tukey’s post hoc test (p < 0.05).

142
6.4 Discussion
This study found a significant effect of the plant strigolactone mutants on conidium
germination of M. anisopliae and root colonisation by M. anisopliae using wild-variety
(Torsdag) and the strigolactone pea mutants rms4-1 and rms5-3. The result showed that
germination of M. anisopliae conidia was significantly reduced in root exudates from the
strigolactone-deficient mutant rms5-3 compared with germination in root exudates from wild
pea variety (Torsdag) and the strigolactone-overproducing mutant rms4-1. Our result also
demonstrated that root exudates at lower concentrations also increased conidium germination
in M. anisopliae compared to incubation in water.
This is the first report of the effect of strigolactone on conidium germination in Metarhizium
spp. Strigolactones have also been reported to stimulate conidium germination in arbuscular
mycorrhizal fungal species Glomus intraradices and Glomus claroideum by increasing
mitochondrial density and respiration (Besserer et al. 2006). Similarly, strigolactone
deficiency also reduced the germination of seeds of the parasitic plant Orobanche in wild and
strigolactone deficient mutants (ccd8, rms5-3) exudates (Gomez -Roldan et al. 2008). Plants
release strigolactones in very low concentration, and these were shown to be active at
dilutions as low as 10-3 M on G. rosea hyphae (Besserer et al. 2006).
The plant root colonisation experiment showed that colonisation by M. anisopliae was
significantly reduced in the strigolactone-deficient pea mutant rms5-3 when compared to both
the wild and rms4-1 varieties. This result was similar to observed mycorrhizal association in
pea roots (Gomez -Roldan et al. 2008), where the extent of root colonisation by the arbuscular
mycorrhizal fungus G. intraradices in ccd8 mutant was significantly lower than in wild peas,
and that the colonisation capacity of ccd8 mutant was restored by the supplementation of a
chemical analogue of strigolactone GR24.

143
Both the conidium germination and colonisation results presented here showed similar trends:
the wild variety supported both greater conidium germination and colonisation followed by
reduced germination and colonisation in rms4-1 and least in rms5-3. These trends were
supported by the strigolactone quantification data in wild variety, strigolactone overproducing
(rms4) and strigolactone deficient mutant ccd7 (rms5-3) determined by Foo et al. (2013), who
reported that the highest amounts of strigolactones were detected in both root exudates and
root tissues of wild variety of pea (12 and 10.2 ng/gFW respectively), followed by
strigolactone overproducing (rms4) pea (10.4 ng/gFW in root exudates and 9.5 ng/gFW in root
tissue). They found no strigolactone found in the deficient mutant rms5-3.
Foo et al. (2013) described three natural strigolactones, viz., orobanchol, fabacyl acetate and
orobanchyl acetate in the root tissue and root exudates of these wild variety and mutant-
varieties. They noted that the strigolactone ‘overproducing’ mutant rms4 is unable to perceive
strigolactones. They reported that colonisation of the pea roots by the arbuscular mycorrhizal
fungus species G. intraradices was reduced in the rms4 mutant compared to the wild- variety
pea, and suggested that this indicated that strigolactones must also be perceived by the plant in
order for root colonisation to proceed. These observations mirror those observed in this study,
and suggest that the responses to strigolactone in colonisation of the root by the Hypocrealean
fungus M. anisopliae may mirror those observed in G. intaradices.
This is the first study to demonstrate that strigolactones play a role in conidium germination
and early colonisation by Hypocrealean fungi in plant roots. Further study will be required to
test the cellular changes that occurred in Metarhizium in the presence of strigolactones to
understand the fungal response during the symbiotic process. This knowledge will contribute
to understanding the role of plant hormones in establishment of symbiotic fungi in the
rhizosphere and may provide pathways to enhance the use and establishment of Metarhizium
as a beneficial symbiont in crops.

144
6.5 Supplementary data
Table 6:1 Logistic regression analysis for plant variety and root exudate (RE)
concentration on conidium germination of Metarhizium
Coefficients:
Estimate Std. Error z value Pr(>|z|)
(Intercept) 0.22313 0.19150 1.165 0.244
Plant -0.54476 0.09763 -5.580 2.41e-08 ***
RE Conc. -0.52196 0.07126 -7.325 2.39e-13 ***
Plant: RE Conc. 0.02877 0.03663 0.785 0.432
---
Significance values: ‘***’ <0.001, ‘**’< 0.01, ‘*’ <0.05.
(Dispersion parameter for binomial distribution taken to be 1)
Null deviance: 446.12 on 74 degrees of freedom, Residual deviance: 46.59 on 71 degrees
of freedom, AIC: 349.07
Number of Fisher Scoring iterations: 4
Table 6:2 Regression analysis of percent conidium germination as a function of
concentration of root exudates of wild, rms4-1, rms5-3 pea plants.
Wild rms4-1 rms5-3
Best-fit values
Slope 0.2169 ± 0.008207 0.1671 ± 0.01148 0.1347 ± 0.01310
Y-intercept when X=0.0 11.69 ± 0.5039 9.560 ± 0.7048 7.973 ± 0.8046
X-intercept when Y=0.0 -53.91 -57.22 -59.17
1/slope 4.611 5.985 7.422
95% Confidence Intervals
Slope 0.1908 to 0.2430 0.1306 to 0.2036 0.09304 to 0.1764
Y-intercept when X=0.0 10.09 to 13.30 7.318 to 11.80 5.412 to 10.53
X-intercept when Y=0.0 -69.00 to -41.94 -88.82 to -36.58 -110.5 to -31.44
Goodness of Fit
R square 0.9957 0.986 0.9724
Sy.x 0.5992 0.838 0.9567
Is slope significantly non-zero?
F 698.2 211.9 105.7
DFn, DFd 1.000, 3.000 1.000, 3.000 1.000, 3.000
P value 0.0001 0.0007 0.002
Deviation from zero? Significant Significant Significant
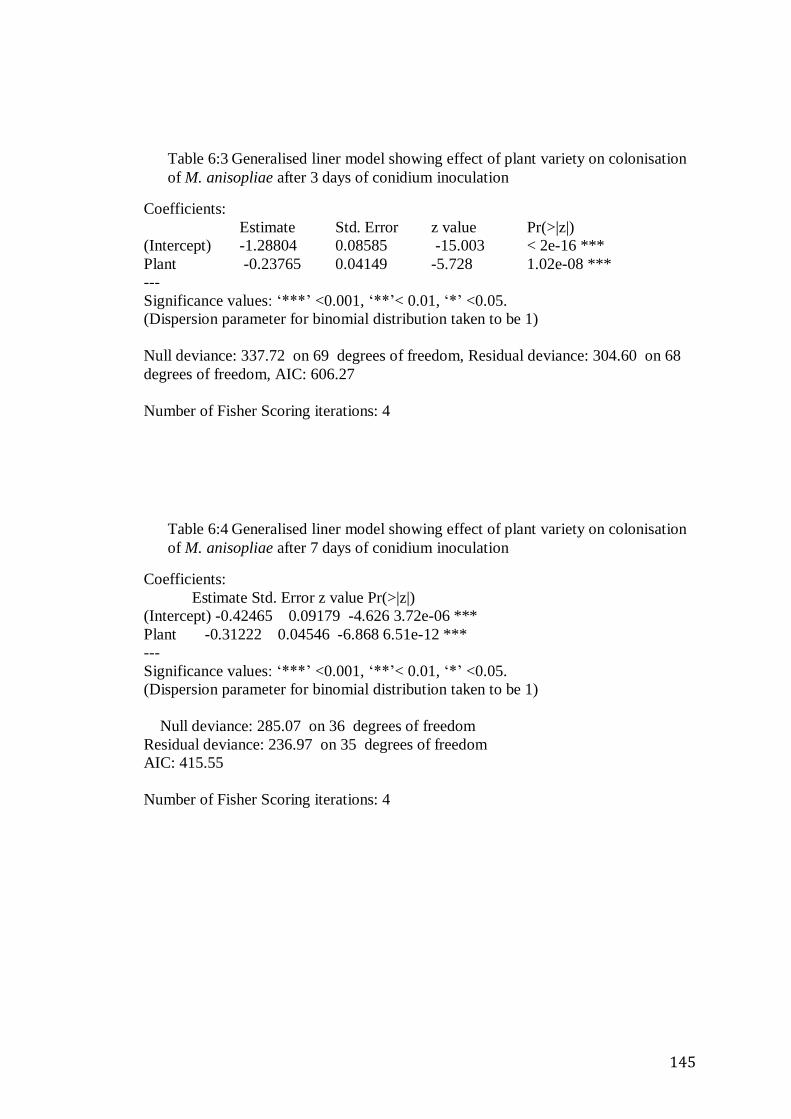
145
Table 6:3 Generalised liner model showing effect of plant variety on colonisation
of M. anisopliae after 3 days of conidium inoculation
Coefficients:
Estimate Std. Error z value Pr(>|z|)
(Intercept) -1.28804 0.08585 -15.003 < 2e-16 ***
Plant -0.23765 0.04149 -5.728 1.02e-08 ***
---
Significance values: ‘***’ <0.001, ‘**’< 0.01, ‘*’ <0.05.
(Dispersion parameter for binomial distribution taken to be 1)
Null deviance: 337.72 on 69 degrees of freedom, Residual deviance: 304.60 on 68
degrees of freedom, AIC: 606.27
Number of Fisher Scoring iterations: 4
Table 6:4 Generalised liner model showing effect of plant variety on colonisation
of M. anisopliae after 7 days of conidium inoculation
Coefficients:
Estimate Std. Error z value Pr(>|z|)
(Intercept) -0.42465 0.09179 -4.626 3.72e-06 ***
Plant -0.31222 0.04546 -6.868 6.51e-12 ***
---
Significance values: ‘***’ <0.001, ‘**’< 0.01, ‘*’ <0.05.
(Dispersion parameter for binomial distribution taken to be 1)
Null deviance: 285.07 on 36 degrees of freedom
Residual deviance: 236.97 on 35 degrees of freedom
AIC: 415.55
Number of Fisher Scoring iterations: 4

146
Chapter 7 : Conclusions

147
7.1 Key findings
The species of anamorphic fungal genus Metarhizium have been used as bio-
pesticides against insect pests and replicate as saprophytes in soil and as components
of the rhizospheric microbiome. Establishment of Metarhizium in a symbiotic
association with plants can in increased nutrient uptake and thus greater plant growth,
resistance to infection and protection from plant herbivores (insect pests). However,
inconsistent and variable results were observed in field trial limits the application of
Metarhizium in the large-scale application as biological control agent.
Recent studies showed that associations with plants are as important role in the
evolution and divergence of these species. The application of Metarhizium as
rhizospheric inocula may be improved through increased understanding of the
evolution and functional ecology of Metarhizium species with plant hosts
The aim of this thesis is to improve the understanding the cryptic diversity and
population structure of naturally occurring species of Metarhizium in Australian’s
ecosystems, including soil factors that may affect the distribution of the species,
association with agricultural practices and crops, the role of plant signals in
establishment in the rhizosphere. Several studies were conducted to fulfil the research
aims. The results of these studies are presented in Chapter 3, Chapter 4, Chapter 5 and
Chapter 6.
Chapter 3
Strains of Metarhizium were isolated from soil samples from different crops (maize,
pulses) and ecotypes (forest, grassland and agricultural crops) at three locations of
148
Queensland. Metarhizium species were found to be widely distributed in Queensland
soils, and more frequently isolated from soil in field crops, which are regularly
disturbed by ploughing, than semi-disturbed grassland or undisturbed natural forest, a
pattern similar to that observed also observed in Canada, Finland, the Netherlands and
China (Bidochka et al. 1998, Vanninen 1996, Steenberg, 1995, Meyling and
Eilenberg, 2007). Agricultural practice such as tillage operation might increase the
dispersion of Metarhizium propagules, which favour higher occurrence of
Metarhizium populations in agricultural soils (Kepler et. al. 2015), or from other
factors associated with agricultural practice such as use of fertilisers or crop rotations.
Multilocus phylogenetic analysis using nuclear markers 5’-TEF and MzIGS3 on the
Australian isolates was found to give good resolution of clades within the genus. Two
new clades, provisionally named M. indet.1 and M. indet.2 were identified in a cluster
of clades related to M. pingshaense. The internationally-recognised species M.
robertsii, M. pingshaense and M. anisopliae were also found in the Australian
samples. Species recognition using a phylogenetic approach has been increasingly
used to differentiate cryptic fungi with unknown sexual reproductive stages (Taylor et
al., 2000, Douhan et al., 2008).
This study also observed strong genetic differentiation and gene flow between the
species of Metarhizium, but the gene flow was not restricted by the geographical
separation. This is particularly important to assessing risk of unwanted genetic
contamination of indigenous populations by commercial Metarhizium isolates in an
ecosystem.
These results suggest that a number of species of fungi not found elsewhere in the
world may be present in Australia. It also facilitates the import of Metarhizium for use

149
in biocontrol programs in Australia by confirming the presence of M. robertsii and M.
anisopliae, which have been developed as commercial biopesticides overseas
(Hauxwell et al 2010).
The association of Metarhizium spp. with plant and ecotype is discussed in Chapter 4.
Chapter 4
The effect of ecological location, ecotypes, soil properties and soil components on
occurrence of Metarhizium species was investigated. M. robertsii was to be present in
all locations, predominantly in legume and forest but also in grassland and maize
fields. M. anisopliae and M. pingshaense were also observed in legume and forest
soils. In contrast, M. indet.1 was predominantly found in maize fields.
Habitat preference of Metarhizium species has been observed in multiple studies.
“Cold active’ M. brunneum and “heat active” M. robertsii found to associate with
different ecotypes: forest and agricultural fields, respectively (Bidochka et al., 2001,
Nishi et al., 2013). Similar ecological associations of M. brunneum with forest and M.
robertsii with agricultural fields were also observed in Russia (Kryukov et al., 2017).
In Japan, M. pingshaense was frequently isolated from both agricultural and forest
habitat, but M. brunneum and M. pemphigi were more abundant in forest habitat
(Nishi et al., 2013). In contrast, M. brunneum was found to be the dominant species in
agricultural soils in Denmark (Steinwender et al., 2014). Thus, some species appear to
have no strong association with a particular ecotype, but some species of Metarhizium
show some associations, particularly between forest (M. brunneum) and cropped soils
(M. robertsii), though this may vary in different studies.

150
The soil analysis and correlation studies showed that M. anisopliae and M. robertsii
are associated with higher nitrogen and carbon contents in soil of legume field and
forest. In contrast, M. indet.1 was associated with lower nitrogen and carbon contents
in soil of maize and grassland. Both nitrogen and carbon are important for
Metarhizium nutrition and may influence establishment of symbiotic relationship with
plants, where Metarhizium supplies insect-derived nitrogen to the plant in exchange
for plant-derived carbohydrates (Behie et al., 2017, Behie et al., 2012). Further study
on rhizospheric competence and capacity of the fungal species to persist in different
soils, particularly in association with crops such as maize, might help to identify more
detailed factors to enhance the use of Hypocrealean fungi as root inoculants.
Our study also demonstrated that M. robertsii and Metarhizium indet. 1 were more
abundant in iron-rich soils. M. brunneum has been found to solubilise iron and
increased its availability for plant uptake in iron-poor calcareous and sandy soils
(Raya–Diaz, et al., 2017). The impact of iron availability on persistence and relative
solubilisation of iron by M. robertsii and Metarhizium indet. 1 requires further study.
In summary, M. indet.1 was found associated with disturbed soils with low N and C
contents, and with high iron content. This suggests that there is potential to select
fungal species more able to persist and colonise the rhizosphere in soils that may be
less-favourable to persistence of other species of the fungus.
Chapter 5
This chapter evaluated the association of the Australian isolates of Metarhizium with
two different of agricultural crops: legumes (a Eudicot) and maize (a Monocot). The
results showed that M. robertsii, M. pingshaense and M. anisopliae were abundant in
soil from legume crops, whereas M. indet.1 and M. indet.2 were only observed in soil

151
from maize crops. Minimum gene flow was also observed between isolates from the
two crop types. Crop-specific association of Metarhizium species has also been
reported in the USA, where M. brunneum was found strongly associated with
blueberry and strawberry (Fisher et al. 2011).
Laboratory assays with selected isolates in maize and pea showed that root
colonisation was significantly higher in pea than in legume for most species of the
fungus, irrespective of their crop soil from which they were isolation (maize or
legume fields). The exception was isolates of M. indet. 1 which were isolated from
maize field and showed significantly higher colonisation in maize roots.
Little is known about the factors governing local adaptation of Metarhizium, though
rhizosphere associations are reported to stabilize Metarhizium population through
beneficial mutations (Wang et. al. 2011). However, this is the first study to report
crop-specific associations of species of Metarhizium with monocot and Eudicot crops,
and particularly with two crops of global significance (maize and legume).
Chapter 6
Plant hormones play a significant role in establishment of fungi in symbiotic
relationships with plants (Walker et al., 2004).
The role of plant hormone strigolactones on conidium germination and root
colonisation by M. anisopliae in pea (Pisum sativum L.) roots was examined using an
indirect assay using wild type and strigolactone-expression mutants of the pea. The
results suggest that strigolactone enhances conidium germination and early
colonisation of pea roots by Metarhizium. This finding was consistent with observed
mycorrhizal association in pea roots (Gomez -Roldan et al. 2008), where the extent of

152
root colonisation by the arbuscular mycorrhizal fungus G. intraradices in
strigolactone deficient mutant ccd8 pea plants was significantly lower than in wild
peas. This is the first study to suggest that strigolactones may play a role in both
conidium germination and early colonisation of plant roots by Hypocrealean fungi.
This knowledge suggests additional screens to select isolates or species of
Hypocrealean fungi to enhance beneficial colonisation of crops with different levels
of strigolactone expression.
7.2 Future directions
This research leads to the following suggestions:
1. The gene flow estimate (Fst value) showed gene flow between the Metarhizium
populations of different locations and ecotype. This study did not explain the possible
cause of gene flow. As sexual reproduction is not yet observed in Metarhizium
elsewhere, further examination of the reproduction and gene flow in Australian
Metarhizium isolates is necessary.
2. It has been reported that plant attachment factor Metarhizium adhesion-like protein-
2 (MAD2) is a diverse region in Metarhizium genome responsible for plant
attachment (Wyrebek and Bidochka, 2013). Phylogenetic and sequence-diversity
analysis of MAD2 gene of the studied isolates might give more clear insight in the
mechanisms of association of Metarhizium species with different crops, particularly
legumes and cereals.
3. Habitat-association model should be tested to examine for biogeographical patterns
for Metarhizium isolates in a wide range of habitats and further refine analysis of the
soil and environmental factors responsible for Metarhizium species distribution in
Australian soils.

153
4. Growth hormones produced by the endophytic fungus is an important factor for
plant root colonisation by symbiotic fungi. Further study should be conducted to
identify any secretion of growth hormone by Metarhizium during the root colonisation
process.
Finally, the research studies presented in thesis generate important knowledge in
Metarhizium research, advancing the knowledge of naturally-occurring Metarhizium
species in Australia, particularly in agricultural crops, increase the understanding of
ecological factors governing Metarhizium species distribution, and suggesting further
avenues to investigate the role of plant-fungal signals in rhizosphere colonisation.

154
References
Akiyama, K., & Hayashi, H. (2006). Strigolactones: Chemical signals in fungal
symbionts and parasitic weeds in plant roots. Annals of Botany, 97, 925-931.
Akiyama, K., Matsuzaki, K., & Hayashi, H. (2005). Plant sesquiterpenes induce
hyphal branching in arbuscular mycorrhizal fungi. Nature, 435, 824–827.
Altschup, S. F., Gish, W., Miller, W., Myers, E. W. & Lipman, D. J. (1990). Basic
local alignment search tool. Journal of Molecular Biology, 5, 403–410.
APVMA. (2014, April 23). Cost Recovery Arrangements. Retrieved from
http://www.apvma.gov.au/about/work/cost_recovery.php
Bais, H. P., Loyola-Vargas, V. M., Flores, H. E., & Vivanco, J. M. (2001). Root
specific metabolism: the biology and biochemistry of underground organs. In vitro
Cellular & Developmental Biology- Plant, 37, 730–741.
Bandelt, H. J., Forster, P., & Rohl, A. (1999). Median-joining networks for inferring
intraspecific phylogenies. Molecular Biology and Evolution, 16, 37–48.
Behie, S. W., Moreira, C. C., Sementchoukova, I., Barelli, L., Zelisko, P. M., &
Bidochka, M. J. (2017). Carbon translocation from a plant to an insect-pathogenic
endophytic fungus. Nature Communications, 8, 14245.
Behie, S. W., Zelisko, P. M., & Bidochka, M. J. (2012). Endophytic insect-parasitic
fungi translocate nitrogen directly from insects to plants. Science, 336, 1576–
1577.

155
Besserer, A., Puech-Pagès, V., Kiefer, P., Gomez-Roldan, V., Jauneau, A., Roy, S.,
Séjalon-Delmas, N. (2006). Strigolactones stimulate arbuscular mycorrhizal fungi
by activating mitochondria. PLoS Biology, 4(7), e226.
Bidochka, M. J. & Hajek, A. E. (1998) A nonpermissive entomophthoralean fungal
infection increases activation of insect prophenoloxidase. Journal of Invertebrate
Pathology, 72(3), 231–238.
Bidochka, M. J., Kamp, A. M., Lavender, T. M., Dekoning, J. & De Croos, J. N. A.
(2001). Habitat association in two genetic groups of the insect-pathogenic
fungus Metarhizium anisopliae: uncovering cryptic species? Applied
Environmental Microbiology, 67, 1335–1342.
Bidochka, M. J., Kasperski, J. E. & Wild, G. A. M. (1998). Occurrence of the
entomopathogenic fungi Metarhizium anisopliae and Beauveria bassiana in soils
from temperate and near-northern habitats. Canadian Journal of Botany, 76,
1198–1204.
Bischoff, J. F., Rehner, S. A., & Humber, R. A. (2009). A multilocus phylogeny of
the Metarhizium anisopliae lineage. Mycologia, 101, 512–530.
Boyer, F. D., de Saint Germain, A., Pouvreau, J. B., Clave, G., Pillot, J. P., Roux A.,
et al. (2014). New strigolactone analogs as plant hormones with low activities in
the rhizosphere. Molecular Plant, 7, 675–690.
Bruck, D. J. (2005). Ecology of Metarhizium anisopliae in soilless potting media and
the rhizosphere: Implications for pest management. Biological Control, 32,
155-163.
156
Bruck, D. J. (2010). Fungal entomopathogens in the rhizosphere. BioControl, 55(1),
103–112.
Casida, J. E., & Quistad, G. B. (1998). Golden age of insecticide research: past,
present, or future? Annual Review of Entomology, 43, 1–16.
Castro, T., Mayerhofer, J., Enkerli, J., Eilenberg, J., Meyling, N.V., Moral, R. A., &
Demétrio, C. G. B. (2016). Persistence of Brazilian isolates of the
entomopathogenic fungi Metarhizium anisopliae and M. robertsii in
strawberry crop soil after soil drench application. Agriculture, Ecosystem and
Environment, 233, 361–369.
Chandler, D., Bailey, A. S., Tatchell, G. M., Davidson, G., Greaves, J., & Grant, W.
P. (2011). The development, regulation and use of biopesticides for
integrated pest management. Philosophical transactions of the Royal Society
of London. Series B, Biological Sciences, 366(1573), 1987–1998.
Chandler, D., Hay, D., & Reid, A. P. (1997). Sampling and occurrence of
entomopathogenic fungi and nematodes in UK soils. Applied Soil Ecology, 5:
133–141.
Chandler, D., Mietkiewski, R. T., Davidson, G., & Pell, J. K. (1998). Impact of
habitat type and pesticide application on the natural occurrence of
entomopathogenic fungi in UK soils. OILB wprs Bulletin, 21, 81–84.
Clerk, G. C. (1969). Influence of soil extracts on the germination of conidia of the
fungi Beauveria bassiana and Paecilomyces farinosus. Journal of Invertebrate
Pathology, 13, 120-124.
Contreras-Cornejo, H. A., Macías-Rodríguez, L., Cortés-Penagos, C., & López-Bucio,
J. (2009). Trichoderma virens, a plant beneficial fungus, enhances biomass
157
production and promotes lateral root growth through an auxin-dependent
mechanism in Arabidopsis. Plant Physiology, 149(3), 1579–1592.
Copping, L. G. (Editor). (2004). The manual of biocontrol agents. 3rd ed. Alton:
British Crop Protection Council, 702.
Dara, S. (2015). Soil application of the entomopathogenic fungus Metarhizium
brunneum protects strawberry plants from spider mite damage. Retrieved from
http://ucanr.edu/blogs/blogcore/postdetail.cfm?postnum=16821
Davies, P. J. (2010). The Plant Hormones: Their Nature, Occurrence, and Functions.
In Davies, P. J.(Ed.). Plant hormones (pp. 1-15). Springer Netherlands.
de-Bruijn, F. J. (2013). Strigolactone: crucial cues in the rhizosphere. In: de Bruijn, F.
J. (ed.). Molecular microbial ecology of the rhizosphere (pp. 381-389). New
Jersey: John Wiley & Sons. Inc.
Dorta, B., Ertola, R.J., & Arcas, J. (1996). Characterization of growth and sporulation
of Metarhizium anisopliae in solid-substrate fermentation. Enzyme and
Microbial Technology 19, 434-439.
Dotaona, R., Wilson, B. A. L., Ash, G. J., Holloway, J., & Stevens, M. M. (2017).
Sweet potato weevil, Cylas formicarius (Fab.) (Coleoptera: Brentidae) avoids its
host plant when a virulent Metarhizium anisopliae isolate is present. Journal of
Invertebrate Pathology, 148, 67-72.
Douhan, G. W., Smith, M. E., Huyrn, K. L., Westbrook, A, Beerli, P., & Fisher, A. J.
(2008). Multigene analysis suggests ecological speciation in the fungal pathogen
Claviceps purpurea. Molecular Ecology, 17(9), 2276–2286.
Driver, F., Milner, R. J., & Trueman, J. W. H. (2000). A taxonomic revision of
Metarhizium based on a phylogenetic analysis of rDNA sequence data.
Mycological Research, 104, 134–150.

158
Duncan, D. B. (1955). "Multiple range and multiple F tests". Biometrics. 11, 1–42.
Elena, G. J., Beatriz, P. J., Alejandro, P. & E-Lecuona, R. (2011). Metarhizium
anisopliae (Metschnikoff) Sorokin promotes growth and has endophytic
activity in tomato plants. Advances in Biological Research, 5(1), 22–27.
Faria, M. R. De, & Wraight, S. P. (2007). Mycoinsecticides and Mycoacaricides: A
comprehensive list with worldwide coverage and international classification of
formulation types. Biological Control, 43(3), 237–256.
Fisher, J. J., Rehner, S. A., & Bruck, D. J. (2011). Diversity of rhizosphere associated
entomopathogenic fungi of perennial herbs, shrubs and coniferous trees.
Journal of Invertebrate Pathology, 106, 289-295.
Fitzpatrick, B. R., Lamb, D. W., & Mengersen, K. (2016). Ultrahigh Dimensional
Variable Selection for Interpolation of Point Referenced Spatial Data : A Digital
Soil Mapping Case Study. PLOS-one, 1-19. doi:10.1371/journal.pone.0162489
Foo, E. (2013). Auxin influences strigolactones in pea mycorrhizal symbiosis.
Journal of Plant Physiology, 170(5), 523–528. doi:10.1016/j.jplph.2012.11.002.
Foo, E., Yoneyama, K., Hugill, C. J., Quittenden, L. J., & Reid, J. B. (2013).
Strigolactones and the regulation of pea symbioses in response to nitrate and
phosphate deficiency. Molecular Plant, 6(1), 76–87.
Gao, Q., Jin, K., Ying, S-H., Zhang, Y., Xiao, G., Shang, Y.,…Wang, C. (2011).
Genome sequencing and comparative transcriptomics of the model
entomopathogenic fungi Metarhizium anisopliae and M. acridum. PLoS
Genetics, 7(1), e1001264. doi: 10.1371/journal.pgen.1001264

159
Glare, T. R, Milner, R. J. & Beaton, C. D. (1996). Variation in Metarhizium, a genus
of fungal pathogens attacking Orthoptera: is phialide morphology a useful
taxonomic criterion? Journal of Orthoptera Research, 5, 19-27.
Goettel, M. S., Poprawski, T. J., Vandenberg, J. D., Li, Z., & Roberts, D. W. (1990).
Safety to nontarget invertebrates of fungal biocontrol agents. In: Laird, M.,
Lacey, L. A, Davidson, E.W. (eds). Safety of microbial insecticides (pp. 209-
232). Boca Raton, CA: CRC Press.
Gomez-roldan, V., Bécard, G., & Puech-pagés, V. (2007). Strigolactones, promising
plant signal. Plant Signaling and Behavior, (June), 163–164.
doi:10.1371/journal.pbio.0040226
Harman, G. E. (2006). Overview of mechanisms and uses of Trichoderma spp.
Phytopathology, 96, 190–194.
Harrison, M. J. (2005). Signaling in the arbuscular mycorrhizal symbiosis. Annual
Review of Microbiology, 59, 19–42.
Hauxwell, C., Tichon, M., Buerger, P., & Anderson, S. (2010). Australia. In: Kabaluk,
T. J.., Svircev, A. M., Goettel, M. S., & Woo, S. G. (eds). ‘The Use and
Regulation of Microbial Pesticides in Representative Jurisdictions Worldwide’
(pp- 80-88). International Organization of Biological Control (IOBC).
Hawke, S. (2010). Radio program, ABC News, Australia, Wednesday, October 13,
12:14:00
Hermosa, R., Viterbo, A., Chet, I., & Monte, E. (2012). Plant-beneficial effects of
Trichoderma and of its genes. Microbiology, 158(1), 17–25.

160
Hewitt, E. J. (1966). Sand and water culture methods used in the study of plant
nutrition. 2nd edn. London: Commonwealth Agricultural Bureau.
Hu, G. & St. Leger, R. J. (2002). Field studies using a recombinant mycoinsecticide
(Metarhizium anisopliae) reveal that it is rhizosphere competent. Applied and
Environmental Microbiology, 68(12),6383-6387.
Hudson, R. R. (2000). A new statistic for detecting genetic differentiation. Genetics,
155, 2011–2014.
Hudson, R. R., Boos, D. D., Kaplan, N. L. (1992). A statistical test for detecting
geographic subdivision. Molecular Biology, 9, 138–151.
Hudson, R.R., Slatkin, M., Maddison, W. P. (1992). Estimations of levels of gene
flow from DNA sequence data. Genetics, 132, 583–589.
Huelsenbeck, J. P., & Ronquist, F. (2001). MRBAYES: Bayesian inference of
phylogeny. Bioinformatics 17, 754-755.
Issaly, N., Chauveau, H., & Aglevor, F. (2005). Influence of nutrient, pH and
dissolved oxygen on the production of Metarhizium flavoviride Mf189
blastospores in submerged batch culture. Process Biochemistry, 40, 1425–1431.
Jaber, L. R, & Ownley, B. H. (2017). Can we use entomopathogenic fungi as
endophytes for dual biological control of insect pests and plant pathogens?
Biological Control. 107, 50-59.
Jaber, L. R., & Enkerli, J. (2016). Effect of seed treatment duration on growth and
colonization of Vicia faba by endophytic Beauveria bassiana and Metarhizium
brunneum, Biological Control, 103,187-195.
Jameson, P. (2000). Cytokinins and auxins in plant-pathogen interactions – An
overview. Plant Growth Regulation. 32, 369–380.

161
Kabaluk, T., & Gazdik, K. (2005). Directory of microbial pesticides for agricultural
crops in OECD countries. Agriculture and Agri-Food Canada, 242. Available:
http://www.agr.gc.ca/env/pest/pub/pdf/micro_e.pdf.
Kamat, M. N., Patel, M. K. & Dhande, G. W. (1952). Occurrence of the green
muscardine fungus on Pyrilla species in Bombay. Current Science, 21, 317.
Katoh, K., & Standley, D. M. (2013). MAFFT multiple sequence alignment software
version 7: improvements in performance and usability. Molecular Biology and
Evolution, 30(4), 772–780.
Keller, S., & Zimmerman, G. (1989). Mycopathogens of soil insects. In: Wilding, N.,
Collins, N. M., Hammond, P. M., & Webber., J. F. (eds), Insect–Fungus
Interactions. Academic Press, London, pp. 239–270.
Keller, S., Kessler, P., & Schweizer, C. (2003). Distribution of insect pathogenic soil
fungi in Switzerland with special reference to Beauveria brongniartii and
Metarhizium anisopliae. Biocontrol, 48, 307–319.
Kepler, R. M., & Rehner, S. A. (2013). Genome-assisted development of nuclear
intergenic sequence markers for entomopathogenic fungi of the Metarhizium
anisopliae species complex. Molecular Ecology Resources, 13(2), 210–217.
Kepler, R. M., Humber, R. A, Bischoff, J. F., & Rehner, S. A. (2014). Clarification of
generic and species boundaries for Metarhizium and related fungi through
multigene phylogenetics. Mycologia, 106(4), 811–829.
Kepler, R. M., Ugine, T. A, Maul, J. E., Cavigelli, M. A, & Rehner, S. A. (2015).
Community composition and population genetics of insect pathogenic fungi in
the genus Metarhizium from soils of a long-term agricultural research system.
Environmental Microbiology, 17(8), 2791–2804.

162
Keyser, C. A., Thorup-Kristensen, K., & Meyling, N. V. (2014). Metarhizium seed
treatment mediates fungal dispersal via roots and induces infections in insects.
Fungal Ecology, 11, 122–131.
Khan, A.L., Hamayun, M., Khan, S.A., Kang, S.M., Shinwari, Z.K., Kamran, M.,
Rehman, S. U., Kim, J. G., Lee, I. J. (2012). Pure culture of Metarhizium
anisopliae LHL07 reprograms soybean to higher growth and mitigates salt
stress. Journal of Microbiology and Biotechnology, 28, 1483–1494.
King, A. J., Freeman, K. R., McCormick, K. F., Lynch, R. C., Lozupone, C., Knight,
R., & Schmidt, S. K. (2010). Biogeography and habitat modelling of high-alpine
bacteria. Nature Communications, 1(5), 1–6. doi:10.1038/ncomms1055
Knight, K. (2013. March 01). Springfield plateau. Retrieved from
http://springfieldmn.blogspot.com.au/2013/03/plant-fungus-recycles-
insects.html
Kohlen, W., Charnikhova, T., Liu, Q., Bours, R., Domagalska, M. a, Beguerie, S.,
Verstappen, F.,…Ruyter-Spira, C. (2011). Strigolactones are transported
through the xylem and play a key role in shoot architectural response to
phosphate deficiency in nonarbuscular mycorrhizal host Arabidopsis. Plant
Physiology, 155(2), 974–987.
Kraigher, H., Grayling A., Wang, T. L. & Hanke, D. E. (1991). Cytokinin production
by two ectomycorrhizal fungi in liquid culture. Phytochemistry, 30, 2249–2254.
Kryukov, V., Yaroslavtseva, O., Tyurin, M., Akhanaev, Y., Elisaphenko, E., Wen, T-
C, Tomilova, O., Tokarev, Y., & Glupov, V. (2017). Ecological preferences of
Metarhizium spp. from Russia and neighboring territories and their activity

163
against Colorado potato beetle larvae. Journal of Invertebrate Pathology, 149,
1-7.
Lacey, L. A., Grzywacz, D., Shapiro-Ilan, D. I., Frutos, R., Brownbridge, M., &
Goettel, M.S. (2015). Insect pathogens as biological control agents: back to
the future. Journal of Invertebrate Pathology,132, 1–41
Lacey, L.A., & Goettel, M. S. (1995). Current developments in microbialcontrol of
insect pests and prospects for the early 21st century. Entomophaga, 40 (1), 1–
27.
Latch, G. C. M. & Fallon, R. E. (1976). Studies on the use of Metarhizium anisopliae
to control Oryctes rhinoceros. Entomophaga, 21, 39-48.
Liao, X., Fang, W., Lin, L., Lu, H.-L., & St. Leger, R. J. (2013). Metarhizium
robertsii produces an extracellular invertase (MrINV) that plays a pivotal role
in rhizospheric interactions and root colonization. PloS One, 8(10), e78118.
doi:10.1371/journal.pone.0078118.
Lingg, A. J., & Donaldson, M. D. (1981). Biotic and abiotic factors affecting stability
of Beauveria bassiana in soils. Journal of Invertebrate Pathology, 38, 191-200.
Lomer, C. J., Bateman, R. P., Johnson, D. L., Langewald, J., & Thomas, M. (2001).
Biological control of locusts and grasshoppers. Annual Review of Entomology,
46(1), 667–702.
Lopes, R. B., Faria, M., Souza, D. A., Bloch, C., Silva, L. P. & Humber, R. A. (2014).
MALDI-TOF mass spectrometry applied to identifying species of insect-
pathogenic fungi from the Metarhizium anisopliae complex. Mycologia, 106,
865–878.
Lopez-Raez, J. A., & Pozo, M. J. (2013). Chemical signalling in the arbuscular
mychorrhizal symbiosis: biotechnological applications. In: Aroca, R. (ed.).

164
Symbiotic endophytes (pp. 215-232). Heidelberg New York Dordrecht London:
Springer.
Lozano-Tovar, M. D., Garrido-Jurado, I., Quesada-Moraga, E., Raya-Ortega, M. C.,
& Trapero-Casas, A. (2017). Metarhizium brunneum and Beauveria bassiana
release secondary metabolites with antagonistic activity against Verticillium
dahliae and Phytophthora megasperma olive pathogens. Crop Protection,
100,186-195.
Ludwig-Muller, J., & Guther, M. (2007). Auxins as signals in arbuscular mycorrhiza
formation. Plant Signaling & Behaviour, 2(3), 194–196.
Mallet, J. (1989). The Evolution of insecticide resistance: have the insects won? Tree,
4(11), 336-340.
Mayerhofer, J., Lutz, A., Widmer, F., Rehner, S. A., Leuchtmann, A., & Enkerli, J.
(2015). Multiplexed microsatellite markers for seven Metarhizium species.
Journal Invertebrate Pathology, 132, 132–134.
McNeill, J., Buck, W. R., Demoulin, V., Greuter, W., Hawkworth, D. L., Herendeen,
P. S., Knapp, S., Marhold, K., Prado, J., Prud’homme van Reine, W. F., Smith, G.
F., Wiersema, J. H., & Turl, N. J. (2012). International Botanical Congress.
International code of nomenclature for algae, fungi and plants (Melbourne code);
adopted by the 18th International Botanical Congress, Melbourne, Australia, Jul
2011. Koenigstein, Germany: Koeltz Scientific Books.
Meyling, N. V., & Eilenberg, J. (2006). Occurrence and distribution of soil borne
entomopathogenic fungi within a single organic agroecosystem. Agriculture
Ecosystems and Environment, 113, 336–341.
Meyling, N. V., & Eilenberg, J. (2007). Ecology of the entomopathogenic fungi
Beauveria bassiana and Metarhizium anisopliae in temperate agroecosystems:
Potential for conservation biological control. Biological Control, 43(2), 145–
155.

165
Meyling, N. V., Lubeck, M., Buckley, E.P., Eilenberg, J., & Rehner, S.A. (2009).
Community composition, host range and genetic structure of the fungal
entomopathogen Beauveria in adjoining agricultural and semi-natural habitats.
Molecular Ecology, 18, 1282–1293.
Nagahashi, G. & Douds, D. D. (2000). Partial separation of root exudate components
and their effects upon the growth of germinated spores of AM fungi. Mycological
Research, 104, 453-1464.
NG, P. P., Cole, P. A. L., Jameson, J. E. & Mcwha, J. A. (1982). Cytokinin
production by ectomycorrhizal fungi. New Phytologist, 91, 57-62.
Nishi, O., Iiyama, K., Yasunaga-Aoki, C., & Shimizu, S. (2013). Comparison of the
germination rates of Metarhizium spp. Conidia from Japan at high and low
temperatures. Letters in Applied Microbiology, 57, 554–560.
Oldroyd, G. E. D. (2013). Speak, friend, and enter: signalling systems that promote
beneficial symbiotic associations in plants. Nature Reviews Microbiology,
11(4), 252–263. doi:10.1038/nrmicro2990
Ownley, B., Gwinn, K., & Vega, F. (2010). Endophytic fungal entomopathogens with
activity against plant pathogens: ecology and evolution. BioControl, 55, 113-128.
Paradis, E., Claude, J. & Strimmer, K. (2004). APE: analyses of phylogenetics and
evolution in R language. Bioinformatics, 20, 289-290.
Parsa, S., Ortiz, V. & Vega, F. E. (2013). Establishing fungal entomopathogens as
endophytes: Towards Endophytic Biological Control. Journal of Visualized
Experiments, 74, 1–5.
Parsa, S., Ortiz, V., Gómez-Jiménez, M. I. Kramer, M., & Vega, F. E. (2018). Root
environment is a key determinant of fungal entomopathogen endophytism

166
following seed treatment in the common bean, Phaseolus vulgaris. Biological
Control,116,74-81,
Pattemore, J. A., Hane, J. K., Williams, A. H., Wilson, B. A., Stodart, B. J., & Ash, G.
J. (2014). The genome sequence of the biocontrol fungus Metarhizium
anisopliae and comparative genomics of Metarhizium species. BMC
Genomics, 15(1), 660.
Peters & Laboski. (2013). Sampling soils for testing. University of Wisconsin System
Board of Regents and University of Wisconsin-Extension, Cooperative
Extension.
Prade, R. A., Ayoubi, P., Zhan, D., & Mort, A. J. (1999). Pectins, pectinases and
plant-microbe interactions. Biotechnology and Genetic Engineering Reviews,
16, 361-392.
Quesada-Moraga, E., Navas-Cortés, J. A., Maranhao, E. A. A., Ortiz-Urquiza, A., &
Santiago-Alvarez, C. (2007). Factors affecting the occurrence and distribution
of entomopathogenic fungi in natural and cultivated soils. Mycological
Research, 111, 947–966.
R Core Team (2016). R: A language and environment for statistical computing. R
Foundation for Statistical Computing, Vienna, Austria. URL https://www.R-
project.org/.
Rath, A. C., Koen, T. B., & Yip, H. Y. (1992). The influence of abiotic factors on the
distribution and abundance of Metarhizium anisopliae in Tasmanian pasture
soils. Mycological Research, 96, 378–384.
167
Raya–Diaz, S., Quesada–Moraga, E., Barron, V., del-Campillo, M. C., Sanchez–
Rodriguez, A. R. (2017). Redefining the dose of the entomopathogenic
fungus Metarhizium brunneum (Ascomycota, Hypocreales) to increase Fe
bioavailability and promote plant growth in calcareous and sandy soils. Plant
and Soil, 418, 387–404.
Rayment, G. E & Higginson, F. R. (1992). Australian laboratory handbook of soil and
water chemical methods. Inkata Press. Australian Soil and Land Survey
Handbook, volume 3. P 38-39.
Rezende, J. M., Zanardo, A. B. R., da Silva Lopes, M., Delalibera, I., & Rehner, S. A.
(2015). Phylogenetic diversity of Brazilian Metarhizium associated with
sugarcane agriculture. BioControl, 60(4), 495–505.
Roberts, D. W., & Humber, R.A. (1981). Entomogenous fungi. In: Cole GT, Kendrick
B, (Eds.), Biology of Conidial Fungi. Academic Press, New York, pp.201-236.
Ronquist, F., & Huelsenbeck, J. P. (2003). MRBAYES 3: Bayesian phylogenetic
inference under mixed models. Bioinformatics, 19, 1572-1574.
Rozas, J., Sanchez-De, I., Barrio, J.C., Messeguer, X., & Rozas, R. (2003). DnaSP,
DNA polymorphism analyses by the coalescent and other methods.
Bioinformatics, 19, 2496–2492.
Sasan, R. K. (2012). The analysis of Metarhizium robertsii potential as endophytic
plant root coloniser, plant growth enhancer and antagonist to bean root pathogen
Fusarium solani. Unpublished master's thesis. Brock University, St. Catharines,
Ontario, Canada.
Sasan, R. K., & Bidochka, M. J. (2012). The insect-pathogenic fungus Metarhizium
robertsii (Clavicipitaceae) is also an endophyte that stimulates plant root
development. American Journal of Botany, 99(1), 101–107.

168
Sasan, R.K., & Bidochka, M.J. (2013). Antagonism of the endophytic insect
pathogenic fungus Metarhizium robertsii against the bean plant pathogen
Fusarium solani f. sp. phaseoli. Canadian Journal of Plant Pathology. 35, 288–
293.
Schneider, S., Widmer, F., Jacot, K., Kölliker, R., & Enkerli, J. (2012). Spatial
distribution of Metarhizium clade 1 in agricultural landscapes with arable land
and different semi-natural habitats. Applied Soil Ecology, 52, 20–28.
doi:10.1016/j.apsoil.2011.10.007
Selosse, M. A., & Rousset, F. (2011). Evolution. The plant-fungal marketplace.
Science, 333 (6044), 828–829.
Singhal, N., Kumar, M., Kanaujia, P. K., & Virdi, J. S. (2015). MALDI-TOF mass
spectrometry: an emerging technology for microbial identification and
diagnosis. Frontier of Microbiology, 6, 791. doi: 10.3389/fmicb.2015.00791
St. Leger, R. J. (2008). Studies on adaptations of Metarhizium anisopliae to life in the
soil. Journal of Invertebrate Pathology, 98(3), 271-276.
St. Leger, R. J. & Screen, S. (2001). Prospects for strain improvement of fungal
pathogens of insects and weeds. In Fungal biocontrol agents: progress, problems
and potential, pp. 219-238. Edited by T. M. Butt, C. Jackson, and N. Morgan.
Wallingford, UK: CAB International.
Standards Association of Australia. (1990). Determination of moisture content of a
soil: Oven drying method (standard method). As 1289 B1.1-1997.
Steenberg, T. (1995). Natural occurrence of Beauveria bassiana (Bals.) Vuill. with
focus on infectivity to Sitona species and other insects in lucerne. Ph.D Thesis,
The Royal Veterinary and Agricultural University, Denmark.

169
Steinkellner, S., Lendzemo, V., Langer, I., Schweiger, P., Khaosaad, T., Toussaint, J-
P., & Vierheilig, H. (2007). Flavonoids and Strigolactones in Root Exudates as
Signals in Symbiotic and Pathogenic Plant-Fungus Interactions. Molecules,
12(7), 1290-1306.
Steinwender, B. M., Enkerli, J., Widmer, F., Eilenberg, J., Thorup-Kristensen, K., &
Meyling, N. V. (2014). Molecular diversity of the entomopathogenic fungal
Metarhizium community within an agroecosystem. Journal of Invertebrate
Pathology, 123, 6-12.
Stover, B.C., & Muller, K. F. (2010). TreeGraph 2: Combining and visualizing
evidence from different phylogenetic analyses. BMC Bioinformatics, 11,7.
Strane, S. (2014). Species composition and abundance of entomopathogenic
Metarhizium fungi in soils of a forest, pasture and agricultural field in Sweden.
MS Thesis, Swedish University of Agricultural Sciences, Sweden.
Strasser, H., Forer, A., & Schinner, F., (1996). Development of media for the
selective isolation and maintenance of virulence of Beauveria brongniartii. In:
Glare, T.R., Jackson, T.A. (Eds.), Microbial Control of Soil Dwelling Pests.
AgResearch, Lincoln, New Zealand, pp. 125e130.
Strasser, H., Vey, A., & Butt, T. M. (2010). "Are there any risks in using
entomopathogenic fungi for pest control, with particular reference to the
bioactive metabolites of Metarhizium, Tolypocladium and Beauveria species?’’.
Biocontrol Science and Technology. 10 (6), 717-735.
Sun, B.-D., & Liu, X.-Z. (2008). Occurrence and diversity of insect-associated fungi
in natural soils in China. Applied Soil Ecology, 39(1), 100–108.

170
Tatusova, T., Ciufo, S., Fedorov, B., O’Neill, K., & Tolstoy, I. (2014). RefSeq
microbial genomes database: new representation and annotation strategy.
Nucleic Acids Research, 42(Database issue), 553–559.
Taylor, J. W., Jacobson, D. J., Kroken, S., Kasuga, T., Geiser, D. M., Hibbett, D.
S., & Fisher, M. C. (2000). Phylogenetic species recognition and species
concepts in fungi. Fungal Genetics and Biology, 31, 21–32.
Thomas, M. B., & Read, A. F. (2007). Can fungal biopesticides control malaria?
Nature Reviews Microbiology, 5(5), 377–383. doi:10.1038/nrmicro1638
Tuininga, A. R., Miller, J. L., Morath, S. U., Daniels, T. J., Falco, C., Marchese, M.,
… Iii, K. C. S. (2010). Isolation of entomopathogenic fungi from soils and
Ixodes scapularis (Acari: Ixodidae) ticks: prevalence and methods. Journal of
Medical Entomology, 46(3), 557–565.
Tulloch, M. (1976). The genus Metarhizium. Transactions of the British Mycological
Society, 66, 407-411.
Va¨nninen, I. (1996). Distribution and occurrence of four entomopathogenic fungi in
Finland: effect of geographical location, habitat type and soil type. Mycological
Research, 100, 93–101.
Vanninen, I., Husberg, G. B., & Hokkanen, H. M. T. (1989). Occurrence of
entomopathogenic fungi and entomoparasitic nematodesin cultivated soils in
Finland. Acta Entomologica Fennica, 53, 65–71.
Vargas, W. A., Mandawe, J. C. & Kenerley, C. M. (2009). Plant-derived sucrose is a
key element in the symbiotic association between Trichoderma virens and maize
plants. Plant Physiology, 151, 792–808.

171
Veen, K. H. (1968). Recherches sur la maladie due a` Metarrhizium anisopliae chez
le criquet pe`lerin. Mededelingen Landbouwhogeschool Wageningen,
Nederland, 68, 1–117.
Viterbo, A., & Horwitz, B. A. (2010). Mycoparasitism. In: Borkovich, K. A. &
Ebbole, D. J. (eds). Cellular and Molecular Biology of Filamentous Fungi, vol.
42 (pp. 676–693). Washington: American Society for Microbiology.
Walker, T. S., Bais, H. P., Grotewold, E., & Vivanco, J. M. (2004). Root Exudation
and Rhizosphere Biology. Plant Physiology, 132, 144-151.
Walton, B. T., Guthrie, E. A. & Hoylman, A. M. (1994). Toxicant degradation in the
rhizosphere. In: Anderson, T. A. & Coats, J. R (eds). Bioremediation through
rhizosphere technology (pp.11-26). American Chemical Society.
Wang, C., & St. Leger, R. J. (2007). The MAD1 adhesin of Metarhizium anisopliae
links adhesion with blastospore production and virulence to insects, and the
MAD2 adhesin enables attachment to plants. Eukaryotic Cell, 6(5), 808–816.
Wang, S., O’Brien, T. R., Pava-Ripoll, M., & St Leger, R. J. (2011). Local adaptation
of an introduced transgenic insect fungal pathogen due to new beneficial
mutations. Proceedings of the National Academy of Sciences of the United
States of America, 108(51), 20449–20454. doi:10.1073/pnas.1113824108
Wraight, S. P., Jackson, M. A., & de-Kock, S. L. (2001). Production, stabilization and
formulation of fungal biocontrol agents. In: Butt, T. M., Jackson, C., Magan, N.
(eds). Fungi as biocontrol agents: progress, problems and potential (pp. 253-
287). Wallingford, UK: CABI International.

172
Wyrebek, M., & Bidochka, M. J. (2013). Variability in the insect and plant adhesins,
Mad1 and Mad2, within the fungal genus Metarhizium, suggests plant
adaptation as an evolutionary force. PloS One, 8(3), e59357.
Wyrebek, M., Huber, C., Sasan, R. K., & Bidochka, M. J. (2011). Three sympatrically
occurring species of Metarhizium show plant rhizosphere specificity.
Microbiology, 157(10), 2904–2911.
Xie, X., Yoneyama, K., & Yoneyama, K. 2010. The strigolactone story. Annual
Review of Phytopathology, 48, 93–117.
Zimmermann, G. (1993). The entomopathogenic fungus Metarhizium anisopliae and
its potential as a biocontrol agent. Pesticide Science, 37, 375–379.
Zimmermann, G. (2007). Review on safety of the entomopathogenic fungus
Metarhizium anisopliae. Biocontrol Science & Technology, 17, 879–920.
Zimmermann, G., Papierok, B & Glare, T. (1995). Elias Metschnikoff, Elie
Metchnikoff or Ilya Ilich Mechnikov (1845-1916): A Pioneer in Insect
Pathology, the First Describer of the Entomopathogenic Fungus Metarhizium
anisopliae and How to Translate a Russian Name. Biocontrol Science &
Technology, 5, 527-530.