Embed Size (px)
Citation preview

Systematically Creased Thin-Film Membrane Structures
Alessandro Papa∗ and Sergio Pellegrino†
University of Cambridge,
Cambridge, England CB2 1PZ, United Kingdom
DOI: 10.2514/1.18285
This paper presents a study of a square membrane, creased according to theMiura-ori folding pattern.When the
membrane is allowed to expand from its packaged configuration, it initially expands elastically under zero corner
forces. Starting from this naturally expanded configuration, the paper investigates the stress distribution and the
load-displacement relationship when in-plane, diagonal loads are applied at the corners. It is found that out-of-plane
bending is themain load-carryingmode and, for stress magnitudes typical of current solar-sail designs, the behavior
of the membrane remains linear elastic. A simple analytical model, originally proposed for randomly creased
membranes, is shown to predict with good accuracy the load-displacement relationship of the corners. It uses
physically based and hence directly measurable membrane parameters.
I. Introduction
T HERE is currently much interest in the use of thin-filmmembrane structures for a variety of future gossamer spacecraft
missions. In some of the proposed structural architectures, it isenvisaged that thin films will be packaged by means of a regulararrangement of creases, or fold lines, and hence the question arises ofhow such precreased foils behave when they are deployed in orbit.
One packaging scheme is known asMiura-ori [1], Fig. 1. An idealMiura-ori surface is a mechanical linkage of thin, flat platesconnected by frictionless hinges; this linkage has a single degree ofkinematic freedom. A membrane folded such that the pattern of theresulting creases mimics the arrangement of the hinges in an idealMiura-ori surface can be packaged and deployed efficiently [2,3].Because of these properties, theMiura-ori crease patternwas selectedfor the present research.
This paper presents a detailed study (involving both experimentsand detailed finite element simulations) of a square membrane withspecific dimensions and creases arranged according to the Miura-orifolding pattern. Randomly creased thin films have been extensivelyinvestigated byMurphey [4], and the present study is an extension ofMurphey’s work to films where the creases are arrangedsystematically, according to a repeating pattern. The aim of ourstudy is to determine the shape of the membrane and the load-displacement relationship for in-plane, diagonal loading of thecorners, starting from a configuration that might be considered as theunstressed deployed shape of the membrane, i.e., the configurationthat the membrane will expand to, in the absence of any externalforces. The magnitudes of the corner forces are chosen such as togenerate stress levels on the order of 0.02 MPa at the center of a25 �m thick membrane. We show that a simple analytical modelconsisting of two creased beams, derived fromMurphey’s model forrandomly creased membranes and characterized by only a small
number of directly measurable parameters, predicts the displace-ments of the corners quite accurately.
The paper is laid out as follows. Section II describes the layout ofthe creases. Section III presents an experimental study of a 0:5 �0:5 m membrane creased according to the Miura-ori pattern. Theexperimental technique is explained and measurements of the initialcrease angle are obtained. Section IV presents a detailed finiteelement simulation of this membrane. Section V comparesexperimental measurements with finite element results. Finally,Sec. VI presents a simple analytical model for the membrane’s load-displacement behavior, whose predictions are then compared withthe finite element results. Section VII concludes the paper.
II. Crease Geometry
There are two sets of creases, as shown in Fig. 1. Those in the firstset, called primary creases, form the main hill and valley folds of thepackaging scheme; each of these creases is folded in the same sensethroughout its length, and it never becomes straight. The creases inthe second set, called secondary creases, form alternate hill andvalley folds and become aligned when the membrane is flat. A detailof the crease geometry on a flat membrane is shown in Fig. 2a.
The degree of freedom used to describe the degree of deploymentof aMiura-ori surface is the deployment angle �, defined as the anglebetween the panels and the plane x-y of the fully deployed surface(see Fig. 2b).
The geometric feature that determines the deployment path, andtherefore the degree of coupling between the expansion of themembrane along the two diagonal directions, is the defect angle �,defined in Fig. 2a. The expansion ratios of aMiura-ori surface, in thex and y directions, are related to � by [1]
OA
OAmax
� cos�sin�1�sin � cos��� (1)
OB
OBmax
� cos �
cos�sin�1�sin � cos��� (2)
III. Experimental Study
The experimental study had two principal aims. First, to obtain arepresentative value for the initial deployment angle �0 to be used inthe finite element simulations. Second, to measure the load-displacement relationship for the corners of themembrane and so testthe validity of the elastic behavior assumption.
Presented as Paper 1975 at the 46th AIAA/ASME/ASCE/AHS/ASCStructures, Structural Dynamics and Materials Conference, Austin, Texas,18–21 April 2005; received 18 June 2005; revision received 11 September2006; accepted for publication 16 September 2006. Copyright © 2007 byAlessandro Papa and Sergio Pellegrino. Published by the American Instituteof Aeronautics and Astronautics, Inc., with permission. Copies of this papermay be made for personal or internal use, on condition that the copier pay the$10.00 per-copy fee to the Copyright Clearance Center, Inc., 222 RosewoodDrive, Danvers, MA 01923; include the code 0022-4650/08 $10.00 incorrespondence with the CCC.
∗Mechanical Engineering Student, Department of Engineering,Trumpington Street; [email protected].
†Professor of Structural Engineering, Department of Engineering,Trumpington Street; currently Professor of Aeronautics and CivilEngineering, California Institute of Technology, 1200 East CaliforniaBoulevard, Mail Code 301-46, Pasadena, CA 91125; [email protected] Fellow AIAA.
JOURNAL OF SPACECRAFT AND ROCKETS
Vol. 45, No. 1, January–February 2008
10

A. Membrane
A 25 �m thick aluminized Kapton membrane was used. Therequired crease patternwas set up as follows.A 5 � 5panelMiura-oricrease pattern was marked with a fine permanent marker on one sideof a 500 � 500 mm square membrane. The secondary convexcreases, along the x direction, were formed by running a ballpointpen firmly along the marked crease lines. The membrane was thenturned and the secondary concave creases formed in a similarfashion. By placing the membrane over a compliant surfaceconsisting of a dozen sheets of A4 paper and carefully controlling theapplied force, a homogenous set of secondary creases was formed.
For an ideal Miura-ori surface at small angles of deployment, theamplitude of the creases in the x direction is considerably larger thanthe amplitude of the creases in the y direction. To allow for thisdifference, the primary creases were formed using a differenttechnique to that used to form the secondary creases. A thin plate ofKevlar was cut into a rectangular shape, with the length of its minoredge matching the length of the primary creases. For each primarycrease, theminor edge of theKevlar platewas placed to coincidewithits desired position and the membrane carefully folded 180 deg overtheKevlar plate, avoiding any damage to themembrane. A roller wasthen run along the length of the Kevlar edge, through the foldedmembrane, thereby forming a tight crease in the membrane. Thisprocess was repeated until the crease pattern was complete.
B. Apparatus
A detailed description of the rig used for these experiments can befound in [5]. The creasedmembrane can be seen in Fig. 3, attached toa horizontal steel frame. Note that the corners have been cut at anangle and reinforced with edge tabs, made of Kapton tape loopedover a steel rod. These corner reinforcements have the purpose ofreducing the maximum stress in the membrane and so avoid plasticdeformation in the corner regions.
The forces applied to the corners of the membrane, which rangedfrom 0 to 0.2 N, were measured with strain gauged cantilever beams
tied with a light Kevlar cord to a small hole in the membrane cornertab. Given that themembrane’s total weight is approximately 0.11N,the experiment had to be carried outwith themembrane supported ona flat surface. A steel plate was placed on wood block supports in theinterior of a square steel frame, such that its top surface was at thesame height as the strain gauged cantilevers attached to the corners ofthe steel frame, as shown in Fig. 3.
A Keyence LK-081 charge-coupled device (CCD) laser wasmounted to the steel rig so that it could scan the membrane andmeasure its surface profile. The resolution of this laser is 3 �m over arange of�15 mm.
Photogrammetry was used to track the relative displacements oftwo opposite corners of the membrane. Thirty black markers wereaffixed to the two corners of the membrane (which had previouslybeen covered with a thin coat of white spray) and nine white markerswere affixed to each corresponding corner of the rig; all of thesetargets were paper disks with a diameter of 9mm. Photographs of thecomplete membrane were taken with a 4.0 megapixel digital camera,and the images were processed with the software Photomodeler Pro4.0. The average standard deviation of the measurements was0.11 mm, or 6.0% of the maximum displacement measured.
C. Surface Profile
The average crease angle of the membrane in the unloaded statewas measured to be �0 � 152:4 deg. Hence the corresponding valueof �0, see Fig. 4, is
�0 �180 � �0
2� 13:8 deg (3)
The average crease angle of the membrane in the fully loaded statewas measured as �1 � 156:0 deg; this is a 2.4% increase from �0.
Fig. 1 Miura-ori packaging scheme [1].
θ
Hill foldsValley folds
a) Flat membrane b) Perspective view
O A
B
x
y
β Secondary creases
Primary creases
B
AO
CC
z
Fig. 2 Details of crease geometry, defect angle�, and deployment angle
�.
Fig. 3 Test rig, including CCD laser, cantilever strain gauges, and
target markers.
175 180 185 190 195-10
-8
-6
-4
-2
0
2
4
6
8
10
Distance Perpendicular to Crease (mm)
Sca
n A
mpl
itude
(m
m)
θ0
η0
Fig. 4 Measured profile of a primary crease.
PAPA AND PELLEGRINO 11

The measured load-displacement relationship is presented inSec. V.
IV. Finite Element Analysis
Detailed finite element simulations, based on shell-elementmodels of a membrane, have already been used extensively to studythe phenomenon of two-dimensional structural wrinkling in initiallyflat thin-filmmembranes [6–8]. The present study represents the firstattempt to apply the same approach to the study of precreasedmembranes. A parallel effort, which uses a nonlinear material modelfor a creased membrane, has been recently presented [9].
The finite element model aimed to reproduce the behavior of the5 � 5 panel experimental membrane described in Sec. III. Hence allinternal panels form identical parallelograms with �� 6 deg, as inthe experiment. To set up the model, it was assumed that a thin-filmmembrane with uniform Miura-ori creases opens out elastically andtakes the shape of an ideal Miura-ori surface, with flat panels joiningthe creases.
A. Finite Element Model
The ABAQUS finite element package (version 6.4) was used forthis study; the geometry of the model is shown in Fig. 5. Themembrane and the corner tabs were modeled with S4R5 shellelements. S4R5 is a four-node, doubly curved, reduced integration,thin-shell element, with five degrees of freedom per node. B31 beamelements were used tomodel the rods throughwhich the corner loadsare applied. B31 is a two-node linear beam element. The cornernodes were constrained as follows: node A in the x, y, and zdirections; node B in x and z; node C in z only; and node D in y and z.These constraints were representative of the boundary conditionsthat would be applied to a real solar sail; convergence could not beachieved when fewer constraints were applied.
AMATLAB script was developed to determine the coordinates ofa mesh of evenly distributed nodes lying on an ideal Miura-orisurface, at any stage of deployment. The edges of each panel of themembrane are defined exactly, by defining sets of nodes that lie onthe crease lines. Given �0, from Eq. (3), this script was used togenerate the ABAQUS input file.
B. Material Properties
It was assumed that Kapton behaves as a linear-elastic material forthe load range of interest. Note that the initial formation of creases in
the membrane, which involves localized yielding of the materialalong a line, cannot be captured (of course) by this approach.Because the analysis assumes an initial set of crease lines in themembrane, with associated kinks, the assumption of linear-elasticbehavior amounts to assuming that no plastic deformation takesplace, even along the creases, under the action of the applied cornerloads.
A detailed set of measurements of the stress-strain behavior of thesame material used in the present research, Kapton HN, were carriedout by Wong [10]. These tests showed that at room temperature thismaterial is almost perfectly linear elastic, see Fig. 6, for stressesbelow 30 MPa. This value is about 10 times larger than the largeststress induced by the load magnitudes of interest; we will return tothis point in Sec. IV.G.
Based on Wong’s results, the Kapton membrane was modeled asan isotropic, linear-elastic material with Young’s modulus E�3530 MPa and Poisson’s ratio �� 0:3. The thickness was increasedto 112:5 �m to model the corner reinforcements. The steel rodsattached to the edge of the tabsweremodeled as beamswith a circularcross section, with a radius of 1.5 mm and Young’s modulus of210,000 MPa.
500 mm
100 mm
100
mm
500
mm
β =6o
47.9o
42.1o
x
y
z
23.6 mm
Secondary creases
Primary creases
Beam
0.25T
0.25T0.25T
0.25T
Tab
A D
B
C
a) Geometry b) Trimmed corner detailFig. 5 Finite element model.
0 0.2 0.4 0.6 0.80
5
10
15
20
25
E= 3530 N/mm2
30
Str
ess
(N/m
m2 )
0o
90o
Strain (%)
Fig. 6 Behaviour of 25 �m Kapton HN in uniaxial tension; for each
orientation, three load-unload cycles were carried out [10].
12 PAPA AND PELLEGRINO

C. Load Levels
The maximum value of the corner force T, see Fig. 5b, was 0.2 N.This value corresponds to an average stress level of about 20 kPa inan uncreased membrane of equal dimensions to that investigated.This stress magnitude is of the same order of prestress levels that arecurrently planned for solar-sail missions.
D. Geometric Imperfections
Geometric imperfections were seeded into the model to facilitatethe formation of buckles (wrinkles). Random imperfections z wereseeded [8]
z� ��ih �i� 1; . . . ; N� (4)
where � is a dimensionless amplitude parameter, �i 2 ��1; 1� is apseudorandom number, h is the membrane thickness, and N is thetotal number of nodes in themodel.AMATLABscriptwaswritten togenerate a table of nodal geometric imperfections that weresubsequently superposed to the heights of all of the nodes of thefiniteelement model. The value �� 0:2 was used [8].
E. Analysis Procedure
A geometrically nonlinear analysis was carried out using theABAQUS *NLGEOM command, with automatic stabilizationthrough the use of *STATIC, STABILIZE. The default stabilizationfactor in ABAQUS is too large to achieve accurate results. It isdesirable to use the smallest stabilization factor possible, to reducethe amount of numerical damping in the model, but thecomputational expense of running simulations quickly increaseswith stabilization factors below a certain threshold. Values between6 � 10�7 and 1 � 10�6, intermediate between those used in [6–8],were used.
F. Sensitivity Study
Three different finite element models were used to test thesensitivity of the finite element solution with respect to differentcombinations of mesh resolution and stabilization factor. A lowresolution mesh of 90 � 90 elements was tested with stabilizationfactors of 6 � 10�7 and 1 � 10�6. A high-resolution mesh of 180 �180 elements was tested with a stabilization factor of 1 � 10�6, andthis simulation took nine days on a 3.4GHzPentium 4PC. Therewasinsufficient time available to test the high-resolution mesh with thelower stabilization factor.
Figure 7 shows plots of the surface profile obtained from thesethree models. These profiles are obtained by intersecting themidplane offive consecutive panels of themembrane, at a distance ofabout 5 mm from a central primary crease.
The figure shows that there is a tradeoff between mesh resolutionand stabilization factor, and the comparison indicates that for thepurpose of modeling the membrane’s surface, a higher mesh
resolution is preferable to the use of a lower stabilization factor. Thelow-resolution mesh is unable to accurately capture the curvaturereversal of the membrane near the creases, as this effect occurs on avery short wavelength. Figure 8 shows a detailed view of a typicalsurface profile, obtained from a high-resolution model. Similarcomparisons of the stress variation near the creases confirm that it ispreferable to use a higher resolution mesh rather than a lowerstabilization factor, as this will allow the model to capture higherlevels of stress in the vicinity of the creases. However, the generalshape of the plots is very similar and this indicates that low-resolutionmodels would also be acceptable if detailed knowledge of the stresspeaks is not essential. In light of this sensitivity analysis, a high-resolution model with a stabilization factor of 1 � 10�6 was selectedas the basis for all finite element simulations.
G. Results
During the unfolding of an ideal Miura-ori surface, thedisplacements in the x direction dominate over the displacements inthe y direction toward the end of deployment. This happens also here,with the maximum nodal displacement in the x direction predicted tobe 87.7 times that of the maximum nodal displacement in the ydirection, as shown in Fig. 9. Furthermore, the component of thedisplacement field in the x direction displays a uniform gradient,which is also what would be expected for an ideal Miura-ori surface.
The load-displacement history of point C, near the right corner(see Fig. 5), is shown in Fig. 10. Themembrane stiffens considerablyafter a displacement of about 13 mm, when the corner loads areapproximately 0.02N. This behavior is similar to a trend observed byMurphey [4] for randomly wrinkled membranes.
Localized buckling of the membrane occurs between the creasesand is clearly visible in Fig. 11. Looking carefully at the load-displacement relationship for a corner, see the insert in Fig. 10, onefinds a large number of nearly horizontal jumps. Thesediscontinuities are believed to be associated with mode jumps,already known to occur in uncreased membranes [7], and hence areassociated with (small) changes in the wrinkle pattern in themembrane. It has been found that changing the value of thestabilization factor used in the simulation has the effect of changingthe precise value of the load at which these jumps occur, but does notchange fundamentally the type of response. Plots of the surfaceprofile indicate that the amplitudes of the buckles between the creasesis small in relation to the amplitudes of the creases. An interestingfeature that has been observed is the snap-through of the nodeslocated on the secondary creases, which does not happen for thenodes located on the primary creases.
To understand how a creased membrane carries loads, themidplane normal stress components have been plotted over a narrow
0 100 200 300 400 50013.2
13.4
13.6
13.8
14.0
14.2
Edge Distance (mm)
Hei
ght (
mm
)
Low Res. (1E-6)Low Res. (6E-7)
High Res. (1E-6)
Fig. 7 Comparison of surface profiles for different combinations of
mesh resolution and stabilization factor along section parallel to a
primary crease.
Horizontal Distance
Hei
ght
crease
Fig. 8 Detail of surface profile across two secondary creases, showing
curvature reversal effect.
PAPA AND PELLEGRINO 13

range, in Fig. 12. The figure shows that the midplane stresses aregenerally quite small, i.e., of the same order as in an uncreasedmembrane, but tend to be two or three times larger near the creases.Even larger values occur near the four corners of the membrane.
However, this is by no means the full picture, as much largerbending stresses occur along the creases. Figure 13 shows thedistribution of the midplane curvatures in the membrane. The largestvalue is 0:059 mm�1, in the x direction, which corresponds to amaximum bending strain of 0.07%, and hence to a maximum normalstress component of 2.7 MPa. Note that this value is about one-tenthof the yield stress of Kapton.
In conclusion, a membrane with systematic creases arrangedaccording to the Miura-ori pattern carries loads mainly by means ofin-plane action, with associated midplane stresses throughout themembrane andmidplane stress concentrations along the creases, plusbending action, concentrated along the creases, that induces muchlarger stresses, typically an order of magnitude higher.
V. Comparison of Experimentaland Finite Element Results
In the finite element simulation, even a small set of corner forcesinduces a corresponding displacement of the corners, but in theexperiment, due to friction between the membrane and thesupporting plate, a threshold has to be reached before any
+13.6
-0.2
+10.1
+6.7
+3.2
a) b)
Fig. 9 Displacement components, in millimeters, in a) x direction and b) y direction.
0 2 4 6 8 10 12 140
0.04
0.08
0.12
0.16
0.2
Displacement (mm)
T (
N)
Fig. 10 Load-displacement relationship for corner C (insert shows
magnified response over a very small displacement range).
T T
TT
Fig. 11 Deformed membrane, with out-of-plane deformations am-
plified by a factor of 10.
+0.05
+0.10
-0.10
-0.05
0.0
+0.15
+0.30
-0.30
-0.15
0.0
a) b)Fig. 12 Midplane normal stress components, in MPa, in a) x direction and b) y direction.
14 PAPA AND PELLEGRINO

displacement is observed. The self-weight of the membrane is0.11 N; the static friction coefficient between Kapton and steel wasmeasured to be 0.19. Multiplying the weight by the frictioncoefficient, and dividing by four, to account for the fact that fourcorner forces are applied simultaneously to themembrane, we obtaina rough estimate, 0.0052 N, of the friction-related threshold for thecorner forces. This estimated value is rather small in comparisonwiththe range of forces of interest, and hence it can be concluded thatfriction effects are negligibly small.
A more significant effect of gravity loading on the membrane is tochange the initial shape of the membrane and thus cause an initial setof corner deflections. To fully take into account this effect, one
should apply a distributed gravity loading in the finite elementmodel, but this would have the effect of considerably increasing thesimulation time. An alternative, quicker approach was adoptedinstead. This consisted in setting up a two-dimensional finite elementcreased-beam model of the membrane, of the same kind as theanalytical model described in Sec. VI, but using B23H beamelements. At the two kinks that face downward, which model thecreases that are in contact with the steel plate, the verticaldisplacement was set to zero and frictional force components wereapplied horizontally. A geometrically nonlinear analysis was thencarried out in ABAQUS, to determine the horizontal displacementsof the end of the creased beam (see Fig. 14).
The deflection thus obtained was then used to estimate anequivalent corner force T0 that would cause the same cornerdisplacement in the finite element model of a membrane that is notsubject to gravity. The value of this force is 0.034 N. Hence an initialoffset of T0 � 0:034 N was applied to the load-displacement curvepredicted by the finite element analysis, see Fig. 15, to compare theseresults with the experimental measurements, also shown in thefigure. The two sets of results are in very good agreement and withinthe estimated experimental error.
+5.87e-2
+3.01e-2
+1.52e-3
-2.70e-2
-5.56e-2
+8.37e-3
+4.27e-3
+1.72e-4
-3.93e-3
-8.03e-3
a) x direction b) y direction
Fig. 13 Midplane curvatures, in mm�1.
Fig. 14 Creased-beam model. The vertical displacements in Fig. 14bare amplified by a factor of 10.
-0.05 0 0.05 0.1 0.15 0.2-20
-15
-10
-5
0
5
Tota
l Dis
plac
emen
t (m
m)
Average Load T (N)
0 0.01 0.02 0.03 0.04 0.05 0.06 0.07 0.08 0.09 0.1
0
0.2
0.4
0.6
0.8
1
1.2
Tota
l Dis
plac
emen
t (m
m)
Average Load T (N)
FEExperiment
−T0
Fig. 15 Comparison of total diagonal displacements from finite element simulation and experimental measurements.
PAPA AND PELLEGRINO 15

The discontinuities present in thefinite element load-displacementpredictions are likely to be the result of a combination of out-of-planedisplacements due to localized buckling and mode jumpinginstabilities.
VI. Analytical Model
Murphey [4] has proposed a number of analytical models thatcapture the in-plane load-displacement response of randomlycreased membranes. Here we adopt a simplified version of one ofMurphey’s models and show that it predicts with good accuracy theoverall behavior of a membrane with creases arranged according tothe Miura-ori pattern.
We make the following three assumptions. First, based on theobservation that the maximum stresses in the membrane are wellbelow the yield stress of thematerial, linear-elastic material behavioris assumed. Second, stretching of the membrane midplane isneglected, and so the only deformation mode that is considered isbending. Third, based on the displacement fields that have beenobserved, see Fig. 9, it is assumed that parallel edges of themembrane remain parallel throughout, and hence that the behavior ofthe creased membrane can be captured using only two globalkinematic variables dx and dy defined in Fig. 16. The model consistsof two uniform creased beams, parallel to the x and y axes.
A. Creased-Beam Model
Consider the creased-beam ABC shown in Fig. 17. Our aim is todetermine the deflection-force relationship for this beam, �� ��P�,as a function of the length L, rise a0, and flexural stiffness EI of thebeam. The beam is assumed to be inextensional. Once � is known, itcan be used to determine the average longitudinal strain along AC,which can then be used to characterize the behavior of the creasedmembrane in the x or y direction.
To avoid the slope discontinuity at B, we will analyze only AB,subject to appropriate boundary conditions at B. Denoting by w��the deflection of the beam, which includes the initial deflectionw0 � 2a0=L and the additional, elastic deflection w1 due to P, thebending moment is given by
M� Pw� P�2a0
L w1
�(5)
Substituting the standard moment-curvature relationship for smallrotations
M� EI d2w1
d2(6)
we obtain
d2w1
d2� P
EI
�2a0
Lw1
�(7)
This equation can be simplified by introducing the nondimensionalratio between P and the Euler buckling load of a straight beam oflength L
�� L
������P
EI
r(8)
Substituting Eq. (8) into Eq. (7) and rearranging gives�L
�
�2 d2w1
d2� w1 �
2a0L (9)
The solution of this equation, having included the boundaryconditions w1 � 0 at � 0 and dw1=d� 0 at � L=2, is
w1 ��2a0�
�sinh��=L�cosh��=2� �
2a0L (10)
Hence the deflected shape of the beam is given by
w�w0 w1 ��2a0�
�sinh��=L�cosh��=2� (11)
Next we want to determine the end displacement of the beam �.This can be found by integrating the strain along due tow and thensubtracting the initial displacement due to creasing, �2a20=L. Thisgives
�� 2
ZL=2
0
�du
d
�d 2a20
L(12)
where du=d can be found by noting that the Green strain �G along has to vanish in an inextensional beam, hence
�G �du
d 1
2
�dw
d
�2
� 0 (13)
Substituting
du
d�� 1
2
�dw
d
�2
(14)
into Eq. (12), differentiating w in Eq. (11), and then solving theintegral, we obtain
���2 � sinh��� �
�cosh2��=2�
�a20L
(15)
Then, dividing by L, we find the average strain along anequivalent, straight beam of length L
�� �
L��2 � sinh��� �
�cosh2��=2�
�a20L2
(16)
B. Validation of Analytical Model
Predictions of the load-displacement behavior of node C, definedin Fig. 5, from our simple analytical model are compared with theresults of a finite element simulation for a massless, initially creasedmembrane.
First, we computed the average strains in the two creased beams ��xand ��y, using Eqs. (8) and (16). It was assumed that P� T=
���2p
, i.e.,
T45o
T
TT dx/2
45o
45o45o
T
kY
kX
dx
dy
dx/2
dy/2
dy/2
a) Deformation b) Simple model
Fig. 16 Membrane deformation due to loads T (thicker lines) and itsinitial configuration for T � 0 (thinner lines), and the simple two-
parameter model.
P, δ
A
B
Cξ
w
ao
LFig. 17 Creased-beam model.
16 PAPA AND PELLEGRINO
each corner force is shared equally between the two creased beams,and T varies between 0 and 0.2 N. The bending stiffness of thecreased beams was computed assuming a rectangular cross sectionbeam with the breadth and thickness equal to the full width andthickness of the membrane, respectively. Hence
EI � 3530 � 500�25 � 10�3�312
� 2:298 Nmm2 (17)
Wewill denote quantities that refer to the creased beams parallel tothe x axis and they axiswith the subscripts x and y, respectively.Notethat in Fig. 2b, the projected length L of the creased beam
corresponds to OA=2 for the calculation of ��x and OB=2 for thecalculation of ��y. Hence, substituting �� �0 � 13:8 deg and
OAmax �OBmax � 2l� 200 mm, we obtain Lx � 97:14 mm andLy � 99:98 mm, respectively. Note that l��100 mm� denotes thewidth and height of each panel of the Miura-ori pattern.
Finally, the crease heights in the two directions a0x and a0y can beobtained from Pythagoras’ theorem, given the projected lengths Lxand Ly
a0x ����������������l2 � L2
x
p=2� 11:9 mm a0y �
���������������l2 � L2
y
q=2� 1:3 mm
(18)
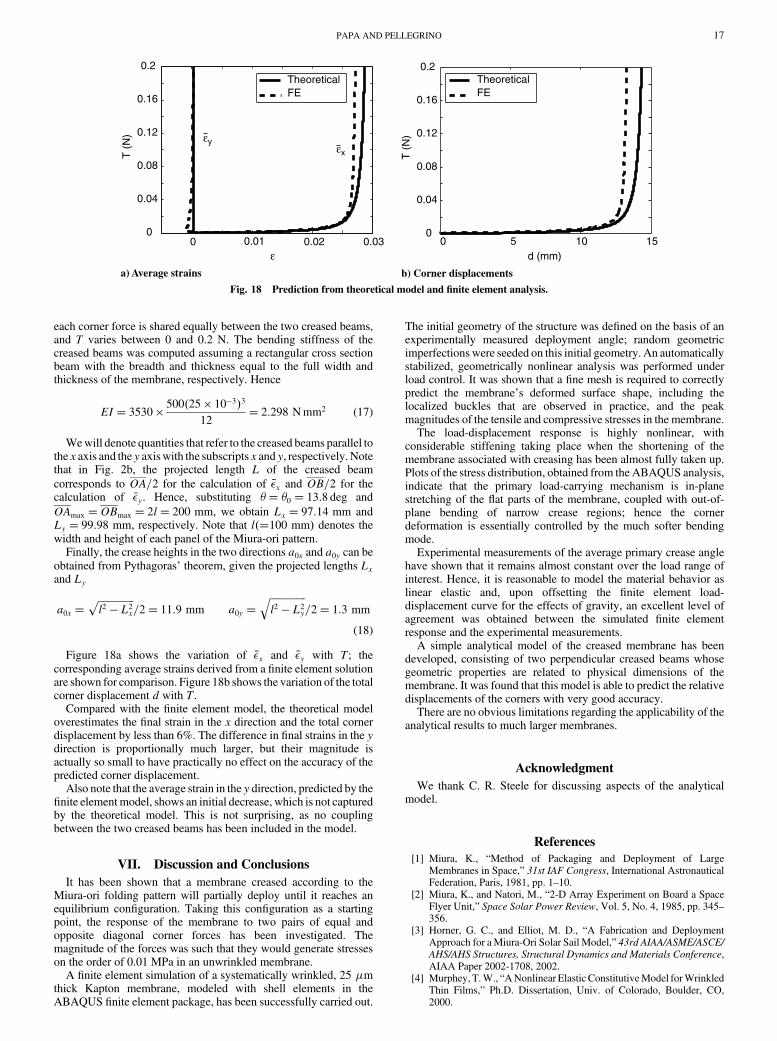
Figure 18a shows the variation of ��x and ��y with T; thecorresponding average strains derived from a finite element solutionare shown for comparison. Figure 18b shows the variation of the totalcorner displacement d with T.
Compared with the finite element model, the theoretical modeloverestimates the final strain in the x direction and the total cornerdisplacement by less than 6%. The difference in final strains in the ydirection is proportionally much larger, but their magnitude isactually so small to have practically no effect on the accuracy of thepredicted corner displacement.
Also note that the average strain in the y direction, predicted by thefinite element model, shows an initial decrease, which is not capturedby the theoretical model. This is not surprising, as no couplingbetween the two creased beams has been included in the model.
VII. Discussion and Conclusions
It has been shown that a membrane creased according to theMiura-ori folding pattern will partially deploy until it reaches anequilibrium configuration. Taking this configuration as a startingpoint, the response of the membrane to two pairs of equal andopposite diagonal corner forces has been investigated. Themagnitude of the forces was such that they would generate stresseson the order of 0.01 MPa in an unwrinkled membrane.
A finite element simulation of a systematically wrinkled, 25 �mthick Kapton membrane, modeled with shell elements in theABAQUS finite element package, has been successfully carried out.
The initial geometry of the structure was defined on the basis of anexperimentally measured deployment angle; random geometricimperfections were seeded on this initial geometry. An automaticallystabilized, geometrically nonlinear analysis was performed underload control. It was shown that a fine mesh is required to correctlypredict the membrane’s deformed surface shape, including thelocalized buckles that are observed in practice, and the peakmagnitudes of the tensile and compressive stresses in the membrane.
The load-displacement response is highly nonlinear, withconsiderable stiffening taking place when the shortening of themembrane associated with creasing has been almost fully taken up.Plots of the stress distribution, obtained from the ABAQUS analysis,indicate that the primary load-carrying mechanism is in-planestretching of the flat parts of the membrane, coupled with out-of-plane bending of narrow crease regions; hence the cornerdeformation is essentially controlled by the much softer bendingmode.
Experimental measurements of the average primary crease anglehave shown that it remains almost constant over the load range ofinterest. Hence, it is reasonable to model the material behavior aslinear elastic and, upon offsetting the finite element load-displacement curve for the effects of gravity, an excellent level ofagreement was obtained between the simulated finite elementresponse and the experimental measurements.
A simple analytical model of the creased membrane has beendeveloped, consisting of two perpendicular creased beams whosegeometric properties are related to physical dimensions of themembrane. It was found that this model is able to predict the relativedisplacements of the corners with very good accuracy.
There are no obvious limitations regarding the applicability of theanalytical results to much larger membranes.
Acknowledgment
We thank C. R. Steele for discussing aspects of the analyticalmodel.
References
[1] Miura, K., “Method of Packaging and Deployment of LargeMembranes in Space,” 31st IAF Congress, International AstronauticalFederation, Paris, 1981, pp. 1–10.
[2] Miura, K., and Natori, M., “2-D Array Experiment on Board a SpaceFlyer Unit,” Space Solar Power Review, Vol. 5, No. 4, 1985, pp. 345–356.
[3] Horner, G. C., and Elliot, M. D., “A Fabrication and DeploymentApproach for aMiura-Ori Solar Sail Model,” 43rd AIAA/ASME/ASCE/
AHS/AHS Structures, Structural Dynamics and Materials Conference,AIAA Paper 2002-1708, 2002.
[4] Murphey, T.W., “ANonlinear Elastic ConstitutiveModel forWrinkledThin Films,” Ph.D. Dissertation, Univ. of Colorado, Boulder, CO,2000.
a) Average strains b) Corner displacements
0 0.01 0.02
T (
N)
d (mm)
0
0.04
0.08
0.12
0.16
0.2
0.03
Theoretical FE
ε
εyεx
Theoretical FE
0 5 10 15
T (
N)
0
0.04
0.08
0.12
0.16
0.2
Fig. 18 Prediction from theoretical model and finite element analysis.
PAPA AND PELLEGRINO 17

[5] Wong, Y. W., and Pellegrino, S., “Wrinkled Membranes, Part 1:Experiments,” Journal of Mechanics of Materials and Structures,Vol. 1, No. 1, 2006, pp. 1–23.
[6] Wong, Y. W., Pellegrino, S., and Park, K. C., “Prediction of WrinkleAmplitudes in Square Solar Sails,” 44th AIAA/ASME/ASCE/AHS/ASC
Structures, Structural Dynamics and Materials Conference, AIAAPaper 2003-1982, 2003.
[7] Wong, Y. W., and Pellegrino, S., “Wrinkled Membranes, Part 3:Numerical Simulations,” Journal of Mechanics of Materials and
Structures, Vol. 1, No. 1, 2006, pp. 61–93.[8] Tessler, A., Sleight, D. W., and Wang, J. T., “Effective Modeling and
Nonlinear Shell Analysis of Thin Membranes Exhibiting Structural
Wrinkling,” Journal of Spacecraft and Rockets, Vol. 42, No. 2, 2005,pp. 287–298.
[9] Gough, A., Hossain, N. M. A., Jenkins, C. H., Blandino, J. R., andHendricks, A., “Experimental and Numerical Study of CreasedMembranes,” 46th AIAA/ASME/ASCE/AHS/ASC Structures, Struc-
tural Dynamics and Materials Conference, AIAA Paper 2005-1976,2005.
[10] Wong, Y. W., “Wrinkling of Thin Membrane Structures,” Ph.D.Dissertation, Univ. of Cambridge, Cambridge, England, U.K., 2003.
G. AgnesAssociate Editor
18 PAPA AND PELLEGRINO