Embed Size (px)
Citation preview
How to review the evidence:systematic identification and review of
the scientific literature
Handbook series on preparing clinical practiceguidelines
Endorsed November 1999
NHMRCNational Health and Medical Research Council

© Commonwealth of Australia 2000
ISBN 1864960329
This work is copyright. Apart from any use as permitted under the Copyright Act 1968, nopart may be reproduced by any process without permission from AusInfo. Requests andenquiries concerning reproduction and rights should be addressed to the Manager,Legislative Services, AusInfo, GPO Box 1920, Canberra ACT 2601.
The strategic intent of the National Health and Medical Research Council (NHMRC) is towork with others for the health of all Australians, by promoting informed debate on ethicsand policy, providing knowledge-based advice, fostering a high quality and internationallyrecognised research base, and applying research rigour to health issues.
NHMRC documents are prepared by panels of experts drawn from appropriate Australianacademic, professional, community and government organisations. NHMRC is grateful tothese people for the excellent work they do on its behalf. The work is usually performed onan honorary basis and in addition to their usual work commitments.
This document is sold through Government Info Bookshops at a price that covers the costof printing and distribution only. For publication purchases please contact AusInfo on theirtoll-free number 132 447, or through their Internet address:www.ausinfo.gov.au/general/gen_hottobuy.htm
Production by Biotext, Canberra

iii
CONTENTS
Preface ix
INTRODUCTION 1
Development of evidence-based guidelines 1Systematic literature reviews 1Method 2How much work is a systematic review? 4About this handbook 5
PART 1 GENERAL METHODS 7
1 THE QUESTION 9
1.1 What types of questions can be asked? 91.1.1 Interventions 91.1.2 Frequency or rate 101.1.3 Diagnostic test performance 121.1.4 Aetiology and risk factors 121.1.5 Prediction and prognosis 131.1.6 Economics 13
1.2 What is the relevant question? 131.3 How focused should the question be? 13
2 FINDING RELEVANT STUDIES 15
2.1 Finding existing systematic reviews 152.2 Finding published primary studies 15
2.2.1 Breaking down the study question intocomponents 15
2.2.2 Use of synonyms 162.2.3 Snowballing 182.2.4 Handsearching 182.2.5 Methodological terms 182.2.6 Methodological filters 192.2.7 Use of different databases 19
2.3 Finding unpublished primary studies 202.3.1 Searching relevant databases 202.3.2 Writing to experts 20
2.4 Publication bias — a crucial problem 202.4.1 What is publication bias? 20
How to review the evidenceiv
2.4.2 Does this affect the results of the reviews? 212.4.3 What can we do about publication bias? 212.4.4 Duplicate publications 22
3 APPRAISING AND SELECTING STUDIES 23
3.1 Standardising the appraisal 233.1.1 What study features should be assessed? 233.1.2 Is it important to have a structured appraisal? 233.1.3 How many reviewers are required? 243.1.4 Is it necessary to do the appraisal ‘blind’ to the
outcome of the study? 243.2 Using the quality appraisal 24
4 SUMMARISING AND SYNTHESISING THE STUDIES 27
4.1 Presenting the results of the studies (data extraction) 274.1.1 Tabular summary 274.1.2 Graphical presentation 27
4.2 Synthesis of study results 274.2.1 Fixed and random effects estimates 30
4.3 Assessing heterogeneity 314.3.1 Measures of heterogeneity 314.3.2 Individual patient data meta-analysis 33
4.4 Detecting publication bias 344.4.1 Funnel plots 344.4.2 Statistical tests 354.4.3 If publication bias is suspected, what can be
done? 36
5 APPLICABILITY: RETURNING TO THE QUESTION 37
PART 2 QUESTION-SPECIFIC METHODS 39
6 INTERVENTIONS 41
6.1 The question 416.1.1 Study design 41
6.2 Finding relevant studies 416.2.1 Finding existing systematic reviews 416.2.2 Finding published primary studies 426.2.3 Finding unpublished primary studies 42
6.3 Appraising and selecting studies 436.3.1 Standardising the appraisal 43
6.4 Summarising and synthesising the studies 446.4.1 Presenting the results of the studies 44

Contents v
6.4.2 Synthesis of study results 466.4.3 Assessing heterogeneity 48
6.5 Economic evaluation 496.6 Further information 50
7 FREQUENCY AND RATE 51
7.1 The question 517.1.1 Study design 52
7.2 Finding relevant studies 527.2.1 Finding existing systematic reviews 527.2.2 Finding published primary studies 527.2.3 Finding unpublished primary studies 53
7.3 Appraising and selecting studies 537.3.1 Standardising the appraisal 53
7.4 Summarising and synthesising the studies 547.4.1 Presenting the results of the studies 547.4.2 Synthesis of study results 557.4.3 Assessing heterogeneity 56
8 DIAGNOSTIC TESTS 57
8.1 The question 578.1.1 Study design 57
8.2 Finding relevant studies 588.2.1 Finding existing systematic reviews 588.2.2 Finding published primary studies 588.2.3 Finding unpublished primary studies 60
8.3 Appraising and selecting studies 608.3.1 Standardising the appraisal 60
8.4 Summarising and synthesising the studies 648.4.1 Presenting the results of the studies 648.4.2 Synthesis of study results 668.4.3 Assessing heterogeneity 68
9 AETIOLOGY AND RISK FACTORS 69
9.1 The question 699.1.1 Study design 69
9.2 Finding relevant studies 709.2.1 Finding existing systematic reviews 709.2.2 Finding published primary studies 709.2.3 Finding unpublished primary studies 71
9.3 Appraising and selecting studies 719.3.1 Standardising the appraisal 71
9.4 Summarising and synthesising the studies 749.4.1 Presenting the results of the studies 749.4.2 Synthesis of study results 75
How to review the evidencevi
9.4.3 Assessing heterogeneity 759.5 Judging causality 76
10 PREDICTION AND PROGNOSIS 79
10.1 The question 7910.1.1 Why should we be interested in prediction? 7910.1.2 Study design 80
10.2 Finding relevant studies 8010.2.1 Finding existing systematic reviews 8010.2.2 Finding published primary studies 8010.2.3 Finding unpublished primary studies 80
10.3 Appraising and selecting studies 8110.3.1 Standardising the appraisal 81
10.4 Summarising and synthesising the studies 8110.4.1 Presenting the results of the studies 8110.4.2 Synthesis of study results 8210.4.3 Assessing heterogeneity 82
Appendix A Membership of production team for handbook 83
Appendix B Process report 85
Appendix C Literature searching methods 87
Appendix D Software for meta-analysis 91
Glossary 95
Acronyms and abbreviations 107
References 109
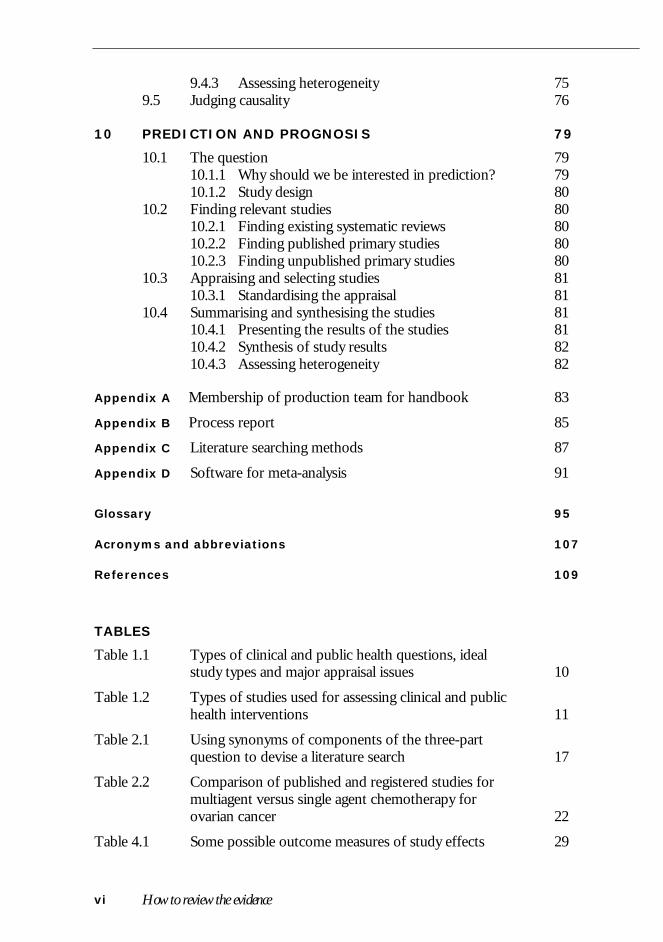
TABLES
Table 1.1 Types of clinical and public health questions, idealstudy types and major appraisal issues 10
Table 1.2 Types of studies used for assessing clinical and publichealth interventions 11
Table 2.1 Using synonyms of components of the three-partquestion to devise a literature search 17
Table 2.2 Comparison of published and registered studies formultiagent versus single agent chemotherapy forovarian cancer 22
Table 4.1 Some possible outcome measures of study effects 29

Contents vii
Table 6.1 Example summary table of quality features of a set ofhypothetical intervention trials 46
Table 7.1 Example summary table of a set of hypothetical studiesof frequency 54
Table 8.1 Example summary table of quality features of a set ofhypothetical diagnostic accuracy trials 65
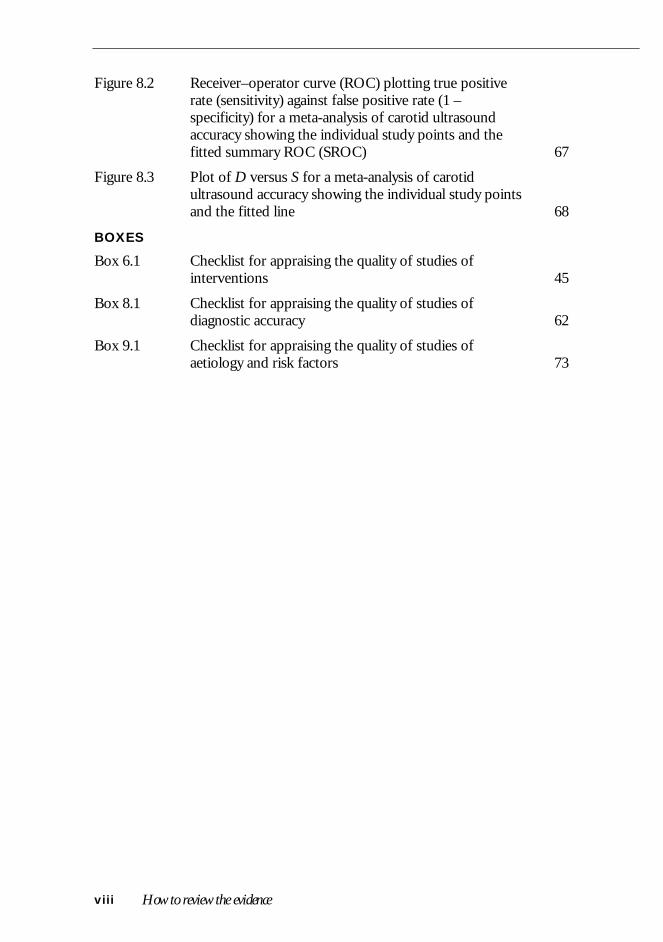
FIGURES
Preface Flow chart showing the clinical practice guidelinesdevelopment process xi
Figure 2.1 Venn diagram for colorectal screening 16
Figure 2.2 Papers identified by different search methods in asystematic review of near-patient testing 21
Figure 4.1 Relative mortality from colorectal cancer in screenedversus unscreened (control) groups from fourrandomised trials of faecal occult blood screening 28
Figure 4.2 Meta-analysis of 12 placebo-controlled trials of StJohn’s wort for depression, showing significantheterogeneity 32
Figure 4.3 Hypothetical study showing combined and subgroupanalysis 34
Figure 4.4 Funnel plot of 12 placebo-controlled trials of St John’swort showing some suggestion of ‘missing’ smallernegative trials 35
Figure 6.1 Placebo-controlled trials of treatment of epilepsy withthe drug gabapentin 47
Figure 6.2 L’Abbe plot of the stroke risk in the treated groupversus the stroke risk in the control group from a meta-analysis of 6 placebo-controlled trials of warfarin fornonvalvular atrial fibrillation. 48
Figure 7.1 Proportion of patients with antibiotic resistance inPropionibacterium acnes for four studies, listed bypublication date 55
Figure 8.1 Plot of sensitivity versus specificity (with 95%confidence intervals) for 14 studies of carotidultrasound for carotid stenosis 66
How to review the evidenceviii
Figure 8.2 Receiver–operator curve (ROC) plotting true positiverate (sensitivity) against false positive rate (1 –specificity) for a meta-analysis of carotid ultrasoundaccuracy showing the individual study points and thefitted summary ROC (SROC) 67
Figure 8.3 Plot of D versus S for a meta-analysis of carotidultrasound accuracy showing the individual study pointsand the fitted line 68
BOXES
Box 6.1 Checklist for appraising the quality of studies ofinterventions 45
Box 8.1 Checklist for appraising the quality of studies ofdiagnostic accuracy 62
Box 9.1 Checklist for appraising the quality of studies ofaetiology and risk factors 73

ix
PREFACE
Clinical practice guidelines are systematically developed statements that assistclinicians, consumers and policy makers to make appropriate health caredecisions. Such guidelines present statements of ‘best practice’ based on athorough evaluation of the evidence from published research studies on theoutcomes of treatment or other health care procedures. The methods used forcollecting and evaluating evidence and developing guidelines can be applied to awide range of clinical interventions and disciplines, including the use oftechnology and pharmaceuticals, surgical procedures, screening procedures,lifestyle advice, and so on.
In 1995, recognising the need for a clear and widely accessible guide for groupswishing to develop clinical practice guidelines, the National Health and MedicalResearch Council (NHMRC) published a booklet to assist groups to developand implement clinical practice guidelines. In 1999 a revised version of thisbooklet was published called A Guide to the Development, Implementation andEvaluation of Clinical Practice Guidelines (NHMRC 1999), which includes an outlineof the latest methods for evaluating evidence and developing and disseminatingguidelines.
The emerging guideline processes are complex, however, and depend on theintegration of a number of activities, from collection and processing ofscientific literature to evaluation of the evidence, development of evidence-based recommendations or guidelines, and implementation and disseminationof the guidelines to relevant professionals and consumers. The NHMRC hastherefore decided to supplement the information in the guideline developmentbooklet (NHMRC 1999) with a series of handbooks with further informationon each of the main stages involved. Experts in each area were contracted todraft the handbooks. An Assessment Panel was convened in June 1999 tooversee production of the series. Membership of the Assessment Panel and thewriting group for this handbook are shown at Appendix A.
Each of the handbooks in the series focuses on a different aspect of theguideline development process (review of the literature, evaluation ofevidence, dissemination and implementation, consumer publications,economic assessment and so on). This handbook describes how tosystematically identify scientific literature relevant to a particular question,select and review the most important (highest quality) studies and summariseand present the results for further consideration by the committee that willdevelop the clinical practice guidelines.
The way in which the guidance provided in this handbook fits into theoverall guideline development process recommended by the NHMRC is

How to review the evidencex
shown in the flowchart on page xi. Other handbooks that have beenproduced in this series so far are:
How to Use the Evidence: Assessment and Application of Scientific Evidence
How to Put the Evidence into Practice: Implementation and Dissemination Strategies
How to Present the Evidence for Consumers: Preparation of Consumer Publications
How to Compare the Costs and Benefits: Evaluation of the Economic Evidence
The series may be expanded in the future to include handbooks about otheraspects of the guideline development process, as well as related issues such asreviewing and evaluating evidence for public health issues.

Preface xi
Flow chart showing the clinical practice guidelines developmentprocess
(Shaded boxes show the stages described in this handbook)
Define topic/issue
Assess need for guidelines, eg:- Is issue related to clinical decision making?- Are there suitable existing guidelines?
Convene multidisciplinary committeeto develop guidelines
Develop health care questions appropriatefor intended guidelines
Identify (or commission) systematic reviews of the scientific literature relating to these health care questions
Assess evidence for- strength- size and effect- relevance
Apply evidence to clinical/health caresituation to determine benefits/harms
Develop and publish evidence-basedguidelines or update existing guidelines
Disseminate and implement guidelines
Maintain, evaluate and update guidelines
Compare costs and benefitsof health care interventions
Develop publication(s) to explainguidelines to consumers
Develop publication(s) to explainguidelines to other user groups,eg general practitioners
Apply evidence to clinical/health care situation to determine cost-effectivenessand feasibility

1
INTRODUCTION
Development of evidence-based guidelines
The process for clinical practice guideline development is described in theNational Health and Medical Research Council (NHMRC) publication A Guideto the Development, Implementation and Evaluation of Clinical Practice Guidelines(NHMRC 1999).
This recommends that guidelines should be developed by a multidisciplinaryguideline development committee, the initial task of which is to determine theneed for and scope of the guidelines, define the purpose and target audienceand identify the health outcomes that will improve as a result of theirimplementation.
The membership of the guideline development committee will depend on thenature of the particular guidelines being developed but will include clinicians,health professionals, consumers, health policy analysts, economists andregulatory agency representatives, industry representatives and bioethicists (seeNHMRC 1999 for a full list and further discussion of the multidisciplinarycommittee).
One of the main principles of guideline development is that they should bebased on the best available evidence. Therefore, the next task of the guidelinedevelopment committee is to commission or undertake a systematic review ofthe scientific literature to find out what is known about the benefits and harmsof the intervention under consideration or about other health outcomes relatedto the particular guidelines that the committee is developing. This handbookoutlines the principles and methods involved in such a review. It has beenprepared to assist reviewers with the task and to help the guideline developmentcommittee interpret the review when it is received. However, it should be notedthat the systematic review of scientific literature is a specialised task and theguideline development committee should ensure that a reviewer is engaged withthe necessary skills and experience to undertake the task.
Systematic literature reviews
Methods for reviewing and evaluating the scientific literature range from highlyformal, quantitative information syntheses to subjective summaries ofobservational data. The guideline development committee must select the mostrigorous and systematic review methods practicable.

How to review the evidence2
The purpose of a systematic literature review is to evaluate and interpret allavailable research evidence relevant to a particular question. In this approach aconcerted attempt is made to identify all relevant primary research, astandardised appraisal of study quality is made and the studies of acceptablequality are systematically (and sometimes quantitatively) synthesised. Thisdiffers from a traditional review in which previous work is described but notsystematically identified, assessed for quality and synthesised.
Advantages
There are two major advantages of systematic reviews (or 'meta-analysis').Firstly, by combining data they improve the ability to study the consistency ofresults (that is, they give ‘increased power’). This is because many individualstudies are too small to detect modest but important effects (that is, they haveinsufficient power). Combining all the studies that have attempted to answer thesame question considerably improves the statistical power.
Secondly, similar effects across a wide variety of settings and designs provideevidence of robustness and transferability of the results to other settings. If thestudies are inconsistent between settings, then the sources of variation can beexamined.
Thus while some people see the mixing of ‘apples and oranges’ as a problem ofsystematic reviews, it can be a distinct advantage because of its ability toenhance the generalisability and transferability of data.
Disadvantages
Without due care, however, the improved power can also be a disadvantage. Itallows the detection of small biases as well as small effects. All studies haveflaws, ranging from small to fatal, and it is essential to assess individual studiesfor such flaws. The added power of a systematic review can allow even smallbiases to result in an ‘apparent’ effect. For example, Schulz et al (1995) showedthat unblinded studies gave, on average, a 17% greater risk reduction thanblinded studies.
Method
A systematic review generally requires considerably more effort than atraditional review. The process is similar to primary scientific research andinvolves the careful and systematic collection, measurement, and synthesis ofdata (the ‘data’ in this instance being research papers). The term ‘systematicreview’ is used to indicate this careful review process and is preferred to ‘meta-analysis’ which is usually used synonymously but which has a more specific

Introduction 3
meaning relating to the combining and quantitative summarising of results froma number of studies.
It may be appropriate to provide a quantitative synthesis of the data but this isneither necessary nor sufficient to make a review ‘systematic’.
A systematic review involves a number of discrete steps:
• question formulation;• finding studies;• appraisal and selection of studies;• summary and synthesis of relevant studies;• determining the applicability of results; and• reviewing and appraising the economics literature.
Before starting the review, it is advisable to develop a protocol outlining thequestion to be answered and the proposed methods. This is required for allsystematic reviews carried out by Cochrane reviewers (Mulrow and Oxman1997).
Question formulation
Getting the question right is not easy. It is important to recognise that devisingthe most relevant and answerable question may take considerable time.Repeatedly asking ‘why is this important to answer?’ is helpful in framing thequestion correctly.
For example, are you really interested in the accuracy of the new test per se? Orwould it be better to know whether or not the new test is more accurate thanthe current standard? If so, are you clear about what the current standard is?
Question formulation also involves deciding what type of question you areasking. Is it a question about an intervention, diagnostic accuracy, aetiology,prediction or prognosis, or an economic question? The multiple perspectives ofhealth service providers, consumers and methodologists may be helpful ingetting the question right.
Finding studies
The aim of a systematic review is to answer a question based on all the bestavailable evidence — published and unpublished. Being comprehensive andsystematic is important in this critical, and perhaps most difficult, phase of asystematic review. Finding some studies is usually easy — finding all relevantstudies is almost impossible. However, there are a number of methods andresources that can make the process easier and more productive.

How to review the evidence4
Appraisal and selection of studies
The relevant studies identified usually vary greatly in quality. A critical appraisalof each of the identified potentially relevant studies is therefore needed, so thatthose of appropriate quality can be selected. To avoid a selection that is biasedby preconceived ideas, it is important to use a systematic and standardisedapproach to the appraisal of studies.
Summary and synthesis of relevant studies
Although a quantitative synthesis is often desirable, a comprehensive and clearsummary of the high quality studies relevant to a particular question may besufficient for synthesis and decision making. The initial focus should be ondescribing the study’s design, conduct and results in a clear and simple manner— usually in a summary table. Following this, some summary plots are helpful,particularly if there are a large number of studies. Finally, it may be appropriateto provide a quantitative synthesis. However, as indicated above, this is neithera sufficient nor a necessary part of a systematic review.
Determining the applicability of results
Following the summary and synthesis of the studies, the next step is to askabout the overall validity, strength and applicability of any results andconclusions. How and to whom are the results of the synthesis applicable? Howwill the effects vary in different populations and individuals? This final step willbe only briefly mentioned in this guide because it is the principal focus ofanother handbook in this series (How to Use the Evidence: Assessment andApplication of Scientific Evidence, NHMRC 2000a).
Reviewing and appraising the economics literature
Review and appraisal of the economics literature is an essential step inconducting an economic evaluation for clinical practice guidelines. Thisspecialist area of evaluation is essential in developing a clinical practice guidelineand is dealt with in detail in a separate handbook (How to Compare the Costs andBenefits: Evaluation of the Economic Evidence, NHMRC 2000b).
How much work is a systematic review?
An analysis of 37 meta-analyses done by Allen and Olkin (1999) of MetaWorks,a company based in Massachusetts (USA) that specialises in doing systematicreviews, showed that the average hours for a review were 1139 (median 1110)— or about 30 person-weeks of full-time work — but this ranged from 216 to2518 hours. The breakdown was:
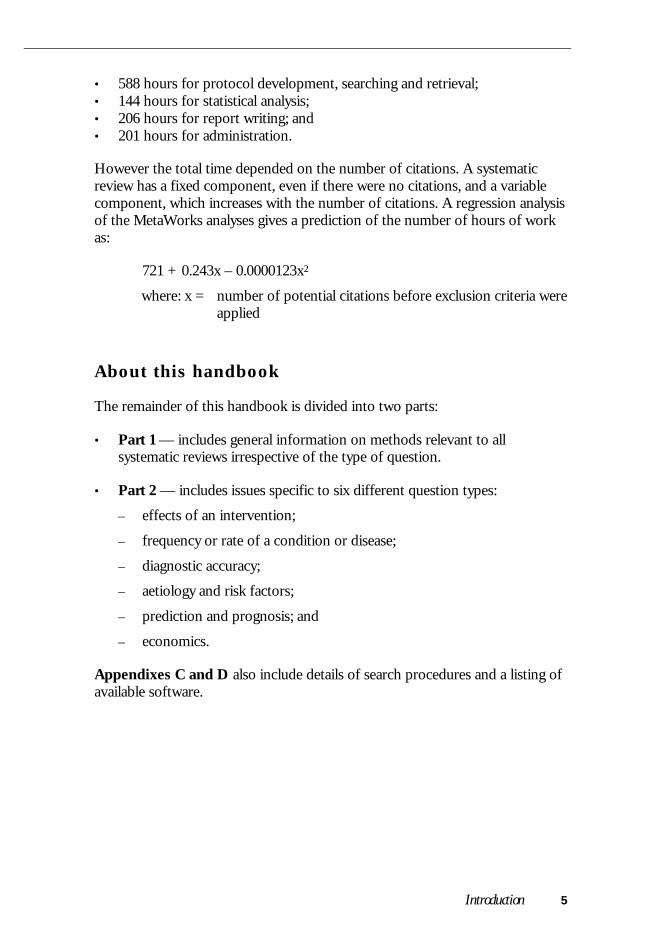
Introduction 5
• 588 hours for protocol development, searching and retrieval;• 144 hours for statistical analysis;• 206 hours for report writing; and• 201 hours for administration.
However the total time depended on the number of citations. A systematicreview has a fixed component, even if there were no citations, and a variablecomponent, which increases with the number of citations. A regression analysisof the MetaWorks analyses gives a prediction of the number of hours of workas:
721 + 0.243x – 0.0000123x2
where: x = number of potential citations before exclusion criteria wereapplied
About this handbook
The remainder of this handbook is divided into two parts:
• Part 1 — includes general information on methods relevant to allsystematic reviews irrespective of the type of question.
• Part 2 — includes issues specific to six different question types:
– effects of an intervention;
– frequency or rate of a condition or disease;
– diagnostic accuracy;
– aetiology and risk factors;
– prediction and prognosis; and
– economics.
Appendixes C and D also include details of search procedures and a listing ofavailable software.

Part 1
General methods
9
1 THE QUESTION
1.1 What types of questions can be asked?
In this handbook we will examine six types of health care questions associatedwith the following issues:
• interventions: ‘What are the effects of an intervention?’
• frequency or rate of a condition or disease: ‘How common is a particular conditionor disease in a specified group in the population?’
• diagnostic test performance: ‘How accurate is a sign, symptom, or diagnostic testin predicting the true diagnostic category of a patient?’
• aetiology and risk factors: ‘Are there known factors that increase the risk of the
• prediction and prognosis: ‘Can the risk for a patient be predicted?’
• economics: ‘What are the overall costs of using the procedure?’
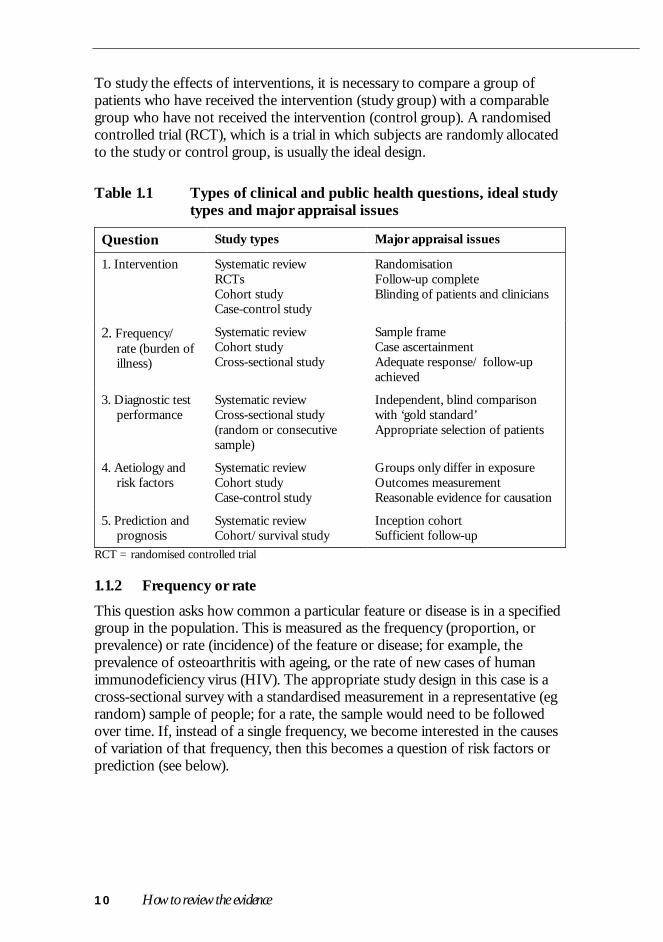
Answering each type of question requires different study designs, andconsequently different methods of systematic review. A thoroughunderstanding of the appropriate study types for each question is therefore vitaland will greatly assist the processes of finding, appraising, and synthesisingstudies from the literature. A summary of the appropriate study types for eachquestion and also the issues that are important in the appraisal of the studies isgiven in Table 1.1. A summary of the possible study types for questions ofintervention effectiveness are shown in Table 1.2 and are described in moredetail in another handbook in this series (How to Use the Evidence: Assessment andApplication of Scientific Evidence, NHMRC 2000a). General information on how tofind and review studies is given in the remainder of Part 1 with further detailsfor each question type in Part 2.
1.1.1 Interventions
An intervention will generally be a therapeutic procedure such as treatment witha pharmaceutical agent, surgery, a dietary supplement, a dietary change orpsychotherapy. Some other interventions are less obvious, such as earlydetection (screening), patient educational materials, or legislation. The keycharacteristic is that a person or their environment is manipulated in order tobenefit that person.
10 How to review the evidence
To study the effects of interventions, it is necessary to compare a group ofpatients who have received the intervention (study group) with a comparablegroup who have not received the intervention (control group). A randomisedcontrolled trial (RCT), which is a trial in which subjects are randomly allocatedto the study or control group, is usually the ideal design.
Table 1.1 Types of clinical and public health questions, ideal studytypes and major appraisal issues
Question Study types Major appraisal issues
1. Intervention Systematic reviewRCTsCohort studyCase-control study
RandomisationFollow-up completeBlinding of patients and clinicians
2. Frequency/rate (burden ofillness)
Systematic reviewCohort studyCross-sectional study
Sample frameCase ascertainmentAdequate response/ follow-upachieved
3. Diagnostic testperformance
Systematic reviewCross-sectional study(random or consecutivesample)
Independent, blind comparisonwith ‘gold standard’Appropriate selection of patients
4. Aetiology andrisk factors
Systematic reviewCohort studyCase-control study
Groups only differ in exposureOutcomes measurementReasonable evidence for causation
5. Prediction andprognosis
Systematic reviewCohort/survival study
Inception cohortSufficient follow-up
RCT = randomised controlled trial
1.1.2 Frequency or rate
This question asks how common a particular feature or disease is in a specifiedgroup in the population. This is measured as the frequency (proportion, orprevalence) or rate (incidence) of the feature or disease; for example, theprevalence of osteoarthritis with ageing, or the rate of new cases of humanimmunodeficiency virus (HIV). The appropriate study design in this case is across-sectional survey with a standardised measurement in a representative (egrandom) sample of people; for a rate, the sample would need to be followedover time. If, instead of a single frequency, we become interested in the causesof variation of that frequency, then this becomes a question of risk factors orprediction (see below).
The question 11
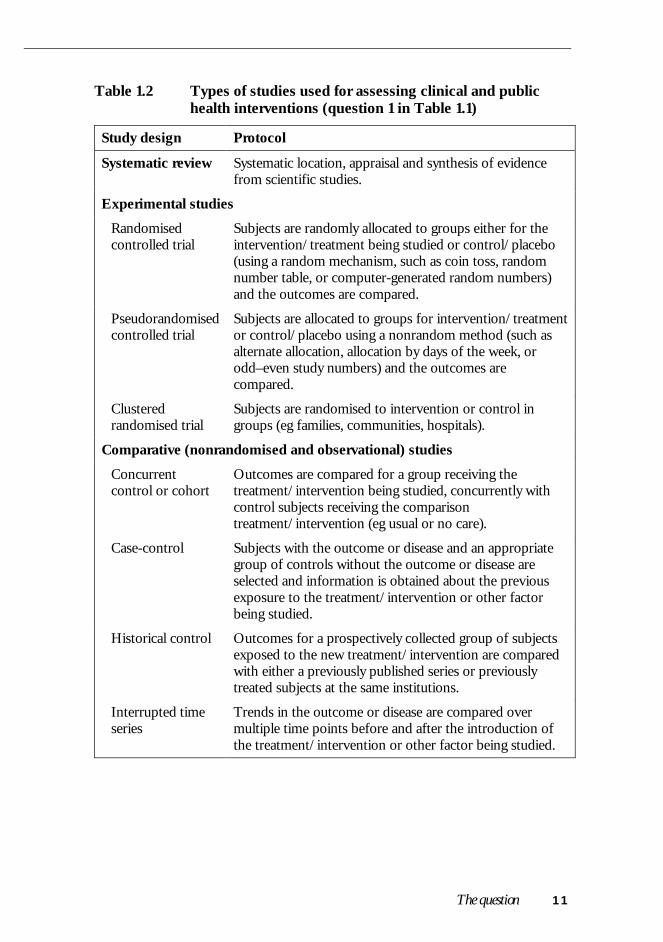
Table 1.2 Types of studies used for assessing clinical and publichealth interventions (question 1 in Table 1.1)
Study design Protocol
Systematic review Systematic location, appraisal and synthesis of evidencefrom scientific studies.
Experimental studies
Randomisedcontrolled trial
Subjects are randomly allocated to groups either for theintervention/treatment being studied or control/placebo(using a random mechanism, such as coin toss, randomnumber table, or computer-generated random numbers)and the outcomes are compared.
Pseudorandomisedcontrolled trial
Subjects are allocated to groups for intervention/treatmentor control/placebo using a nonrandom method (such asalternate allocation, allocation by days of the week, orodd–even study numbers) and the outcomes arecompared.
Clusteredrandomised trial
Subjects are randomised to intervention or control ingroups (eg families, communities, hospitals).
Comparative (nonrandomised and observational) studies
Concurrentcontrol or cohort
Outcomes are compared for a group receiving thetreatment/intervention being studied, concurrently withcontrol subjects receiving the comparisontreatment/intervention (eg usual or no care).
Case-control Subjects with the outcome or disease and an appropriategroup of controls without the outcome or disease areselected and information is obtained about the previousexposure to the treatment/intervention or other factorbeing studied.
Historical control Outcomes for a prospectively collected group of subjectsexposed to the new treatment/intervention are comparedwith either a previously published series or previouslytreated subjects at the same institutions.
Interrupted timeseries
Trends in the outcome or disease are compared overmultiple time points before and after the introduction ofthe treatment/intervention or other factor being studied.

12 How to review the evidence
Table 1.2 (contd)
Study design Protocol
Other observational studies
Case series A single group of subjects are exposed to thetreatment/intervention.
– post-test Only outcomes after the intervention are recorded in thecase series, so no comparisons can be made.
– pretest/post- test
Outcomes are measured in subjects before and afterexposure to the treatment/intervention for comparison (alsocalled a ‘before-and-after’ study).
Note: A definition of cross-sectional study, which is not included here as it is not useful for assessingintervention studies, is given in the Glossary.
1.1.3 Diagnostic test performance
If there is good randomised trial evidence that an intervention for a particularcondition works then it may be necessary to assess how accurately the conditioncan be diagnosed from a sign, symptom, or diagnostic test. To do this, the idealstudy design is a representative sample of people in whom the new test iscompared with an appropriate ‘gold standard’ or reference standard (cross-sectional study). The most commonly used measures of test performance arethe sensitivity and specificity of the test.
If we move from an interest in test performance to an interest in the effects onpatient outcomes, then the question becomes one of intervention (that is, theeffects on patients of using or not using the test, as is the case for populationscreening). However, diagnostic test performance can often be used as asurrogate to predict the benefits to patients.
1.1.4 Aetiology and risk factors
This type of question is concerned with whether a particular factor, such aspatient characteristic, laboratory measurement, family history, etc, is associatedwith the occurrence of disease or adverse outcomes. To answer this question aclear association between the factor and the disease must first be established.The most appropriate study types are a long-term follow-up of a representativeinception cohort or an approximation to this through sampling for a case-control study (cohort or case-control study).
If a clear association is shown, the next stage is to determine whether thatassociation is causal, that is, whether the factor under consideration causes thedisease or outcome of interest or is merely associated with it for other reasons.

The question 13
This involves issues beyond the degree of association, such as the dose–response relationship and biological plausibility.
1.1.5 Prediction and prognosis
This question seeks to determine the risk to the person by putting togetherseveral risk factors and using the combined information to decide the level ofrisk to the person. Unlike the question of aetiology, causation is not so crucial.Strongly predictive risk markers are also useful. The most appropriate studytype is a long-term follow-up of a representative inception cohort (cohort orsurvival study).
1.1.6 Economics
In all of the previous questions, one of the outcomes of interest is often thecost. For example, the costs of an intervention and potential downstream costmay be offset by improved patient outcomes with reduced need for furthermedical treatment.
The issues of economic evaluation and cost-effectiveness are discussed brieflyin Section 6.5 of this handbook and in greater detail in another handbook in thisseries (How to Compare the Costs and Benefits: Evaluation of the Economic Evidence,NHMRC 2000b).
1.2 What is the relevant question?
A well-formulated question generally has three parts:
• the study factor (eg the intervention, diagnostic test, or exposure);
• the population (the disease group or a spectrum of the well population); and
• the outcomes.
Since we will often be interested in all outcomes, the first two parts of thequestion may be sufficient (see Section 2.2).
1.3 How focused should the question be?
The question should be sufficiently broad to allow examination of variation inthe study factor (eg intensity or duration) and across populations. For example:
‘What is the mortality reduction in colorectal cancer from yearly faecal occult bloodscreening in 40–50-year-old females?’ is too narrow.

14 How to review the evidence
However:
‘What is the effect of cancer screening on the general population?’ is clearly toobroad and should be broken down into cancer-specific screeningquestions.
A better question may be:
‘What is the mortality reduction in colorectal cancer from faecal occult blood screeningin adults?’ which allows the effects of screening interval, age group andgender to be studied.

15
2 FINDING RELEVANT STUDIES
Finding all relevant studies that have addressed a single question is not easy.There are currently over 22,000 journals in the biomedical literature.MEDLINE indexes only 3700 of these, and even the MEDLINE journalsrepresent over 200 metres of journals per year.
Beyond sifting through this mass of literature, there are problems of duplicatepublications and accessing the ‘grey literature’, such as conference proceedings,reports, theses and unpublished studies. A systematic approach to this literatureis essential in order to identify all the best evidence available that addresses thequestion.
As a first step, it is helpful to find out if a systematic review has already beendone or is under way. If not, published original articles need to be found.
2.1 Finding existing systematic reviews
Published reviews may answer the question, or at least provide a starting pointfor identifying the studies. Finding such reviews takes a little effort. A generalMEDLINE search strategy by Hunt and McKibbon (1997) relevant to allquestion-types is given in Appendix C. However, for interventions, a checkshould also be made of the Cochrane Library for a completed Cochrane review,a Cochrane protocol (for reviews under way), or a nonCochrane review (in theDatabase of Abstracts and Reviews [DARE] in the Cochrane Library, compiledby the Centre for Reviews and Dissemination at York (United Kingdom).
2.2 Finding published primary studies
It is usually easy to find a few relevant articles by a straightforward literaturesearch, but the process becomes progressively more difficult as we try toidentify additional articles. Eventually, you may sift through hundreds of articlesin order to identify one further relevant study.
There are no magic formulae to make this process easy, but there are a fewstandard tactics, which, together with the assistance of a librarian experienced inthe biomedical literature, can make your efforts more rewarding.
2.2.1 Breaking down the study question into components
A central tactic is to take a systematic approach to breaking down the studyquestion into components using a Venn diagram. The Venn diagram for the

16 How to review the evidence
question What is the mortality reduction in colorectal cancer from faecal occult bloodscreening in adults? is shown in Figure 2.1.
Question: What is the mortality reduction in colorectal cancer fromfaecal occult blood screening in adults?
Figure 2.1 Venn diagram for colorectal screening
Once the study question has been broken into its components, they can becombined using ‘AND’ and ‘OR’. For example, in Figure 2.1:
(mortality AND screen) — represents the overlap between these twoterms — retrieves only articles that use both terms.
(screen AND colorectal neoplasm AND mortality) — representsthe small area where all three circles overlap — retrieves only articleswith all three terms.
Complex combinations are possible. For example, the following combinationcaptures all the overlap areas between the circles:
(mortality AND screen) OR (mortality AND colorectalneoplasms) OR (screen AND colorectal neoplasms)
Although the overlap of all three parts will generally have the best concentrationof relevant articles, the other areas may still contain many relevant articles.Hence, if the disease AND study factor combination (solid circles in figure) ismanageable, it is best to work with this and not further restrict by, for example,using outcomes (dotted circle in figure).
2.2.2 Use of synonyms
When the general structure of the question is developed it is worth looking forsynonyms for each component. This process is illustrated in Table 2.1.

Finding relevant studies 17
Table 2.1 Using synonyms of components of the three-part questionto devise a literature search
Question: What is the mortality reduction in colorectal cancer from faecal occult bloodscreening in adults?
Question part Question term Synonyms
Population/setting Adult, human –
Study factor Screening, colorectalcancer
Screen, early detection,bowel cancer
Outcome a Mortality Death*, survival
Ideal design a Methodological terms* = wildcard symbol (finds words with the same stem)a Both outcome and design are options needed only when the search results are unmanageable
Thus a search string might be:
(screen* OR early detection) AND (colorectal cancer OR bowelcancer) AND (mortality OR death* OR survival)
The term ‘screen*’ is shorthand for words beginning with screen, for example,screen, screened, screening. (Note: the ‘wildcard’ symbol varies betweensystems, eg it may be an asterisk [*], or colon [:].)
In looking for synonyms you should consider both textwords and keywords inthe database. The MEDLINE keyword system, known as MeSH (MedicalSubject Heading), has a tree structure that covers a broad set of synonyms veryquickly. The ‘explode’ (exp) feature of the tree structure allows you to capturean entire subtree of MeSH terms within a single word. Thus for the colorectalcancer term in the above search, the appropriate MeSH term might be:
colonic neoplasm (exp)
with the ‘explode’ incorporating all the MeSH tree below colonic neoplasm, viz:
colorectal neoplasms
colonic polyps
adenomatous polyposis coli
colorectal neoplasms
colorectal neoplasms, hereditary nonpolyposis
sigmoid neoplasms
While the MeSH system is useful, it should supplement rather than usurp theuse of textwords so that incompletely coded articles are not missed.

18 How to review the evidence
2.2.3 Snowballing
The process of identifying papers is an iterative one. It is best to devise astrategy on paper initially, as illustrated in Table 2.1. However, this willinevitably miss useful terms, and the process will need to be repeated andrefined. The results of the initial search are used to retrieve relevant papers,which can then be used in two ways to identify missed papers:
• the bibliographies of the relevant papers can be checked for articles missedby the initial search; and
• a citation search, using the Science Citation Index,1 can be conducted toidentify papers that have cited the identified relevant studies, some of whichmay be subsequent primary research.
These ‘missed’ papers are invaluable — they provide clues on how the searchmay be broadened to capture further papers (eg by studying the MeSHkeywords that have been used). The whole procedure may then be repeatedusing the new keywords identified. This iterative process is sometimes referredto as ‘snowballing’.
2.2.4 Handsearching
If the relevant articles appear in a limited range of journals or conferenceproceedings, it may be feasible and desirable to search these by hand. This isobviously more important for unindexed or very recent journals, but may alsopick up relevant studies not easily identified from title or abstracts. Fortunately,the Cochrane Collaboration is systematically handsearching a number ofjournals to identify controlled trials and a master list is maintained on theInternet.2 This should be checked before undertaking your own handsearch.However, for other question and study types there has been no such systematicsearch.
2.2.5 Methodological terms
MEDLINE terms cover not only specific content but also a number of usefulterms on study methodology. For example, if we are considering questions oftherapy, many randomised trials are tagged in MEDLINE by the specificmethodological term:
1 www.isinet.com/products/basic
2 www.cochrane.org/
Finding relevant studies 19
randomized-controlled-trials3 in [publication type]
or as:
controlled-clinical trials in [publication type]
However, many studies do not have the appropriate methodological tag. TheCochrane Collaboration and the United States National Library of Medicine(NLM) are working on correctly retagging the controlled trials, but this is not sofor other study types.
2.2.6 Methodological filters
An appropriate ‘methodological filter’ may help confine the retrieved studies toprimary research. For example, if you are interested in whether screeningreduces mortality from colorectal cancer (an intervention), then you may wishto confine the retrieved studies to controlled trials. The idea of methodologicalterms may be extended to multiple terms that attempt to identify particularstudy types. One very useful tool for a noncomprehensive but good initialsearch is available using the NLM’s free Internet version of MEDLINEPubMed — the Clinical Queries section,4 which has inbuilt search filters basedon methodological search techniques developed by Haynes et al (1994). Thefilters are described in Appendix C. They offer four study categories (aetiology,prognosis, treatment, diagnosis) and the choice of emphasising sensitivity orspecificity in the search. Other methodological filters are discussed in Part 2 foreach type of question.
2.2.7 Use of different databases
There are a number of other databases apart from MEDLINE; selectiondepends on the content area and the type of question being asked. For example,there are databases for nursing and allied health studies such as CINHAL andfor psychological studies such as Psyclit. If it is a question of intervention, thenthe Controlled Trials Registry within the Cochrane Library is a particularlyuseful resource. This issue is further discussed in the specific question types inPart 2 of this handbook.
3 Use of ‘ize’ spelling of randomised is necessary when using MEDLINE
4 www.ncbi.nlm.nih.gov/PubMed/clinical.html

20 How to review the evidence
2.3 Finding unpublished primary studies
To reduce publication bias (see Section 2.4), it is important to search forunpublished studies. There are two approaches to finding unpublished studies:searching relevant databases and contacting experts.
2.3.1 Searching relevant databases
An appendix in the Cochrane Handbook (available on the Cochrane LibraryCD) contains a list of about 30 clinical trials registries with completed andongoing studies registered in specialised areas such as acquired immunedeficiency syndrome (AIDS) and cancer.
For other question types, information will be more difficult to find, but anyavailable databases should be checked — in particular, research funding bodiesmay be able to provide a list of research. However, this has rarely beensystematically compiled outside controlled trials. An exception is theInternational Agency for Research on Cancer (IARC) bibliography of ongoingcancer epidemiology research (Sankaranarayanan et al 1996).
2.3.2 Writing to experts
Another option is to contact the principal investigators of relevant studiesdirectly, asking whether they know of additional studies.
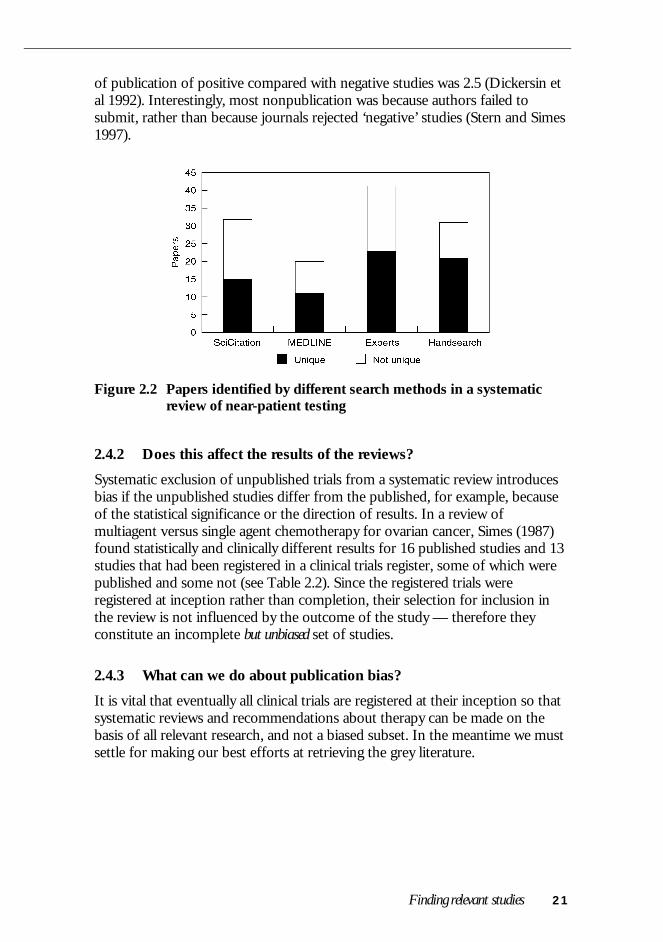
However, the usefulness of writing to experts varies. An analysis of a recentreview of the value of near-patient testing (that is, diagnostic tests that can bedone entirely at the clinic, such as dipstick urine tests) (McManus et al 1998)showed that of 75 papers eventually identified, nearly one-third were uniquelyidentified by contacting experts. The data are shown in Figure 2.2, which alsoillustrates the general point that it is worth using multiple sources. However,near-patient testing is an area of emerging technology, and a larger proportionthan usual of papers were possibly unpublished, published in less commonsources, or presented at conferences.
2.4 Publication bias — a crucial problem
2.4.1 What is publication bias?
If ‘positive’ studies are more likely to be published than ‘negative’ studies thenany review (traditional or systematic) of the published literature must be biasedtowards a ‘positive’ result. This is the essence of publication bias — the positivecorrelation between the results of the study and our ability to find that study.For example, a follow-up of 737 studies approved by the Institutional ReviewBoard at Johns Hopkins University found that the odds ratio for the likelihood
Finding relevant studies 21
of publication of positive compared with negative studies was 2.5 (Dickersin etal 1992). Interestingly, most nonpublication was because authors failed tosubmit, rather than because journals rejected ‘negative’ studies (Stern and Simes1997).
Figure 2.2 Papers identified by different search methods in a systematicreview of near-patient testing
2.4.2 Does this affect the results of the reviews?
Systematic exclusion of unpublished trials from a systematic review introducesbias if the unpublished studies differ from the published, for example, becauseof the statistical significance or the direction of results. In a review ofmultiagent versus single agent chemotherapy for ovarian cancer, Simes (1987)found statistically and clinically different results for 16 published studies and 13studies that had been registered in a clinical trials register, some of which werepublished and some not (see Table 2.2). Since the registered trials wereregistered at inception rather than completion, their selection for inclusion inthe review is not influenced by the outcome of the study — therefore theyconstitute an incomplete but unbiased set of studies.
2.4.3 What can we do about publication bias?
It is vital that eventually all clinical trials are registered at their inception so thatsystematic reviews and recommendations about therapy can be made on thebasis of all relevant research, and not a biased subset. In the meantime we mustsettle for making our best efforts at retrieving the grey literature.

22 How to review the evidence
Table 2.2 Comparison of published and registered studies formultiagent versus single agent chemotherapy for ovariancancer
Published studies Registered studiesa
Number of studies 16 13
Survival ratio 1.16 1.05
95% confidenceinterval
1.06–1.27 0.98–1.12
Probability (P-value) 0.02 0.25a Studies registered in a clinical trial registry at initiation (ie before the results were known)Source: Simes (1987)
These methods include using existing clinical trials registries (a list of registriesand their contact details are available in the Cochrane Handbook in theCochrane Library), scanning major conference proceedings, and contactingexperts and researchers working in the area of a particular question to ask ifthey know of other relevant published or unpublished research. In Section 4, onsynthesis of the studies, we will also describe some methods of identifying thepotential significance of publication bias based on the identified studies, such as‘funnel’ plots. However, these only help to diagnose the problem of bias, not tocure or prevent it.
2.4.4 Duplicate publications
The converse of an unpublished study is a study that is published several times.This is often, but not always, obvious. For example, in a review of the effect ofthe drug ondansetron on postoperative vomiting, Tramer et al (1997) found17% of trials had duplicate reports. Nine trials of oral ondansetron werepublished as 16 reports, and 19 trials of intravenous ondansetron werepublished as 25 reports. One multicentre trial had published four separatereports with different first authors. Most surprisingly, four pairs of identicaltrials had been published that had nonoverlapping authorships!
Unfortunately, there is no simple routine means of detecting such duplicatesexcept by some careful detective work. Occasionally, it will be necessary towrite to the authors. Clearly, if duplicate publications represent several updatesof the data, then the most recent should be used.

23
3 APPRAISING AND SELECTING STUDIES
Readers will naturally wish to know how good the reviewed research is and whyyou have excluded some studies that address the question at issue. In bothsituations you need to explain your judgments, which will usually be based onyour assessment of study quality and applicability.
3.1 Standardising the appraisal
Providing an explicit and standardised appraisal of the studies that have beenidentified is important for two reasons. First, a systematic review should try tobase its conclusions on the highest quality evidence available. To do thisrequires a valid and standardised procedure to select from the large pool ofstudies identified so that only the relevant and acceptable quality studies areincluded in the review. Second, it is important to convey to the reader thequality of the studies included as this indicates the strength of evidence for anyrecommendation made.
3.1.1 What study features should be assessed?
Overall the study features that are most important to assess are those thatinvolve selection and measurement bias, confounding, and follow-up ofparticipants. In Part 2 these features are examined for each question type underthe following headings:
A. Has selection bias (including allocation bias in RCTs) been minimised?
B. Have adequate adjustments been made for residual confounding?
C. Was follow-up for final outcomes adequate?
D. Has measurement or misclassification bias been minimised?
3.1.2 Is it important to have a structured appraisal?
If unstructured appraisals are made, there is a tendency to look more critically atthe studies whose conclusions we dislike. For example, 28 reviewers were askedto assess a single (fabricated) ‘study’ but were randomly allocated to receiveeither the ‘positive’ or ‘negative’ version (Mahoney 1977). The identicalmethods section of these fabricated versions was rated significantly worse bythe reviewers of the ‘negative’ study compared with the ‘positive’ study. Hence,it is essential to appraise all papers equally. This can be done in part by using astandardised checklist. Part 2 of this handbook outlines the important appraisal

24 How to review the evidence
issues for the different question types outlined in Section 1.1 and shows specificchecklists for some of the question types.
These standardised checklists allow assessment of how important measurementand selection biases were avoided.
3.1.3 How many reviewers are required?
Using more than one reviewer is rather like getting a second opinion on amedical diagnosis. Because of the importance of appropriately selecting studies,at least two reviewers should be used. Each reviewer should independently readand score each of the studies that can potentially be included in the review.They should then meet to resolve any discrepancies between the scoring of thepaper by open discussion about their justification for each of the scores. Thisdiscussion is a useful educational procedure in itself, which probably increasesthe consistency and accuracy of the appraisals of the paper.
3.1.4 Is it necessary to do the appraisal ‘blind’ to the outcome of thestudy?
Some meta-analysts have suggested that all appraisals should be done blind tothe results of the individual study. This requires removing identification of theauthors and journal, and all reference to any results from the paper. Generally,the methods and the results section of the paper are sufficient to provide theinformation necessary for the appraisal (with the explicit outcomes ‘blackened
However, this approach is very time consuming. The effect has been examinedin two empirical studies, which suggest that the benefit, if any, in bias reductionby using the blinding process is small (Berlin 1997). At present there is not aconsensus about whether the gain is worth the effort. However, for particularlycontroversial and important issues, such a blinded appraisal should beconsidered.
3.2 Using the quality appraisal
The first and most important use of the quality appraisal will be to decidewhether the study is included at all in the main analysis. For example, with aquestion of treatment, only RCTs may be selected. Deciding whether a study israndomised or not can be difficult, and hence it is very valuable to havereviewers to look carefully at the paper and come to a conclusion about this.
After the decision to include or exclude the study has been made, there arethree further uses for the appraisal scores or ‘quality weights’, as follows.

Appraising and selecting studies 25
Grouping or sorting by design and/or quality [RECOMMENDED]It is useful to consider an exploratory analysis on the design or quality featuresof studies. Studies can be categorised by design (eg randomised, cohort, case-control) or by important quality features (eg blinded versus unblinded) and thenplotted in subgroups, with or without summary estimates provided for each ofthese design or quality groups. Does this make a difference to the results seen?For example:
• Do the blinded studies give different results to the unblinded studies?
• Do the studies with good randomisation procedures give different resultsfrom those with doubtful randomisation procedures?
A sensitivity analysis on quality has been suggested by Detsky et al (1992): acumulative meta-analysis is done looking at the best single study, the best twosingle studies combined, the best three studies combined, etc. However, recentempirical work (Juni et al 1999) showed that different summary quality scoresgive highly inconsistent results. Since flaws in one feature, such as follow-up,may not give a similar size or direction of bias to another design feature, such asblinding, analysing summary scores is problematic. Hence, we suggest the mainfocus should be on individual quality features.
Meta-regression on quality items [OPTIONAL]It is possible to extend this further by looking at all the features of qualitysimultaneously in a so-called meta-regression. However, because there willusually be a limited number of studies, such techniques are probably notjustified in most meta-analyses.
Weighting by quality [NOT RECOMMENDED]Some analysts have suggested using the quality score to weight the contributionof particular studies to the overall estimate. This is inappropriate — it neitheradjusts for nor removes the bias of poor studies, but merely reduces it slightly.
Further information on the appraisal for each question type is given in Part 2.The Journal of the American Medical Association ‘Users’ Guides’ series (Guyattand Rennie 1993; Guyatt et al 1993,1994) is also a good source of furtherinformation.
27
4 SUMMARISING AND SYNTHESISING THESTUDIES
4.1 Presenting the results of the studies(data extraction)
4.1.1 Tabular summary
It is helpful to produce tabular and graphical summaries of the results of eachof the individual studies. An example of a summary table for an interventionquestion is shown in Part 2 of this handbook (Section 6).
4.1.2 Graphical presentation
The most common and useful graphical presentation of the results of individualstudies is a point estimate plot with the 95% confidence interval (CI) for eachstudy (known as a ‘forest plot’). A value of less than 1.0 indicates that theintervention studied is beneficial. A forest plot can be done for the relative riskreduction or a specific measure such as reduction in blood pressure. Studiesshould be sorted from those with the broadest to those with the narrowestconfidence interval. If there is a summary estimate, this should be nearest thestudies with the narrowest confidence intervals.
In addition, because studies with broad confidence intervals draw greater visualattention, it is useful to indicate the contribution of the study visually by the sizeof the symbol at the summary estimate. The area of the symbol should be madeproportional to the precision of the study (more specifically to the inverse ofthe variance of the study’s estimate). This means that the diameter of eachsymbol is proportional to the inverse of the standard error of the study’sestimate. These principles are illustrated in Figure 4.1, which shows the resultsof the systematic review of colorectal cancer screening (Towler et al 1998).
4.2 Synthesis of study results
Except in rare circumstances, it is not advisable to pool the results of theindividual studies as if they were one common large study. This can lead tosignificant biases because of confounding by the distribution of the study factorand the outcome factor.

28 How to review the evidence
Notes:Dotted vertical line = the combined estimateTotal = 95% confidence interval of the combined estimate
Figure 4.1 Relative mortality from colorectal cancer in screened versusunscreened (control) groups from four randomised trials offaecal occult blood screening (from Towler et al 1998)
However, if the studies are considered sufficiently homogeneous in terms of thequestion and methods, and this is supported by a lack of evidence of statisticalheterogeneity (see Section 4.3), then it may be appropriate to combine theresults to provide a summary estimate. The method for combining studies willvary depending upon the type of questions asked and the outcome measuresused. Outcome measures are described in detail in another handbook in thisseries (How to Use the Evidence: Assessment and Application of Scientific Evidence,NHMRC 2000a) and are summarised in Table 4.1. A further measure, thesummary receiver–operator curve (ROC) is a measure of diagnostic testaccuracy and is described in Section 8.
An estimate of the effect for each individual study should be obtained, alongwith a measure of random error (variance or standard error). The individualstudies can then be combined by taking a weighted average of the estimates foreach study, with the weighting being based on the inverse of the variance ofeach study’s estimate. For example, Figure 4.1 shows, for colorectal cancerscreening, the combined estimate (the dotted vertical line) and its 95% CI (thehorizontal line marked ‘total’).

Summarising and synthesising the studies 29
Table 4.1 Some possible outcome measures of study effectsOutcomemeasures
Description
Continuous outcomes
Differencebetween groupmeans
Difference between treatment and control groups in mean values ofoutcome variable.
Standardiseddifference
Differences between the treatment and control group means for eachstudy, standardised by an estimate of the standard deviation of themeasurements in that study. This removes the effect of the scale ofmeasurement, but can be difficult to interpret.
Weighteddifference inmeans
Average (pooled) difference between treatment and control groups inmean values across a group of studies using the same scale ofmeasurement for the outcome (eg blood pressure measured in mm Hg).
Standardisedweighted meandifference
Average (pooled) standardised difference between treatment andcontrol groups across a group of studies, where the outcome wasmeasured using different scales with no natural conversion to acommon measure (eg different depression scales or different quality-of-life instruments).
Binary outcomes
Risk difference(RD)
Difference (absolute) between treatment and control groups in theproportions with the outcome. If the outcome represents an adverseevent (such as death) and the risk difference is negative (below zero),this suggests that the treatment reduces the risk. In this situation therisk difference, without the negative sign, is called the absolute riskreduction.
Relative risk orrisk ratio (RR)
Ratio of the proportions in the treatment and control groups with theoutcome. This expresses the risk of the outcome in the treatment grouprelative to that in the control group. If the relative risk is below 1, anadverse outcome, this suggests that the treatment reduces the risk, andits complement (1 – relative risk) or relative risk reduction is often used.
Odds ratio(OR)
Ratio of the odds of the outcome in the treatment group to thecorresponding odds in the control group. Again, for an adverseoutcome, an odds ratio below 1 indicates that the treatment reduces therisk. In some studies (eg population-based case-control studies) theodds ratio is a reasonable estimate of the relative risk. It is not a goodestimate when the outcome is common or is measured as a prevalence.
Hazard ratio(HR)
Ratio of the hazards in the treatment and control groups (when time tothe outcome of interest is known); where the hazard is the probabilityof having the outcome at time t, given that the outcome has notoccurred up to time t. Sometimes, the hazard ratio is referred to as therelative risk. For an adverse outcome, a hazard ratio less than unityindicates that the treatment reduces the risk.
Number neededto treat (NNT)
Number of patients who have to be treated to prevent one event. It iscalculated as the inverse of the risk difference without the negative sign(NNT = 1/RD). When the treatment increases the risk of the harmfuloutcome, then the inverse of the risk difference is called the numberneeded to harm (NNH = 1/RD).
Note: Further discussion of outcome measures is given in the handbook How to Use the Evidence:Assessment and Application of Scientific Evidence in this series (NHMRC 2000a).

30 How to review the evidence
Although this principle is straightforward, a number of statistical issues make itmore complicated. For example, the measures of effect have to be on a scalethat provides an approximate normal distribution to the random error (eg byusing the log odds ratio rather than just the odds ratio). Allowance must also bemade for zeros in the cells of tables cross-classifying the study factor and theoutcome factor, or outliers in continuous measurements. Most of the availablemeta-analysis software provides such methods (see Appendix D for examplesof available software). Details of the properties of the various alternativestatistical methods are given in Rothman and Greenland (1998). This handbookaddresses only the general principles.
Further details of methods of synthesis for the different question types aregiven in Part 2. There is no single source of information for statistical methodsof synthesis. The most comprehensive book currently available is the Handbookof Research Synthesis (Cooper and Hedges 1994), which is particularly strong onsynthesis of studies but also covers finding and appraising studies.
4.2.1 Fixed and random effects estimates
Two major categories of summary estimates are the fixed and random effectsestimates. That is, is the true value a single value or does it vary acrosspopulations and circumstances?
• A fixed effect model assumes that there is a single ‘true’ value, which all studiesare attempts to measure but with some imprecision; the fixed effectsummary is a weighted average with weights proportional only to eachstudy’s precision.
• A random effects model assumes that the ‘true’ value varies and attempts toincorporate this variation into the weightings and the uncertainty aroundthe summary estimate. To do this, the model first estimates the underlyingstudy-to-study variation (which is often designated as ‘tau’), which is thenincluded in the weighting for each study.
Mathematically, the fixed effects weights are 1/d2 (where d2 is the variance ofthe studies estimate); the random effects weights are 1/(d2 + tau2). From thiswe can see that:
• if between-study variance is small (tau is near 0) then fixed and randomeffects models are similar; and
• if the between-study variance is large (tau is much greater than d) then theweights for each study become almost equal.

Summarising and synthesising the studies 31
So which model should be used? This is best answered indirectly: if there isminimal between-study variation, the choice does not matter; but if there isconsiderable between-study variation then an explanation should be sought.
If no cause for the variation is found, then, although both models offerinformation, neither model is clearly ‘correct’. The fixed effects model assumesno variation when it demonstrably exists. The random effects model assumesthe studies are a representative (or random) sample for the population ofsituations to which the results will be applied — a fairly unlikely assumption. Sothe emphasis should be not on incorporating variation but on explaining it,which is discussed further in Section 4.3. However, if the variation cannot beexplained, then, if pooling is still relevant, both fixed and random effectsmodels should be presented.
4.3 Assessing heterogeneity
The variation between studies is often considered a weakness of a systematicreview but, if approached correctly, it can be a considerable strength. If theresults are consistent across many studies, despite variation in populations andmethods, then we may be reassured that the results are robust and transferable.If the results are inconsistent across studies then we must be wary ofgeneralising the overall results — a conclusion that a single study cannot usuallyreach. However, any inconsistency between studies also provides an importantopportunity to explore the sources of variation and reach a deeperunderstanding of its causes and control (Thompson 1995).
The causes of a variation in results may be due to personal factors such asgender or genes, disease factors such as severity or stage, variation in the precisemethods of the intervention or diagnostic test, differences in study design orconduct, such as duration and completeness of follow-up, or the quality ofmeasurements.
4.3.1 Measures of heterogeneity
Generally, statistical tests of heterogeneity have low power. Some variation isinevitable, and we are really more interested in the degree and causes ofvariation. The best current measure of the degree of variation is the between-study variance (or tau), which is estimated when fitting a random effects model.This has the advantage of being in the same ‘units’ as the results measure; forexample, if the meta-analysis looked at weight change in kilograms, then the tauis the between-study variance in kilograms. An alternative is to test forheterogeneity using the Cochran chi-square (Cochran Q) and Q divided by thedegrees of freedom (df), where values greater than 1 indicate heterogeneity, asfollows.
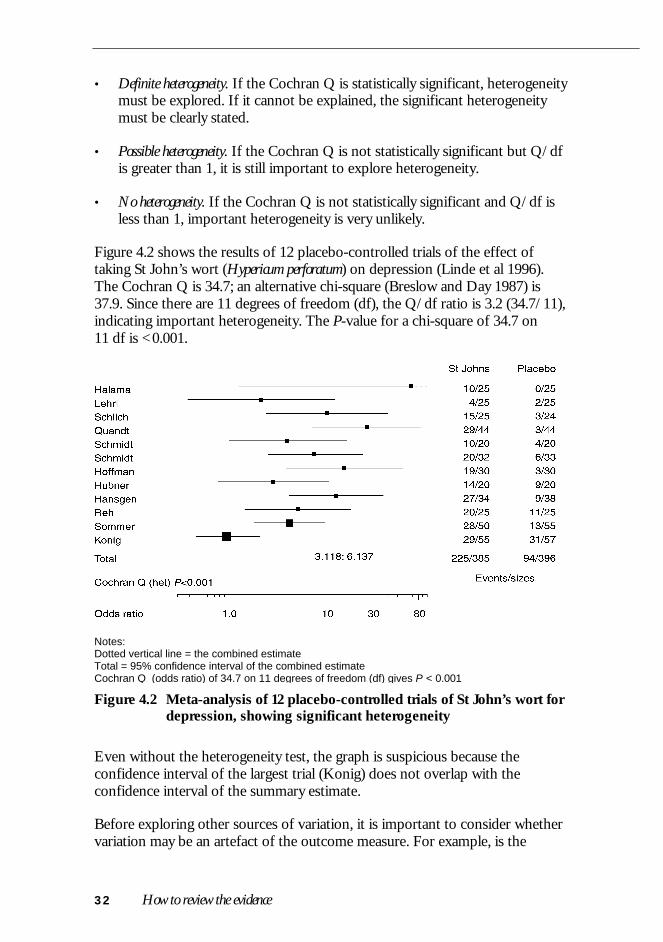
32 How to review the evidence
• Definite heterogeneity. If the Cochran Q is statistically significant, heterogeneitymust be explored. If it cannot be explained, the significant heterogeneitymust be clearly stated.
• Possible heterogeneity. If the Cochran Q is not statistically significant but Q/dfis greater than 1, it is still important to explore heterogeneity.
• No heterogeneity. If the Cochran Q is not statistically significant and Q/df isless than 1, important heterogeneity is very unlikely.
Figure 4.2 shows the results of 12 placebo-controlled trials of the effect oftaking St John’s wort (Hypericum perforatum) on depression (Linde et al 1996).The Cochran Q is 34.7; an alternative chi-square (Breslow and Day 1987) is37.9. Since there are 11 degrees of freedom (df), the Q/df ratio is 3.2 (34.7/11),indicating important heterogeneity. The P-value for a chi-square of 34.7 on11 df is <0.001.
Notes:Dotted vertical line = the combined estimateTotal = 95% confidence interval of the combined estimateCochran Q (odds ratio) of 34.7 on 11 degrees of freedom (df) gives P < 0.001
Figure 4.2 Meta-analysis of 12 placebo-controlled trials of St John’s wort fordepression, showing significant heterogeneity
Even without the heterogeneity test, the graph is suspicious because theconfidence interval of the largest trial (Konig) does not overlap with theconfidence interval of the summary estimate.
Before exploring other sources of variation, it is important to consider whethervariation may be an artefact of the outcome measure. For example, is the

Summarising and synthesising the studies 33
‘effect’ a proportional or absolute effect? If it is proportional, then measuressuch as the relative risk (or odds ratio or hazard ratio) or the percentagereduction (eg in cholesterol or blood pressure) will be appropriate. If it isabsolute, then absolute risk or absolute risk reduction (risk difference) may beappropriate measures.
This question is partly biological and partly empirical. In a recent analysis of 115meta-analyses, it was found that the absolute risk was clearly inappropriate in30% of studies; the relative risk fared better but was still clearly inappropriate in13% of studies (Schmid et al 1998). Hence, an initial check of theappropriateness of the common scale used is essential. In the St John’s wortexample, the Cochran Qs were: 34.7 for the odds ratio, 39.0 for the relative risk,and 41.6 for the risk difference. Hence, the odds ratio minimises the Q, andappears the best choice, but clearly important heterogeneity remains.
The ideal way to study causes of true biological variation (or ‘effectmodification’) is within rather than between studies, because the variation inincidental design features confounds our ability to look at true causes of effectmodification (Gelber and Goldhirsch 1987). For example, if there was onestudy in older men and one in younger women, then the effect of gender isconfounded by the effect of age. If there was one short-term study inCaucasians and one long-term study in Chinese, then the effect of ethnicity isconfounded by study duration. Looking across studies can provide a usefulinitial exploratory analysis, but confirmation by combining the within-studiesanalysis across all studies is then desirable (see information on individual patientdata meta-analysis, below).
In general, the approach to subgroup analysis and effect modification should beto assume similarity unless a difference can be demonstrated. Thus individualsubgroups should NOT be tested for significance of their main effects, butshould be tested for interaction to see whether the subgroups differsignificantly.
The problem is illustrated in Figure 4.3, which shows a hypothetical study thatis clearly statistically significant overall (the confidence interval does not crossthe relative risk of 1.0). If this is now split into two subgroups (1 and 2, whicheach have the identical estimate), group 1 is no longer statistically significant.The correct approach here is to first test whether groups 1 and 2 aresignificantly different. In this case, where their point estimates are the same, it isclear that they will not differ significantly.
4.3.2 Individual patient data meta-analysis
Obtaining the original data from each study makes a number of analysespossible that are difficult or impossible if based only on summary measuresfrom each study.

34 How to review the evidence
Figure 4.3 Hypothetical study showing combined and subgroup analysis:subgroups 1, 2 and the combined effect are all equivalent, butonly group 2 and the combined groups are statisticallysignificant
For example, combined survival analysis is best done using individual patientdata (Whitehead and Whitehead 1991). As mentioned above, the ideal approachto subgroup analysis is using individual patient data. However, this usuallyentails much more work and collaboration, and may not be feasible. Suchpooling of trial data has worked best when there is an ongoing collaborationbetween the trialists involved (EBCTCG 1992).
4.4 Detecting publication bias
Publication bias is best avoided by improved literature searching and use ofstudy registries (see Section 2.4). However, there are some useful diagnosticplots and statistics available that can help detect, and to some extent adjust for,publication bias.
4.4.1 Funnel plots
Smaller single-centre trials are less likely to be published, as these are more likelyto be ‘negative’ (not statistically significant). This may be made apparent from afunnel plot that plots the size of the treatment effect against the precision of thetrial (1/standard error), which is a statistical measure of the size of the studythat takes into account study numbers, duration, etc. Without publication bias,this plot should be funnel shaped — the ‘neck’ of the funnel showing littlespread among the larger trials, and the base of the funnel showing a widerspread among the smaller trials. With publication bias, one tail or other of thefunnel may be weak or missing because the small negative trials are not present.

Summarising and synthesising the studies 35
This may be the case in Figure 4.4 of the trials of St John’s wort for depression,where there is some suggestion of a publication bias. Unfortunately thistechnique requires a large number of trials with a spread of sizes to provide anadequate ‘funnel’, and hence will not be helpful in many meta-analyses.
Note: Dashed outer lines show boundaries of an ‘ideal’ funnel; if there is noheterogeneity the points are distributed evenly on either side of the summaryestimate.
Figure 4.4 Funnel plot of 12 placebo-controlled trials of St John’s wortshowing some suggestion of ‘missing’ smaller negative trials
4.4.2 Statistical tests
A statistical test that is a direct analogue of the funnel plot has been developed(Begg and Mazumdar 1994). This provides a P-value for the degree of apparentbias. However, as with the graphical approach, it requires large numbers ofstudies — at least 25 being required for modest power. For the St John’s wort

36 How to review the evidence
example (Figure 4.4), there is a trend to bias: P-value of 0.14, but this isunreliable as it is based on only 12 studies.
4.4.3 If publication bias is suspected, what can be done?
If publication bias is suspected, the ideal method would be to estimate thedegree to which bias has occurred and correct the summary estimateaccordingly. Egger et al (1997) has suggested a regression on an analogue of thefunnel plot in which the regression parameters estimate the degree ofpublication bias and allow a correction to be made. This is a promising line ofanalysis, but is unfortunately subject to a number of problems and cannotcurrently be recommended.
The ‘File Drawer Number’An alternative to correcting for publication bias is a sensitivity analysis toestimate its potential impact on the conclusions. One way of doing this is toestimate the number of unpublished neutral trials of equivalent average size thatwould be required to make the result no longer statistically significant. This isknown as ‘Rosenthal’s File Drawer Number’ (Rosenthal 1979).

37
5 APPLICABILITY: RETURNING TO THEQUESTION
Having completed the systematic components of the review, it is important forthe reviewer to return to the original question, and assess how well it isanswered by the current evidence.
• How important are study design flaws in the interpretation of the overallresults?
• Is publication bias an important issue?
• If further research is needed, then specific suggestions should be madeabout the necessary design features rather than a simple call for more data.
A separate handbook in this series includes detailed information on theapplicability of the results of systematic reviews (How to Use the Evidence:Assessment and Application of Scientific Evidence, NHMRC 2000a).
Part 2
Question-specific methods
This part describes additional issues and methods specific to the different typesof questions: intervention, frequency, diagnostic test accuracy, risk factors andaetiology, prognosis, and economic studies. Before reading the subsection ofthe specific question type you are interested in, we strongly recommend thatyou first read all of Part 1.
Some important resources for additional reading beyond these subsections areincluded in the appendixes.
Appendix C covers a search method developed by Hunt and McKibbon (1997)for current systematic reviews and randomised trials. For literature searching onspecific questions, the series published in the American College of PhysiciansJournal Club is helpful, as well as a book by McKibbon et al (1999).
Appendix D describes some available software for performing the calculationsand plots. None of the packages available are comprehensive, and they usuallyfocus on a single question type. But even within a single question, more thanone software package may be required to provide all the needed calculationsand plots.
41
6 INTERVENTIONS
6.1 The question
There are many types of intervention that may be the subject of a systematicreview, such as:
• therapy for a specific disease (eg aspirin to prevent stroke, surgery forcoronary artery disease, or cognitive therapy for depression);
• a change in a risk factor (eg blood pressure lowering to prevent stroke,immunisation to prevent hepatitis, or publicity campaigns to reduce teenagesmoking); or
• screening for earlier diagnosis (eg mammographic screening for breastcancer, antenatal screening for silent urinary tract infections, or screeningfor cholesterol).
The defining feature is that some specific activity is undertaken with the aim ofimproving or preventing adverse health outcomes.
6.1.1 Study design
Because of their unique ability to control for confounders, known or unknown,RCTs generally provide the best evidence of efficacy for interventions. Thissection therefore focuses on systematic reviews of controlled trials; other studytypes for intervention will be discussed in the section on aetiology and riskfactors.
However, in interpreting RCTs for policy making and applying them toindividuals, nontrial evidence will often be appropriate. For example,surveillance data may provide the best information on rare adverse effects; andcohort studies may provide the best information on the prognostic factorsneeded to predict the pretreatment risk of an individual.
6.2 Finding relevant studies
6.2.1 Finding existing systematic reviews
Appendix C gives information on finding existing systematic reviews. A checkshould be made of the Cochrane Database of Systematic Reviews (CDSR;Cochrane Library) and DARE for Cochrane and nonCochrane reviews
42 How to review the evidence
respectively. Even if the review is not considered completely appropriate, itsreference list will provide a useful starting point.
6.2.2 Finding published primary studies
The best search methods are changing rapidly. The efforts of the CochraneCollaboration have been seminal in the more systematic registering, compilingand classifying of all controlled trials in databases such as MEDLINE. Use ofthe Cochrane Library and contact with the Collaboration would be advisablewhen undertaking any new review of interventions.
An initial search should use the Cochrane Controlled Trials Registry (CCTR),which is available on the Cochrane Library CD. CCTR contains a listing ofpotential controlled trials. These have been identified by systematicallysearching databases such as MEDLINE and EMBASE, by handsearching anumber of journals, and from the specialised registers of trials that aremaintained by the Collaborative Review Groups.
A registry called CENTRAL has been distributed on the CD-ROM edition ofthe Cochrane Library since issue 4 (1997). It contains some reports of studiesthat are found not to be relevant for inclusion in Cochrane reviews. It is alsolikely to contain duplicates and errors. It includes all records in MEDLINE thatcontain the publication type (pt):
randomized controlled trialORcontrolled clinical trial
CCTR is the ‘clean’ version of CENTRAL. Controlled trials that meet thenecessary quality criteria are assigned the keyword ‘CCTR’.
Note that whether searching CENTRAL, MEDLINE or other databases, acarefully constructed search is still required using the structured approachdescribed in Section 2, with synonyms and wildcards.
Does a search need to go beyond CENTRAL?As the Cochrane Library is updated every three months, a search for morerecent studies may be needed. In addition, handsearching of key journals andconference proceedings should be considered.
6.2.3 Finding unpublished primary studies
There are two approaches for searching unpublished studies. First, an appendixin the Cochrane Handbook (available on the Cochrane Library CD) contains alist of about 30 clinical trials registries with completed and ongoing studiesregistered in specialised areas such as AIDS and cancer. Second, it may be

Interventions 43
helpful to contact the principal investigators of relevant studies asking whetherthey know of additional studies.
6.3 Appraising and selecting studies
6.3.1 Standardising the appraisal
What study features should we assess?Numerous quality assessment methods have been used: a review in 1994identified 25 methods (Guyatt et al 1994). The number of items ranged from 3to 34, the times for completion per study ranged between 10 minutes and 45minutes, and the reliability kappa (which is a measure of agreement beyond thatexplained by chance) ranged between 0.12 to 0.95 on a scale from 0 to 1.
As the optimal use of quality items and scales is still not clear, we recommendthat items be restricted generally to those that have been shown to affect theresults of trials. Empirical work by Schulz et al (1995) has shown that how wellthe random allocation procedure is concealed and the degree of blinding bothhave an important influence. These two items should be assessed in any reviewand are described below. A third item involving the level of patient follow-up isalso important.
A. Has selection bias (including allocation bias) been minimised?Random allocation is crucial for creating comparable groups. However, it is theallocation concealment before randomisation that is vital, rather than the‘randomness’ of the random number sequence. An assessment of the allocationconcealment requires an explicit statement of method, such as a centralcomputerised randomisation system. If this is not convincing, then secondaryevidence is provided by demonstration of comparability from the baselinevalues of the randomised groups.
B. Have adequate adjustments been made for residual confounding?For RCTs, the elimination of bias is closely related to avoidance of selectionbias (point A, above) because appropriate selection/allocation minimises bias atthe sample stage. If the allocation results in important imbalances, then anestimate with statistical adjustment is desirable.
C. Was follow-up for final outcomes adequate?Having created comparable groups through randomisation, high rates of follow-up and inclusion of all randomised patients in the analysis of outcome data(‘intention-to-treat’ analysis) is important. However, this control of selectionbias after treatment assignment has not been empirically demonstrated toreduce bias as much as appropriate randomisation and blinding. It is still usefulto extract and report data on the degree of follow-up.

44 How to review the evidence
D. Has measurement or misclassification bias been minimised?Blinding of outcome measurements becomes more crucial as the measurebecomes more subjective and hence more open to observer bias. This isparticularly important for symptoms and other patient self-report measures.The use of adequate placebos generally provides adequate blinding of outcomemeasures, but blinding can also be achieved without placebos; for example, bybringing in an independent ‘blinded’ observer to assess the outcome measure.
Appraisal checklistsBox 6.1 is an example appraisal checklist that includes these elements, modifiedfrom a checklist developed by Iain Chalmers (Cochrane Handbook; available onthe Cochrane Library CD). Other appraisal methods may be used but shouldalways include the randomisation and blinding items. Other alternatives aregiven in Guyatt and Rennie (1993), Guyatt et al (1993, 1994) and Liddle et al(1996).
Should scales be generic or specific?In addition to the generic items that have been discussed, some specific itemsmay be useful in a particular analysis. For example, the precise methods usedfor the outcome measure are part of both the quality and conduct of the studyand are vital for the interpretation of the results. A trial of treatment of ‘glueear’ in children, for example, may have used clinical appearance of the eardrum,tympanograms, audiograms or a combination for measures of outcome.
6.4 Summarising and synthesising the studies
6.4.1 Presenting the results of the studies
Both the number of trials identified and those selected should be reported, andthe reason stated for those that are not selected. For example, reviews oftreatment are often limited to properly randomised trials. Hence the number ofapparent trials and the number with proper randomisation would be reported.
Summary tableThe generic and specific quality items should be tabulated together with themajor study characteristics, such as the nature and intensity of the intervention,the outcome measures and the principal results, as illustrated in Table 6.1.

Interventions 45
Box 6.1 Checklist for appraising the quality of studies ofinterventions
1. Method of treatment assignment a. Correct, blinded randomisation method described
OR randomised, double-blind method statedAND group similarity documented
b. Blinding and randomisation stated but method not describedOR suspect technique (eg allocation by drawing from an envelope)
c. Randomisation claimed but not described andinvestigator not blinded
d. Randomisation not mentioned
2. Control of selection bias after treatment assignmenta. Intention to treat analysis AND full follow-up
b. Intention to treat analysis AND <15%loss to follow-up
c. Analysis by treatment received only OR no mention of withdrawals
d. Analysis by treatment receivedAND no mention of withdrawalsOR more than 15% withdrawals/loss-to-follow-up/post-randomisationexclusions
3. Blindinga. Blinding of outcome assessor
AND patient and care giver
b. Blinding of outcome assessorOR patient and care giver
c. Blinding not done
4. Outcome assessment (if blinding was not possible)a. All patients had standardised assessment
b. No standardised assessment OR not mentioned
Source: modified from I Chalmers, Cochrane Handbook; available on the Cochrane Library CD-ROM

46 How to review the evidence
Table 6.1 Example summary table of quality features of a set ofhypothetical intervention trials
Trial descriptors Quality items
Trial N Intervention
Populationand othercontent-
specific itemsa
Random-isation
procedure Blinding Follow-up
Results(relative
risk)
1 324 20 mg daily Centralcomputer
Double 90% at 2 years 0.7
2 121 25 mg twicedaily
Envelopes Single 80% at 5 years 0.6
3 987 10–25 mg Not stated None 98% at 1 year 0.55
a Information relevant to particular study (eg information on participants, methods, outcomes).Note: A Cochrane review generally has a summary table with author/reference, methods, participants(age, gender, etc), interventions, outcomes, notes (quality scores may also be included).
Graphical presentationEven if studies are not to be combined, a summary plot of the results of each isinvaluable. As outlined in Section 4.1, the basic plot is a summary estimate ofeffect together with a confidence interval (known as a ‘forest plot’). The studiesmay be arranged in order of date, size, quality score, strength of intervention,control event rate or several other useful attributes, but should not be arrangedby the size of effect. A second attribute may be indicated by subgrouping. Forexample, studies might be grouped by high or low intensity intervention, andthen by study quality within these categories. An example of a forest plot forRCTs on treatment of epilepsy with the drug gabapentin is shown in Figure 6.1.
6.4.2 Synthesis of study results
For some systematic reviews, it may only be reasonable to present the table ofstudy characteristics and basic data plots. However, if formal combination isconsidered appropriate, there are two major aims to such a meta-analyticsynthesis of controlled trial data — first, to find a summary estimate of theoverall effect, and second to examine whether and how this average effect ismodified by other factors.
To enable a single summary outcome measure, all the trial results must beexpressed in a common metric (unit). Ideally, this should be the most patient-relevant outcome and expressed in a directly interpretable manner (eg reductionin the risk of death, proportional reduction in symptoms, or days of symptoms).However, the trials will not necessarily allow this, and some pragmatic choiceswill need to be made.
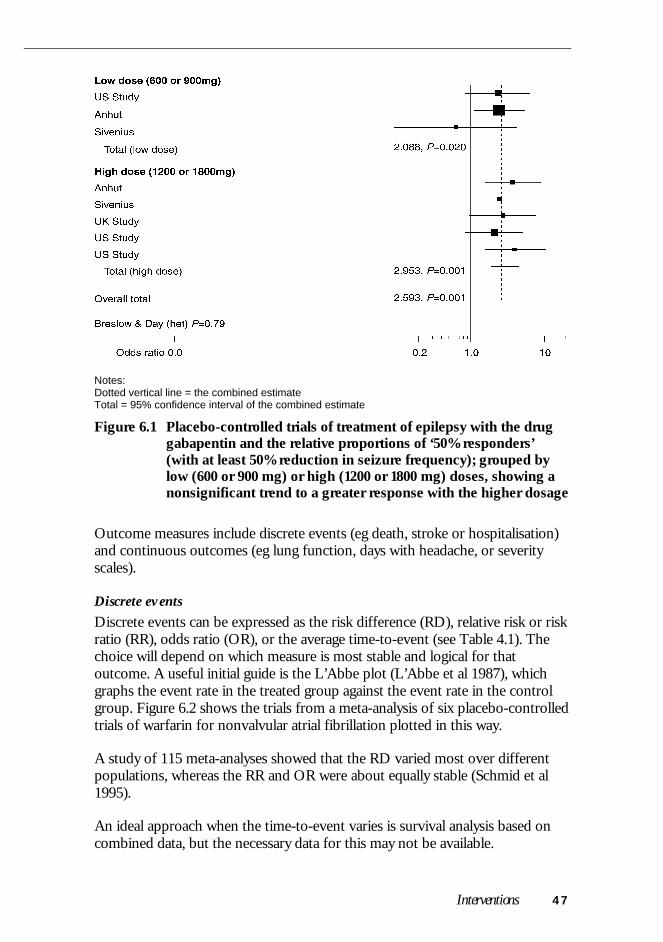
Interventions 47
Notes:Dotted vertical line = the combined estimateTotal = 95% confidence interval of the combined estimate
Figure 6.1 Placebo-controlled trials of treatment of epilepsy with the druggabapentin and the relative proportions of ‘50% responders’(with at least 50% reduction in seizure frequency); grouped bylow (600 or 900 mg) or high (1200 or 1800 mg) doses, showing anonsignificant trend to a greater response with the higher dosage
Outcome measures include discrete events (eg death, stroke or hospitalisation)and continuous outcomes (eg lung function, days with headache, or severityscales).
Discrete eventsDiscrete events can be expressed as the risk difference (RD), relative risk or riskratio (RR), odds ratio (OR), or the average time-to-event (see Table 4.1). Thechoice will depend on which measure is most stable and logical for thatoutcome. A useful initial guide is the L’Abbe plot (L’Abbe et al 1987), whichgraphs the event rate in the treated group against the event rate in the controlgroup. Figure 6.2 shows the trials from a meta-analysis of six placebo-controlledtrials of warfarin for nonvalvular atrial fibrillation plotted in this way.
A study of 115 meta-analyses showed that the RD varied most over differentpopulations, whereas the RR and OR were about equally stable (Schmid et al1995).
An ideal approach when the time-to-event varies is survival analysis based oncombined data, but the necessary data for this may not be available.

48 How to review the evidence
Figure 6.2 L’Abbe plot of the stroke risk in the treated group versus thestroke risk in the control group from a meta-analysis of sixplacebo-controlled trials of warfarin for nonvalvular atrialfibrillation. The diagonal (solid) line represents no effect. Pointsbelow this line indicate a lower rate of poor outcomes in thetreated group than in the control group (ie benefit). The dashedline shows the overall (beneficial) effect of warfarin, whichappears to increase with increasing risk in the control group
Continuous outcomesAgain a common interpretable outcome measure is ideal. Sometimes this isimpossible, in which case a common metric is needed. Examples are:
• the proportional improvement (in say FEV1 [forced expiratory volume] orpeak flow); and
• the standardised difference — the difference between the treated andcontrol groups divided by the standard deviation in the control group (if thetreatment is likely to alter the variation; otherwise the combined estimate ismore stable).
6.4.3 Assessing heterogeneity
Difference in the effects seen may be caused by several factors:
• disease features, such as stage or severity;

Interventions 49
• patient features, such as age or ethnicity;
• intensity or timing of the intervention; and, most importantly,
• study design features, such as study duration or the outcome measures used.
Even if the test for heterogeneity is nonsignificant, exploring for causes ofvariation is reasonable and useful (see Section 4.2.1). For example, in Figure 6.1,dealing with trials of the drug gabapentin in epilepsy, the overall test forheterogeneity was nonsignificant (P=0.79), but subgrouping appeared to show amodest dose–response relationship.
6.5 Economic evaluation
Depending on the type of economic analysis required, systematic reviews ofintervention studies can also provide valuable information. The basic types ofeconomic analysis include (Drummond et al 1997):
• cost analysis• cost-effectiveness analysis• cost–utility analyses• cost–benefit analyses
The last three all contain an effectiveness component for which systematicreviews will play a role. For other components, such as the cost or pricing ofresources, systematic review has a limited role. Cost-effectiveness analysis isprobably the most used economic analysis in Australia. For example,submissions to the Australian Pharmaceutical Benefits Scheme require a cost-effectiveness analysis (Drummond et al 1997, Henry 1992).
A cost-effectiveness analysis has several components, including the estimate ofbenefit, the change in resources utilisation, and the unit costs of thoseresources. A general formula for cost-effectiveness ratio can be written as(Drummond et al 1997):
Cost-effectiveness ratio = (Costs – Savings)/Effectiveness
where: Costs = the costs of implementing the intervention
Savings = the savings from any reductions in resource useattributable to the intervention
Effectiveness = the incremental clinical benefit gained from theintervention
Savings result from changes in resource utilisation, such as hospitalisation,lengths of stay and medication usage, and are generally closely allied to clinical

50 How to review the evidence
outcomes. Hence, systematic reviews are relevant to the estimation of theeffectiveness and, usually, to the changes in resource utilisation. However, thenet cost (Costs – Savings) will depend on the unit costs of resources and theintervention that will vary over sites and time. Thus direct systematic review ofthe cost-effectiveness ratio will generally be inappropriate.
For example, for carotid endarterectomy a systematic review of the economicswould first require a systematic review of the evidence of its effectiveness. Thiswould inform us about any reductions in stroke leading to some savings.Finally, the unit costs of stroke, endarterectomy and other events would need tobe established in order to calculate the net cost to be compared with theeffectiveness.
Economic analysis is discussed in more detail in another handbook in this series(How to Compare the Costs and Benefits: Evaluation of the Economic Evidence, NHMRC2000b).
6.6 Further information
This section provides only a brief overview of methods. A fuller description ofthe process for Cochrane systematic reviews is contained in the CochraneHandbook, available as either an electronic version in the Cochrane Library or ahard copy version (Mulrow and Oxman 1996). The handbook is regularlyupdated and has become the principal source of guidance for systematic reviewsof interventions.

51
7 FREQUENCY AND RATE
7.1 The question
Questions of frequency (or prevalence) arise commonly in health care. Forexample:
• What is the frequency of hearing problems in infants?
• What is the prevalence of Alzheimer’s disease in the over 70s?
• What is the frequency of BrCa1 gene for breast cancer in women?
If the proportion changes over time, then a time period is incorporated into thedefinition to give a rate (or incidence). Thus, a possible question may be:
• What is the rate of incidence of influenza in different seasons and years?
Traditionally, for diseases, prevalence is distinguished from incidence as follows(Rothman and Greenland 1998):
• prevalence — the proportion of people who have the condition at a specificpoint in time (frequency of current cases);
• incidence — the instantaneous rate of development of new cases (also knownas the incidence rate or simply the rate); and
• incidence proportion — the proportion of people who develop the conditionwithin a fixed time period (also called cumulative incidence, with a specificexample being the lifetime risk).
Incidence and prevalence are linked by the duration of illness, so that in a steadystate population:
Prevalence = incidence × duration
In this handbook, the terms ‘frequency’ and ‘rate’ are preferred to ‘prevalence’and ‘incidence’ because questions do not always refer to diseases, but may referto risk factors such as diet, or false positive rates (for diagnostic questions), andso on. The definition and calculation of frequencies and rates involves anumber of subtleties, which are described by Rothman and Greenland (1998).
The apparent frequency may be greatly influenced by the case definition. Forexample, whether or not ‘silent’ myocardial infarction (incidentally detected by

52 How to review the evidence
later electrocardiograms) is included in estimates of myocardial infarction willchange both the frequency and rate. Similarly, the precise measurements usedcan be influential; for example, different rates of deep venous thrombosis maybe obtained from an ultrasound from those obtained from a venogram. Ofparticular note is that, if the true frequency is zero, the apparent frequency willconsist of just the false positives, and thus be (1 – specificity). Hence it isimportant for any systematic review of frequencies to document both thepopulation and the definitions and measures used.
7.1.1 Study design
The aim of a study of frequency or rate is to measure a representative sample ofthe target population. For frequency, this will be a random sample survey (orcensus) of the target population; for rate there is an additional requirement thatthe representative group be followed over time. Thus the major study designsare (cross-sectional) surveys for frequency, and cohort studies for rate. If thesample includes the entire population, then these become a census (forfrequency) or a disease/condition registry (for rate).
7.2 Finding relevant studies
7.2.1 Finding existing systematic reviews
There have been a few systematic reviews of frequency and rates. However, it isstill worth searching using the general methods: Appendix C gives informationon finding existing systematic reviews. This would need to be combined withcontent-specific terms for the disease or risk factor being reviewed togetherwith the terms in the next section.
7.2.2 Finding published primary studies
Unfortunately, most relevant studies are not coded as such in MEDLINE. Thesearch requires three components:
• the alternative terms:incidence OR rate ORfrequency OR proportion OR prevalence
• the condition of interest (and any synonyms), preferably using an MeSHterm (exploded if possible and appropriate); and, if the number of potentialstudies is too large,
• a ‘methodological filter’ to confine this to appropriate studies of frequency,such as random or consecutive; or a filter to focus on an appropriate ‘goldstandard’, such as audiometry for childhood hearing problems.
Frequency and rate 53
Various combinations of the above three components may be used. Forexample, a MEDLINE search for the causes of chronic cough might use:
chronic NEAR coughwhere: the special search term ‘NEAR’ means that the ‘chronic’ and‘cough’ need to be close together but allows for terms such as ‘chronicnonproductive cough’.
This might then be restricted to references with an appropriate sample; that is, arandom or consecutive set of cases, plus an adequate gold standard test or tests,and an appropriate follow-up (to catch missed or mistaken diagnoses).Together, these give the following search:
chronic NEAR cough AND (investigat* OR diagnos* OR cause*)AND (consecutive OR follow-up OR followup)
7.2.3 Finding unpublished primary studies
In addition to writing to authors of published work, it is important to considerwhether any government or nongovernment agencies might have relevantsurveys or registries. For example, cancer registries are an obvious source forcancer incidence information; and State or Territory health departments shouldbe contacted for information on communicable diseases. Groups and societiesinterested in specific diseases, such as diabetes, heart disease or cystic fibrosis,may also have done their own surveys.
7.3 Appraising and selecting studies
7.3.1 Standardising the appraisal
What study features should we assess?
There are no standard accepted quality scales for studies of proportions.However, the principal issues are similar to those described for controlled trialsof interventions (see Section 6.3).
A. Has selection bias been minimised?Random selection is important to obtain a representative sample. While simplerandom sampling is often appropriate, other methods include stratified randomsampling and cluster sampling. The important issues are the definition andestablishment of an appropriate sample frame and some form of randomsampling.
B. Have adequate adjustments been made for residual confounding?
The issue of confounding is not relevant to frequency and rate studies.

54 How to review the evidence
C. Was follow-up for final outcomes adequate?Having obtained a representative group by random sampling, a high responserate is needed to maintain the representativeness and avoid bias. This isparticularly important if nonresponse is associated with the condition ofinterest. For example, if you want to know the proportion of dischargedpsychiatric patients who relapsed within a year, then high follow-up is importantas difficult-to-follow patients often have worse outcomes.
D. Has measurement or misclassification bias been minimised?As discussed in the introduction, a clear definition of the condition and themeasurements used is crucial, as this will influence the apparent rate.
7.4 Summarising and synthesising the studies
7.4.1 Presenting the results of the studies
Summary tableA systematic description of the definitions and measurements used is critical tothe comparison of studies. Hence an initial summary table is crucial, such asthat shown in Table 7.1. The table should detail precise definitions of cases andthe type and frequency of measurements used (eg the average of three bloodpressure measurements taken in the supine position two days apart using amercury sphygmomanometer). In addition, other potential differences betweenthe populations should be described (eg gender mix, age range, and otherinclusion and exclusion criteria).
Table 7.1 Example summary table of a set of hypothetical studies offrequency
Trial Setting Measure
Population/inclusioncriteria Selection
Response(%)
Resultsn/N (%)
1 Community Single bp Age 16–75 Randomsample
70 10/105(10%)
2 GP clinic Average of3 bp
All ages Consecutivecases
80 30/240(13%)
3 Skin clinic Average of2 bp on 2occasions
Age 20–65 Consecutivecases
98 4/20 (20%)
bp = blood pressure measurements; GP = general practitioner

Frequency and rate 55
Graphical presentationAs with all systematic reviews, plots of the data are invaluable. For frequencyand rate questions, the estimate and confidence interval should be plottedagainst any factors that may be predictive of the results (ie those elementsprovided in the descriptive table). For example, Figure 7.1 shows a plot of therates of antibiotic resistance in Propionibacterium acnes, suggesting a trend withtime, though other explanations, such as measurement or populations, wouldclearly need to be examined.
Notes:Dotted vertical line = the combined estimateTotal = 95% confidence interval of the combined estimate
Figure 7.1 Proportion of patients with antibiotic resistance inPropionibacterium acnes for four studies, listed by publicationdate (Cooper 1998)
7.4.2 Synthesis of study results
Among a group of acceptably similar studies, the methods of quantitativesynthesis are relatively straightforward. If the frequencies are considered to arisefrom a single common population (a ‘fixed effect model’), then simple poolingwill be sufficient. For example, if the prevalence of a disease was similar in allStates, then an estimate of the national average prevalence would simply pool allthe State disease cases, and the national prevalence (frequency) would be thetotal cases in the total population. The results should be reported as an overallfrequency or rate and confidence interval.

56 How to review the evidence
However, if there is variation by case definition, measurements, population orother factors, then more complex methods are required. The first step is to lookfor causes of variation that may be artefacts, such as different measurements,and if possible to correct or adjust each estimate. If there appear to be truedifferences in the studies and populations then this should be reported. If anoverall estimate is still needed, then the method depends on the aim, but mayrequire a random effects model.
7.4.3 Assessing heterogeneity
A test for heterogeneity should be performed. Whether or not the result issignificant, it is worthwhile checking whether subgroups of studies differedbecause of measurement method or sample frame.

57
8 DIAGNOSTIC TESTS
8.1 The question
Although the principles are similar across all types of study question, systematicreview of diagnostic tests requires some different approaches, notably in themethods used for combining data from different studies. As with the othertypes of questions, the starting point for diagnostic studies is an appropriatequestion, including a description of:
• the disease of interest;
• the test(s) of interest;
• patient features that are likely to alter the test performance characteristics;and
• the performance characteristics of the test compared to the performancecharacteristics of another test(s).
If test performance characteristics vary between patient subgroups, this needsto be taken into account when applying the results of a systematic review ofdiagnostic tests. Common features that affect test performance characteristicsinclude the symptoms, signs, tests and previous triage through the health caresystem that has got patients to the point at which you wish to evaluate theperformance characteristics of a test. This issue is explored further in Section8.3 on appraising the quality and applicability of studies.
When the performance characteristics of the test are compared to theperformance characteristics of another test(s), the situation is analogous to trialsin which an intervention is compared to a placebo or to another drug. Forexample, we may not want to know if the presence of leucocytes in anabdominal fluid aspiration has a high sensitivity and specificity for the diagnosisof appendicitis in people presenting with abdominal pain. Rather, we may wantto know its incremental sensitivity and specificity compared to other featuresthat are more easily obtained; for example, rebound tenderness in the right iliacfossa (Caldwell and Watson 1994).
8.1.1 Study design
The ideal design for studies of diagnostic test performance is usually a cross-sectional study in which the results of tests on consecutively attending patientsare cross-classified against disease status determined by a reference (gold)
58 How to review the evidence
standard. Occasionally, the sample will be followed over time if the test ispredictive of a reference standard in the future.
Most diagnostic systematic reviews have examined the test performancecharacteristics of individual tests. While this is useful, we are often moreinterested in whether a new diagnostic test is better than current alternatives.Hence there is merit in designing systematic reviews to compare tests as themany biases and heterogeneity of results in primary studies are likely to be lessimportant if tests are compared within individuals in each study (or inindividuals randomly allocated to one or other test within each study).
8.2 Finding relevant studies
8.2.1 Finding existing systematic reviews
Appendix C gives information on finding existing systematic reviews. A checkshould be made of DARE (available in the Cochrane Library or on the Internet)and MEDLINE. DARE compiles both intervention and diagnostic reviews, butnot the other question types discussed in this guide. Even if the review is notconsidered completely appropriate, its reference list will provide a usefulstarting point.
8.2.2 Finding published primary studies
Initial searching should be done on MEDLINE, EMBASE and similarcomputerised databases. In MEDLINE, MeSH headings should be:
the disease of interest (all subheadings), egexplode urinary tract infections
the name of the test (all subheadings), egexplode reagent strips
both the disease and the test, egexplode urinary tract infection AND explode reagent strips
Ideally, no further keywords should be used to restrict the search.
Only if inspection of the abstracts suggests that this initial approach isunmanageably nonspecific should the search be restricted. If you really need torestrict the search, try linking the disease and/or test (all subheadings) with thefollowing:

Diagnostic tests 59
sensitivity AND specificity (exploded MeSH heading, which includes‘predictive value of tests’ and ‘ROC curve’)ORsensitivit* (textword)ORspecificit* (textword)ORpredictive value (textword)
(Note: sensitivit* is a shorthand which allows for both ‘sensitivity’ and
This method of restricting the search while minimising loss of sensitivity isbased on evidence from a set of journals on general and internal medicine withhigh impact factors in 1986 and 1991 (Haynes et al 1994). It may not beapplicable now or to a wider range of journals. If it does not capture articles ofknown relevance, reconsider the feasibility of manually searching the abstractsof the unrestricted search based only on the disease and test. If you stillconsider that is not feasible, check how missed articles have been indexed to getideas on additional restriction terms. Having two searchers develop strategiesindependently may be helpful. Some additional MeSH headings that may helpgenerate relevant articles are:
diagnostic errors (exploded heading, which includes ‘false negativereactions’, ‘false positive reactions’ and ‘observer variation’)
diagnosis, differential
reproducibility of results
Some additional textwords that may help are:
accuracy, ROC, likelihood ratio
You may also find more articles by clicking on ‘related articles’ in relevantarticles identified in PubMed.5
An alternative but perhaps less successful method of restricting is to search forthe disease and/or test of interest, including only those subheadings concernedwith diagnosis, for example:
diagnosis, pathology, radiography, radionuclide imaging,ultrasonography and diagnostic use
5 www.ncbi.nlm.nih.gov/PubMed/

60 How to review the evidence
Avoid using the MeSH heading ‘diagnosis’ because it differs from diagnosis as asubheading of a disease and is not designed to capture articles on diagnostictests.
Articles on diagnostic tests may not be indexed as well as articles onintervention studies. Therefore, as demonstrated by the example of near-patienttesting described in Section 2.3, it is more important to search the references ofstudies, handsearch relevant journals and conference proceedings, and examinearticles suggested by experts in the relevant field (McManus et al 1998). It ishelpful to record and report the details of your search strategy for futurereference.
8.2.3 Finding unpublished primary studies
Publication bias is probably as much of a problem for systematic reviews ofdiagnostic tests as it is for observational studies in general. This is becausereviews are often produced using available data sets and only those that showfeatures of interest may reach publication.
Methods for detecting and dealing with publication bias for diagnostic teststudies are not well developed. We are not aware of any attempt to developregistries of studies at the design stage, as has been done for RCTs.
8.3 Appraising and selecting studies
8.3.1 Standardising the appraisal
The quality of diagnostic studies is determined by the extent to which biaseshave been avoided. However, a high quality study (sometimes referred to asinternally valid) may not be applicable in your setting (ie externally valid) if theexact test used differs from that to which you have local access or the test hasbeen evaluated in a tertiary care setting, while you are interested in using it inprimary care. The applicability of high quality studies is determined by whetherthe test methods and population accord with your area of interest.
Information about the characteristics that define the quality and applicability ofstudies may be used to decide the ‘boundaries’ of the question to be answeredby the systematic review, when reviewing abstracts or after having reviewed fullpapers. Alternatively, a more informative approach is to explore the extent towhich some or all of the characteristics affect estimates of test performancewhen combining studies, as outlined in Section 8.4. For example, if the primarystudies choose two different reference standards, it is possible to explorewhether the estimated test performance characteristics vary with the choice ofreference standard.

Diagnostic tests 61
What study features should we assess?Several checklists for quality and applicability of primary studies of diagnostictests have been developed (Bruns 1997, Irwig et al 1994, Jaeschke et al 1994ab,Reid et al 1995, Liddle et al 1996). The most comprehensive checklist has beendeveloped by the Cochrane Methods Working Group on Screening andDiagnostic Tests.6 A shortened and updated version of this checklist is shownin Box 8.1. However, only a few studies are known that have given empiricalevidence about the effect of quality on estimated test performancecharacteristics (Lijmer et al 1999, Fahey et al 1995). Nevertheless, any checklistshould include the elements of quality and applicability outlined below.
QualityA. Has selection bias been minimised?Consecutive patients with the features of interest should be enrolled. Somestudies, however, do not use this method and instead estimate test performancebased on people who have been diagnosed with the disease and those withoutthe disease. These studies tend to include the more severe or ‘definite’ end ofthe disease spectrum and the nondiseased group tends to be people without aclinical problem. Such ‘case-control’ studies are likely to overestimate bothsensitivity and specificity (Lijmer et al 1999).
B. Have adequate adjustments been made for residual confounding?For diagnostic tests, the issue of ‘confounding’ can generally be considered asthe incremental value of the new test over other tests that have been done (andwhich may be cheaper, less invasive, etc). In this instance, this is an issue ofapplicability rather than quality and is discussed in more detail underApplicability, below. Another context in which confounding arises is if thereference standard is a later event that the test aims to predict. In this case, anyinterventions should be blind to the test result, to avoid the ‘treatment paradox’:a test may appear to be poorly predictive because effective treatment in the test-positives has prevented the poor outcomes that the test would otherwisepredict.
C. Was follow-up for final outcomes adequate?To maintain the sample, all those enrolled should be verified by the referencestandard and included in the analysis. Verification bias occurs when thereference standard is applied differently to the test-positives and the test-negatives. This is most likely when the reference standard is an invasiveprocedure, in which case the test-negatives are less likely to be subjected to it.
6 www.cochrane.org/cochrane/sadt.htm

62 How to review the evidence
Box 8.1 Checklist for appraising the quality of studies ofdiagnostic accuracy
Descriptive information about the study• Study identification
• What is the study type?
• What tests are being evaluated?
• What are the characteristics of the population and study setting?
• Is the incremental value of the test being compared to other routine tests?
Has selection bias been minimised?• Were patients selected consecutively?
Was follow-up for final outcomes adequate?• Is the decision to perform the reference standard independent of the test
results (ie avoidance of verification bias)?
• If not, what per cent were not verified?
Has measurement bias been minimised?• Was there a valid reference standard?
• Are the test and reference standards measured independently (ie blind to eachother)?
• Are tests measured independently of other clinical and test information?
• If tests are being compared, have they been assessed independently (blind toeach other) in the same patients or done in randomly allocated patients?
Has confounding been avoided?• If the reference standard is a later event that the test aims to predict, is any
intervention decision blind to the test result?
Source: modified from Cochrane Methods Working Group on Diagnostic and Screening Tests
Likewise, the proportion of the study group with unobtainable test resultsshould be reported; for example, the number of needle biopsies that providedan inadequate sample. It is inappropriate to omit from analysis those test resultsthat are uncertain; for example, some, but not full-colour, development on areagent strip. The test performance characteristics of uncertain test resultsshould be obtained or uncertain results combined with positives or negatives.

Diagnostic tests 63
D. Has measurement or misclassification bias been minimised?A validated reference standard should be used and the test and referencestandard should be measured independently of (blind to) each other. The testsshould also be measured independently of other clinical and test information.Although independent assessment is generally desirable, there are somesituations where prior information is needed; for example, in identifying theexact site of an abnormality for which a radiograph is being viewed.
If tests are being compared, have they been assessed independently?If tests are being compared, a systematic review based on studies in which thetests are being compared is a much stronger design than if performancecharacteristics of the tests come from different studies. The strongest within-study design is when both tests are done on the same individuals or individualsare randomly allocated to each test. It is especially important that two or moretests whose performance characteristics are being compared are assessedindependently in each individual. For example, if mammography and ultrasoundare being compared as a diagnostic aid in young women presenting with breastlumps, the two techniques should be assessed without knowledge of the resultsof the other imaging technique.
ApplicabilityEstimated test performance characteristics may depend heavily on details ofhow the test was performed and the population tested. This information shouldbe collected and presented so that readers can judge applicability by the extentto which the clinical problem is being addressed and if the exact test used issimilar to those in the setting in which they practice.
A. About the test(s)• How were tests performed (eg kits from different manufacturers)?
• What threshold was used to differentiate ‘positive’ from ‘negative’ tests?Ideally, tests will be looked at using several categories of test result (or evenas a continuum), and this should be noted when it is done. Because data areusually dichotomised around a single threshold in primary studies publishedto date, and accessible meta-analysis methods are best developed fordichotomised data, this will be the only approach considered further.
B. About the population• Presenting clinical problem — the condition that defined entry into the
study.
• Disease spectrum — the spectrum of disease in the diseased group (thosewith the disease of interest) is described directly by the stage or severity ofdisease. Spectrum in the so-called nondiseased group (those without thedisease of interest) is described by the final diagnoses in that group. Indirect

64 How to review the evidence
measures of spectrum include the setting (eg primary or tertiary care),previous tests and the referral filter through which people had to pass to getto the point where they were eligible for the study.
• Incremental value of tests — although a test may appear to give goodresults, it may not provide any more information than simpler (eg lessinvasive or cheaper) tests that are usually done in a particular setting. This islike thinking of these other tests as ‘confounders’ that must be taken intoaccount when assessing the test performance characteristics of the test ofinterest (eg by restriction, stratification or modelling).
Indirect measuresThe above features may not capture all aspects of quality and applicability, asthe information you want is often not provided in the primary studies.Therefore, it is worth looking at some additional measures.
• Prevalence of the condition — this may be a proxy for the ‘setting’ in whichthe test is being assessed. More importantly, it has been shown that error inthe reference standard is an important cause of sensitivity and specificityvariation (nonlinear) with the observed prevalence of the condition(Brenner and Savitz 1990, Valenstein 1990).
• Year of the study — the quality of studies, the way tests have been doneand the populations on which the tests are being performed may havealtered over time.
8.4 Summarising and synthesising the studies
8.4.1 Presenting the results of the studies
Summary tableStudies should be listed, tabulating the extent to which they fulfil each criterionfor quality and applicability. Studies can be categorised by the most importantquality and applicability criteria for the topic being addressed. If the number ofstudies is large or many criteria are considered equally important, provide asummary table showing the proportion of papers that fall into each category (orimportant combinations of criteria). Table 8.1 shows an example summarytable.

Diagnostic tests 65
Table 8.1 Example summary table of quality features of a set ofhypothetical diagnostic accuracy trials
Study descriptors Quality
Study N SettingConsecutive
attenders
Verificationbias
avoided
Test andreferencestandardmeasured
independently
Tests beingcomparedassessed
independently
1 300 Hospital Yes Yes Yes Yes
2 800 Primarycare
Yes No Yes No
3 1000 Specialistclinic
No Yes No Yes
Graphical presentationSimple plot of sensitivity and specificityShow the sensitivity and specificity of each study with its confidence intervals.This is best done graphically, with the specificity for a particular study shownalongside the sensitivity for that study (as shown in Figure 8.1). Ordering thestudies by some relevant characteristic helps interpretation. For example, testthreshold may differ between studies, so that those studies with lowestsensitivity may have the highest specificity and vice versa. If studies are rankedby their sensitivity, the visual display is the first step towards understanding themagnitude of this phenomenon.
The plot and all the following steps can be done using Metatest software (seeAppendix D). However, the currently available version of the software(Metatest 0.5) does not test statistical significance. The Internet website will beupdated as the software is developed further (see Appendix D). Statisticalmodelling and significance testing can be done in any statistical package, butrequires expertise in applying the transformations outlined below and its back-transformation.
Plot sensitivity against specificityThe next step is to plot sensitivity against specificity in ROC space, ideallyshowing the points as ovoids with an area proportional to the square root of thenumber of people on whom sensitivity and specificity have been calculated (seeFigure 8.2). As in the last step, this may display the trade-off between sensitivityand specificity because studies have different thresholds.
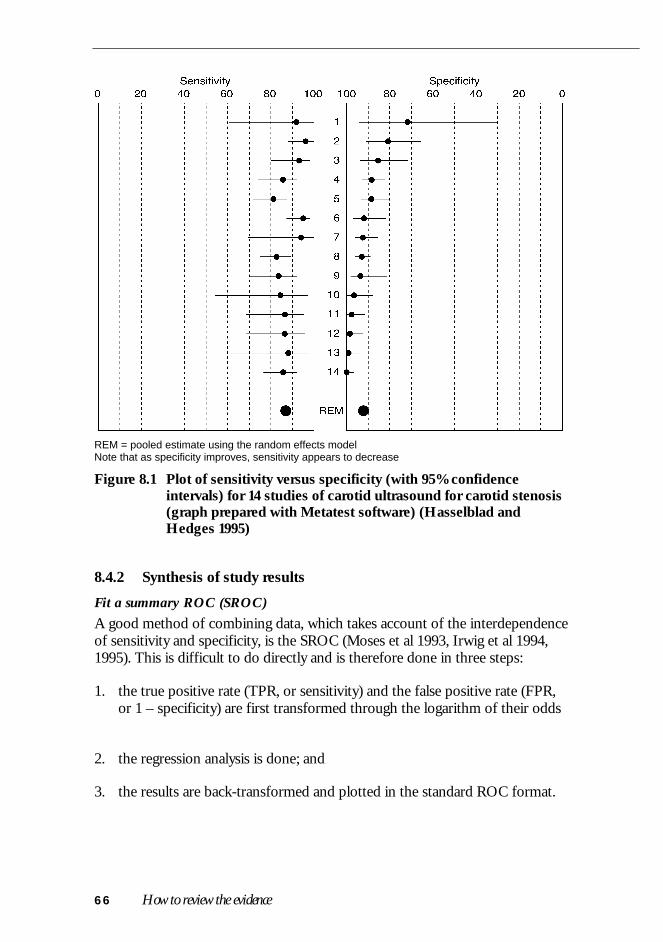
66 How to review the evidence
REM = pooled estimate using the random effects modelNote that as specificity improves, sensitivity appears to decrease
Figure 8.1 Plot of sensitivity versus specificity (with 95% confidenceintervals) for 14 studies of carotid ultrasound for carotid stenosis(graph prepared with Metatest software) (Hasselblad andHedges 1995)
8.4.2 Synthesis of study results
Fit a summary ROC (SROC)A good method of combining data, which takes account of the interdependenceof sensitivity and specificity, is the SROC (Moses et al 1993, Irwig et al 1994,1995). This is difficult to do directly and is therefore done in three steps:
1. the true positive rate (TPR, or sensitivity) and the false positive rate (FPR,or 1 – specificity) are first transformed through the logarithm of their odds
2. the regression analysis is done; and
3. the results are back-transformed and plotted in the standard ROC format.

Diagnostic tests 67
Figure 8.2 Receiver–operator curve (ROC) plotting true positive rate(sensitivity) against false positive rate (1 – specificity) for a meta-analysis of carotid ultrasound accuracy showing the individualstudy points and the fitted summary ROC (SROC) (Hasselbladand Hedges 1995)
The transformation of the data in the second step examines the linearrelationship:
D = a + bS
where: D = (logit TPR) – (logit FPR) = log (odds ratio)
S = (logit TPR) + (logit FPR) = log (odds product), which is aproxy for the threshold
a = estimated linear intercept
b = estimated regression coefficient (slope)
This relationship can be plotted as a regression of D on S as shown in Figure8.3 and provides the estimates of a and b needed for the SROC (see Figure 8.2).If the slope, b, is nonsignificant and close to 0, then we can focus on theintercept, a, back-transforming it to the odds ratio. A single constant odds ratiodefines a single symmetric SROC. If the slope, b, is significant, the situation ismore complex — the odds ratio changes with the threshold, resulting in anasymmetric SROC.

68 How to review the evidence
Note: Solid line shows unweighted best fit with intercept = 4.55; slope = –0.53
Figure 8.3 Plot of D versus S for a meta-analysis of carotid ultrasoundaccuracy showing the individual study points and the fitted line(Hasselblad and Hedges 1995)
One difficulty with SROCs is that they do not give a particular set of sensitivityand specificity values as the summary estimate. We therefore suggest using thesensitivity at average specificity. For screening tests, read off the sensitivity at afalse positive rate (1 – specificity) equivalent to the rate of positive results inyour population. The sensitivity and specificity obtained can be used to generatepost-test probabilities for a range of pretest values.
Compare testsIf the objective is to compare tests, use only those studies that do both tests andplot them using different symbols against the ‘common’ SROC (Loy et al 1996).Testing can be done by adding test type to the regression of the D (log oddsratio) on S (log odds product) mentioned in the previous section.
8.4.3 Assessing heterogeneity
Assess whether the test performance characteristics vary by study quality orpopulation and test characteristics (Moons et al 1997). Start by plotting the datafor subgroups defined by each important criterion for study quality given inSection 3.1 and examine how they fall around the common regression. To testsignificance, add each feature individually in the SROC model. If there aresufficient studies, this can be extended to include several variablessimultaneously using conventional approaches to modelling.

69
9 AETIOLOGY AND RISK FACTORS
9.1 The question
Questions of aetiology and risk factors commonly arise in relation to publichealth. For example:
• Does the evidence support a likely causal effect of a factor (eg obesity) on aparticular disease (eg breast cancer)?
Clearly, in public health terms, you may want to know the whole array of healtheffects of an exposure, but the evidence for each causal or preventive influencehas to be first assessed separately, along the lines we suggest here. Largely, suchevidence will come from case-control and cohort studies, although in someinstances RCTs provide critical tests of causal hypotheses.
In a striking recent example, RCTs showed beta-carotene to be an ineffectivepreventive of lung cancer, contrary to deductions made from a large number ofobservational studies that evaluated diet and laboratory data. This role of RCTsneeds to be borne in mind when constructing a search strategy, as indicatedbelow.
Getting the right balance in the question being addressed may bestraightforward (eg ‘Do oral contraceptives cause breast cancer?’), especiallywhen it derives from a clear clinical or public health question. But should areview of body size and breast cancer include:
• all measures of body size (height, weight, skinfolds, circumferences, derivedvariables);
• only those that are modifiable (removing height, which is of biologicalinterest); or
• only the most direct estimates of adiposity, such as skinfolds?
Such issues usually make systematic reviews of aetiology and risk factors morecomplex than systematic reviews of interventions.
9.1.1 Study design
Epidemiology studies of aetiology (often called observational studies) relateindividual characteristics, personal behaviours, environmental conditions, andtreatments as ‘exposures’ that may modify risk of disease. In contrast torandomised trials, most epidemiology studies relate naturally occurring
70 How to review the evidence
exposures to the onset of disease. These studies are often called ‘observationalstudies’ and may be cross-sectional, prospective or retrospective. Cohort(prospective) studies relate exposure to subsequent onset of disease, comparingthe rates among the exposed to those in the unexposed. Case-control studies(retrospective) compare the exposure histories of a group of cases to thoseamong controls (disease free).
For the study of aetiology, prospective studies usually provide stronger evidencethan case-control studies. Rarely are cross-sectional studies of importance,although in the case of obesity and breast cancer they may shed light on therelation between adiposity and hormone levels, giving support for a biologicalmechanism for the relation under study.
9.2 Finding relevant studies
9.2.1 Finding existing systematic reviews
You should first check whether an appropriate systematic review already exists(see Appendix C). If no such review is found or if there is none that directlymatches your needs and is up to date, then you face the challenge ofconstructing your own.
9.2.2 Finding published primary studies
The initial approach parallels that for searching for diagnostic studies, essentiallysearching MEDLINE for combinations of the disease and the exposure ofinterest, and, if the resulting set is too large, adding a methodological filter. Forexample:
obesity AND breast cancer
will be quite specific, especially if combined with
humanORepidemiology
but much relevant research will be excluded, whereas
obesity OR any of its alternatives OR breast cancer
will spread a wider (more sensitive) net, but at the expense of retrievinga mass of unwanted material to sift through.
The amount of unwanted material can be reduced substantially by using amethodological filter; for example, focusing on study types most likely to yieldsound data relevant to causality, and/or pertinent measures of association (oddsratio, relative risk, or hazard ratio).

Aetiology and risk factors 71
It needs to be noted that (as with our suggestion above) the ‘aetiological filter’excludes RCTs. In light of the beta-carotene example (see Section 9.1), if suchmethodological filters are to be used, then RCTs should be included as aspecific design option (as outlined in Section 6.2).
Your choice of a sensitive or a specific initial strategy will depend on yourpurpose — a fully comprehensive review requires the former as a starting point— and perhaps the size of the available literature (if it is small, you shouldprobably scan it all anyway). But if you simply want a reasonable array of sound,relevant studies, you should pursue a more restrictive search strategy from thestart.
Finally, a comprehensive review should include handsearching of currentrelevant journals and scanning bibliographies of retrieved articles. A usefulsource is the IARC Directory of Ongoing Research in Cancer Prevention(Sankaranarayanan et al 1996). This directory is available on the Internet fromthe IARC site.7
9.2.3 Finding unpublished primary studies
Relevant databases should be searched for possible unpublished work, includingthe database of dissertation abstracts. A number of services provide access tothis and similar databases of unpublished thesis work.
9.3 Appraising and selecting studies
9.3.1 Standardising the appraisal
The question at hand is whether any selection, measurement bias orconfounding is great enough to seriously distort the size (and qualitativeinterpretation) of the effect estimate. The importance of these errors will varywith study type and problems specific to the question at hand. For example,exposure measurement error will be minimal for a biochemical value studiedprospectively, but may be more important for self-reported exercise habits in acase-control study.
What study features should we assess?Individual studies can be reviewed against a set of methodological criteria,systematically applied within study types. There are many different checkliststhat give different weight to elements of the design and conduct of
7 www-dep.iarc.fr/prevent.htm
72 How to review the evidence
observational studies. Box 9.1 gives an example derived from Liddle et al(1996), which is a thoughtful publication in this area.
The problems of bias and their solutions are qualitatively similar for case-control studies and for RCTs, although exposure measurement is usually farmore challenging, and accessing a sufficient proportion of an appropriatecontrol group often provides difficulties for case-control studies.
A reviewer must give greatest weight to factors that are most problematic forthe issue under scrutiny, and then consistently assess their likely role in eachstudy. It is also essential to consider the practical consequences of error. If, forexample, despite the gross misclassification of physical activity due to poorpatient recall, a study shows an association with, say, lower risks ofosteoporosis, then the true effect of exercise is actually likely to be much largerthan that observed.
A. Has selection bias been minimised?
Sampling (selection and allocation) bias arises when noncomparable criteriahave been used to enrol participants in a retrospective, or case-control,investigation.
B. Have adequate adjustments been made for residual confounding?In an RCT, given a reasonable randomisation process (and large enough samplesize), confounding should not be an issue, whereas for observational research, itis always a possible explanation for an effect. Exactly how to proceed is notclear and attempts to deal with confounding in case-control and cohort studiesdeserve close attention (Colditz et al 1995). Studies that do not control forknown strong confounders (eg cigarette smoking in an analysis of diet andthroat cancer) are likely to be of little value. One approach that has been used isto document the range of covariates considered in each of the studies identifiedand use this information to qualitatively assess the magnitude of confoundingobserved across the studies at hand.
Better quality studies always address confounding openly and thoughtfully,although this could lead to different actions — for example, including allpossible confounders in a model, or excluding from a model variables that areshown not to confound, either practically (no/small change in estimate) ortheoretically (not associated with exposure or not a risk indicator for disease).
There will also be areas where knowledge of risk factors (and henceconfounders) is limited, leading some authors to ‘control’ for confounding,while others do not. Here, considering whether adjusted and crude estimatesdiffer may help judge whether confounder control implies higher quality. And itshould always be borne in mind that even careful statistical control of scores ofthe known possible confounders may be inadequate to deal with unknown or
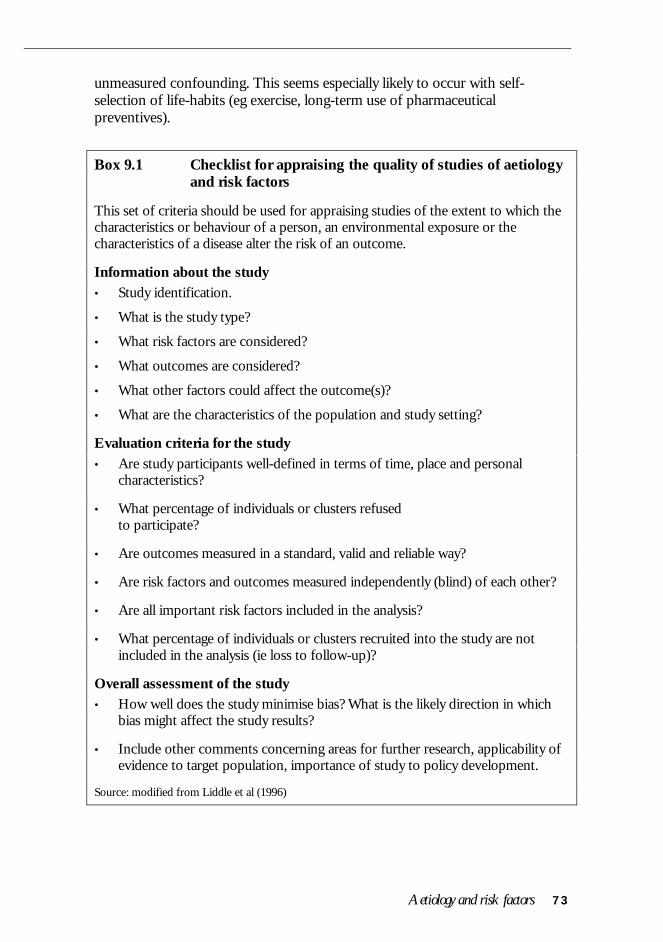
Aetiology and risk factors 73
unmeasured confounding. This seems especially likely to occur with self-selection of life-habits (eg exercise, long-term use of pharmaceuticalpreventives).
Box 9.1 Checklist for appraising the quality of studies of aetiologyand risk factors
This set of criteria should be used for appraising studies of the extent to which thecharacteristics or behaviour of a person, an environmental exposure or thecharacteristics of a disease alter the risk of an outcome.
Information about the study• Study identification.
• What is the study type?
• What risk factors are considered?
• What outcomes are considered?
• What other factors could affect the outcome(s)?
• What are the characteristics of the population and study setting?
Evaluation criteria for the study• Are study participants well-defined in terms of time, place and personal
characteristics?
• What percentage of individuals or clusters refusedto participate?
• Are outcomes measured in a standard, valid and reliable way?
• Are risk factors and outcomes measured independently (blind) of each other?
• Are all important risk factors included in the analysis?
• What percentage of individuals or clusters recruited into the study are notincluded in the analysis (ie loss to follow-up)?
Overall assessment of the study• How well does the study minimise bias? What is the likely direction in which
bias might affect the study results?
• Include other comments concerning areas for further research, applicability ofevidence to target population, importance of study to policy development.
Source: modified from Liddle et al (1996)
74 How to review the evidence
C. Was follow-up for final outcomes adequate?In a prospective study, ascertainment bias arises when the intensity ofsurveillance and follow-up varies according to the exposure status of studyparticipants. Documenting participation rates and methods of surveillance anddiagnosis of endpoints is essential to assess sampling bias. Ascertainment biasalso may arise when the actual diagnosis of interest is not independent of theexposure. This can arise in either prospective or retrospective studies.
D. Has measurement or misclassification bias been minimised?Collection of noncomparable information from cases and non-cases accountsfor measurement bias. This bias may arise when interviewers elicit informationdifferentially between different study groups. Alternatively, participants mayrecall information with different levels of accuracy depending on their pastdisease experience. In retrospective or case-control studies this is referred to asrecall bias.
Finally, measurement error due to general inaccuracy in the assessment ofexposure leads to bias in the measure of association between exposure andoutcome. In any study if such error in exposure assessment is random, it willlead to underestimates of the association between exposure and disease.
9.4 Summarising and synthesising the studies
9.4.1 Presenting the results of the studies
Summary tableA summary table is essential to show individual study characteristics. Youshould prepare a common data abstraction form on which to summarise themain elements of each study:
• descriptive data on numbers, demographic and other characteristics; and
• relevant outcome measures — frequencies, effect estimates (simple,adjusted, ordered) and confidence intervals or P-values, in particular.
And be warned — this abstract form should be extensively piloted beforestarting the summary table itself. It can be hard to imagine the array of differentways results of observational studies are presented. Early consultation with astatistician may also be helpful in deciding how to deal with (and record) anabsence of point estimates and/or confidence intervals; and factors that aresometimes treated as a cause (eg overweight) and elsewhere as preventive (eglow/normal weight). Analyses over a range of doses will also often be based ondifferent categories in different settings.

Aetiology and risk factors 75
Here and elsewhere in the presentation of results, it is best to begin byconsidering studies according to study design. That is, evaluate the prospectivestudies as a group and compare the results to those reported from theretrospective or case-control studies, and from any RCTs. Such presentationsets the stage for combining data within each study design type as a first step todata summarisation.
Graphical presentationThe best way to show the pattern of effects is to plot point estimates (generallyshown with 95% confidence intervals). There should be some sensible order tothe data; for example, ranking or grouping by quality score or study type, andexamining them for consistency (or lack thereof) first within and then acrossgroups. Whether or not it is sensible or useful to combine the estimates acrossall studies, or subgroups, is a decision to be made, as noted previously,according to subjective judgments (perhaps aided by a formal test ofheterogeneity) on the data pattern and the similarity of the studies.
9.4.2 Synthesis of study results
The estimates in observational studies will usually need to be adjusted for themajor confounding factors such as age, gender, etc. A quantitative synthesis willthus aim at combining these adjusted estimates. Hence, the methods describedfor interventions in Section 6.4 will only occasionally be applicable. However,the general principle will still be to obtain a weighted combination where theweights are the inverse of the variance of the study estimates. Thus the standarderror of each adjusted estimate will be required. If this is not given directly, itmay need to be inferred from the confidence interval (the width of which willbe about 4 standard errors of the log RR or OR on a log scale) or the exact P-value. Several software packages now automate these calculations for use inmeta-analysis.
Ideally, all studies should have been adjusted for all major confounders. If somehave not, then these would need to be grouped separately, or ‘external’adjustments made. A good general discussion of such methods for synthesis ofobservational studies is available in Rothman and Greenland (1998; chapter onmeta-analysis).
9.4.3 Assessing heterogeneity
Heterogeneity arises when the results vary among the studies more than can beattributed to chance (see Section 4.3). The ‘homogeneity assumption’ is that theresults of all studies estimate the same true effect and that the observedvariation is due to within-study sampling error. However, in practical researchapplications it is impossible to know whether this is true, and it is most likelythat it is not.

76 How to review the evidence
Many investigators use statistical tests of heterogeneity (lack of homogeneity) tosee whether the assumption is correct, and to evaluate the test at the P=0.05level (see Section 4.3). However, because tests for homogeneity have lowpower, homogeneity should not be assumed uncritically. That is, the purpose ofthe test is not to determine whether heterogeneity exists at all, but to get an ideaof how much heterogeneity exists.
For observational studies there are more sources of heterogeneity than forRCTs. For example, where a series of RCTs may have all used the same dosesof a drug and a common protocol for definition of the endpoint of interest,there is relatively little potential for variation among the studies. Forobservational studies, however, the approach to measuring the exposure mayvary among the studies, and the criteria used for diagnosis or the class ofendpoints studied often also differ. When the intensity of surveillance forendpoints differs across studies, there is a range of sources of heterogeneity.
Therefore, for observational studies, in particular, it is better to act as if there isheterogeneity among study results when the chi-square goodness-of-fit teststatistic is greater than the number of studies minus 1 (which is the mean valuewhen there is no heterogeneity).
If the purpose of meta-analysis is to study a broad issue then the true values canbe expected to vary from study to study, and both an estimate of this variabilityand the mean of the true values are important and should be reported (Colditzet al 1995). The contribution of factors such as study design and methods to theobserved heterogeneity can then be evaluated.
9.5 Judging causality
Once the most important features of the data and the heterogeneity betweenstudies have been explored with respect to study-specific flaws of sample (sizeand/or selection bias), measurement or confounding, the reviewer is positionedto explore formally whether the observed effects allow a causal interpretation.
• Is there a clear (reasonably strong) and important effect, which is fairlyconsistently seen, at least among the better studies?
• Has the effect been demonstrated in human experiments?
• Is this effect greater at higher exposures?
• Does it have an accepted or probable biological basis?
• Is it evident that the time-direction of the association is clear (cause alwaysprecedes effect)?

Aetiology and risk factors 77
Other elements may be added, such as those suggested by Bradford-Hill (1965).Studies that provide a critical test of a causal hypothesis are particularlyimportant. These will often be experimental studies, as with the beta-caroteneexample described in Section 9.1. However you approach it, there is no doubtthat a careful and logical assessment of the broad causal picture is extremelyhelpful to a reader struggling to understand the mass of facts a review maycontain.

79
10 PREDICTION AND PROGNOSIS
10.1 The question
Prognostic questions generally contain two parts:
• the definition of the patient population of interest (eg recent onset diabetes,newly detected colorectal cancer); and
• the outcomes of interest, such as morbidity and mortality.
The implicit third part of the usual three-part question is the set of risk factorsthat have been used for the prediction of prognosis. Section 9 looked at a singlerisk factor, with a particular focus on whether that risk factor was causallyassociated with the outcome. In this section this idea is extended but with afocus on prediction or prognosis for individuals. This section should thereforebe read in conjunction with Section 9 on risk factors but differs in two ways.
• First, the principal aim is prediction of outcomes, whether or not thefactors are causal. For example, an earlobe crease might be considered avalid marker of cardiovascular disease risk and form a useful part of a riskprediction model, though clearly it is a marker rather than being causal.
• Second, the combination of multiple factors for prediction will often givebetter prediction than the single factors considered in Section 9 (egFramingham cohort study risk equations for heart disease).
10.1.1 Why should we be interested in prediction?
There are two principal reasons for investigating questions about prediction.First, patients are intrinsically interested in their prognosis, so they can adaptand plan for their future. Second, separation of individuals with the samedisease into those at high and low risk may be extremely valuable inappropriately targeting therapy. Generally, those with high risk have more togain, and hence benefits are more likely to outweigh disadvantages, and also tobe more cost-effective — the importance of prognostic information in applyingthe results of systematic reviews and clinical trials is more fully specified in anaccompanying handbook in this series (How to Use the Evidence: Assessment andApplication of Scientific Evidence, NHMRC 2000a).
In using prognostic information to help decide on treatment, it is generallyimportant to know the ‘natural history’ of the condition. That is, what wouldhappen without any effective therapy. It is important to realise that this is oftenimpossible information to collect, as some therapy will often have been started.
80 How to review the evidence
Hence it is important to consider that prognosis is conditional. For example,you may ask about the prognosis of noninsulin dependent diabetic patientsconditional on antihypertensive treatment being given for high blood pressureand antihypercholesterolaemic agents being given for high cholesterol levels.
The placebo groups of trials may be considered a reasonable source ofinformation for natural history but even these groups will often be undergoingsome forms of treatment and the new treatment that is being compared withplacebo is an add-on to these other therapies.
10.1.2 Study design
The ideal study design for prognostic studies should focus on cohort studieswith an ‘inception’ cohort of patients with a condition followed for asufficiently long period of time for the major outcomes to have occurred.
10.2 Finding relevant studies
10.2.1 Finding existing systematic reviews
Systematic reviews for the influence of single factors on prognosis arebecoming more common (eg the effect of blood pressure level on stroke risk)and it is clearly worth trying to find them using the methods described in Part 1and Appendix C. However, there are methodological problems for systematicreviews that look at several prognostic factors simultaneously and hence only afew have been undertaken.
10.2.2 Finding published primary studies
The search strategies given in Appendix C (Haynes et al 1994) focus onidentifying longitudinal studies that potentially have such predictiveinformation. An important alternative to consider is the use of the controlgroups in RCTs, as this is often the only place where sufficient investment infollow-up has been made to be able to provide adequate information onprognosis.
10.2.3 Finding unpublished primary studies
Since there is no registry of prognostic studies, these will be particularly difficultto track down. Some exceptions occur when routine data are kept on a group ofpatients. For example, cancer registries provide locally-relevant survival data,although the degree of detail on prognostic factors varies considerably.
Prediction and prognosis 81
10.3 Appraising and selecting studies
10.3.1 Standardising the appraisal
What study features should we assess?The requirements for good quality information on prognosis are similar tothose of an RCT (see Section 6.3). The two principal differences are thatrandomisation is unnecessary, and that good baseline measurements of thepotential prognostic factors have been included. The following information iscritical to appraise.
A. Has selection bias been minimised?A consecutive or random sample of patients should have been selected at asimilar time point in their disease. If this is at the beginning of the disease, thisis known as an ‘inception cohort’.
B. Have adequate adjustments been made for residual confounding?Confounding plays a very different role when we are focused on risk predictionrather than aetiology. Even if ‘confounders’ are not causal, but merely goodmarkers of risk, they may be useful in a prognostic or prediction model. Hencethey do not need to be used for ‘adjustment’ but may be a useful part of themodel.
C. Was follow-up for final outcomes adequate?Having obtained a representative group through consecutive or randomselection, high rates of follow-up and inclusion of all patients are important.Hence, it is useful to extract and report data on the level of follow-up.
D. Has measurement or misclassification bias been minimised?Outcomes should preferably be measured blind to the prognostic factors beingconsidered. For example, knowing about factors such as cholesterol or smokingmay influence the decision about whether a person has ischaemic heart disease.This becomes more common if the outcome to be assessed is more subjectiveand hence more open to observer bias.
10.4 Summarising and synthesising the studies
10.4.1 Presenting the results of the studies
A summary table of the identified studies should be included with thecharacteristics of the study population, the follow-up and outcomes measured,and the quality features mentioned in the previous section.

82 How to review the evidence
In this case the data must be emphasised because multiple factors and synthesisacross several studies are usually much more difficult or even impossible to dealwith. Hence, it may be necessary to forgo any synthesis, and choose the ‘largest’acceptable quality study available. It should be noted, however, that the studywith the largest number of patients will not necessarily be the most statisticallyreliable. It is the outcomes that really provide the information, and this willdepend on three factors:
• the number of patients;• the length of follow-up; and• the level of risk of the patients.
The number of patients and the length of follow-up combined represent thetotal ‘person time’ of the study, which is commonly used as a measure of therelative power of studies.
10.4.2 Synthesis of study results
Combining studies is occasionally possible, although it is uncommon. Ideally,this would involve the use of individual patient data pooled from the studies.One example of this is the INDANA project, which has pooled the prognosticinformation from several trials of hypertension (Gueffier et al 1995). Anotherexample is the Atrial Fibrillation Trialists Collaborative, which has combinedprognostic information on patients with atrial fibrillation (Atrial FibrillationInvestigators 1994).
However, as discussed in Part 1, combining studies is sometimes impossibleand, even if it is possible, requires considerable effort and cooperation. It alsorelies on common prognostic factors having been measured at a baseline, and ina similar way. For example, the atrial fibrillation collaboration could not includethe predictive value of echocardiograms because most studies had not includedthis as a prognostic measure. Hence, such pooling will usually be confined tothe prognostic factors common to all studies.
(Statistical note: it may not be necessary to combine all of the individual data ina single file but may be sufficient to pool the variance–covariance matrices – seethe Handbook of Research Synthesis, Cooper and Hedges 1994.)
10.4.3 Assessing heterogeneity
When considering single prognostic factors, the issues and methods are similarto those for intervention studies (see Section 6.4.3). That is, is thereheterogeneity of the size of the effect, and is it explained by study design orpatient factors? However, for multiple factor prognostic studies, appropriatemethods have not been described. If there is a pooling of individual study datathen each factor within the multivariate model could be examined to checkwhether there were interactions with other factors.

83
APPENDIX A
MEMBERSHIP OF PRODUCTION TEAM FORHANDBOOK
NHMRC Assessment Panel
Professor Paul O’Brien (Chair) Department of Surgery,Monash Medical SchoolMember of HAC
Professor Chris Silagy Monash Institute of Public Health andHealth Services ResearchMember of HAC
Professor John McCallum Faculty of Health,University of Western SydneyMember of HAC
Consultant authors *Associate Professor Paul Glasziou Department of Social and Preventive
Medicine, University of QueenslandProfessor Les Irwig Department of Public Health and
Community Medicine, University ofSydney
Associate Professor Chris Bain Department of Social and PreventiveMedicine, University of Queensland
Professor Graham Colditz Harvard School of Public Health,United States
Technical writer/editor
Dr Janet Salisbury Biotext, CanberraSecretariat
Ms Roz Lucas, Ms Janine Keough,Ms Monica Johns
Health Advisory Unit,Office of NHMRC
*The authors would also like to acknowledge the assistance of Dr DianneO’Connell for provision of the Glossary and Table 1.2, Dr Joseph Lau for makingMetatest available and Ms Ann McKibbon for help with some of the searchmethods.

Appendixes 85
APPENDIX B
PROCESS REPORT
During the 1997–99 NHMRC triennium the Health Advisory Committeefocused its work on the areas of coordination and support rather than oncollating and reviewing scientific evidence. However, the committee recognisedthat a key part of its coordination and support function was to provide amethodology on how to develop evidence-based guidelines.
The NHMRC publication A Guide to the Development, Implementation and Evaluationof Clinical Practice Guidelines (NHMRC 1999), which had been produced by thehealth Advisory Committee as a resource for people wishing to develop clinicalpractice guidelines to a standard acceptable to the NHMRC, was revised during1998. Early in the revision process, the committee realised that there was a needfor a number of complementary handbooks to expand on the principlesoutlined in the document. This complementary series would cover other aspectsof the identification, collation and application of scientific evidence. It wasenvisaged that these handbooks would be of invaluable assistance to agencieswishing to develop clinical practice guidelines of a high standard eitherindependently, or on behalf of the NHMRC.
It was agreed that there would initially be five handbooks in the series:
• how to review the evidence;
• how to use the evidence;
• how to put the evidence into practice;
• how to present the evidence for consumers; and
• how to compare the costs and benefits.
They would be published individually to allow flexibility in their production andrevision, as well as to allow any later additions to the series.
Recognising the need for a transparent and competitive process for contractingthe services of an expert(s), tenders were sought for the preparation of eachhandbook. A selection committee was then appointed by the Health AdvisoryCommittee to consider the tenders.
Once the successful tenderers had been contracted to prepare the handbooks,an assessment panel, composed of Health Advisory Committee members, wasformed to manage the progress of each project (see Appendix A).
86 How to review the evidence
When first drafts of each handbook were received, they were distributed to asmall number of experts in that particular field for peer review. The documentswere subsequently revised in the light of these comments. A technical writerwas employed to ensure consistency in content and style within and betweenthe handbooks.
The finalised documents were referred, in turn, to the Health AdvisoryCommittee for approval before being forwarded to the NHMRC forendorsement.

Appendixes 87
APPENDIX C
LITERATURE SEARCHING METHODS
Finding existing systematic reviews
As discussed in Section 1, it is always worth checking to see whether a previoussystematic review or meta-analysis has already been done. Even if it needsmodification or updating, it will provide a useful base of studies and issues. Forinterventions, Cochrane reviews are available in the Cochrane Database ofSystematic Reviews (CDSR) in the Cochrane Library, which also contains theDatabase of Abstracts and Reviews (DARE). DARE compiles and appraisesmany nonCochrane reviews of both interventions and diagnostic accuracy.
Hunt and McKibbon (1997) have developed simple and complex searchstrategies for MEDLINE for finding systematic reviews and meta-analyses,which are applicable to all question types.
The simple search consists of the following steps:
1. meta-analysis (pt)
2. meta-anal: (tw)
3. review (pt) AND medline (tw)
4. 1 OR 2 OR 3
[pt = publication type; tw = textword; : = wildcard symbol]
The comprehensive search consists of the following steps:
1. meta-analysis (pt)
2. meta-anal: (tw)
3. metaanal: (tw)
4. quantitativ: review: OR quantitative: overview: (tw)
5. systematic: review: OR systematic: overview: (tw)
6. methodologic: review: OR methodologic: overview: (tw)
7. review (pt) AND medline (tw)
8. 1 OR 2 OR 3 OR 4 OR 5 OR 6 OR 7

88 How to review the evidence
An alternative strategy has recently been developed by the York Centre forReviews and Dissemination, United Kingdom.8
Finding randomised trials
The following search strategy (developed by Kay Dickersin) is used by theCochrane Collaboration to identify randomised trials in MEDLINE. Thissearch is run regularly and forms part of the process of identifying trials for theCochrane Controlled Trials Registry.
#1 RANDOMIZED-CONTROLLED-TRIAL in PT
#2 CONTROLLED-CLINICAL-TRIAL in PT
#3 RANDOMIZED-CONTROLLED-TRIALS
#4 RANDOM-ALLOCATION
#5 DOUBLE-BLIND-METHOD
#6 SINGLE-BLIND-METHOD
#7 #1 or #2 or #3 or #4 or #5 or #6
#8 TG=ANIMAL not (TG=HUMAN and TG=ANIMAL)
#9 #7 not #8
#10 CLINICAL-TRIAL in PT
#11 explode CLINICAL-TRIALS
#12 (clin* near trial*) in TI
#13 (clin* near trial*) in AB
#14 (singl* or doubl* or trebl* or tripl*) near (blind* or mask*)
#15 (#14 in TI) or (#14 in AB)
#16 PLACEBOS
#17 placebo* in TI
#18 placebo* in AB
#19 random* in TI
#20 random* in AB
#21 RESEARCH-DESIGN
#22 #10 or #11 or #12 or #13 or #15 or #16 or #17 or #18 or #19 or #20 or #21
#23 TG=ANIMAL not (TG=HUMAN and TG=ANIMAL)
8 www.york.ac.uk/inst/crd/search.htm
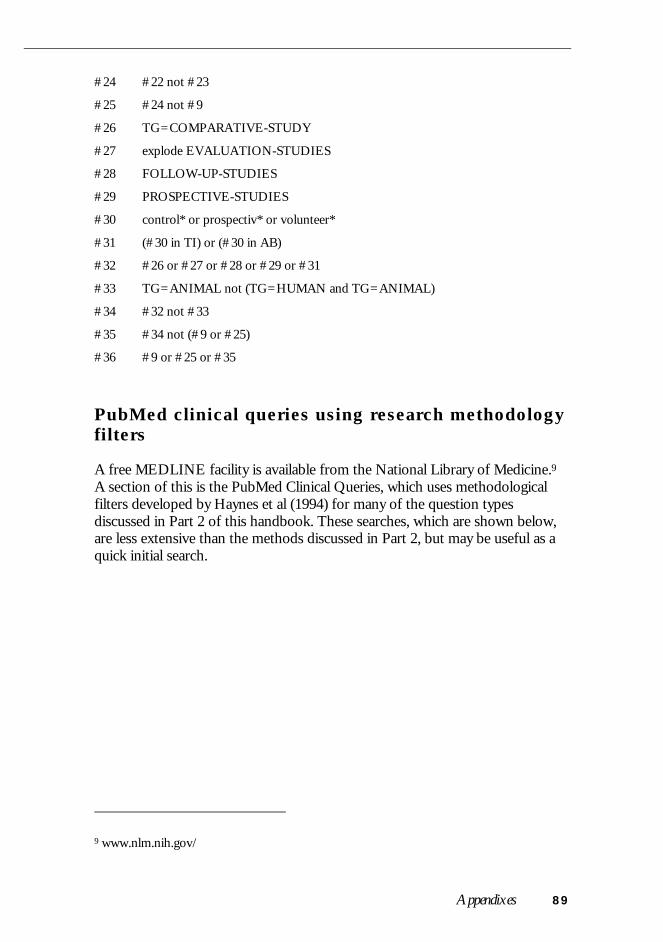
Appendixes 89
#24 #22 not #23
#25 #24 not #9
#26 TG=COMPARATIVE-STUDY
#27 explode EVALUATION-STUDIES
#28 FOLLOW-UP-STUDIES
#29 PROSPECTIVE-STUDIES
#30 control* or prospectiv* or volunteer*
#31 (#30 in TI) or (#30 in AB)
#32 #26 or #27 or #28 or #29 or #31
#33 TG=ANIMAL not (TG=HUMAN and TG=ANIMAL)
#34 #32 not #33
#35 #34 not (#9 or #25)
#36 #9 or #25 or #35
PubMed clinical queries using research methodologyfilters
A free MEDLINE facility is available from the National Library of Medicine.9A section of this is the PubMed Clinical Queries, which uses methodologicalfilters developed by Haynes et al (1994) for many of the question typesdiscussed in Part 2 of this handbook. These searches, which are shown below,are less extensive than the methods discussed in Part 2, but may be useful as aquick initial search.
9 www.nlm.nih.gov/

90 How to review the evidence
Clinical queries using research methodology filters
Category Optimisedfor:
ELHILL termsa Sensitivity/specificityb
PubMed equivalentc
sensitivity randomizedcontrolled trial (pt)or drug therapy(sh) or therapeuticuse (sh) or allrandom: (tw)
99%/74% ‘randomized controlled trial’[PTYP] | ‘drug therapy’ [SH] |‘therapeutic use’ [SH:NOEXP] |‘random*’ [WORD]
Therapy
specificity all double and allblind: (tw) or allplacebo: (tw)
57%/97% (double [WORD] & blind*[WORD]) | placebo [WORD]
sensitivity exp sensitivity a#dspecificity or allsensitivity (tw) ordiagnosis & (px) ordiagnostic use (sh)or all specificity(tw)
92%/73% ‘sensitivity and specificity’[MESH] | ‘sensitivity’ [WORD]| (‘diagnosis’ [SH] | ‘diagnosticuse’ [SH] | ‘specificity’ [WORD]
Diagnosis
specificity exp sensitivity a#dspecificity or allpredictive and allvalue: (tw)
55%/98% ‘sensitivity and specificity’[MESH] | ( ‘predictive’ [WORD]& ‘value*’ [WORD] )
sensitivity exp cohort studiesor exp risk or allodds and all ratio:(tw) or all relativeand all risk (tw) orall case and allcontrol: (tw)
82%/70% ‘cohort studies’ [MESH] | ‘risk’[MESH] | (‘odds’ [WORD] &‘ratio*’ [WORD]) | (‘relative’[WORD] & ‘risk’ [WORD]) |(‘case’ [WORD] & ‘control*’[WORD])
Aetiology
specificity case-controlstudies or cohortstudies
40%/98% ‘case-control studies’[MH:NOEXP] | ‘cohort studies’[MH:NOEXP]
sensitivity incidence or expmortality orfollow-up studiesor mortality (sh) orall prognos: (tw) orall predict: (tw) orall course (tw)
92%/73% ‘incidence’ [MESH] | ‘mortality’[MESH] | ‘follow-up studies’[MESH] | ‘mortality’ [SH] |prognos* [WORD] | predict*[WORD] | course [WORD]
Prognosis
specificity prognosis orsurvival analysis
49%/97% prognosis [MH:NOEXP] |‘survival analysis’ [MH:NOEXP]
a MEDLINE terms used by ELHILL (search engine for MEDLARS and Grateful MED)
b Sensitivity = the proportion of high quality studies in MEDLINE that are detected Specificity = the proportion of irrelevant or poorer quality studies detected
c Approximate equivalent in PubMed query language, as used on the Clinical Queries Using Research Methodology Filters page (www.ncbi.nlm.nuh.gov/entrez/query.fcgi)
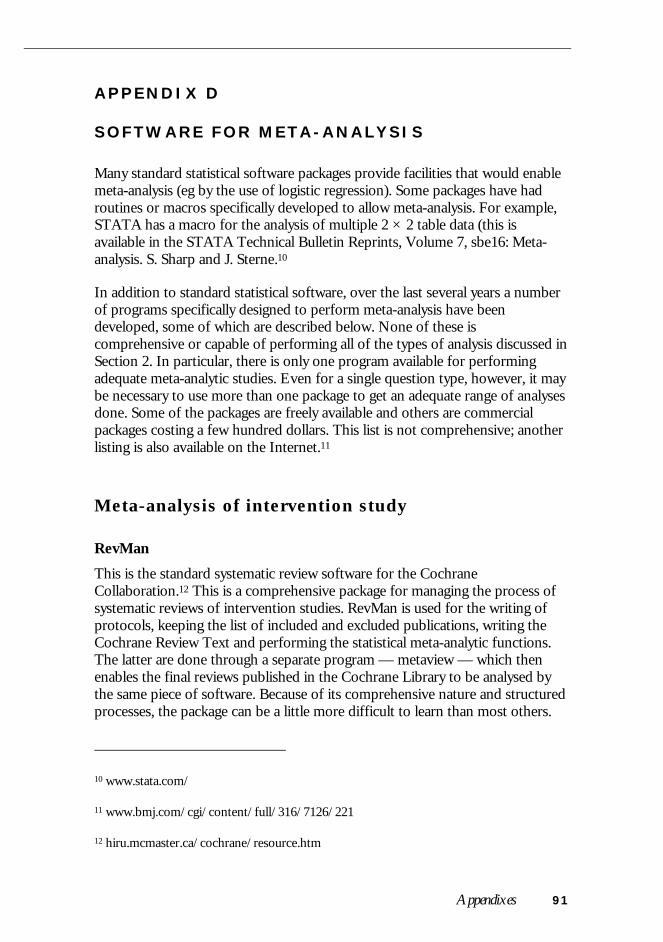
Appendixes 91
APPENDIX D
SOFTWARE FOR META-ANALYSIS
Many standard statistical software packages provide facilities that would enablemeta-analysis (eg by the use of logistic regression). Some packages have hadroutines or macros specifically developed to allow meta-analysis. For example,STATA has a macro for the analysis of multiple 2 × 2 table data (this isavailable in the STATA Technical Bulletin Reprints, Volume 7, sbe16: Meta-analysis. S. Sharp and J. Sterne.10
In addition to standard statistical software, over the last several years a numberof programs specifically designed to perform meta-analysis have beendeveloped, some of which are described below. None of these iscomprehensive or capable of performing all of the types of analysis discussed inSection 2. In particular, there is only one program available for performingadequate meta-analytic studies. Even for a single question type, however, it maybe necessary to use more than one package to get an adequate range of analysesdone. Some of the packages are freely available and others are commercialpackages costing a few hundred dollars. This list is not comprehensive; anotherlisting is also available on the Internet.11
Meta-analysis of intervention study
RevMan
This is the standard systematic review software for the CochraneCollaboration.12 This is a comprehensive package for managing the process ofsystematic reviews of intervention studies. RevMan is used for the writing ofprotocols, keeping the list of included and excluded publications, writing theCochrane Review Text and performing the statistical meta-analytic functions.The latter are done through a separate program — metaview — which thenenables the final reviews published in the Cochrane Library to be analysed bythe same piece of software. Because of its comprehensive nature and structuredprocesses, the package can be a little more difficult to learn than most others.
10 www.stata.com/
11 www.bmj.com/cgi/content/full/316/7126/221
12 hiru.mcmaster.ca/cochrane/resource.htm
92 How to review the evidence
MetaAnalyst
This is an MS-DOS program developed by Dr Joseph Lau at the New EnglandMedical Center and New England Cochrane Center in the United States.MetaAnalyst is designed to analyse a set of trials, each of whose data can bepresented as a 2 × 2 table. The program performs a wide variety of meta-analytic statistics on trial data, providing both fixed and random fixed modelsfor relative risk, odds ratio, and risk differences. It also provides heterogeneitystatistics, cumulative meta-analytic plots and regressions against control rate, allwith publication quality plots — however, the types of print are limited.
EasyMA
EasyMA is an MS-DOS program with a user-friendly interface developed tohelp physicians and medical researchers to synthesise evidence in clinical ortherapeutic research. The program was developed by the Michel Cucherat, ateaching hospital in Lyon, France. The latest version (99) is available on theInternet.13
SCHARP
The Survival Curve and Hazard Ratio Program (SCHARP) for meta-analysis ofindividual patient data was developed by the Medical Research Council CancerTrials Office, Cambridge, United Kingdom and the Instituto ‘Maria Negri’,Milan, Italy. This is a windows-based menu-driven program aimed at producingsummary survival plots and ‘forest plots’ of the hazard ratios.
Comprehensive Meta-analysis
This is a versatile Windows 95 program. Like RevMan it creates a database ofstudies, with full citations that can be imported from MEDLINE. Data may beentered in a wide variety of formats, with conversions performed automatically.The available effect size indices include mean difference, correlations, ratedifference, relative risk and odds ratio. The graphs allow subgroup andcumulative meta-analyses.14
13 www.spc.univ-lyon1.fr/~mcu/easyma/
14 www.Meta-analysis.com

Appendixes 93
Meta-analysis of diagnostic tests
Metatest
This is an MS-DOS program developed by Dr Joseph Lau at the New EnglandMedical Center and New England Cochrane Center in the United States. This isa software package that produces a meta-analysis of diagnostic test accuracies.The plots include simple plots of sensitivity and specificity with their confidenceintervals, summary receiver–operator curve (ROC) plots giving the data pointsof the individual studies, and a summary ROC (see Section 8). It is available onthe Internet.15
15 www.cochrane.org/cochrane/sadt.htm

Glossary
ATTENTION ALL READERS
Due to the 'cutting-edge' nature of the information contained in thishandbook 'How to Review the Evidence: Systematic Identification and Review of theScientific Literature', the definitions contained in the Glossary (on page 95)relating to magnitude of treatment effect and strength of evidence havebeen modified. For these terms, readers should refer to strength of evidenceand size of effect in the Glossary of the accompanying handbook 'How toUse the Evidence: Assessment and Application of Scientific Evidence ' (NHMRC2000a).

95
GLOSSARY
Absolute risk reductionThe effect of a treatment can be expressed as the difference betweenrelevant outcomes in the treatment and control groups by subtracting onerate (given by the proportion who experienced the event of interest) fromthe other. The reciprocal is the number needed to treat (NNT).
Accuracy (see also validity)The degree to which a measurement represents the true value of thevariable which is being measured.
Adverse eventA nonbeneficial outcome measured in a study of an intervention that mayor may not have been caused by the intervention.
Allocation (or assignment to groups in a study)The way that subjects are assigned to the different groups in a study (egdrug treatment/placebo; usual treatment/no treatment). This may be by arandom method (see randomised controlled trial) or a nonrandom method(see pseudorandomised controlled study).
Applicability (see also external validity, generalisability)The application of results to both individual patients and groups of patients.This term is preferred to generalisability as it includes the idea ofparticularising or individualising treatment and is closest to the general aimof clinical practice. It addresses whether a particular treatment that showedan overall benefit in a study can be expected to convey the same benefit toan individual patient.
Before-and-after study (see also pretest–post-test study)A study design where a group of subjects is studied before and after anintervention. Interpretation of the result is problematic as it is difficult toseparate the effect of the intervention from the effect of other factors.
BiasBias is a systematic deviation of a measurement from the ‘true’ value leadingto either an over- or underestimation of the treatment effect. Bias canoriginate from many different sources, such as allocation of patients,measurement, interpretation, publication and review of data.

96 How to review the evidence
BlindingBlinding or masking is the process used in epidemiological studies andclinical trials in which the observers and the subjects have no knowledge asto which treatments subjects are assigned to. This is done in order tominimise bias occurring in patient response and outcome measurement. Insingle-blind studies only the subjects are blind to their allocations, whilst indouble-blind studies both observers and subjects are ignorant of thetreatment allocations.
Bradford-Hill criteria (see causality)
Case-control studyPatients with a certain outcome or disease and an appropriate group ofcontrols without the outcome or disease are selected (usually with carefulconsideration of appropriate choice of controls, matching, etc) and theninformation is obtained on whether the subjects have been exposed to thefactor under investigation.
Case seriesThe intervention has been used in a series of patients (may or may not beconsecutive series) and the results reported. There is no separate controlgroup for comparison.
CausalityThe relating of causes to the effects they produce. The Bradford–Hillcriteria for causal association are: temporal relationship (exposure alwaysprecedes the outcome — the only essential criterion), consistency, strength,specificity, dose–response relationship, biological plausibility, coherence andexperiment.
Clinical outcomeAn outcome for a study that is defined on the basis of the disease beingstudied (eg fracture in osteoporosis, peptic ulcer healing and relapse rates).
Clinically important effect (see also statistically significant effect)An outcome that improves the clinical outlook for the patient. Therecommendations made in clinical practice guidelines should be both highlystatistically significant and clinically important (so that the 95% confidenceinterval includes clinically important effects).
Glossary 97
Cochrane CollaborationThe Cochrane Collaboration is an international network that aims toprepare, maintain and disseminate high quality systematic reviews based onrandomised controlled trials (RCTs) and, when RCTs are not available, thebest available evidence from other sources. It promotes the use of explicitmethods to minimise bias, and rigorous peer review.
Cohort studyData are obtained from groups who have been exposed, or not exposed, tothe new technology or factor of interest (eg from databases). Carefulconsideration is usually given to patient selection, choice of outcomes,appropriate controls, matching, etc. However, data on outcomes may belimited.
Comparative studyA study including a comparison or control group.
Concurrent controlsControls receive the alternative intervention and undergo assessmentconcurrently with the group receiving the new intervention. Allocation tothe intervention or control is not random.
Confidence interval (CI)An interval within which the population parameter (the ‘true’ value) isexpected to lie with a given degree of certainty (eg 95%).
ConfoundingThe measure of a treatment effect is distorted because of differences invariables between the treatment and control groups that are also related tothe outcome. For example, if the treatment (or new intervention) is trialledin younger patients then it may appear to be more effective than thecomparator, not because it is better, but because the younger patients hadbetter outcomes.
Cross-sectional studyA study that examines the relationship between diseases (or other health-related characteristics) and other variables of interest as they exist in adefined population at one particular time (ie exposure and outcomes areboth measured at the same time).

98 How to review the evidence
Cumulative meta-analysisIn a systematic review, the results of the relevant studies are ordered bysome characteristic, and sequential pooling of the trials is undertaken inincreasing or decreasing order.
Degrees of freedom (df)The number of independent comparisons that can be made between themembers of a sample.
DiscountingThe process by which benefits and costs are adjusted to net present valuesto take account of differential timing.
Double-blind study (see blinding)
Ecological fallacyThe bias that may occur because an association observed between variableson an aggregate (eg study or country) level does not necessarily representthe association that exists at an individual (subject) level.
Effect modification, effect modifier (see also interaction)The relationship between a single variable (or covariate) and the treatmenteffect. Significant interaction between the treatment and such a variableindicates that the treatment effect varies across levels of this variable.
EffectivenessThe extent to which an intervention produces favourable outcomes underusual or everyday conditions.
EfficacyThe extent to which an intervention produces favourable outcomes underideally controlled conditions such as in a randomised controlled trial.
Efficiency (technical and allocative)The extent to which the maximum possible benefit is achieved out ofavailable resources.
EvidenceData about the effectiveness of a new treatment or intervention derivedfrom studies comparing it with an appropriate alternative. Preferably theevidence is derived from a good quality randomised controlled trial, but itmay not be.

Glossary 99
Evidence-based medicine/health careThe process of finding relevant information in the medical literature toaddress a specific clinical problem. Patient care based on evidence derivedfrom the best available studies.
External validity (see also generalisability, applicability)Also called generalisability or applicability, is the degree to which the resultsof a study can be applied to situations other than those under considerationby the study, for example, for routine clinical practice.
ExtrapolationRefers to the application of results to a wider population and means toinfer, predict, extend or project the results beyond that which was recorded,observed or experienced.
Generalisability (see also external validity, applicability)Refers to the extent to which a study’s results provide a correct basis forgeneralisation beyond the setting of the study and the particular peoplestudied. It implies the application of the results of a study to another groupor population.
Gold standardA method, procedure or measurement that is widely regarded or acceptedas being the best available. Often used to compare with new methods.
Hazard ratio (HR)When time to the outcome of interest is known, this is the ratio of thehazards in the treatment and control groups where the hazard is theprobability of having the outcome at time t, given that the outcome has notoccurred up to time t.
HeterogeneityRefers to the differences in treatment effect between studies contributing toa meta-analysis. If there is significant heterogeneity, this suggests that thetrials are not estimating a single common treatment effect.
Historical controlsData from either a previously published series or previously treated patientsat an institution that are used for comparison with a prospectively collectedgroup of patients exposed to the technology or intervention of interest atthe same institution.

100 How to review the evidence
IncidenceThe number of new events (new cases of a disease) in a defined population,within a specified period of time.
Intention to treatAn analysis of a clinical trial where participants are analysed according tothe group to which they were initially randomly allocated, regardless ofwhether or not they dropped out, fully complied with the treatment, orcrossed over and received the other treatment. By preserving the originalgroups one can be more confident that they are comparable.
InteractionThe relationship between a single variable (or covariate) and the treatmenteffect.
Interrupted time seriesTreatment effect is assessed by comparing the pattern of (multiple) pretestscores and (multiple) post-test scores (after the introduction of theintervention) in a group of patients. This design can be strengthened by theaddition of a control group which is observed at the same points in time butthe intervention is not introduced to that group. This type of study can alsouse multiple time series with staggered introduction of the intervention.
InterventionAn intervention will generally be a therapeutic procedure such as treatmentwith a pharmaceutical agent, surgery, a dietary supplement, a dietary changeor psychotherapy. Some other interventions are less obvious, such as earlydetection (screening), patient educational materials, or legislation. The keycharacteristic is that a person or their environment is manipulated in thehope of benefiting that person.
Level of evidenceStudy designs are often grouped into a hierarchy according to their validity,or degree to which they are not susceptible to bias. The hierarchy indicateswhich studies should be given most weight in an evaluation.
Magnitude of treatment effectRefers to the size (or the distance from the null value indicating notreatment effect) of the summary measure (or point estimate) of thetreatment effect and the values included in the corresponding 95%confidence interval.

Glossary 101
Meta-analysisResults from several studies, identified in a systematic review, are combinedand summarised quantitatively.
Meta-regressionThe fitting of a linear regression model with an estimate of the treatmenteffect as the dependent variable and study level descriptors as theindependent variables.
Nonrandomised cross-over designParticipants in a trial are measured before and after introduction orwithdrawal of the intervention and the order of introduction andwithdrawal is not randomised.
Null hypothesisThe hypothesis that states that there is no difference between two or moreinterventions or two or more groups (eg males and females). The nullhypothesis states that the results observed in a study (eg the apparentbeneficial effects of the intervention) are no different from what might haveoccurred as a result of the operation of chance alone.
Number needed to harm (NNH) (see also number needed to treat)When the treatment increases the risk of the outcome, then the inverse ofthe absolute risk reduction is called the number needed to harm.
Number needed to treat (NNT) (see also number needed to harm)When the treatment reduces the risk of specified adverse outcomes of acondition, NNT is the number of patients with a particular condition whomust receive a treatment for a prescribed period in order to prevent theoccurrence of the adverse outcomes. This number is the inverse of theabsolute risk reduction.
Observational studiesAlso known as epidemiological studies. These are usually undertaken byinvestigators who are not involved in the clinical care of the patients beingstudied, and who are not using the technology under investigation in thisgroup of patients.
Odds ratio (OR)Ratio of the odds of the outcome in the treatment group to thecorresponding odds in the control group.

102 How to review the evidence
Patient expected event rate (PEER)The probability that a patient will experience a particular event (eg a strokeor myocardial infarction) if left untreated. Also known as baseline risk.
Patient-relevant outcomeAny health outcome that is meaningful to the patient. It can be the bestsurrogate outcome, resources provided as part of treatment, impact onproductivity (indirect) or one that cannot be measured accurately (eg pain,suffering). Common examples include: primary clinical outcomes, quality-of-life and economic outcomes.
Post-test only studyPatients undergo the intervention being studied and outcomes aredescribed. This does not allow any comparisons.
Pretest–post-test studyOutcomes (pain, symptoms, etc) are measured in study participants beforereceiving the intervention being studied and the same outcomes aremeasured after. ‘Improvement’ in the outcome is reported. Often referredto as before-and-after studies.
PrecisionStatistical precision indicates how close the estimate is to the true value. It isdefined as the inverse of the variance of a measurement or estimate.
PrevalenceThe measure of the proportion of people in a population who have someattribute or disease at a given point in time or during some time period.
Prognostic modelA statistical model that estimates a person’s probability of developing thedisease or outcome of interest from the values of various characteristics(such as age, gender, risk factors).
Pseudorandomised controlled studyAn experimental comparison study in which subjects are allocated totreatment/intervention or control/placebo groups in a nonrandom way(such as alternate allocation, allocation by day of week, odd–even studynumbers, etc). These groups may therefore differ from each other in waysother than the presence of the intervention being tested. This contrasts to‘true’ experiments (RCTs) where the outcomes are compared for groupsformed by random assignment (and are therefore equivalent to each otherin all respects except for the intervention).

Glossary 103
Publication biasBias caused by the results of a trial being more likely to be published if astatistically significant benefit of treatment is found.
P-value (see also confidence interval, statistically significant effect)The probability (obtained from a statistical test) that the null hypothesis(that there is no treatment effect) is incorrectly rejected.
NOTE: The P-value is often misunderstood. It does not, as commonlybelieved, represent the probability that the null hypothesis (that there is notreatment effect) is true (a small P-value therefore being desirable). The P-value obtained from a statistical test corresponds to the probability ofclaiming that there is a treatment effect when in fact there is no real effect.
Quality of evidenceDegree to which bias has been prevented through the design and conductof research from which evidence is derived.
Quality of lifeThe degree to which a person perceives themselves able to functionphysically, emotionally and socially. In a more ‘quantitative’ sense, anestimate of remaining life free of impairment, disability or handicap ascaptured by the concept of quality-adjusted life-years (QALYs).
Random errorThe portion of variation in a measurement that has no apparent connectionto any other measurement or variable, generally regarded as due to chance.
RandomisationA process of allocating participants to treatment or control groups within acontrolled trial by using a random mechanism, such as coin toss, randomnumber table, or computer-generated random numbers.
Randomised controlled trialAn experimental comparison study in which participants are allocated totreatment/intervention or control/placebo groups using a randommechanism (see randomisation). Participants have an equal chance of beingallocated to an intervention or control group and therefore allocation bias iseliminated.

104 How to review the evidence
Randomised cross-over trialPatients are measured before and after exposure to different interventions(or placebo) which are administered in a random order (and usuallyblinded).
Relative risk or risk ratio (RR)Ratio of the proportions in the treatment and control groups with theoutcome. This expresses the risk of the outcome in the treatment grouprelative to that in the control group.
Relative risk reduction (RRR)The relative reduction in risk associated with an intervention. This measureis used when the outcome of interest is an adverse event and theintervention reduces the risk. It is calculated as one minus the relative risk,or:
RRR = 1 – (event rate in treatment group/event rate in control group)
ReliabilityAlso called consistency or reproducibility. The degree of stability that existswhen a measurement is repeatedly made under different conditions or bydifferent observers.
Risk difference (RD)The difference (absolute) in the proportions with the outcome between thetreatment and control groups. If the outcome represents an adverse event(such as death) and the risk difference is negative (below 0) this suggeststhat the treatment reduces the risk — referred to as the absolute riskreduction.
Selection biasError due to systematic differences in characteristics between those who areselected for study and those who are not. It invalidates conclusions andgeneralisations that might otherwise be drawn from such studies.
Statistically significant effect (see also clinically important effect)An outcome for which the difference between the intervention and controlgroups is statistically significant (ie the P-value is � 0.05). A statisticallysignificant effect is not necessarily clinically important.

Glossary 105
Strength of evidenceMagnitude, precision and reproducibility of the intervention effect (includesmagnitude of the effect size, confidence interval width, P-value, and theexclusion of clinically unimportant effects). In the case of nonrandomisedstudies, additional factors such as biological plausibility, biological gradientand temporality of associations may be considered.
Surrogate outcomePhysiological or biochemical markers that can be relatively quickly andeasily measured and that are taken as predictive of important clinicaloutcomes. They are often used when observation of clinical outcomesrequires longer follow-up. Also called intermediate outcome.
Systematic reviewThe process of systematically locating, appraising and synthesising evidencefrom scientific studies in order to obtain a reliable overview.
Time seriesA set of measurements taken over time. An interrupted time series isgenerated when a set of measurements is taken before the introduction ofan intervention (or some other change in the system), followed by anotherset of measurements taken over time after the change.
Validity
• Of measurement: an expression of the degree to which a measurementmeasures what it purports to measure; it includes construct and contentvalidity.
• Of study: the degree to which the inferences drawn from the study arewarranted when account is taken of the study methods, therepresentativeness of the study sample, and the nature of the populationfrom which it is drawn (internal and external validity, applicability,generalisability).
VarianceA measure of the variation shown by a set of observations, defined by thesum of the squares of deviation from the mean, divided by the number ofdegrees of freedom in the set of observations.

107
ACRONYMS AND ABBREVIATIONS
AIDS acquired immune deficiency syndrome
CCTR Cochrane Controlled Trials Registry
CD-ROM Compact disk-read only memory
CDSR Cochrane Database of Systematic Reviews
CI confidence interval
Cochran Q Cochran chi-square
DARE Database of Abstracts and Reviews, Cochrane Library
df degrees of freedom
exp explode
FPR false positive rate
HR hazard ratio
IARC International Agency for Research on Cancer
MeSH Medical Subject Heading
NHMRC National Health and Medical Research Council
NLM National Library of Medicine (United States)
NNH number needed to harm
NNT number needed to treat
OR odds ratio
P-value probability
RCT randomised controlled trial
RD risk difference
ROC receiver–operator curve
RR relative risk/risk ratio
SCHARP Survival Curve and Hazard Ratio Program developed by MRCCancer Trials Office, Cambridge, United Kingdom
SROC summary receiver–operator curve
TPR true positive rate
109
REFERENCES
Allen IE and Olkin I (1999). Estimating time to conduct a meta-analysis fromnumber of citations retrieved. Journal of the American Medical Association282:634–635.
Atrial Fibrillation Investigators (1994). Risk factors for stroke and efficacy ofantithrombotic therapy in atrial fibrillation: pooled data from five randomisedcontrolled trials. Archives of Internal Medicine 28:957–960.
Begg CB and Mazumdar M (1994). Operating characteristics of a rank correlationtest for publication bias. Biometrics 50:1088–1101.
Berlin J (1997). Does blinding of readers affect the results of meta-analyses? Lancet350:185–186.
Bradford-Hill A (1965). The environment and disease: association or causation.Proceedings of the Royal Society of Medicine 58:295–300.
Brenner HS and Savitz DA (1990). The effects of sensitivity and specificity of caseselection on validity, sample size, precision, and power in hospital-based case-control studies. American Journal of Epidemiology 132:181–192.
Breslow NE and Day NE (1987). Statistical methods in cancer research 2: Thedesign and analysis of cohort studies. Lyon: IARC.
Bruns DE (1997). Reporting diagnostic accuracy. Clinical Chemistry 43:2211.
Caldwell M and Watson R (1994). Peritoneal aspiration cytology as a diagnostic aidin acute appendicitis. British Journal of Surgery 81:276–278.
Colditz GA, Burdick E and Mosteller F (1995). Heterogeneity in meta-analysis ofdata from epidemiologic studies: a commentary. American Journal ofEpidemiology 142:371–382.
Cooper AJ (1998). Systematic review of Propionibacterium acnes resistance to systemicantibiotics. Medical Journal of Australia 169:259–261.
Cooper H and Hedges LV (eds) (1994). Handbook of Research Synthesis. NewYork: Russell Sage Foundation.
Detsky A, Naylor CD, O’Rourke K, McGreer AJ and L’Abbe KA (1992).Incorporating variations in the quality of individual randomized trials intometa-analysis. Journal of Clinical Epidemiology 45:255–265.
Dickersin K, Min YI and Meinert CL (1992). Factors influencing publication ofresearch results: followup of applications submitted to two institutional reviewboards. Journal of the American Medical Association 267:374–378.
Stoddart GL and Torrance GW (1997). Methods forthe Economic Evaluation of Health Care Programmes. Oxford: OxfordUniversity Press.
110 How to review the evidence
EBCTCG (Early Breast Cancer Trialists’ Collaborative Group) (1992). Systematictreatment of early breast cancer by hormonal cytotoxic or immune therapy: 133randomised trials involving 31,000 recurrences and 24,000 deaths among75,000 women. Lancet 339:71–85.
Egger M, Smith GD, Schneider M and Minder C (1997). Bias in meta-analysisdetected by a simple, graphical test. British Medical Journal 315:629–634.
Fahey M, Irwig L and Macaskill P (1995). Meta analysis of pap test accuracy.American Journal of Epidemiology 141:680–689.
Gelber R and Goldhirsch A (1987). Interpretation of results from subset analyseswithin overviews of randomised clinical trials. Statistics in Medicine 6:371–378.
Gueffier F, Boutitie F, Boissel JP et al (1995). INDANA: a meta-analysis onindividual patient data in hypertension. Protocol and preliminary results.Therapie 50:353–362.
Guyatt GH and Rennie D (1993). User’s guide to medical literature. Journal of theAmerican Medical Association 270:2096–2097.
Guyatt GH, Sackett DL and Cook DJ (1993). Users’ guides to the medicalliterature. II. How to use an article about therapy or prevention. A. Are theresults of the study valid? Evidence-Based Medicine Working Group. Journalof the American Medical Association 270:2598–2601.
Guyatt GH, Sackett DL and Cook DJ (1994). Users’ guides to the medicalliterature. II. How to use an article about therapy or prevention. B. What werethe results and will they help me in caring for my patients? Journal of theAmerican Medical Association 271:59–63.
Hasselblad V and Hedges LV (1995). Meta-analysis of screening and diagnostictests. Psychological Bulletin 117:167–178.
Haynes RB, Wilczynski N, McKibbon KA, Walker CJ and Sinclair JC (1994).Developing optimal search strategies for detecting clinically sound studies inMedline. Journal of the American Medical Informatics Association 1:447–458.
Henry D (1992). Economic analysis as an aid to subsidisation decisions: thedevelopment of Australian guidelines for pharmaceuticals.PharmacoEconomics 1:54–67.
Hunt DL and McKibbon KA (1997). Locating and appraising systematic reviews.Annals of Internal Medicine 126:532–38.(www.acponline.org/journals/annals/01apr97/ systemat.htm)
Irwig L, Tosteson ANA, Gastonis C et al (1994). Guidelines for meta-analysesevaluation of diagnostic tests. Annals of Internal Medicine 120:667–676.
Irwig L, Macaskill P, Glasziou P et al (1995). Meta-analytic methods for diagnostictest accuracy. Journal of Clinical Epidemiology 48:119–130.
Jaeschke R, Guyatt G and Sackett DL (1994a). Users’ guides to the medicalliterature. III. How to use an article about a diagnostic test. A. Are the resultsvalid? Journal of the American Medical Association 271:389–391.

References 111
Jaeschke R, Guyatt GH and Sackett DL (1994b). Users’ guides to the medicalliterature. III. How to use an article about a diagnostic test. B. What are theresults and will they help me in caring for my patients? Journal of the AmericanMedical Association 271:703–707.
Juni P, Witschi A, Bloch R and Egger M (1999). The hazards of scoring the qualityof clinical trials for meta-analysis. Journal of the American Medical Association208:1054–1060.
L’Abbe KA, Detsky AS and O’Rourke K (1987). Meta-analysis in clinical research.Annals of Internal Medicine 107:224–233.
Liddle J, Williamson M and Irwig L (1996). Method for Evaluating Research andGuideline Evidence. Sydney: NSW Health Department.
Lijmer J, Mol B, Heisterkamp S, Bonsel GJ and Bossuyt P (1999). Empiricalevidence of bias in the evaluation of diagnostic tests. Journal of the AmericanMedical Association 282:1061–1066.
Linde K, Ramirez G, Mulrow CD, Pauls A, Weidenhammer W and Melchart D(1996). St John’s wort for depression—an overview and meta-analysis ofrandomised clinical trials. British Medical Journal 313:253–258.
Loy CT, Irwig LM, Katelaris PH and Talley NJ (1996). Do commercial serologicalkits for Helicobacter pylori infection differ in accuracy? A meta-analysis. AmericanJournal of Gastroenterology 91:1138–1144.
McKibbon A, Eady A and Marks S (1999). PDQ Evidence-Based Principles andPractice. Hamilton: BC Becker Inc.
McManus RJ, Wilson S, Delaney BC et al (1998). Review of the usefulness ofcontacting other experts when conducting a literature search for systematicreviews. British Medical Journal 317:1562–-1563.
Mahoney MJ (1977). Publications prejudices: an experimental study of confirmatorybias in the peer review system. Cognitive Therapy and Research 1:161–175.
Moons KG, van Es GA, Deckers JW, Habbema JD and Grobbee DE (1997).Limitations of sensitivity, specificity, likelihood ratio and Bayes’ Theorem inassessing diagnostic probabilities: a clinical example. Epidemiology 8:12–17.
Moses L, Shapiro D and Littenberg B (1993). Combining independent studies of adiagnostic test into a summary ROC curve: data analytic approaches and someadditional considerations. Statistics in Medicine 12:1293–1316.
Mulrow CD and Oxman A (1996). How to conduct a Cochrane Systematic Review.3. Oxford: The Cochrane Collaboration.
Mulrow CD and Oxman A (1997). Cochrane Collaboration Handbook [updatedSept 1997]. Oxford: The Cochrane Collaboration.
NHMRC (National Health and Medical Research Council) (1999). A Guide to theDevelopment, Implementation and Evaluation of Clinical Practice Guidelines.Canberra: NHMRC.

112 How to review the evidence
NHMRC (2000a). How to Use the Evidence: Assessment and Application ofScientific Evidence. Canberra: NHMRC.
NHMRC (2000b). How to Compare the Costs and Benefits: Evaluation of theEconomic Evidence. Canberra: NHMRC.
Reid MC, Lachs MS and Feinstein AR (1995). Use of methodological standards indiagnostic test research. Getting better but still not good. Journal of theAmerican Medical Association 274:645–651.
Rosenthal A (1979). The file drawer problem and tolerance for null results.Psychological Bulletin 86:638–641.
Rothman KJ and Greenland S (1998). Modern Epidemiology. Philadelphia:Lippincott-Raven.
Sankaranarayanan R, Becker N and Demaret E (1996). Directory of OngoingResearch in Cancer Epidemiology. International Agency for Cancer Reseach(IARC) Scientific Publication No 137. (see www-dep.iarc.fr/prevent.htm )
Schmid CH, McIntosh M, Cappelleri JC, Lau J and Chalmers TC (1995). Measuringthe impact of the control rate in meta-analysis of clinical trials. ControlledClinical Trials 16:66s.
Schmid CH, Lau J, McIntosh M and Cappelleri JC (1998). An empirical study ofthe effect of the control rate as a predictor of treatment efficacy in meta-analysis of clinical trials. Statistics in Medicine 17:1923–1942.
Schulz KF, Chalmers I, Hayes RJ et al (1995). Empirical evidence of bias:dimensions of methodological quality associated with estimates of treatmenteffects in controlled trials. Journal of the American Medical Association273:408–412.
Simes RJ (1987). Confronting publication bias: a cohort design for meta-analysis.Statistics in Medicine 6:11–29.
Stern J and Simes RJ (1997). Publication bias: evidence of delayed publication in acohort study of clinical research projects. British Medical Journal 315:640–645.
Thompson SG (1995). Why sources of heterogeneity in meta-analysis should beinvestigated. British Medical Journal 309:1351–1355.
Towler B, Irwig L, Glasziou P, Kewenter J, Weller D and Silagy C (1998). Asystematic review of the effects of screening for colorectal cancer using thefaecal occult blood test, Hemoccult. British Medical Journal 317:559–565.
Tramer MR, Reynolds DJM, Moore RA and McQuay HJ (1997). Impact of covertduplicate publication on meta-analysis: a case study. British Medical Journal315:635–640.
Valenstein PN (1990). Evaluating diagnostic tests with imperfect standards.American Journal of Clinical Pathology 93:252–258.
Whitehead A and Whitehead J (1991). A general parametric approach to the meta-analysis of randomized clinical trials. Lancet 10:1665–1677.