Embed Size (px)
Citation preview
System Wide Modelingfor the JPDO
Shahab Hasan, LMIPresented on behalf of Dr. Sherry Borener, JPDO EAD Director
Nov. 16, 2006

2
Evaluation and Analysis Division
Outline
• Quick introduction to the JPDO, NGATS, and EAD
• Modeling Overview
• Constraints Analysis
• Portfolio Analysis
3
Evaluation and Analysis Division
Outline
• Quick introduction to the JPDO, NGATS, and EAD
• Modeling Overview
• Constraints Analysis
• Portfolio Analysis
4
Evaluation and Analysis Division
What is the JPDO?
• Joint Planning and Development Office– http://www.jpdo.aero/
• Interagency effort: FAA, NASA, Departments of Transportation, Defense, Homeland Security, and Commerce, and Office of Science and Technology Policy
• Coordinated federal effort to apply R&D resources to address current and looming issues with the nation’s air transportation system– Focused on the far-term, rather than incremental modernization
• Ultimate product is the Next Generation Air Transportation System (NGATS or NextGen)

5
Evaluation and Analysis Division
JPDO Goals
Expand Capacity
Ensure Safety
Protect the Environment
Ensure our National Defense
Secure the Nation
Retain U.S. Leadershipin Global Aviation
6
Evaluation and Analysis Division
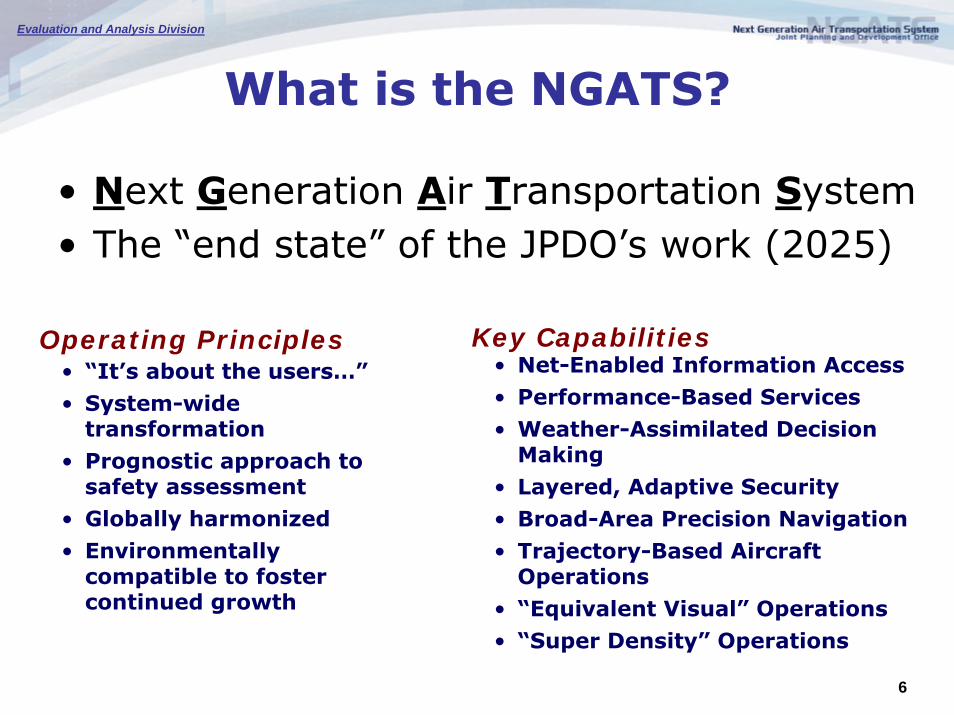
What is the NGATS?
• Next Generation Air Transportation System• The “end state” of the JPDO’s work (2025)
Operating Principles• “It’s about the users…”• System-wide
transformation• Prognostic approach to
safety assessment• Globally harmonized• Environmentally
compatible to foster continued growth
• Net-Enabled Information Access• Performance-Based Services• Weather-Assimilated Decision
Making• Layered, Adaptive Security• Broad-Area Precision Navigation• Trajectory-Based Aircraft
Operations• “Equivalent Visual” Operations• “Super Density” Operations
Key Capabilities

7
Evaluation and Analysis Division
JPDO OrganizationJPDO Organization
JPDO September 15, 2006

8
Evaluation and Analysis Division
EAD Mission and TeamThe Evaluation and Analysis Division (EAD) assesses strategies for transforming the NAS and meeting the high level national goals and provides the JPDO principals with trade-offs. This provides the knowledge necessary to prioritize JPDO investments.
• Assess the impact of JPDO operational improvements:– Benefit pools: estimate the benefits envelope– Estimated benefits: estimate benefits of specific improvements

9
Evaluation and Analysis Division
Outline
• Quick introduction to the JPDO, NGATS, and EAD
• Modeling Overview
• Constraints Analysis
• Portfolio Analysis
10
Evaluation and Analysis Division
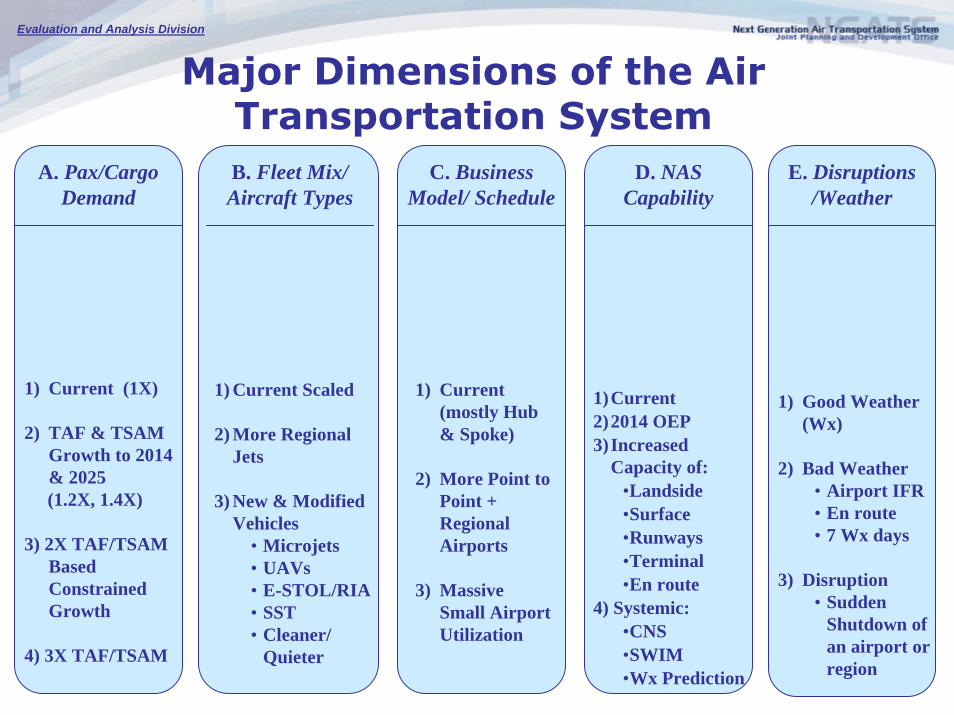
D. NAS Capability
E. Disruptions /Weather
Major Dimensions of the Air Transportation System
1) Good Weather (Wx)
2) Bad Weather• Airport IFR• En route • 7 Wx days
3) Disruption • Sudden
Shutdown of an airport or region
1)Current2)2014 OEP3)Increased
Capacity of:•Landside •Surface•Runways•Terminal•En route
4) Systemic:•CNS•SWIM•Wx Prediction
A. Pax/Cargo Demand
B. Fleet Mix/Aircraft Types
C. Business Model/ Schedule
1) Current (1X)
2) TAF & TSAM Growth to 2014 & 2025 (1.2X, 1.4X)
3) 2X TAF/TSAM Based Constrained Growth
4) 3X TAF/TSAM
1) Current Scaled
2) More Regional Jets
3) New & Modified Vehicles
• Microjets• UAVs• E-STOL/RIA• SST• Cleaner/
Quieter
1) Current (mostly Hub & Spoke)
2) More Point to Point + Regional Airports
3) Massive Small Airport Utilization

11
Evaluation and Analysis Division
EAD Modeling and Simulation Tools• ACES (NASA-Ames/Sensis): Agent-based simulation of individual aircraft flying one day
of NAS activity
• LMINET (LMI): Queuing model for airports and sectors of one day of NAS activity.
• ProbTFM Tool (Sensis): Tool for designing and evaluating probabilistic traffic flow management in heavy weather
• AvDemand (Sensis): Calculates future NAS demand based on FAA forecasts
• AvAnalyst (Sensis): Analysis and visualization tool for NASA ACES simulation outputs
• TSAM (LaRC, VaTech): Transportation Systems Analysis Model – demand generation and NAS-wide modeling and analysis
• NAS-Wide Environmental Impact Model (Metron, NASEIM): Detailed calculator of noise and emissions based on individual flight trajectories from ACES
• GRA Screening Model (GRA): For each passenger service airport, model describing current security lanes and processing rates; may be adapted for additional lanes or changes in processing rates
• FAA NAS Strategy Simulator (Ventana): Multi-year, macro-level simulation of annual system statistics of demand, NAS activity, FAA costs and revenues
• Airport Capacity Constraints Model (Boeing): For 35 OEP airports, computes detailed capacity as a function of runway configuration, operational procedures, and ground infrastructure.

12
Evaluation and Analysis Division
EAD Integrated Modeling and Analysis Process
DemandModeling
(Sensis, LaRC, VaTech)
LMINET(LMI)
IndividualRunwayModeling
(Boeing, LMI)
NGATSAirport
Capacities
Physics-BasedAirport/Airspace
Analysis
Determine“Feasible”
FutureDemand
ACES(Sensis, ARC)
EnvironmentalModeling(Metron)
NAS Strategy Simulator(Ventana)
Security/Economics(GRA)
Probabilistic WxAnd TFM Tool
(Sensis)
Wxmodeling
NAS Economics
Airport/AirspaceQueuingModel

13
Evaluation and Analysis Division
JPDO and Eurocontrol Development Frameworks
• Eurocontrol has defined a framework for ATM development programs called the European Operational Concept Validation Methodology (E-OVCM)
• JPDO EAD modeling and analysis process aligns closely with the E-OVCM framework
• EAD will incorporate and adapt best-practices from the E-OVCM in the evaluation and assessment of the NGATS Concept of Operations
STEP
0State Concept
andAssumptions
1Set Validation
Strategy
2Determine
TheExperimental
needs
3Conduct the Experiment
4Determine the results
5Information for dissemination
Life
cyc
le p
hase
Expe
rimen
tal l
evel
STEP
0State Concept
andAssumptionsAssumptions
1Set Validation
Strategy
2Determine
TheExperimental
needs
3Conduct the Experiment
44Determine the results
5Information for dissemination

14
Evaluation and Analysis Division
EAD
OIImpact
CharacterizationDirect NAS Effects(ACES, LMINET,
Boeing AirportCapacity Constraints
Model)
Multi-yearConsumer, Carrier
Ramifications(NAS Strategy
Simulator, USCAP)
StrategyImpact
(Metrics)
Safety,Environmental
(NIRS, INM, EDMS)Security,
Economic Impacts(GRA AMMS &
NACBA,
OperationalImprovementDevelopment Decisions
Strategy Evaluation
Existing Data (e.g. ETMS Schedules)
Define Future Schedule and
Conditions(TSAM, AvDemand) Validation
IPTs
EAD Modeling and Analysis FrameworkOCVM -
0
OCVM -1
OCVM -2
Strategy Evaluation OCVM -3
OCVM -4
OCVM -5

15
Evaluation and Analysis Division
Outline
• Quick introduction to the JPDO, NGATS, and EAD
• Modeling Overview
• Constraints Analysis
• Portfolio Analysis
16
Evaluation and Analysis Division
High-level Constraints Analysis Overview and Approach
• The purpose of this high-level constraints analysis was to examine and quantify the primary factors limiting NAS performance and growth, including capacity, environment, safety, security, and costs– Identify and quantify the “tall pole in the tent”– This can inform agency research and development plans to
focus on key areas to help achieve the NGATS Goals
• This initial analysis approach was– Focused ONLY on capacity and environment– Performed sequentially – with capacity constraints applied
against unconstrained demand, and the capacity-constrained demand used as an input to the environmental constraints analysis
– Only the capacity results are being briefed here
17
Evaluation and Analysis Division
Capacity Constraints Analysis Objective
• We know that there are many facets of National Airspace System (NAS) capacity– Runways, taxiways, gates, en route sectors
• At a macro level, for this analysis, we have lumped capacity into only two categories: en route and airport
– This is a simplifying assumption made to accommodate NAS-wide modeling
• We wanted to see which of these two categories constrains NAS performance first and to what degree
18
Evaluation and Analysis Division
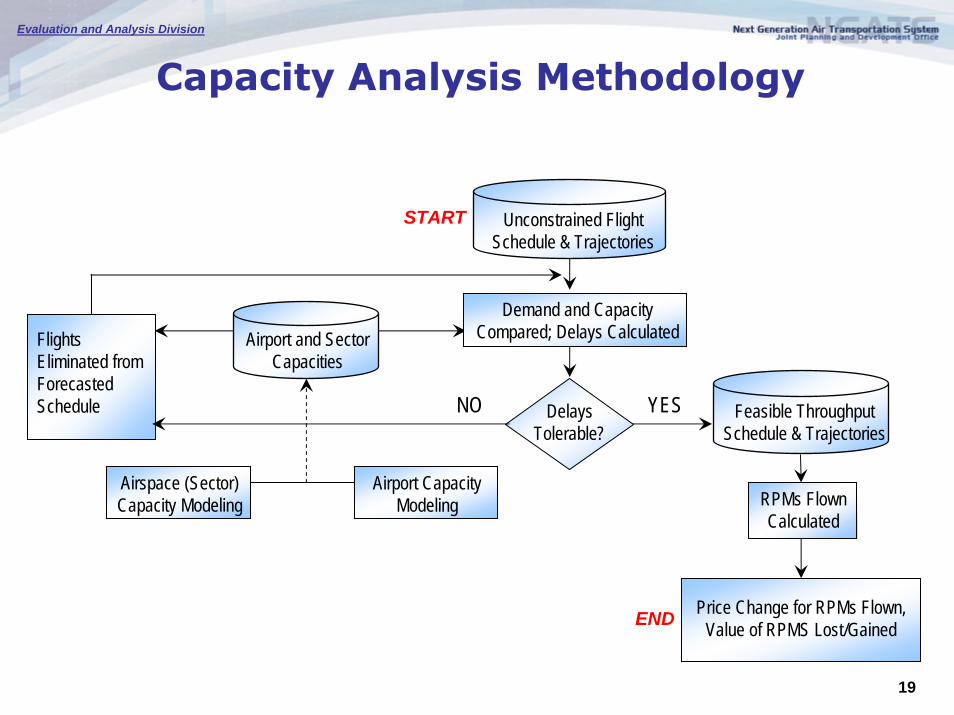
Capacity Analysis Approach:from Unconstrained Demand to Feasible Throughput
• “Unconstrained demand” (e.g., the FAA’s Terminal Area Forecast) represents the public’s desire for air transportation regardless of whether sufficient future NAS capacity will exist
• Without sufficient capacity, future flight schedules would incurunrealistically large delays if all demanded flights actually flew
• Our premise is that capacity constraints would force some of thedemand to be left unsatisfied, thus we analytically remove flights from the future flight schedule after a specified airport delay tolerance or sector capacity is reached
• We call this consolidated capacity metric “feasible throughput” which estimates the number of flights that would be scheduled and flown for a given level of airport delay and sector capacity
19
Evaluation and Analysis Division
Capacity Analysis Methodology
Demand and Capacity Compared; Delays Calculated
Unconstrained Flight Schedule & Trajectories
Delays Tolerable?
Flights Eliminated from Forecasted Schedule NO YES
Airport and Sector Capacities
RPMs FlownCalculated
Feasible Throughput Schedule & Trajectories
Airspace (Sector) Capacity Modeling
Airport Capacity Modeling
Price Change for RPMs Flown,Value of RPMS Lost/Gained
START
END
20
Evaluation and Analysis Division
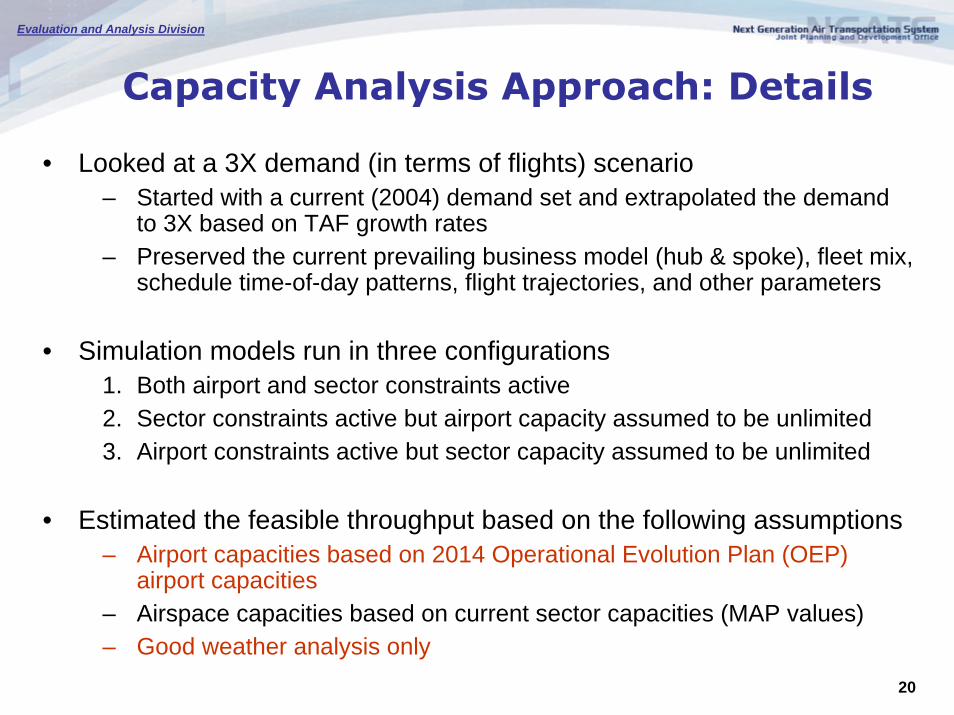
Capacity Analysis Approach: Details
• Looked at a 3X demand (in terms of flights) scenario– Started with a current (2004) demand set and extrapolated the demand
to 3X based on TAF growth rates– Preserved the current prevailing business model (hub & spoke), fleet mix,
schedule time-of-day patterns, flight trajectories, and other parameters
• Simulation models run in three configurations1. Both airport and sector constraints active2. Sector constraints active but airport capacity assumed to be unlimited3. Airport constraints active but sector capacity assumed to be unlimited
• Estimated the feasible throughput based on the following assumptions– Airport capacities based on 2014 Operational Evolution Plan (OEP)
airport capacities– Airspace capacities based on current sector capacities (MAP values)– Good weather analysis only
21
Evaluation and Analysis Division
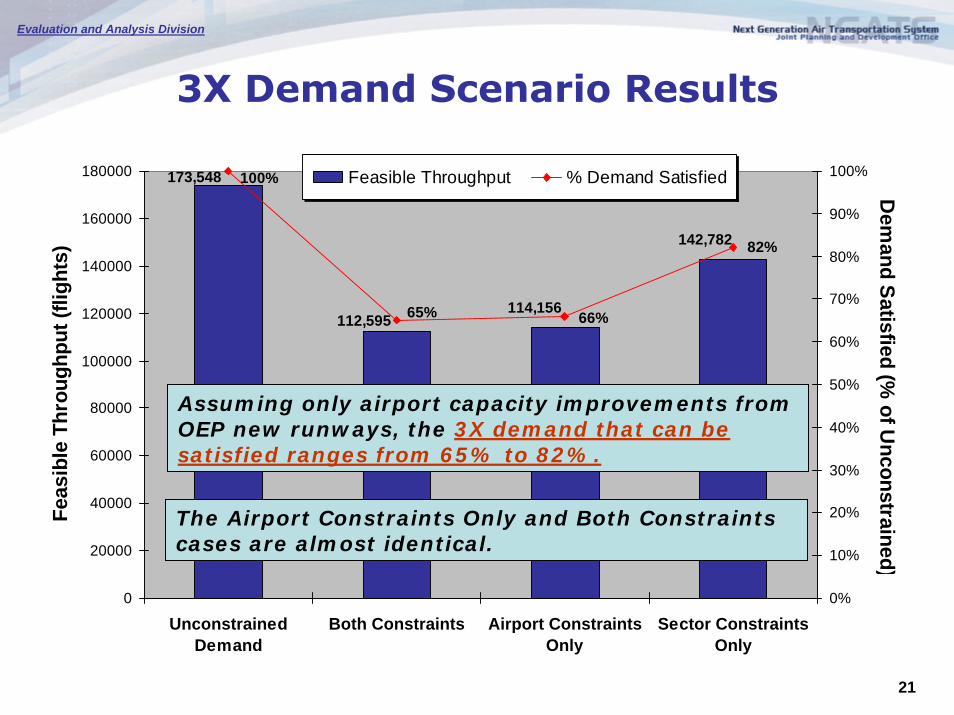
3X Demand Scenario Results
142,782
114,156112,595
173,548 100%
65% 66%
82%
0
20000
40000
60000
80000
100000
120000
140000
160000
180000
UnconstrainedDemand
Both Constraints Airport ConstraintsOnly
Sector ConstraintsOnly
Feas
ible
Thr
ough
put (
fligh
ts)
0%
10%
20%
30%
40%
50%
60%
70%
80%
90%
100%
Dem
and Satisfied (% of U
nconstrained)
Feasible Throughput % Demand Satisfied
Assuming only airport capacity improvements from OEP new runways, the 3X demand that can be satisfied ranges from 65% to 82%.
The Airport Constraints Only and Both Constraints cases are almost identical.
22
Evaluation and Analysis Division
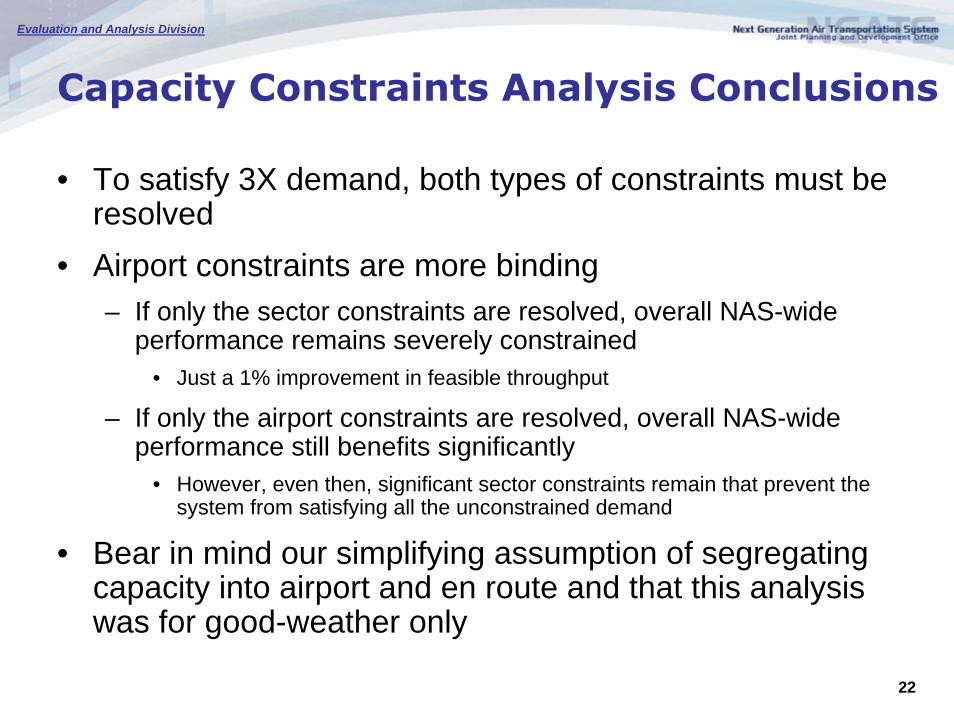
Capacity Constraints Analysis Conclusions
• To satisfy 3X demand, both types of constraints must be resolved
• Airport constraints are more binding– If only the sector constraints are resolved, overall NAS-wide
performance remains severely constrained• Just a 1% improvement in feasible throughput
– If only the airport constraints are resolved, overall NAS-wide performance still benefits significantly
• However, even then, significant sector constraints remain that prevent the system from satisfying all the unconstrained demand
• Bear in mind our simplifying assumption of segregating capacity into airport and en route and that this analysis was for good-weather only
23
Evaluation and Analysis Division
Outline
• Quick introduction to the JPDO, NGATS, and EAD
• Modeling Overview
• Constraints Analysis
• Portfolio Analysis

24
Evaluation and Analysis Division
EAD Portfolio Analysis Objectives
WhatQuantify and communicate how well the NGATS
investment portfolio meets NGATS goals
How• Express investment outcomes as operational
changes• Using simulations and expert input, estimate net
system performance due to those changes

25
Evaluation and Analysis Division
Review of Portfolio Capabilities
• Network Enabled Information• Broad Area Precision Navigation• Performance-Based Services• Trajectory-Based Operations• Weather• Layered, Adaptive Security• Equivalent Visual Operations• Super-Density Operations
To date we havesimulated parts of thesecapabilities

FY06 FY08 FY10 FY12 FY14 FY16 FY18 FY20 FY22 FY 24
DEVELOP
DEVELOP
DEVELOP
DEVELOP
DEVELOP
DEVELOP
DEVELOP
IMPLEMENT
IMPLEMENT
IMPLEMENT
IMPLEMENT
IMPLEMENT
IMPLEMENT
IMPLEMENT
Foundational Research, Applications Research, andSystems Engineering / Demonstrations
Segment 1
Segment 2
Segment 3
Segment 4
Segment 5
Segment 6
Segment 7
Enhanced System Operations to Meet NGATS Goals(Operations $)
NGATS Portfolio Roadmap

27
Evaluation and Analysis Division
Portfolio Analysis Overview
• We have estimated feasible throughput for the baseline scenario and NGATS Segments 3 and 7
• Feasible throughput is an estimate of how many flights could be scheduled and flown considering system capacity constraints
• For the baseline, airport capacities are based on 2004 Benchmarks (OEP) and other FAA data; en route capacities are represented bycurrent sector MAP values
• Segments 3 and 7 airport capacities are estimated by Boeing modeling of the NGATS Operational Improvements
• For en route capacity, we assume Segment 3 MAP values increase by 15% and Segment 7 MAP values increase by 30%
– In prior studies, CPDLC alone has shown 30% increase in sector capacity
• We model RNAV/RNP as reducing flight counts against MAP value– by 10% at 35 OEP airports in Segment 3– by 50% at top 100 airports in Segment 7

28
Evaluation and Analysis Division
Portfolio Analysis Results
Scenario Feasible Throughput
(flights)
% of 3X Goal Achieved
85,513 64.7 %
69.7 %
77.7 %
92,116
102,583
Flights Eliminated
(flights)
% of 3X Goal Shortfall
3X Demand, Baseline 46,595 35.3 %
3X Demand, Segment 3 39,992 30.3 %
22.3 %3X Demand, Segment 7 29,525
• Each scenario starts with 132,108 commercial flights (unconstrained 3X demand); there are 40,803 additional GA flights
• Each scenario assumes universally good weather (this is standard for estimating feasible throughput because airlines plan their schedules for good weather)
Note: Statistics presented here exclude GA flights

29
Evaluation and Analysis Division
Results Expressed asSuccess in Achieving 3X Goal
0%
10%
20%
30%
40%
50%
60%
70%
80%
90%
100%
3X Baseline 3X Segment 3 3X Segment 7
Flig
hts
Acc
omm
odat
ed
• Complete achievement of 3X goal = all flights accommodated (100%)• Percentage of flights accommodated, as expected, increases as
NGATS is developed