Embed Size (px)
Citation preview

Highlights This Month:
• April 2018 represents the start of Summer 2018. All calculations are based off the summer capabilities..
SYSTEM UTILIZATION MONTHLY REPORTfor the month ending
http://www.tccustomerexpress.com/2885.html
NOVA Gas Transmission Ltd.
Published date:June 15th, 2018
April 2018

2
TABLE OF CONTENTS
Utilization reports are posted approximately six weeks after the end of the reported month.
If you have any questions on the content of this report, contact Winston Cao at (403) 920-5315 or [email protected].
MONTHLY FEATURES PAGE Firm Transportation Service Contract Utilization ..................................................................... . 3 Design Capability Utilization Upper Peace River ...................................................................................................................... .. 4 Upper & Central Peace River ..................................................................................................... . 5 Peace River Design ..................................................................................................................... . 6 Upstream James River ................................................................................................................ . 7 Eastern Alberta Mainline (James River to Princess) .................................................................. . 8 Western Alberta Mainline (AB/BC & AB/Montana Borders) ................................................... . 9 Rimbey Nevis – Flow Within ................................................................................................... .10 South & Alderson – Flow Within ............................................................................................... .11 Medicine Hat - Flow Within ....................................................................................................... .12 Eastern Alberta Mainline (Princess to Empress/McNeill) .......................................................... .13 Ft. McMurray Area – Flow Within…………………………………………………………… ...14 Kirby Area – Flow Within……………………………………………………………………….15 North of Bens Lake – Flow Within ............................................................................................. ..16 North & South of Bens Lake – Flow Within…………………………………………………….17 Future Firm Transportation Service Availability ....................................................................... .18 How to Use This Report ................................................................................................................ .19 REFERENCES NGTL Design Areas Map ............................................................................................................. 20 NGTL Pipeline Segments Map ..................................................................................................... 21 Definition of Terms ........................................................................................................................ 22

FIRM TRANSPORTATION SERVICE1 CONTRACT UTILIZATION3
By NGTL Pipeline Segments
Apr CD Apr CDSegment Contract Utilization (TJ/d) Utilization (MMcf/d) UPRM FT 0% 0.0 80% 79
FT + IT2 0% 81%
PRLL FT 48% 30.4 83% 245FT + IT 54% 87%
NWML FT 100% 6.9 82% 359FT + IT 114% 82%
GRDL FT 0% 5.0 91% 2,930FT + IT 536% 91%
WAEX FT 61% 7.0 70% 892FT + IT 318% 70%
JUDY FT 56% 16.8 81% 45FT + IT 60% 83%
GPML FT 54% 158.4 78% 4,895FT + IT 130% 79%
CENT FT 0% 0.0 75% 2,268FT + IT 0% 76%
LPOL FT 64% 96.2 76% 1,011FT + IT 68% 80%
WGAT FT 79% 3,930.0 96% 240FT + IT 81% 108%
ALEG FT 54% 386.9 97% 617FT + IT 56% 114%
SLAT FT 30% 179.3 98% 132FT + IT 30% 146%
MLAT FT 71% 262.3 89% 90FT + IT 71% 135%
BLEG FT 48% 155.5 99% 380FT + IT 53% 128%
EGAT FT 99% 4,793.0 79% 15FT + IT 102% 125%
MRTN FT 32% 20.2 69% 41FT + IT 34% 93%
LIEG FT 70% 2,091.3 57% 32FT + IT 70% 85%
KIRB FT 82% 1,630.7 75% 31FT + IT 82% 97%
SMHI FT 44% 12.0 54% 19FT + IT 44% 90%
REDL FT 26% 19.0 33% 22FT + IT 30% 96%
COLD FT 54% 180.0 33% 16FT + IT 61% 93%
EDM FT 46% 1,846.0 81% 32FT + IT 46% 127%
NLAT FT 72% 30.6 93% 107FT + IT 72% 114%
WAIN FT 24% 0.4 92% 4FT + IT 24% 146%
ELAT FT 83% 288.4 87% 95FT + IT 85% 129%
TOTAL SYSTEM FT 78% 16,146.4 82% 14,598FT + IT 81% 86%
*NOTE:
billed volumes divided by applicable receipt or delivery Contract level.
Delivery Receipt
April 2018
1. FT includes all receipt and delivery Firm Transportation Services.2. IT includes receipt and delivery Interruptible Services.3. Utilization data is based on billed monthly volumes. Percent utilization calculated as FT and FT + IT

0
200
400
600
800
1000
0
5,000
10,000
15,000
20,000
25,000
30,000
Nov-16
Dec-16
Jan-17
Feb-17
Mar-17
Apr-17
May-17
Jun-17
Jul-17
Aug-17
Sep-17
Oct-17
Nov-17
Dec-17
Jan-18
Feb-18
Mar-18
Apr-18
May-18
Jun-18
Jul-18
Aug-18
Sep-18
Oct-18
Nov-18
103m3/dThroughput vs. Design Capability
Upper Peace River
Historical Flow Gas Year Markers Capability
mmcf/d
35% 34%37%
Ave LF:
33%
4
DESIGN CAPABILITY UTILIZATIONUPPER PEACE RIVER
Nov Dec Jan Feb Mar Apr37% 34% 32% 32% 35% 33%
% Design Capability UtilizationAverage
Flow/
5
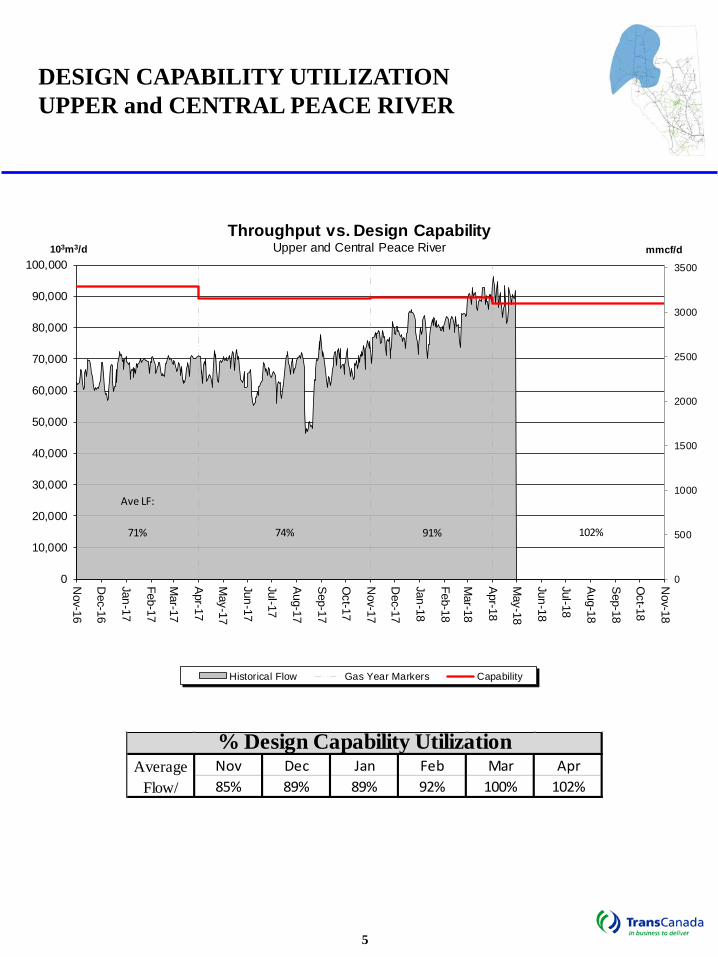
DESIGN CAPABILITY UTILIZATIONUPPER and CENTRAL PEACE RIVER
Nov Dec Jan Feb Mar Apr85% 89% 89% 92% 100% 102%
% Design Capability UtilizationAverage
Flow/
0
500
1000
1500
2000
2500
3000
3500
0
10,000
20,000
30,000
40,000
50,000
60,000
70,000
80,000
90,000
100,000
Nov-16
Dec-16
Jan-17
Feb-17
Mar-17
Apr-17
May-17
Jun-17
Jul-17
Aug-17
Sep-17
Oct-17
Nov-17
Dec-17
Jan-18
Feb-18
Mar-18
Apr-18
May-18
Jun-18
Jul-18
Aug-18
Sep-18
Oct-18
Nov-18
103m3/dThroughput vs. Design Capability
Upper and Central Peace River
Historical Flow Gas Year Markers Capability
mmcf/d
74% 91%71%
Ave LF:
102%

6
DESIGN CAPABILITY UTILIZATIONPEACE RIVER DESIGN(Upper, Central and Lower Peace River)
0
1000
2000
3000
4000
5000
6000
7000
8000
0
50,000
100,000
150,000
200,000
250,000
Nov-16
Dec-16
Jan-17
Feb-17
Mar-17
Apr-17
May-17
Jun-17
Jul-17
Aug-17
Sep-17
Oct-17
Nov-17
Dec-17
Jan-18
Feb-18
Mar-18
Apr-18
May-18
Jun-18
Jul-18
Aug-18
Sep-18
Oct-18
Nov-18
103m3/dThroughput vs. Design Capability
Peace River Design
Historical Flow Gas Year Markers Capability
mmcf/d
85% 90%89%
Ave LF:
93%
Nov Dec Jan Feb Mar Apr87% 90% 90% 91% 94% 93%
Average Flow/
% Design Capability Utilization

7
DESIGN CAPABILITY UTILIZATIONUPSTREAM JAMES RIVER(Edson Mainline, Peace River Design and Marten Hills)
Nov Dec Jan Feb Mar Apr95% 98% 99% 100% 100% 100%
% Design Capability UtilizationAverage
Flow/
0
2000
4000
6000
8000
10000
0
50,000
100,000
150,000
200,000
250,000
300,000
Nov-16
Dec-16
Jan-17
Feb-17
Mar-17
Apr-17
May-17
Jun-17
Jul-17
Aug-17
Sep-17
Oct-17
Nov-17
Dec-17
Jan-18
Feb-18
Mar-18
Apr-18
May-18
Jun-18
Jul-18
Aug-18
Sep-18
Oct-18
Nov-18
103m3/dThroughput vs. Design Capability
Upstream James River
Historical Flow Gas Year Markers Capability
mmcf/d
96% 98%95%
Ave LF:
100%

8
DESIGN CAPABILITY UTILIZATIONEASTERN ALBERTA MAINLINE(James River to Princess)
0
1000
2000
3000
4000
5000
6000
7000
8000
0
50,000
100,000
150,000
200,000
250,000
Nov-16
Dec-16
Jan-17
Feb-17
Mar-17
Apr-17
May-17
Jun-17
Jul-17
Aug-17
Sep-17
Oct-17
Nov-17
Dec-17
Jan-18
Feb-18
Mar-18
Apr-18
May-18
Jun-18
Jul-18
Aug-18
Sep-18
Oct-18
Nov-18
103m3/dThroughput vs. Design Capability
Eastern Alberta Mainline - James River to Princess
Historical Flow Gas Year Markers Capability
mmcf/d
107% 113%112%
Ave LF:
125%
Nov Dec Jan Feb Mar Apr108% 111% 113% 115% 116% 125%
% Design Capability UtilizationAverage
Flow/

9
DESIGN CAPABILITY UTILIZATION WESTERN ALBERTA MAINLINE(Alberta/B.C. and Alberta/Montana Borders)
0
500
1000
1500
2000
2500
0
10,000
20,000
30,000
40,000
50,000
60,000
70,000
80,000
Nov-16
Dec-16
Jan-17
Feb-17
Mar-17
Apr-17
May-17
Jun-17
Jul-17
Aug-17
Sep-17
Oct-17
Nov-17
Dec-17
Jan-18
Feb-18
Mar-18
Apr-18
May-18
Jun-18
Jul-18
Aug-18
Sep-18
Oct-18
Nov-18
103m3/dThroughput vs. Design Capability
Western Gate - Alberta / BC & Alberta / Montana Borders
Historical Flow Gas Year Markers Capability
mmcf/d
97% 104%95%
Ave LF:
95%
Nov Dec Jan Feb Mar Apr100% 105% 107% 103% 107% 95%
% Design Capability UtilizationAverage
Flow/

10
DESIGN CAPABILITY UTILIZATIONRIMBEY-NEVIS – FLOW WITHIN
Nov Dec Jan Feb Mar Apr29% 31% 37% 34% 33% 37%
% Design Capability UtilizationAverage
Flow/
0
200
400
600
800
1000
0
5,000
10,000
15,000
20,000
25,000
30,000
Nov-16
Dec-16
Jan-17
Feb-17
Mar-17
Apr-17
May-17
Jun-17
Jul-17
Aug-17
Sep-17
Oct-17
Nov-17
Dec-17
Jan-18
Feb-18
Mar-18
Apr-18
May-18
Jun-18
Jul-18
Aug-18
Sep-18
Oct-18
Nov-18
103m3/dTotal Deliveries vs. Design Capability
Rimbey Nevis - Delivery Capability
Historical Flow Gas Year Markers Capability
mmcf/d
22% 33%19%
Ave LF:
37%

11
DESIGN CAPABILITY UTILIZATIONSOUTH and ALDERSON – FLOW WITHIN
0
50
100
150
200
0
1,000
2,000
3,000
4,000
5,000
6,000
Nov-16
Dec-16
Jan-17
Feb-17
Mar-17
Apr-17
May-17
Jun-17
Jul-17
Aug-17
Sep-17
Oct-17
Nov-17
Dec-17
Jan-18
Feb-18
Mar-18
Apr-18
May-18
Jun-18
Jul-18
Aug-18
Sep-18
Oct-18
Nov-18
103m3/dTotal Deliveries vs. Design Capability
South and Alderson - Delivery Capability
Historical Flow Gas Year Markers Capability
mmcf/d
41% 42%47%
Ave LF:
31%
Nov Dec Jan Feb Mar Apr38% 43% 44% 49% 36% 31%
% Design Capability UtilizationAverage
Flow/

12
DESIGN CAPABILITY UTILIZATIONMEDICINE HAT – FLOW WITHIN
0
50
100
150
200
250
300
350
0
1,000
2,000
3,000
4,000
5,000
6,000
7,000
8,000
9,000
10,000
Nov-16
Dec-16
Jan-17
Feb-17
Mar-17
Apr-17
May-17
Jun-17
Jul-17
Aug-17
Sep-17
Oct-17
Nov-17
Dec-17
Jan-18
Feb-18
Mar-18
Apr-18
May-18
Jun-18
Jul-18
Aug-18
Sep-18
Oct-18
Nov-18
103m3/dTotal Deliveries vs. Design Capability
Medicine Hat - Delivery Capability
Historical Flow Gas Year Markers Capability
mmcf/d
68% 69%84%
Ave LF:
60%
Nov Dec Jan Feb Mar Apr64% 67% 73% 75% 68% 60%
% Design Capability UtilizationAverage
Flow/

13
DESIGN CAPABILITY UTILIZATION EASTERN ALBERTA MAINLINE(Princess to Empress / McNeill)
Nov Dec Jan Feb Mar Apr91% 91% 96% 97% 93% 114%
% Design Capability UtilizationAverage
Flow/
0
1000
2000
3000
4000
5000
0
20,000
40,000
60,000
80,000
100,000
120,000
140,000
160,000
Nov-16
Dec-16
Jan-17
Feb-17
Mar-17
Apr-17
May-17
Jun-17
Jul-17
Aug-17
Sep-17
Oct-17
Nov-17
Dec-17
Jan-18
Feb-18
Mar-18
Apr-18
May-18
Jun-18
Jul-18
Aug-18
Sep-18
Oct-18
Nov-18
103m3/dThroughput vs. Design Capability
Eastern Gate - Empress & McNeill Borders
Historical Flow Gas Year Markers Capability
mmcf/d
94% 94%85%
Ave LF:
114%

DESIGN CAPABILITY UTILIZATIONFT. McMURRAY AREA – FLOW WITHIN
14
0
200
400
600
800
1000
1200
1400
1600
0
5,000
10,000
15,000
20,000
25,000
30,000
35,000
40,000
45,000
50,000
Nov-16
Dec-16
Jan-17
Feb-17
Mar-17
Apr-17
May-17
Jun-17
Jul-17
Aug-17
Sep-17
Oct-17
Nov-17
Dec-17
Jan-18
Feb-18
Mar-18
Apr-18
May-18
Jun-18
Jul-18
Aug-18
Sep-18
Oct-18
Nov-18
103m3/dTotal Deliveries vs. Design Capability
Ft. McMurray Area - Delivery Capability
Historical Flow Gas Year Markers Capability
mmcf/d
65% 87%82%
Ave LF:
79%
Nov Dec Jan Feb Mar Apr82% 88% 88% 89% 86% 79%
% Design Capability UtilizationAverage
Flow/

DESIGN CAPABILITY UTILIZATIONKIRBY AREA – FLOW WITHIN
15
Nov Dec Jan Feb Mar Apr89% 89% 87% 91% 91% 88%
% Design Capability UtilizationAverage
Flow/
0
200
400
600
800
1000
1200
1400
1600
0
5,000
10,000
15,000
20,000
25,000
30,000
35,000
40,000
45,000
50,000
Nov-16
Dec-16
Jan-17
Feb-17
Mar-17
Apr-17
May-17
Jun-17
Jul-17
Aug-17
Sep-17
Oct-17
Nov-17
Dec-17
Jan-18
Feb-18
Mar-18
Apr-18
May-18
Jun-18
Jul-18
Aug-18
Sep-18
Oct-18
Nov-18
103m3/dTotal Deliveries vs. Design Capability
Kirby Area - Delivery Capability
Historical Flow Gas Year Markers Capability
mmcf/d
83% 89%92%
Ave LF:
88%

DESIGN CAPABILITY UTILIZATIONNORTH OF BENS LAKE – FLOW WITHIN
16
0
500
1000
1500
2000
2500
3000
3500
4000
4500
0
20,000
40,000
60,000
80,000
100,000
120,000
140,000
Nov-16
Dec-16
Jan-17
Feb-17
Mar-17
Apr-17
May-17
Jun-17
Jul-17
Aug-17
Sep-17
Oct-17
Nov-17
Dec-17
Jan-18
Feb-18
Mar-18
Apr-18
May-18
Jun-18
Jul-18
Aug-18
Sep-18
Oct-18
Nov-18
103m3/dTotal Deliveries vs. Design Capability
North of Bens Lake - Delivery Capability
Historical Flow Gas Year Markers Capability
mmcf/d
70% 82%77%
Ave LF:
81%
Nov Dec Jan Feb Mar Apr79% 81% 83% 85% 80% 81%
Average Flow/
% Design Capability Utilization

DESIGN CAPABILITY UTILIZATIONNORTH & SOUTH OF BENS LAKE – FLOW WITHIN
17
Nov Dec Jan Feb Mar Apr80% 82% 84% 86% 81% 82%
% Design Capability UtilizationAverage
Flow/
0
1000
2000
3000
4000
5000
0
20,000
40,000
60,000
80,000
100,000
120,000
140,000
160,000
Nov-16
Dec-16
Jan-17
Feb-17
Mar-17
Apr-17
May-17
Jun-17
Jul-17
Aug-17
Sep-17
Oct-17
Nov-17
Dec-17
Jan-18
Feb-18
Mar-18
Apr-18
May-18
Jun-18
Jul-18
Aug-18
Sep-18
Oct-18
Nov-18
103m3/dTotal Deliveries vs. Design Capability
North and East - Delivery Capability
Historical Flow Gas Year Markers Capability
mmcf/d
70% 83%77%
Ave LF:
82%

FUTURE FIRM TRANSPORTATION SERVICE AVAILABILITY
Estimated Firm Transportation Service Availability
Please refer to the following web site for
current FT-R / FT-D Availability Maps:
http://www.tccustomerexpress.com/2801.html
Please consult with your CustomerAccount Manager to discuss your FirmTransportation Service needs.
18

HOW TO USE THIS REPORT
Overview
This report contains recent historical information on the level of utilization of firm transportation ServiceAgreements on the NGTL system, relative usage of interruptible service, level of utilization of designpipeline capacity.
Data is reported either by Pipeline Segment (26 segments make up the system, without 23 & 27) or DesignArea (13 Design Areas for the system). Maps of both are included in the reference section.
Firm Transportation Service Contract Utilization
The Firm Transportation Service Contract Utilization report shows the percent utilization for each of the 26NGTL pipeline segments and 3 major export delivery points comprising the total system. The utilizationdata is based on billed monthly volumes. Percent utilization is calculated as firm transportation service andfirm transportation service + interruptible service divided by applicable receipt or delivery contract level.Historical Data involving billed volumes lags the current date by approximately two months.
Design Capability Utilization
The load factor/segment flow graphs show actual flow versus design capability values for various NGTLsystem areas. The graphs also show seasonal (winter/summer) design capability and average load factors(LF) for each season. Load factors are obtained by comparing the receipt, delivery, or throughput flowcondition in each of the Alberta design areas against the corresponding design capability. Consequently,design capability utilization is measured as Average Actual Flow / Seasonal Design Capability. Data usedin these reports lags the current date by at least one month.
Design Flow Capability utilization is a function of several factors that include:
Total market demand for Alberta natural gas. Seasonal changes in market demand for Alberta natural gas. Receipt nominating practices of customers individually and in aggregate to meet that level of demand. Scheduled maintenance which could effect actual flow requirement in a design area at any given time. Design assumptions used in determining required segment flow requirement.
Future Firm Transportation Service Availability
The Future Firm Transportation Service Availability report presents guidelines and timing for all futurefirm transportation service requests.
19

Calgary
Edmonton
Calgary
Edmonton
NGTL Design Areas
Upper Peace River
Central Peace River
Lower Peace River
Marten Hills
Edson Mainline
Rimbey-Nevis
Eastern Alberta Mainline (James River to Princess)
Western Alberta Mainline
North of Bens Lake
South of Bens Lake
Medicine Hat
South and Alderson
(Last updated Nov 2011)
Calgary
Edmonton
Calgary
Edmonton
NGTL Design Areas
Upper Peace River
Central Peace River
Lower Peace River
Marten Hills
Edson Mainline
Rimbey-Nevis
Eastern Alberta Mainline (James River to Princess)
Western Alberta Mainline
North of Bens Lake
South of Bens Lake
Medicine Hat
South and Alderson
(Last updated Nov 2011)
Eastern Alberta Mainline (PrincessTo Empress/McNeill)
20

21
Last Update May, 2018

Design Capability Utilization Actual Flow The amount of gas flowing within or out of the design area. Design Capability The volume of gas that can be transported from the design area on the pipeline system considering given design assumptions.
AVGLF (Average Load Factor) The ratio between average Actual Flow and Design Capability. It is calculated for every design season (summer/winter) as shown on the graphs.
Intra NGTL System Deliveries The amount of sales gas flowing off the system within an area. Receipt Flow Aggregate of actual receipts within an area and the Actual Flow of the upstream area.
Other System Load Factor The volume weighted average of the Average Load Factor (AVGLF) of all design areas on the system
DEFINITION OF TERMS
22