Embed Size (px)
Citation preview
Halls, D., Nix, AR., & Beach, MA. (2011). System level evaluation ofUL and DL interference in OFDMA mobile broadband networks.http://hdl.handle.net/1983/1738
Peer reviewed version
Link to publication record in Explore Bristol ResearchPDF-document
University of Bristol - Explore Bristol ResearchGeneral rights
This document is made available in accordance with publisher policies. Please cite only thepublished version using the reference above. Full terms of use are available:http://www.bristol.ac.uk/red/research-policy/pure/user-guides/ebr-terms/
System Level Evaluation of UL and DL Interference in OFDMA Mobile
Broadband NetworksWCNC 2011
David Halls29th March 2011
Outline
• Mobile Broadband Wireless Networks• Motivation• Link-level simulator• Link-level abstraction• System-level simulator• Interference characterization results• Summary
2Department of Electrical &
Electronic Engineering
Mobile Broadband Wireless Networks
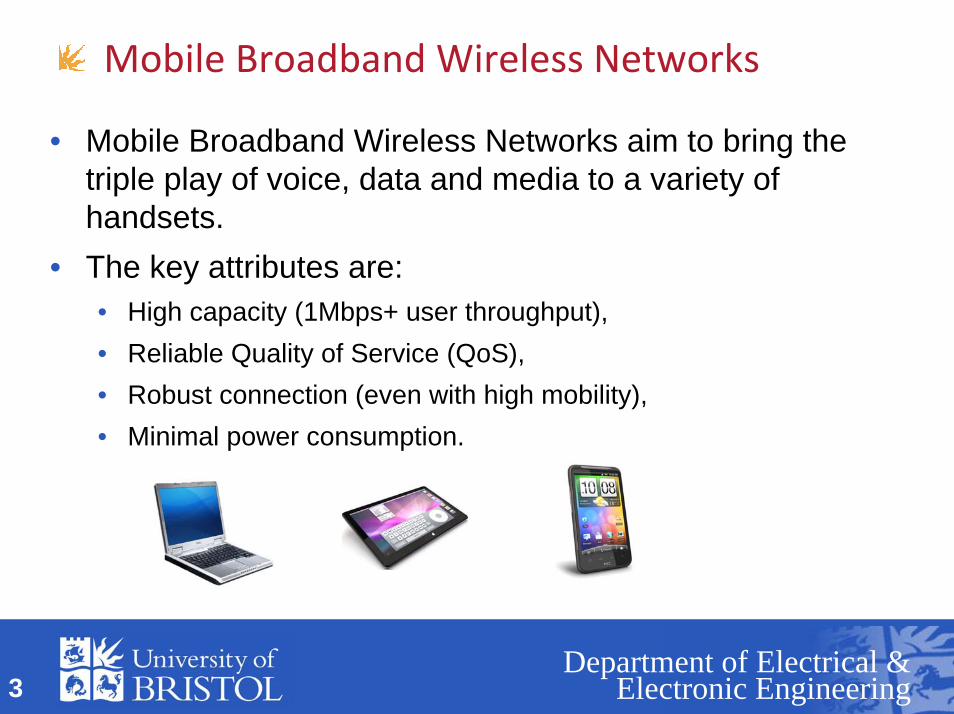
• Mobile Broadband Wireless Networks aim to bring the triple play of voice, data and media to a variety of handsets.
• The key attributes are:• High capacity (1Mbps+ user throughput),• Reliable Quality of Service (QoS),• Robust connection (even with high mobility),• Minimal power consumption.
3Department of Electrical &
Electronic Engineering
Motivation• Unless deployed correctly, Mobile Broadband Networks will
collapse due to inter-cell interference.• Inter-cell interference is particularly acute at cell
boundaries and results in reduced throughput.• Critical, pre-deployment, to accurately a) characterize and
b) manage interference.• Interference fluctuation from frame-to-frame is
unpredictable particularly on the UL, as we do not know which user is transmitting at any one time, and if not combated this will reduce system capacity.
4Department of Electrical &
Electronic Engineering
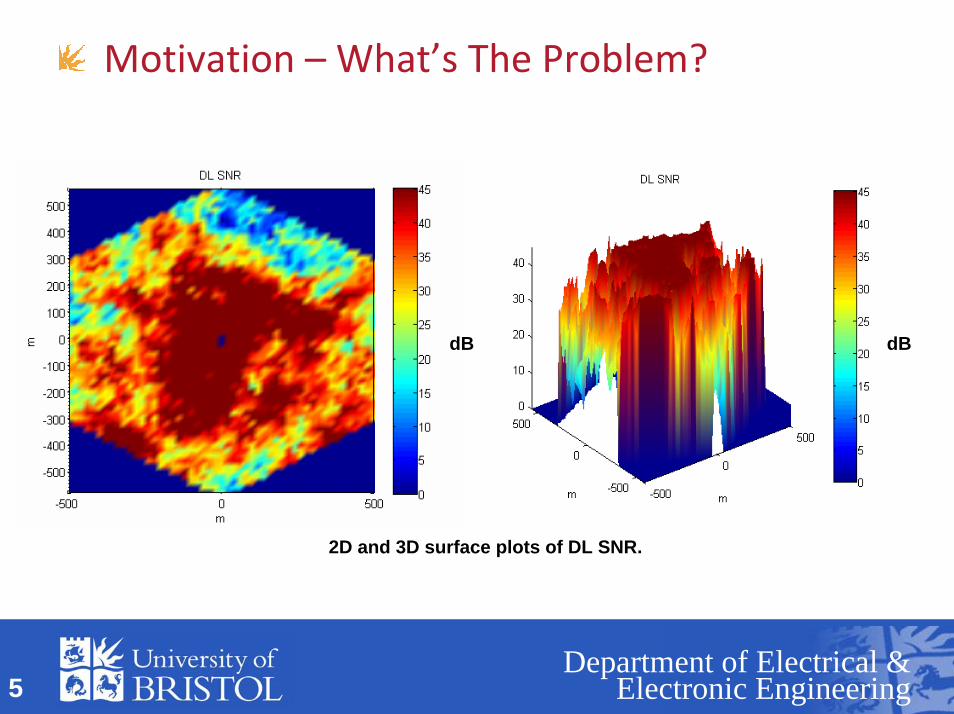
Motivation – What’s The Problem?
dBdB
2D and 3D surface plots of DL SNR.
5Department of Electrical &
Electronic Engineering
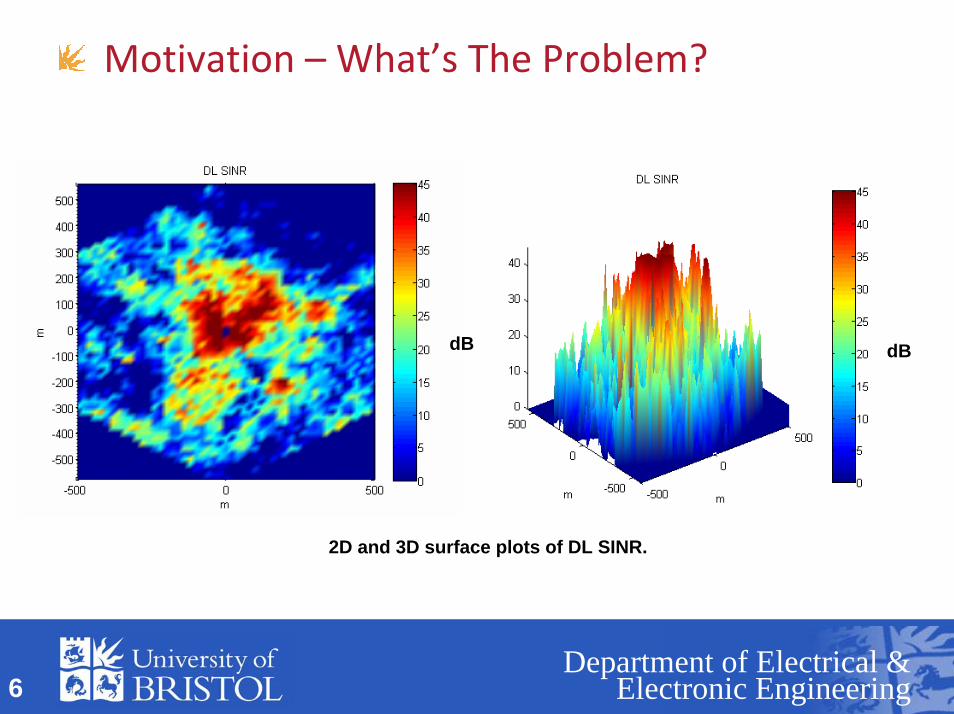
Motivation – What’s The Problem?
dB dB
2D and 3D surface plots of DL SINR.
6Department of Electrical &
Electronic Engineering
Why Not Characterize with Drive Testing?• Drive testing has been used for validation and is important but only
limited data can be logged.• It is impossible to fully load and test a real-world network with multiple
users, with different devices, applications and QoS requirements etc.• We need to be able to test in a repeatable and controlled manner and
collect comprehensive data for a multi-cell, multi-user environment.• As a result we need a combination of real-world data AND rigorous
simulation. Due to the sheer complexity of such simulation theseissues are not well addressed in the literature.
• Drive-testing produces reams and reams of data, accurate simulation allows us to ‘drill-down’ into these results and provide a unique insight into real-world performance issues.
7Department of Electrical &
Electronic Engineering

Solution – System‐level Simulation• Our system level simulator is based on WiMAX .16m but easily
extensible to LTE, it enables a virtual deployment of a broadband network with standards compliant functionality, offers:
• Extremely accurate modelling of MIMO MBWN under interference.• Implements temporal and spatial models for all users and all inter-cell
interferers as well as realistic mobility with time evolution and correlated shadowing.
• Models standards compliant PHY and MAC, not achieved by other simulators, with full DL and UL frame and AMC/AMS.
• Precisely models a channel dependent scheduler (Motorola’s WiMAXProportional Fair scheduler with enhancements).
• Models interference randomization through PUSC, interference coordination through FFR; and capacity improving and interference reduction techniques through MIMO and beamforming (up to 8x2).
• Models 1 tier of interfering BS with dynamic loading and scheduling of interferers all with bit-level accuracy.
8Department of Electrical &
Electronic Engineering

Link‐level Simulator
Parameter Value EIRP (dBm) 46.5 Centre Frequency (MHz) 3525 Channel bandwidth (MHz) 5 UL/DL Ratio 3:1 Sampling frequency Fs (MHz) 5.6 Sampling period 1/ Fs (µs) 0.18 Subcarrier frequency spacing /f F Ns FFT∆ = (kHz) 10.94
Useful symbol period 1 /T fb = ∆ ( sµ ) 91.4
Guard Time / 8T Tg b= ( sµ ) 11.4
OFDMA symbol duration T T Ts gb= + ( sµ ) 102.9 DL PUSC UL PUSC
Number of used subcarriers (Nused) 421 409
Number of pilot subcarriers 60 136
Number of data subcarriers 360 272
Number of data subcarriers/subchannel 24 16
Number of subchannels 15 17
Number of users (Nusers) 3 3
Number of subchannels/user 5 4
Simulation Parameters.Mobile WiMAX functional stages.
[1] M. Tran, D. Halls, A. Nix, A. Doufexi, and M. Beach, "Mobile WiMAX: MIMO Performance Analysis from a Quality of Service (QoS) Viewpoint," IEEE WCNC, pp. 1-6, April 2009.
9Department of Electrical &
Electronic Engineering

Link‐level Validation – Motorola, Swindon
10Department of Electrical &
Electronic Engineering10
Link‐level Validation
200 400 600 800 1000 1200 14000
1
2
3
4
5
6
Distance (m)
Thro
ughp
ut (M
bps)
QPSK 1/2QPSK 3/416QAM 1/216QAM 3/464QAM 1/264QAM 2/364QAM 3/4
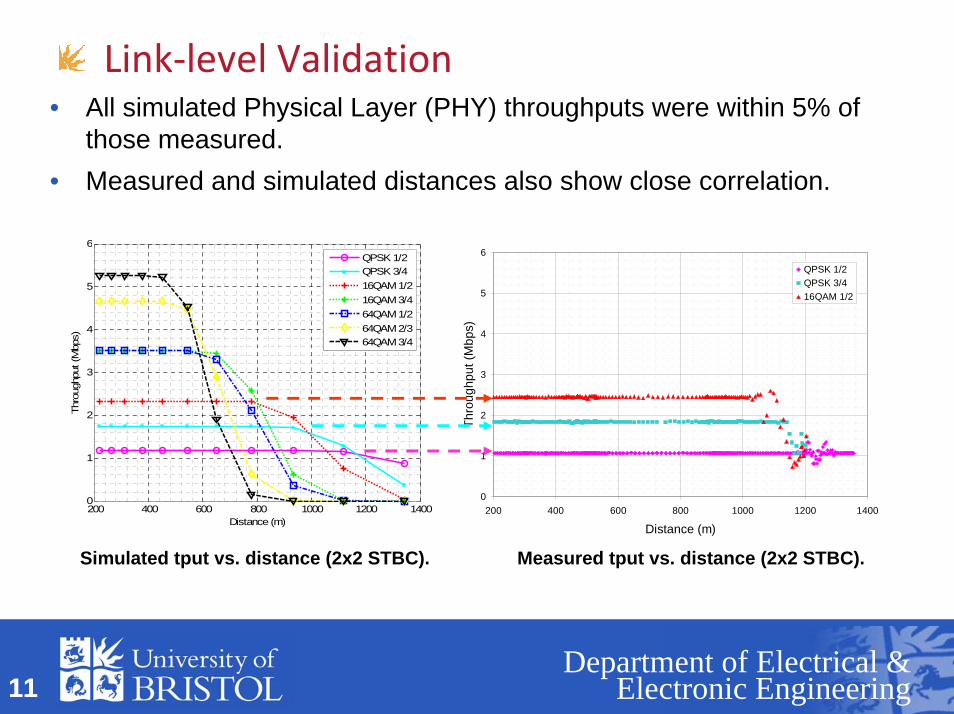
Simulated tput vs. distance (2x2 STBC).
• All simulated Physical Layer (PHY) throughputs were within 5% ofthose measured.
• Measured and simulated distances also show close correlation.
Measured tput vs. distance (2x2 STBC).
0
1
2
3
4
5
6
200 400 600 800 1000 1200 1400
Distance (m)
Thro
ughp
ut (M
bps)
QPSK 1/2QPSK 3/416QAM 1/2
11Department of Electrical &
Electronic Engineering11
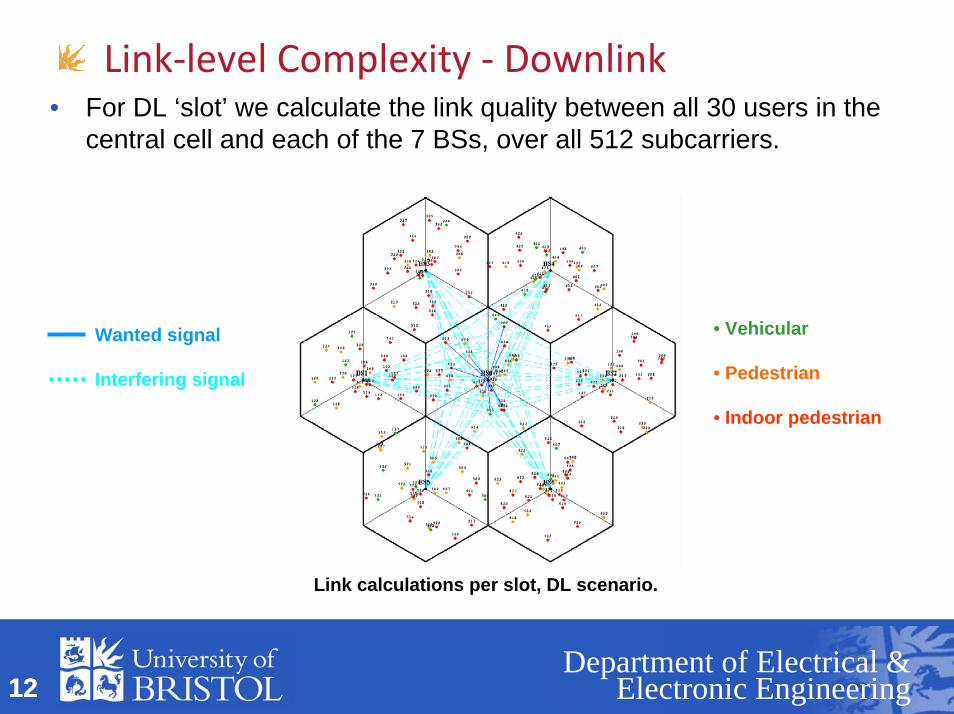
Link‐level Complexity ‐ Downlink• For DL ‘slot’ we calculate the link quality between all 30 users in the
central cell and each of the 7 BSs, over all 512 subcarriers.
• Vehicular
• Pedestrian
• Indoor pedestrian
Wanted signal
Interfering signal
Link calculations per slot, DL scenario.
12Department of Electrical &
Electronic Engineering12
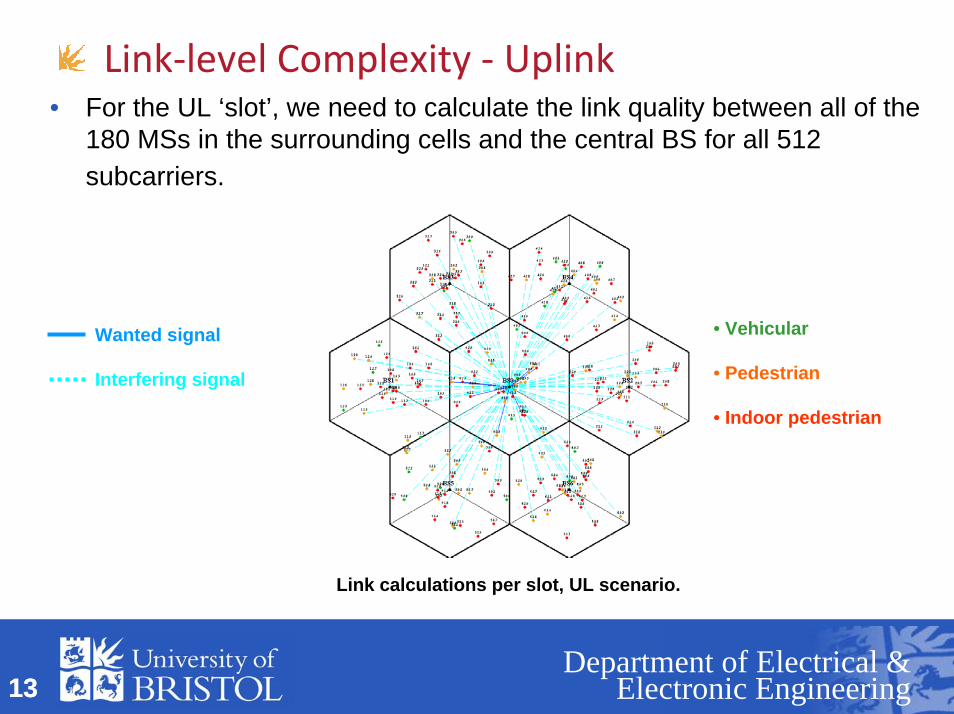
Link‐level Complexity ‐ Uplink• For the UL ‘slot’, we need to calculate the link quality between all of the
180 MSs in the surrounding cells and the central BS for all 512 subcarriers.
• Vehicular
• Pedestrian
• Indoor pedestrian
Wanted signal
Interfering signal
Link calculations per slot, UL scenario.
13Department of Electrical &
Electronic Engineering13

Link‐level Complexity• This amounts to 107,520 links per 100µs time slot – more than 1 billion
links per second!!• This is in addition to creating the channel and performing the
permutation, AMS/AMC, scheduling, HARQ, power controlling, mobility etc etc.
• With bit-level simulation we must average over a large number of channel instances. Each link performance curve takes 10 hours toproduce, system results would take weeks!
• We use an instantaneous PHY abstraction model to reduce the complexity to a manageable level, now each 5ms frame takes ~10secs.
• The simulator uses an efficient combination of C++ and Matlab and can be run on a Condor cluster giving close to real time performance.
14Department of Electrical &
Electronic Engineering14

Link‐level Abstraction – RBIR MIESM• This efficiently models dynamic behaviour and provides an
instantaneous look-up based on the current channel conditions.• It compresses the vector of received SINRs over a coded block into a
single Effective SINR which is then mapped to BLER by AWGN look-up.• Can also predict BLER including MIMO and H-ARQ performance and it
was validated against our link-level simulator for all MCS/MIMO modes.
-20 -15 -10 -5 0 5 10 15 20 25 300
1
2
3
4
5
6
7
8
9
10RBI v SINR
Rec
eive
d B
it M
utua
l Inf
orm
atio
n R
BI (
Bits
/Sym
bol)
SINR (dB)
BPSKQPSK16QAM64QAMAWGN Shannon Limit
( )
N
RBIRBIR
N
nn∑
== 1γ
( ) ( )( ) ( )⎪⎭
⎪⎬
⎫
⎪⎩
⎪⎨
⎧=
∑X
XY XYPXPXYPEmRBI
γγγ
,|,|log, 2
15Department of Electrical &
Electronic Engineering15
Simulator Functionality• Models a tri-sector, multi-cell environment with micro and macro
scenarios,• Exhaustively models all interferers,• Models full size TDD frame structure for UL/DL with subcarrier
randomisation (PUSC),• Implements AMC/AMS with all MCS modes and up to 8x2 MIMO
(STBC, SM open- and closed-loop with codebooks, MRT, MRC),• Implements hard FFR, HARQ, Power Control and hard handover,• Implements a PF scheduler with service prioritization and multiple flows
per user,• Uses a sophisticated correlated shadowing model and correlated
(MIMO) fast fading with realistic MS mobility and traffic mixes,• Obtains complexity reduction using an accurate and validated PHY
abstraction model.
16Department of Electrical &
Electronic Engineering16
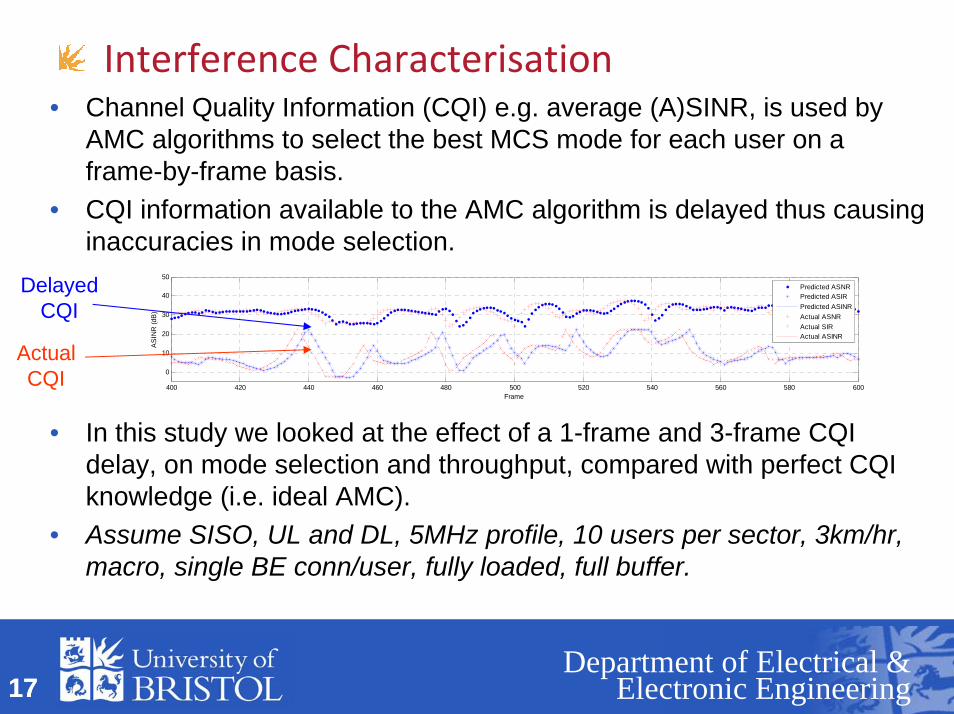
Interference Characterisation• Channel Quality Information (CQI) e.g. average (A)SINR, is used by
AMC algorithms to select the best MCS mode for each user on a frame-by-frame basis.
• CQI information available to the AMC algorithm is delayed thus causing inaccuracies in mode selection.
• In this study we looked at the effect of a 1-frame and 3-frame CQI delay, on mode selection and throughput, compared with perfect CQI knowledge (i.e. ideal AMC).
• Assume SISO, UL and DL, 5MHz profile, 10 users per sector, 3km/hr, macro, single BE conn/user, fully loaded, full buffer.
400 420 440 460 480 500 520 540 560 580 600
0
10
20
30
40
50
AS
INR
(dB
)
Frame
Predicted ASNRPredicted ASIRPredicted ASINRActual ASNRActual SIRActual ASINR
DelayedCQI
ActualCQI
17Department of Electrical &
Electronic Engineering17
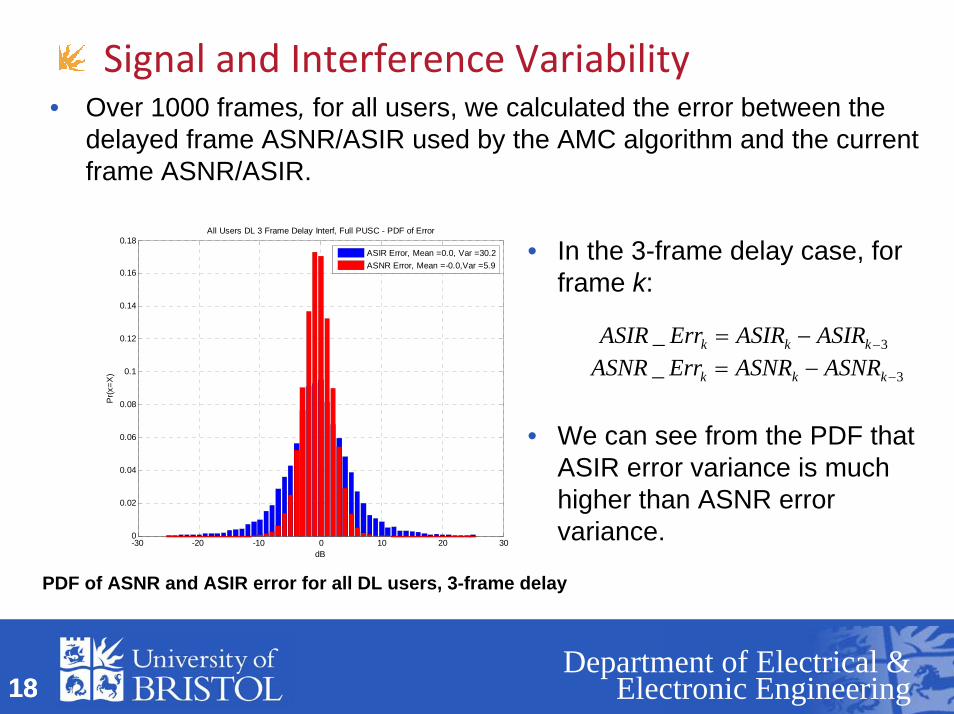
• In the 3-frame delay case, for frame k:
• We can see from the PDF that ASIR error variance is much higher than ASNR error variance.
Signal and Interference Variability• Over 1000 frames, for all users, we calculated the error between the
delayed frame ASNR/ASIR used by the AMC algorithm and the current frame ASNR/ASIR.
-30 -20 -10 0 10 20 300
0.02
0.04
0.06
0.08
0.1
0.12
0.14
0.16
0.18All Users DL 3 Frame Delay Interf, Full PUSC - PDF of Error
Pr(x
=X)
dB
ASIR Error, Mean =0.0, Var =30.2ASNR Error, Mean =-0.0,Var =5.9
PDF of ASNR and ASIR error for all DL users, 3-frame delay
3_ −−= kkk ASIRASIRErrASIR3_ −−= kkk ASNRASNRErrASNR
18Department of Electrical &
Electronic Engineering18

Mode Choice Error• As mode selection is based on the CQI from the delayed frame, ASINR
errors translate to MCS errors.• As the ASIR error dominates the ASNR, it is the variation in interference
that dominates AMC performance.
UL MCS selection error, 3-frame delay
-6 -5 -4 -3 -2 -1 0 1 2 3 4 5 60
0.5
1
1.5
2
2.5
3
3.5
4
4.5
log 10
(N)
All Users UL 3 Frame Delay Interf, Full PUSC - PDF of MCS Error, Wrong Selection =32.4%
Mode Error
19Department of Electrical &
Electronic Engineering19

Impact on Throughput• AMC errors lead to capacity reduction, a 29% reduction due to 3-frame
delayed CQI is seen below.• Current schedulers are strongly affected by interference and are unable
to cope with this frame-to-frame variation.
4400 4600 4800 5000 5200 5400 5600 5800 6000 6200 6400 66000
1
Tput
(Mbp
s)
Slot
4400 4600 4800 5000 5200 5400 5600 5800 6000 6200 6400 6600
0
0.5
1
BLE
R
Actual Frame Tput (0.109Mbps)Ideal MCS Frame Tput (0.159Mbps)
Actual BLER
400 420 440 460 480 500 520 540 560 580 6000
1
2
3
4
5
6
Mod
e
Frame
Current MCSIdeal MCS
400 420 440 460 480 500 520 540 560 580 600
0
10
20
30
40
50
AS
INR
(dB
)
Frame
Predicted ASNRPredicted ASIRPredicted ASINRActual ASNRActual SIRActual ASINR
MS 2.0 DL performance, frames 400-600
20Department of Electrical &
Electronic Engineering20

Mode Choice Error and Capacity Reduction• As mode selection is based on the CQI from the delayed frame ASINR
errors translate to MCS errors.• If too high a mode is used, errors will occur and capacity is lost. If too low
a mode is chosen capacity is wasted.• As the ASIR error dominates the ASNR, it is the variation in interference
that dominates AMC performance. • On the DL, incorrect mode usage fell 22.7% to 9.1% when interference
was orthoganalised.• Using 3-frame delay rather than ideal MCS knowledge reduced the user
throughput by up to:• 48% on the downlink,• 22% on the uplink.
• Schedulers are strongly affected by interference and are unable to cope with the frame-to-frame variation.
21Department of Electrical &
Electronic Engineering21

Summary• Without suitable interference characterization and management,
multi-billion dollar networks will collapse under full load.• System-level simulation is required, and is highly complex.
Complexity reduction techniques such as PHY abstraction are necessary to generate the results shown.
• It is the frame-to-frame fluctuations in interference, and not the received signal-level that dominate CQI inaccuracies.
• Imperfect CQI lead to AMC errors and this reduces user throughput by up to 50%.
• Schedulers are strongly affected by interference and are unable to cope with the frame-to-frame variation.
22Department of Electrical &
Electronic Engineering
Future Work• Improve the performance of mobile broadband networks by reducing
the impact of interference:1. Interference randomization (e.g. subcarrier permutation),2. Interference cancellation, (e.g. beamforming),3. Interference coordination, (e.g. cluster controlling).
• Combine the simulator with accurate 3D polarmetric field patterns and 3D urban ray tracing to further enhance simulation accuracy.
• Adapting simulator to model LTE, and new deployment scenarios including heterogeneous networks.
• Apply the simulators capabilities in the field of green BS, • Study the performance of higher layer performance such as video
streaming.• Continue to compare simulation with drive-test results to provide
validation and insight into real-world issues.
23Department of Electrical &
Electronic Engineering
Any Questions?
[2] D. Halls, A. Nix and M. Beach, “System Level Evaluation of UL and DL Interference in OFDMA Mobile Broadband Networks," IEEE WCNC 2011
[3] D. Halls, A. Nix and M. Beach, “System Level Evaluation of Interference in Vehicular Mobile Broadband Networks," IEEE VTC Spring 2011