Embed Size (px)
Citation preview

System Incident Investigation for the Tasmanian Region
Modelling and detailed analysis of transmission line fault events of December 2014 and February 2015
A JOINT INVESTIGATION BY AEMO AND TASNETWORKS
NOVEMBER 2015

System Incident Investigation for the Tasmanian Region
© AEMO 2
TERMS AND ABBREVIATIONS
Term or Abbreviation Definition
AC Alternating Current
AEMO Australian Energy Market Operator
Bridge Six pulse thyristor group
CCGT Combined Cycle Gas Turbine
DC Direct Current
FCAS Frequency Control Ancillary Services
FCSPS Frequency Control System Protection Scheme
FRT Fault Ride Through
GT George Town
HVDC High Voltage Direct Current
JWG Joint Working Group
kA Kiloamperes (one thousand amperes)
kV Kilovolts (one thousand volts)
LCC Line Commutated Converter
LG Line-to-ground
LL Line-to-line
ms Millisecond (one thousandth of a second)
NER National Electricity Rules
POW Point On Wave
PSCAD/EMTDC Simulation program (tool) for analysing power system transients
pu Per-unit
SCR Short circuit ratio
µs Microsecond (one millionth of a second)
Valve Also referred to as a thyristor valve – for LCC HVDC, typically 50-200 single thyristors connected in series.
VBE Valve Base Electronics (providing thyristor protection in the context of this report)

System Incident Investigation for the Tasmanian Region
© AEMO 3
IMPORTANT NOTICES
Purpose
Further to the initial report issued by the Australian Energy Market Operator Ltd (AEMO) in May 2015 [1], AEMO and Tasmanian Networks Pty Ltd trading as TasNetworks (TasNetworks) have jointly completed modelling and technical studies to understand the root cause of three recent disconnections of the Basslink interconnector following faults on the Tasmanian 220 kV network.
The two key activities discussed in this report, as defined in the initial report, are:
i. Verify the accuracy of the Tasmanian electromagnetic transient computer models, including the Basslink Interconnector, by replicating the system events of December and February through simulation
ii. Replicate a scoped set of critical studies using the verified Tasmanian network and Basslink Interconnector electromagnetic transient models to identify potential solutions
The analysis and conclusions presented herein have been developed and reviewed by a Joint Working Group formed in response to the recommendation published as part of AEMO’s initial investigations [1].
Disclaimer
This document or the information in it may be subsequently updated or amended. This document does not constitute legal or business advice, and should not be relied on as a substitute for obtaining detailed advice about the National Electricity Law, the National Electricity Rules, or any other applicable laws, procedures or policies. AEMO and TasNetworks have made every effort to ensure the quality of the information in this document, but cannot guarantee its accuracy or completeness.
Anyone proposing to use the information in this publication (including information and reports from third parties) should independently verify and check its accuracy, completeness and suitability for purpose, and obtain independent and specific advice from appropriate experts.
Accordingly, to the maximum extent permitted by law, AEMO and TasNetworks and their officers, employees and consultants involved in the preparation of this document:
i. Make no representation or warranty, express or implied, as to the currency, accuracy, reliability or completeness of the information in this document; and
ii. Are not liable (whether by reason of negligence or otherwise) for any statements or representations in this document, or any omissions from it, or for any use or reliance on the information in it.

System Incident Investigation for the Tasmanian Region
© AEMO 4
EXECUTIVE SUMMARY 5
1. INTRODUCTION 7
1.1 Sequence of network events 7
1.2 Historical performance of Tasmanian AC network and Basslink 8
2. VALIDATION OF COMPUTER MODELS 9
2.1 Methodology 9
2.2 Results 9
3. FACTORS INFLUENCING RESPONSE TO TRANSMISSION NETWORK FAULTS 10
3.1 Scenarios studied 10
3.2 Assessment criteria 10
3.3 Sensitivity analysis 11
3.4 Results summary 14
4. REFERENCES 16
APPENDIX A – PSCAD MODEL VERIFICATION 17
APPENDIX B – EXAMPLES OF PSCAD SIMULATION RESULTS 20

System Incident Investigation for the Tasmanian Region
© AEMO 5
EXECUTIVE SUMMARY
A. Background
On two occasions in December 2014 and once in February 2015, transmission faults in the Tasmanian 220 kV network resulted in disconnection of the Basslink Interconnector.
Consequently, during power transfer across Basslink from the mainland to Tasmania:
Loss of the Basslink Interconnector following a remote fault on the Tasmanian 220 kV network has been reclassified as a credible contingency event.
AEMO is required to source additional Frequency Control Ancillary Services (FCAS) in Tasmania.
The findings of the initial investigation published by AEMO in May 2015 [1] were as follows:
Each of the three faults on the 220 kV network was cleared in accordance with the System Standard and based upon information provided by TasNetworks, its network control and protection systems performed as the NER provisions require from Network Service Providers.
Based upon information provided by Basslink Pty Ltd, the Basslink control and protection systems operated as designed.
The unbalanced nature of each of the faults caused a commutation failure in the Basslink inverter station at George Town which is a normal occurrence on a temporary basis during faults in AC systems.
The high voltage direct current (HVDC) link tripped because multiple commutation failures were sustained. This has not occurred previously for Basslink [1]. HVDC links are designed to quickly recover from commutation failures so as to avoid loss of the HVDC link. However such a recovery is more difficult when the AC system is weak.
AEMO committed to complete power system modelling work in cooperation with TasNetworks to better understand the reasons for these recent events. The joint power system modelling work has now been completed and this report summarises the results.
B. Power system modelling and simulation
AEMO and TasNetworks have developed a detailed computer model to study the Tasmanian Power System during credible faults on the 220 kV network, including the interaction between the Basslink HVDC Link and the power system.
The developed model has been benchmarked against the three recent 220 kV faults that caused the disconnection of Basslink and loss of customer load. The results of this benchmarking have given AEMO and TasNetworks confidence in the overall model. While the model does not include all details of the Basslink thyristor protection, AEMO and TasNetworks consider the model sufficiently valid to simulate the sequence of observed events.
The results of the modelling and simulation studies have indicated that:
Performance of the Basslink Interconnector has not degraded. Recent changes in Tasmanian power system operation have resulted in an increased likelihood of a disconnection following credible contingencies.
Disconnection of the Basslink Interconnector following credible Tasmanian transmission network faults is sensitive to a number of factors:
o Level and proximity of online synchronous generation within the Tasmanian region to the Basslink HVDC terminal (increased generation close to George Town reduces the likelihood).
o Level of import on Basslink into Tasmania at time of transmission fault inception (increased level of import increases the likelihood).
o Number of phases involved in the transmission network fault and the fault impedance/residual voltage seen by Basslink (phase-to-phase faults and low fault impedance increase likelihood).

System Incident Investigation for the Tasmanian Region
© AEMO 6
Point on the power frequency (50 Hz) voltage wave form at which the a fault is initiated (this timing has a significant impact on the likelihood of tripping).
The likelihood of Basslink tripping for a fault at any given location remote from George Town thus varies depending upon how the above factors apply in combination at that time.
The modelling has shown that a set of circumstances remains possible for locations on the Tasmanian 220 kV system (particularly for faults at connection points of major generating units) where a fault would lead to loss of both a major generating unit and Basslink.
In particular, commitment of additional generation closer to George Town will reduce the likelihood of Basslink disconnection, though not to a level for which these events can be considered non-credible.
Details of this power system modelling and analysis work are discussed in this joint report.
C. Next steps
Based on the results presented in this report, AEMO is satisfied that the current reclassification of credible Tasmanian contingencies should remain in place.
AEMO and TasNetworks will review the recommendations of the independent expert (Manitoba HVDC Research Centre Inc) and implement appropriate findings.
Further, AEMO proposes to facilitate a Tasmanian power system working group to investigate ways to remove the current reclassification.

System Incident Investigation for the Tasmanian Region
© AEMO 7
1. INTRODUCTION
This section highlights the sequence of events for three transmission network fault events which occurred in December 2014 and February 2015. A brief summary of the historical performance of the Tasmanian network and Basslink in response to transmission network faults is also presented.
1.1 Sequence of network events
During the period from December 2014 to February 2015, three fault events occurred in the Tasmanian AC 220 kV transmission network which had undesirable consequences for the operation of the Basslink HVDC interconnector.
These three events caused a prolonged commutation failure in the Basslink power inverter. This was manifested by a sudden change in the inverter AC bus voltage caused by the phase shift experienced on the AC network as a result of the 220 kV fault. This resulted in a reduction of the inverter voltage magnitude and phase advance with respect to the control system’s internal reference waveform. Additionally, for all three events the Tasmanian end converter was operating in the ‘inverter mode’ (power transfer from Victoria to Tasmania) for which line-commutated converters (LCC) HVDC links are more susceptible to commutation failure [3].
The three network faults were unbalanced disturbances which are one of the main causes of commutation failure due to the resulting phase angle change in the inverter AC voltage. Two-phase faults generally result in the highest phase angle change.
The combination of sudden voltage dip and phase angle shifts to which the converter was exposed during inverter mode of operation was sufficient to result in the first commutation failure. This is an expected event for any LCC HVDC links as the ability of the HVDC control system to avoid one commutation failure in the presence of an AC network fault is very limited given the speed of response required.
Previous commutation failure events experienced in the history of Basslink operation resulted in commutation failures persisting for less than three cycles. By this time, the HVDC control systems had the opportunity to detect the event and regain control of the commutation process.
However, for the three transmission network fault events in December 2014 and February 2015 the commutation did not successfully resume within the desired reponse time following inception of the AC network fault. Such repetitive commutation failures are also referred to as ‘extended commutation failure’. As a result, the Valve Based Electronic (VBE) thyristor protection system issued a trip command to the converter station, removing Basslink from service. Extended commutation failures in response to single network fault events are not common, although they have been reported in technical literature [5]. Such events cause sustained overcurrent in the conducting valves and put at risk the physical integrity of the thyristor valves.
Many LCC HVDC schemes, including Basslink, incorporate an under voltage masking function in the thyristor protection system that is intended to prevent spurious operation during periods of low AC voltage. Activation of the masking function only occurs when AC voltage measurements at a converter station fall below the threshold setting. It is understood that the masking voltage is currently set to 0.3 pu for Basslink. For the three network fault events in December 2014 and February 2015, the resulting residual voltage at all phases was greater than 0.7 pu which did not therefore invoke the masking voltage scheme.
Subsequent investigations by Basslink Pty Ltd confirmed that all thyristor valves were ‘healthy’ following each of the three recorded trip events. The extension of the commutation failure is understood to have been the cause of the thyristor protection system operating.
The subsequent loss of Basslink triggered operation of the Frequency Control System Protection Scheme (FCSPS). The FCSPS is a Tasmanian specific scheme designed to mitigate frequency deviations that result from instantaneous loss of the interconnector at high power transfers. Operation of FCSPS in the three fault events resulted in disconnection of 383 MW, 402 MW and 485 MW of customer loads, respectively. For all three events the FCSPS operation was expected as it is designed to mitigate the impact on power system frequency caused by the loss of Basslink power transfer.

System Incident Investigation for the Tasmanian Region
© AEMO 8
1.2 Historical performance of Tasmanian AC network and Basslink
The available statistical evidence suggests that two-phase and two-phase-to-ground faults are as equally credible as the single-phase faults. This is an important observation in the context of NER clause 4.2.3 (Credible and non-credible contingency events) which defines only three phase faults as being non-credible. Basslink has been exposed to eighty three known fault events in the Tasmanian 220 kV network since 2007 [6]. While the total number of recorded commutation failure events is relatively high, the majority of these were not as a result of contingency events in the 220 kV network, but faults in the distribution system or generator terminal stations. An even smaller subset of transmission events occurred when the interconnector was operating at high power transfers.
It can be observed that while the link has experienced numerous commutation failure events, its historical exposure to critical credible contingencies, i.e. contingency events which are likely to have tested the HVDC controls to ‘their design limits’, has been relatively small. Over the past eight years there have been 13 unbalanced faults on the 220 kV Tasmanian transmission network during which time Basslink was importing in excess of 300 MW from Victoria to Tasmania. Only for the most recent three events did the fault result in disconnection of Basslink and the operation of the Tasmanian FCSPS.

System Incident Investigation for the Tasmanian Region
© AEMO 9
2. VALIDATION OF COMPUTER MODELS
2.1 Methodology
To ensure veracity of simulation results and the observations / conclusions that have been drawn, the integrated computer model, representing the Tasmanian transmission network, all registered Tasmanian generating units, and the Basslink HVDC interconnector, has been benchmarked against field measurements obtained from TasNetworks and Basslink Pty Ltd (Basslink) for the three system incidents that occurred on 10 and 16 December 2014, and 23 February 2015. The primary objective of the benchmarking studies is to demonstrate that the transmission network faults leading to extended commutation failures experienced by Basslink and the activation of the FCSPS can be accurately recreated by simulation. Accurate representation of the events forms the basis of evaluation of any potential solution.
For the three aforementioned events measured responses indicate that Basslink suffered an extended commutation failure, resulting in the operation of the VBE thyristor protection system, and subsequent tripping of the converter station.
To assess the accuracy of the simulations, the following benchmarking criteria were established using the PSCAD/EMTDC software:
i. Comparison of inverter three phase AC voltage measurements and simulations
ii. Comparison of inverter three phase AC currents measurements and simulations
iii. Comparison of inverter DC current measurements and simulations
2.2 Results
The detailed results of the benchmarking studies are presented in Appendix A. Plots are shown of internal and connection point electrical quantities measured during the system events and as recreated by simulation. As illustrated in Figure 5 to Figure 7, phase plots of AC inverter voltage and current correctly predict the magnitude and phase shift of the phase quantities for the recreated transmission fault. This is important to verify the expected response of the Basslink protection systems.
For all three system incidents that were investigated, the integrated PSCAD model will recreate the key phenomena, most critically the extended commutation failure that resulted in disconnection of Basslink for the December and February events. Similarly, the model accuracy was verified for a known system event on 16 December 2014 for which no extended commutation failure occurred. The fault in the latter case was a line to ground fault on the 220 kV Gordon to Chapel transmission line.
Based on the results obtained, AEMO and TasNetworks have concluded that the PSCAD model of the integrated Tasmanian computer model is sufficiently accurate to analyse the issue of extended commutation failure in response to credible transmission fault events in the Tasmanian AC network.
Results shown in Appendix A demonstrate that the difference between measured and simulated waveforms generally lies within a ±10% error margin, where the largest errors are associated with the peaks and troughs of the waveforms. Similarly, very good correlation is obtained between the timing of the measured and simulated waveforms, where the error margin is less than 1 millisecond. These results give confidence in the adequacy of the integrated computer model for investigating the observed network events and potential solutions.

System Incident Investigation for the Tasmanian Region
© AEMO 10
3. FACTORS INFLUENCING RESPONSE TO TRANSMISSION NETWORK FAULTS
The objective of this section is to investigate sensitivities of the Basslink Interconnector to possible disconnection following Tasmanian transmission network faults, which in turn can lead to activation of the FCSPS. Representative simulation results are summarised in Appendix B.
3.1 Scenarios studied
To assess the conditions under which the Basslink disconnection and subsequent loss of customer load could occur, fifteen different network scenarios have been considered for simulation, varying in demand and local generation dispatch, to level of Basslink import and severity of the transmission fault. The scenarios investigated are outlined along with key results in Table 2.
All scenarios considered correspond to zero power being produced by Tasmanian wind generation at the time of fault occurrence. Therefore, the cases considered are conservative, rather than worst case, because wind farms will provide significantly lower contributions to the fault level of the network compared to that delivered by synchronous generation technologies. Hence, wind farms do not assist in strengthening the network. For each scenario multiple simulation case studies were conducted to investigate sensitivity to fault impedance and point-on-wave where the fault occurs.
Furthermore, for scenarios #11-13 the fault impedance and point-on-wave were adjusted so as to replicate the voltage profile seen by the Basslink inverter terminal for the 10 and 16 December and 23 February events, respectively. These simulations are used as the benchmark for model assessment referred to in Section 2.
Similarly, scenarios #14 and 15 were developed so as to recreate the voltage profile seen by the Basslink for 10 December and 23 February events, respectively. However, to assess the sensitivity of the system events under consideration to generation dispatch the Tamar Valley combined cycle gas turbine (CCGT) plant is assumed to be offline.
For the simulations carried out, the HVDC link’s longest conducting valve current was used to determine whether or not an extended commutation failure would occur. Model validation results presented in Appendix A, including the DC current, confirm the veracity of using this criterion. Scenarios #1-10 include a full point-on-wave and fault impedance sensitivity analysis, whereas for scenarios #11-15 the longest conducting valve current was determined for a specific point-on-wave and fault impedance.
To account for modelling uncertainties, scenarios where the duration of the longest conducting valve current is between 60 and 62 milliseconds are highlighted as uncertain in terms of whether or not they will result in an extended commutation failure.
For all scenarios reported the line-to-line and line-to-ground voltage magnitudes at the Basslink terminals remained above 0.3 pu, hence the HVDC link voltage masking scheme was not invoked (refer to Section 1.1).
3.2 Assessment criteria
The following electrical quantities have been studied for each scenario investigated:
i. Three phase voltages at the George Town converter station
ii. Three phase currents at the George Town converter station
iii. Basslink DC current
iv. Longest conducting valve current
v. Line-to-line RMS voltage at the George Town converter station with protection masking threshold shown
vi. Line-to-ground RMS voltage at the George Town converter station with protection masking threshold shown

System Incident Investigation for the Tasmanian Region
© AEMO 11
The above quantities are instrumental in indicating the behaviour of the system, and the impact on the Tasmanian network following credible contingencies.
In the absence of an accurate thyristor valve protection model, the longest conducting valve current was used as the key criterion to assess whether or not an extended commutation failure had occurred. Where the duration exceeded 60 milliseconds and all line-to-line and line-to-neutral voltages at the George Town converter station were maintained above 0.3 pu, it has been assumed that the VBE thyristor protection system would operate and trip the interconnector.
3.3 Sensitivity analysis
3.3.1 Generation dispatch and system strength
A direct indicator of the strength (or weakness) of the power system is the fault current flowing during network fault events, which in turn is directly related to the number of synchronous generating units operating. A higher network fault current indicates a stronger power system, and lower value susceptibility to system disturbances.
Successful steady-state and transient operation of LCC HVDC links requires a minimum number of synchronous machines being online as often characterised by the short circuit ratio (SCR) or available fault level at the converter bus [5]. In all scenarios discussed in this report, including the actual events, the short circuit ratio at the inverter bus exceeds the minimum SCR for correct operation of the HVDC link. As an example Table 1 highlights the fault level, in MVA, and associated SCR seen by the George Town inverter bus. Fault levels shown in the table exceed the minimum required fault level of approximately 1300 MVA, corresponding to the Tasmanian power system load and Basslink import level for the three events, as agreed between TasNetworks and Basslink at the Basslink connection point.
Table 1 Fault level and associated SCR for the three actual extended commutation failure events
Event Fault level (MVA)
SCR
10 December 2014 2210 4.42
16 December 2014 1792 3.58
23 February 2015 2435 4.87
Simulation case studies demonstrate that dispatching additional generation in Tasmania, and in particular generation at George Town, will reduce the risk of extended commutation failure and subsequent Basslink tripping. This can be clearly seen by comparing scenario #4 and #5. Additionally, dispatching all synchronous generation in Tasmania would have avoided an extended commutation failure event and Basslink disconnection for the 16 December and 23 February events.
However, generation dispatch cannot entirely eliminate the risk of an extended commutation failure, and the likelihood of a reoccurrence of the December and February events depends on how various factors discussed in this Chapter apply at any given time.
3.3.2 Basslink import level
Increasing Basslink power import from Victoria to Tasmania increases the risk of an extended commutation failure. In practice, however, constraining Basslink import cannot completely avoid the risk of an extended commutation failure, and, as illustrated by the results of Table 2, Basslink import level cannot independently determine whether or not an extended commutation failure would occur following transmission network fault events.
For a historically common synchronous generation pattern which included the CCGT at George Town and no wind generation, a line-to-line fault at Hadspen was shown to result in a trip of Basslink at an import power level of only 100 MW. (Refer to scenario #5).
System Incident Investigation for the Tasmanian Region
© AEMO 12
3.3.3 Fault location
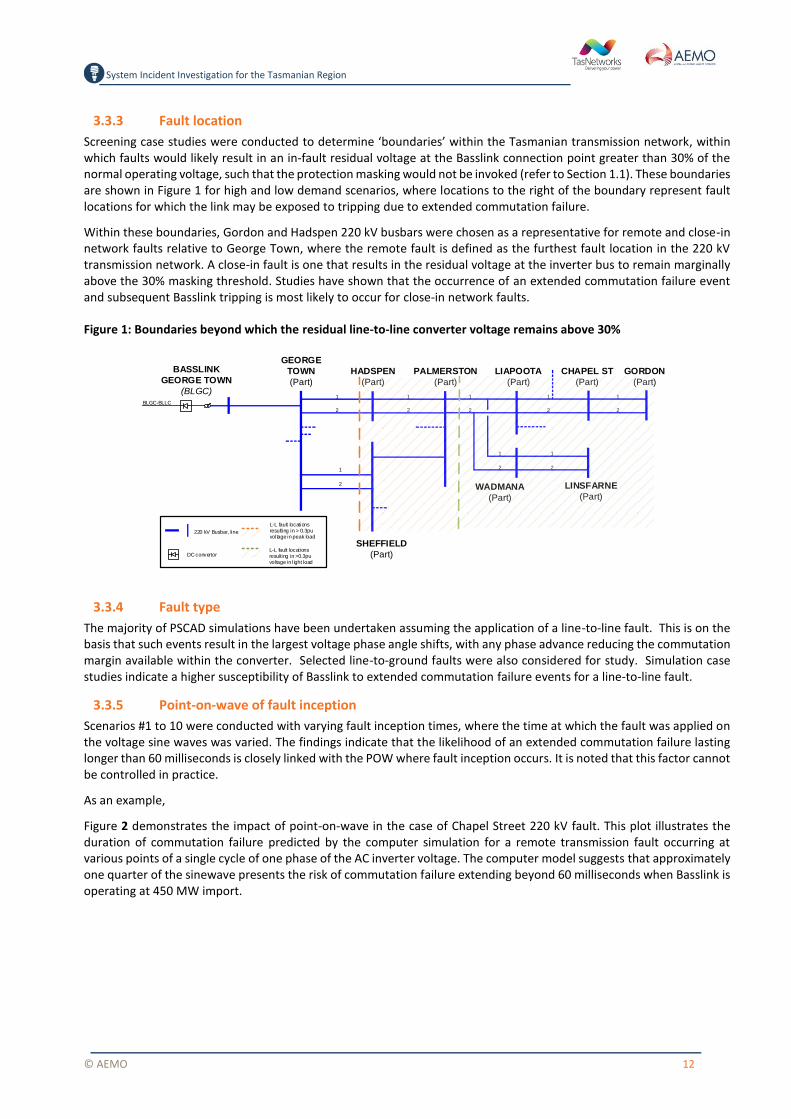
Screening case studies were conducted to determine ‘boundaries’ within the Tasmanian transmission network, within which faults would likely result in an in-fault residual voltage at the Basslink connection point greater than 30% of the normal operating voltage, such that the protection masking would not be invoked (refer to Section 1.1). These boundaries are shown in Figure 1 for high and low demand scenarios, where locations to the right of the boundary represent fault locations for which the link may be exposed to tripping due to extended commutation failure.
Within these boundaries, Gordon and Hadspen 220 kV busbars were chosen as a representative for remote and close-in network faults relative to George Town, where the remote fault is defined as the furthest fault location in the 220 kV transmission network. A close-in fault is one that results in the residual voltage at the inverter bus to remain marginally above the 30% masking threshold. Studies have shown that the occurrence of an extended commutation failure event and subsequent Basslink tripping is most likely to occur for close-in network faults.
Figure 1: Boundaries beyond which the residual line-to-line converter voltage remains above 30%
3.3.4 Fault type
The majority of PSCAD simulations have been undertaken assuming the application of a line-to-line fault. This is on the basis that such events result in the largest voltage phase angle shifts, with any phase advance reducing the commutation margin available within the converter. Selected line-to-ground faults were also considered for study. Simulation case studies indicate a higher susceptibility of Basslink to extended commutation failure events for a line-to-line fault.
3.3.5 Point-on-wave of fault inception
Scenarios #1 to 10 were conducted with varying fault inception times, where the time at which the fault was applied on the voltage sine waves was varied. The findings indicate that the likelihood of an extended commutation failure lasting longer than 60 milliseconds is closely linked with the POW where fault inception occurs. It is noted that this factor cannot be controlled in practice.
As an example,
Figure 2 demonstrates the impact of point-on-wave in the case of Chapel Street 220 kV fault. This plot illustrates the duration of commutation failure predicted by the computer simulation for a remote transmission fault occurring at various points of a single cycle of one phase of the AC inverter voltage. The computer model suggests that approximately one quarter of the sinewave presents the risk of commutation failure extending beyond 60 milliseconds when Basslink is operating at 450 MW import.
220 kV Busbar, line
DC convertor
BLGC-BLLC
BASSLINK
GEORGE TOWN
(BLGC)
GEORGE
TOWN
(Part)
HADSPEN
(Part)
PALMERSTON
(Part)
LIAPOOTA
(Part)
LINSFARNE
(Part)
CHAPEL ST
(Part)
GORDON
(Part)
1
2
1
2
1
2
1
2
1
2
1
2
1
2
WADMANA
(Part)
SHEFFIELD
(Part)
2
1
L-L fault locations resulting in >0.3pu voltage in light load
L-L fault locations resulting in > 0.3pu voltage in peak load

System Incident Investigation for the Tasmanian Region
© AEMO 13
Figure 2: Commutation duration vs. point on wave for a higher fault impedance case
3.3.6 Fault impedance
Fault impedance can be considered as a proxy for residual voltage at the converter terminals, as well as the likely phase angle shift that is experienced. Simulation case studies indicate that a high fault impedance results in a reduced commutation failure duration.
To assess sensitivity to fault impedance simulation studies were conducted using two different fault impedances; one that would result in a voltage dip just above 0.3 pu (lower fault impedance case) and another that would result in a voltage dip that was well above 0.3 pu (higher fault impedance case). For this sensitivity analysis, a line-to-line fault was applied at Hadspen 220 kV substation under a medium import level of 300 MW.
Figure 3 shows duration of commutation failure predicted by the model for a low impedance fault, relative to the point on the voltage cycle that the fault occurs. The plot illustrates that commutation occurring during more than half of the sinewave presents a risk of commutation failure extending beyond VBE protection setting of 60 ms when Basslink is importing 300 MW from Victoria to Tasmania.
Figure 3: Commutation duration vs. point on wave for a lower fault impedance case
Figure 3Figure 4 presents the same analysis with a high fault impedance. In this case, the residual voltage at the George
Town converter station is maintained at approximately 0.7 pu. Under these conditions, a line to line fault at Hadspen does not produce a commutation failure with long enough duration to cause Basslink to trip, irrespective of the POW of fault inception.
0 60 120 180 240 300 3600
10
20
30
40
50
60
70
Fault point on wave (degrees)
Co
mm
uta
tio
n f
ailu
re d
ura
tio
n (
ms)
450MW Import, Chapel St Red-White fault
0 60 120 180 240 300 3600
10
20
30
40
50
60
70
Fault point on wave (degrees)
Co
mm
uta
tio
n fa
ilu
re d
ura
tio
n (
ms)
300MW Import, Hadspen Red-White low impedance faultResidual Voltage ~0.4pu

System Incident Investigation for the Tasmanian Region
© AEMO 14
Figure 4: Commutation duration vs. point on wave for a higher fault impedance case
By increasing the simulated impedance of the fault (which depends on factors such electric arc, grounding impedance, etc.), the duration of the commutation failure was reduced by approximately 10 milliseconds. The intention of the simulation is to demonstrate the sensitivity of the HVDC commutation process to the fault impedance which cannot be controlled in practice.
Based on observed responses of the Basslink Interconnector to variations in fault type, fault impedance, and point-on-wave where the fault occurs AEMO and TasNetworks are able to note that increasing residual AC connection point voltage decreases the chance of disconnection of the HVDC Interconnector. However, the actual probability of successfully riding through a credible contingency event is determined by many variables, some of which are not directly controllable. Additionally while the probability of successful ride through increases with in-fault Basslink AC connection voltage; some residual risk appears to remain, potentially due to voltage phase shift.
Based on advice from Basslink for a residual voltage of less than 0.3 pu, the protection masking is activated thereby eliminating the risk of Basslink Interconnector being tripped (at least by the mechanism being investigated within this report). Fault locations that will result in low residual voltages are to the left of the boundaries marked in Figure 1.
For scenarios where the longest conducting valve current is less than 60 milliseconds, AEMO and TasNetworks are not in a position at the present time to categorically state that Basslink would not trip. Given the lack of detailed design information presently available, a level of certainty only exists around when Basslink will trip, with this certainty being based on the three ‘actual’ system incidents previously discussed.
3.4 Results summary
Table 2 highlights a summary of simulation case studies conducted and key results obtained. It also provides an indication of operating conditions which result in an extended commutation failure and subsequent Basslink tripping. As shown in the table a number of controllable and non-controllable factors will play a part in determining whether or not an extended commutation failure would occur. Consequently, different outcomes can be achieved depending on how these factors apply collectively at any given time.
0 60 120 180 240 300 3600
10
20
30
40
50
60
70
Fault point on wave (degrees)
Co
mm
uta
tio
n f
ailu
re d
ura
tio
n (
ms)
300MW Import, Hadspen Red-White high impedance faultResidual Voltage ~0.7pu

System Incident Investigation for the Tasmanian Region
© AEMO 15
Table 2: Simulation case study summary
Scenario no.
Tasmanian
Load
(MW)
On-line Tasmanian
generation Basslink
import
(MW)
Fault location Fault type Basslink trip?
1 1800 All 450 Hadspen LL Yes
2 1800 All 300 Hadspen LL Yes
3 1800 All 200 Hadspen LL Yes
4 1800 All 100 Hadspen LL No
5 1300 All 100 Hadspen LL Yes
6 1800 All 300 Hadspen LG Uncertain
7 1800 All 450 Chapel St LL Uncertain
8 1800 All 300 Chapel St LL No
9 1800 All 200 Chapel St LL No
10 1800 All 100 Chapel St LL No
11 1090 All 443 Lindisfarne-Waddamana LG Uncertain
12 1175 All 469 Gordon- Chapel St LG No
13 1000 All 464 Gordon- Chapel St LL No
14 1090 All except CCGT 443 Lindisfarne-Waddamana LG Uncertain
15 1000 All except CCGT 464 Gordon- Chapel St LL No

System Incident Investigation for the Tasmanian Region
© AEMO 16
4. REFERENCES
[1] AEMO; “Trip of transmission lines in Tasmania followed by the loss of Basslink on 10 and 16 Dec 2014, and 23 Feb 2015 (May 2015)”, Version 1, 12 May 2015.
[2] Basslink Pty Ltd, TasNetworks; “Inverter Operation of Line Commutated Converters for HVDC”, 2 March 2015.
[3] CIGRE Working Group (WG) 14.05; “Commutation failures causes and consequences”, 1995
[4] CIGRE Working Group (WG) 14.02, “A summary of the report on survey of controls and control performance in HVDC schemes”, 1994.
[5] CIGRE Working Group (WG) 14.07, ’’Guide for planning DC links terminating at AC system locations having low short-circuit capacities’’, 1997.
[6] Basslink Pty Ltd; “Basslink Fault Response History.xls”, As published on the AEMO website in conjunction with References [1] and [2].
Please note that References [1], [2] and [6] can be obtained from the AEMO website at:
http://www.aemo.com.au/Electricity/Resources/Reports-and Documents/~/link.aspx?_id=10F603F478C04BC7899FB1D41E08A217&_z=z

System Incident Investigation for the Tasmanian Region
© AEMO 17
APPENDIX A – PSCAD MODEL VERIFICATION
A.1 Event #1 – 10 December 2014
The line-to-ground fault on 10 December 2014 did not result in AC fault current greater than the pre-fault current present and the AC voltage remains relatively undistorted, apart from white phase which is faulted and has a lower magnitude during the fault period (see Figure 5).
In this case the DC current is the most useful measure for comparison since it indicates the duration of the commutation failure. Simulating this duration is critical to assessing the performance of the PSCAD model. As Figure 5 shows, the DC current duration and oscillation period indicates a high level of model accuracy. The extended commutation failure is evident in both the measurement and simulation results. However, there is a difference between the current peak and first trough. However, the peak and through of the simulated response are within ±10% of the respective measured responses.
The AC voltage waveforms also show a high level of accuracy, with similar harmonics being displayed in the faulted white phase. Since it is the AC voltage distortion that initiates the commutation failure, the simulation must be able to reproduce accurate network voltages during the fault period.
Figure 5: Simulation and measurement comparisons for 10 December 2014 line-to-ground fault
0 0.01 0.02 0.03 0.04 0.05 0.06 0.07 0.08-200
-100
0
100
200
Fault replication 10/12/2014
Ba
sslin
kA
C V
olta
ge
s (
kV
)
0 0.01 0.02 0.03 0.04 0.05 0.06 0.07 0.08-2
-1
0
1
2
Ba
sslin
kA
C C
urr
en
ts (
kA
)
Red Phase actual White Phase actual Blue Phase actual Red Phase Sim White Phase Sim Blue Phase Sim
0 0.01 0.02 0.03 0.04 0.05 0.06 0.07 0.08
0
2
4
6
8
Time (s)
Ba
sslin
kC
urr
en
t (k
A)
IDC
actual
IDC
Simulation
Measured commutation fail duration: 62.1 ms

System Incident Investigation for the Tasmanian Region
© AEMO 18
A.2 Event #2 – 16 December 2014
The two simultaneous line-to-ground faults on 16 December 2014 resulted in large current pulse seen within the AC system as shown in Figure 6. Comparing the shape and magnitude of the graphs shows a high degree of alignment between measurement and simulation results for both the AC current and voltage waveforms.
The magnitude of the AC fault current in the red and white phases is directly comparable to the measurement data. As expected, this causes a large distortion of the AC voltage on the corresponding phases. As for the 10 December event, the DC current shows a high degree of correlation for both commutation failure duration and oscillation frequency. The DC current simulation exhibits the same increased oscillation that was seen in the 10 December event, believed due to the DC cable modelling assumptions.
By observing the commutation failure duration, and correctly simulating magnitude and phase of the AC fault current, it is concluded that the PSCAD model accurately represents this network event.
Figure 6: Simulation and measurement comparisons for 16 December 2014 line-to-ground faults
0 0.01 0.02 0.03 0.04 0.05 0.06 0.07 0.08-200
-100
0
100
200
Fault replication 16/12/2014
Ba
sslin
kA
C V
olta
ge
s (
kV
)
0 0.01 0.02 0.03 0.04 0.05 0.06 0.07 0.08-6
-4
-2
0
2
4
6
Ba
sslin
kA
C C
urr
en
ts (
kA
)
Red Phase actual White Phase actual Blue Phase actual Red Phase Sim White Phase Sim Blue Phase Sim
0 0.01 0.02 0.03 0.04 0.05 0.06 0.07 0.08
0
2
4
6
8
Time (s)
Ba
sslin
kC
urr
en
t (k
A)
IDC
actual
IDC
Simulation
Measured commutation fail duration: 60.7 ms

System Incident Investigation for the Tasmanian Region
© AEMO 19
A.3 Event #3 – 23 February 2015
The 23 February 2015 event was different to the two previous disturbances as it was a line-to-line fault that triggered the commutation failure. Figure 7 shows that there was no large AC fault current evident at the converter connection point.
The comparisons of AC voltage waveforms show good consistency between simulation results and measurement data, and demonstrate that the PSCAD model is capable of simulating the physical network quite accurately. The AC current also shows a high degree of correlation, however the large AC current pulse is absent. As shown in both the 10 and 16 December events, the DC current for this event shows a high degree of correlation for both the duration and oscillation frequency. A similar increased oscillation that was seen in the simulations of the December events was also observed, believed to be due to the DC cable modelling assumptions.
As for the other two examples, the simulation results confirm the outcomes of the actual event, i.e. the extended commutation failure was sufficiently long for the VBE thyristor protection to have operated, resulting in a trip of the HVDC link.
Figure 7: Simulation and measurement comparisons for 23 February 2015 line-to-line fault
0 0.01 0.02 0.03 0.04 0.05 0.06 0.07 0.08-200
-100
0
100
200
Fault replication 23/02/2015
Ba
sslin
kA
C V
olta
ge
s (
kV
)
0 0.01 0.02 0.03 0.04 0.05 0.06 0.07 0.08-3
-2
-1
0
1
2
3
Ba
sslin
kA
C C
urr
en
ts (
kA
)
Red Phase actual White Phase actual Blue Phase actual Red Phase Sim White Phase Sim Blue Phase Sim
0 0.01 0.02 0.03 0.04 0.05 0.06 0.07 0.08
0
2
4
6
8
Time (s)
Ba
sslin
kD
C C
urr
en
t (k
A)
IDC
actual
IDC
Simulation
Simulated commutation fail duration: 60.3 ms

System Incident Investigation for the Tasmanian Region
© AEMO 20
APPENDIX B – EXAMPLES OF PSCAD SIMULATION RESULTS
The plots shown represent the following electrical quantities:
i. Three phase voltages at the George Town converter station
ii. Three phase currents at the George Town converter station
iii. Basslink DC current
iv. Longest conducting valve current
v. Line-to-line RMS voltage at the George Town converter station with protection masking threshold shown
vi. Line-to-ground RMS voltage at the George Town converter station with protection masking threshold shown
All electrical quantities are shown for consistency with presentation of the model validation results. However, most critical for the purpose of evaluating the likelihood of a network resulting in disconnection of Basslink are the line to line, and line to ground voltages, and the longest conducting valve current.
The commutation failure duration time referred to as critical for establishing the severity of the event, is indicated on the figure showing the longest conducting valve current, while line-to-neutral and line-to-line voltages at the converter AC terminals are shown overlaid with the 0.3 pu protection mask setting.

System Incident Investigation for the Tasmanian Region
© AEMO 21
B.1 Simulation results for scenario #1
Figure 8: Basslink import at 450 MW, commutation failure duration: 65 ms
0.00 0.02 0.04 0.06 0.08 0.10 0.12 0.14 0.16 0.18 0.20
-200
-100
0
100
200
Basslink
AC
Volta
ge (
kV
)
450MW Import, Hadspen R-W fault
Red
White
Blue
0.00 0.02 0.04 0.06 0.08 0.10 0.12 0.14 0.16 0.18 0.20-3
-2
-1
0
1
2
3
Basslink
AC
Curr
ent
(kA
)
Red
White
Blue
0.00 0.02 0.04 0.06 0.08 0.10 0.12 0.14 0.16 0.18 0.20
0
2
4
6
8
Basslink
DC
Cu
rren
t (k
A)
IDC
0.00 0.02 0.04 0.06 0.08 0.10 0.12 0.14 0.16 0.18 0.20
0
2
4
6
8
Lo
ngest
Cond
ucting
Valv
e C
urr
ent
(kA
)
IDC
0.00 0.02 0.04 0.06 0.08 0.10 0.12 0.14 0.16 0.18 0.200
0.3
0.6
0.9
1.2
Basslink
L-G
RM
S V
olt
age (
pu)
Red
White
Blue
0.00 0.02 0.04 0.06 0.08 0.10 0.12 0.14 0.16 0.18 0.200
0.3
0.6
0.9
1.2
Basslink
L-L
RM
S V
olt
age (
pu)
Time (s)
R-W
W-B
B-R
65.975ms

System Incident Investigation for the Tasmanian Region
© AEMO 22
B.2 Simulation results for scenario #5
Figure 9: Realistic scenario and Basslink importing 100 MW, commutation failure duration: 92 ms
0.00 0.02 0.04 0.06 0.08 0.10 0.12 0.14 0.16 0.18 0.20-200
-100
0
100
200
Basslink
AC
Volta
ge (
kV
)
100MW Import, Hadspen R-W fault, 1126MW load
Red
White
Blue
0.00 0.02 0.04 0.06 0.08 0.10 0.12 0.14 0.16 0.18 0.20-2
-1
0
1
2
Basslink
AC
Curr
ent
(kA
)
Red
White
Blue
0.00 0.02 0.04 0.06 0.08 0.10 0.12 0.14 0.16 0.18 0.20
0
2
4
6
8
Basslink
DC
Cu
rren
t (k
A)
IDC
0.00 0.02 0.04 0.06 0.08 0.10 0.12 0.14 0.16 0.18 0.20
0
2
4
6
8
Lo
ngest
Cond
ucting
Valv
e C
urr
ent
(kA
)
IDC
0.00 0.02 0.04 0.06 0.08 0.10 0.12 0.14 0.16 0.18 0.200
0.3
0.6
0.9
1.2
Basslink
L-G
RM
S V
olt
age (
pu)
Red
White
Blue
0.00 0.02 0.04 0.06 0.08 0.10 0.12 0.14 0.16 0.18 0.200
0.3
0.6
0.9
1.2
Basslink
L-L
RM
S V
olt
age (
pu)
Time (s)
R-W
W-B
B-R
92.025ms

System Incident Investigation for the Tasmanian Region
© AEMO 23
B.3 Simulation results for scenario #11
Figure 10: Results for 10 December 2014 line-to-ground fault event with all synchronous generators in service, commutation failure duration: 61 ms
0.00 0.02 0.04 0.06 0.08 0.10 0.12 0.14 0.16 0.18 0.20
-200
-100
0
100
200
Ba
sslin
kA
C V
olta
ge
(kV
)
10/12/14 Fault, All synchronous generation online
Red
White
Blue
0.00 0.02 0.04 0.06 0.08 0.10 0.12 0.14 0.16 0.18 0.20-3
-2
-1
0
1
2
3
Ba
sslin
kA
C C
urr
en
t (kA
)
Red
White
Blue
0.00 0.02 0.04 0.06 0.08 0.10 0.12 0.14 0.16 0.18 0.20
0
2
4
6
8
Ba
sslin
kD
C C
urr
en
t (kA
)
IDC
0.00 0.02 0.04 0.06 0.08 0.10 0.12 0.14 0.16 0.18 0.20
0
2
4
6
8
Lo
ng
est
Co
nd
uct
ing
Va
lve
Cu
rre
nt (
kA)
IDC
0.00 0.02 0.04 0.06 0.08 0.10 0.12 0.14 0.16 0.18 0.200
0.3
0.6
0.9
1.2
Ba
sslin
kL
-G R
MS
Vo
ltag
e (
pu
)
Red
White
Blue
0.00 0.02 0.04 0.06 0.08 0.10 0.12 0.14 0.16 0.18 0.200
0.3
0.6
0.9
1.2
Ba
sslin
kL
-L R
MS
Vo
ltag
e (
pu
)
Time (s)
R-W
W-B
B-R
61.625ms

System Incident Investigation for the Tasmanian Region
© AEMO 24
B.4 Simulation results for scenario #13
Figure 11: Results for 23 February 2015 line-to-line fault event with all synchronous generators in service, commutation failure duration: 36 ms
0.00 0.01 0.02 0.03 0.04 0.05 0.06 0.07 0.08
-200
-100
0
100
200
Ba
sslin
kA
C V
olta
ge
(kV
)
23/02/15 Fault, All synchronous generation online
Red
White
Blue
0.00 0.01 0.02 0.03 0.04 0.05 0.06 0.07 0.08
-5
0
5
Ba
sslin
kA
C C
urr
en
t (k
A)
Red
White
Blue
0.00 0.01 0.02 0.03 0.04 0.05 0.06 0.07 0.08
0
2
4
6
8
Ba
sslin
kD
C C
urr
en
t (k
A)
IDC
0.00 0.01 0.02 0.03 0.04 0.05 0.06 0.07 0.08
0
2
4
6
8
Lo
ng
est C
on
du
ctin
gV
alv
e C
urr
en
t (k
A)
IDC
0.00 0.01 0.02 0.03 0.04 0.05 0.06 0.07 0.080
0.3
0.6
0.9
1.2
Ba
sslin
kL
-G R
MS
Vo
lta
ge
(p
u)
Red
White
Blue
0.00 0.01 0.02 0.03 0.04 0.05 0.06 0.07 0.080
0.3
0.6
0.9
1.2
Ba
sslin
kL
-L R
MS
Vo
lta
ge
(p
u)
Time (s)
R-W
W-B
B-R
35.975ms