Embed Size (px)
Citation preview
SA
YS
a
ARRAA
KSECS
1
ailcsrnngZdaag(edc
0h
Ecological Modelling 252 (2013) 44– 52
Contents lists available at SciVerse ScienceDirect
Ecological Modelling
journa l h o me pa g e: www.elsev ier .com/ locate /eco lmodel
ystem dynamics modeling for urban energy consumption and CO2 emissions: case study of Beijing, China
.Y. Feng, S.Q. Chen, L.X. Zhang ∗
tate Key Joint Laboratory of Environmental Simulation and Pollution Control, School of Environment, Beijing Normal University, Beijing 100875, China
r t i c l e i n f o
rticle history:eceived 19 May 2012eceived in revised form 7 September 2012ccepted 8 September 2012vailable online 1 October 2012
eywords:ystem dynamics modelnergy consumption
a b s t r a c t
It is clear that city must be part of the solution if an urbanizing world is to grapple successfully withecological challenges such as energy depletion and climate change. A system dynamics model was devel-oped in this study using STELLA platform to model the energy consumption and CO2 emission trends forthe City of Beijing over 2005–2030. Results show that the total energy demand in Beijing is predictedto reach 114.30 million tonnes coal equivalent (Mtce) by 2030, while that value in 2005 is 55.99 Mtce,which is 1.04 times higher than the level in 2005. Accordingly, the total CO2 emissions in 2030 will reach169.67 million tonnes CO2 equivalent (Mt CO2-eq), 0.43 times higher than that of 2005. The change ofenergy structure from carbon rich fuel as coal to low-carbon fuel as natural gas will play a very essential
O2 emissionsTELLA
role in carbon emission reduction activities of Beijing. The modeling results also shows that the servicesector will gradually replace the industrial dominant status in energy consumption as the largest energyconsuming sector, followed by industrial and transport sector. The sensitive analysis suggests that changeof economic development mode and control of rational population growth will have a far-reaching influ-ence on energy consumption and on carbon emissions. All these results will provide essential informationfor Beijing’s future energy and carbon emission profiles.
. Introduction
More than one-half of the world’s population now lives in urbanreas, but they are blamed for producing as much as 80% of human-ty’s greenhouse gas (GHG) emissions. In China, for instance, the 35argest cities contain about 18% of the country’s population andontribute to 40% of the country’s energy usage and CO2 emis-ions in 2006 (Dhakal, 2009). Therefore, they have played crucialoles in determining the energy and carbon emission profiles of theation, and would be of great significance in achieving the country’sational targets such as energy security and climate change miti-ation (Zhang et al., 2011a,b; Chen and Chen, 2012; Li et al., 2010a;hang and Hu, 2011; Cai et al., 2009b). Systematic analysis andynamic modeling of urban energy demand and carbon emissionsre extremely important to understand and address issues associ-ted with fuel security, energy system planning and management,rowth of GHG, and other emissions and investment decisionsAkimoto et al., 2008; Vera and Langlois, 2007; Liu et al., 2009; Cai
t al., 2009a). However, it is challenging to achieve the desired pre-iction accuracy, because cities are dynamic systems of organizedomplexity, with multiple independent variables that all affect each∗ Corresponding author. Tel.: +86 10 59893229; fax: +86 10 59893229.E-mail address: [email protected] (L.X. Zhang).
304-3800/$ – see front matter © 2012 Elsevier B.V. All rights reserved.ttp://dx.doi.org/10.1016/j.ecolmodel.2012.09.008
© 2012 Elsevier B.V. All rights reserved.
other. A variety of factors associated with economic development,population growth and migration, climate change, and even con-sumer behavioral patterns need to be considered simultaneously ina simulation model. Thus, energy demand forecasting at differenttemporal and spatial scales must fully account for varying levels ofsystem complexity.
In the past decades, a number of studies were conducted forplanning energy management systems and controlling the asso-ciated pollution gas and GHG emissions at the city level, withthe classical energy-modeling approaches which can be catego-rized into three types: top-down (Lu et al., 2010; Xu and Masui,2009), bottom-up (Phdungsilp, 2010; Gielen and Chen, 2001; Linet al., 2010; Kanudia and Loulou, 1998; Cormio et al., 2003; Zhanget al., 2011a; Feng and Zhang, 2012), and hybrid models (Bohringerand Rutherford, 2009; Liu et al., 2011; Hadley and Short, 2001;Turton, 2008; Mirasgedis et al., 2007). Traditional energy modelsapplied to the previous studies usually use deterministic forecastsunder assumption that we can precisely foresee the evolution of theenergy system. Most of them run with the aid of scenario analysisas a snapshot that describes a possible and plausible future, mak-ing it difficult to adequately manage the dynamical evolution and
the intrinsic stochastic behavior of many vital elements inside theurban energy system. In this context, system dynamics (SD) can beadopted to describe the inner interactions and structures impact-ing urban development and identify the desirable and undesirable
l Mod
ip
dcggmwjSefiSat
2
2
wYp1mta1CTpevabtt2Bttinrhea
ttfeds
2
issl
Y.Y. Feng et al. / Ecologica
nterventions, thus capable of illuminating the evolving process andredicting the energy development trend of the whole city.
This study explores the intrinsic relationship between energyemand and economic and social environment, which helps fore-ast municipal energy demand and carbon emissions in a fastrowing urban region. Taking the city of Beijing as a case, an inte-rated system dynamics model was developed with a coupledodeling structure based on the framework of STELLA software,hich offered a realistic platform for predicting the trends of Bei-
ing’s energy demand and CO2 emissions from 2005 to 2030. TheD model will hopefully improve our understanding on the inher-nt inter-linkages and dynamic evolutionary structures impactinguture urban energy system development, and identify the signif-cant contributors to urban energy demand and carbon emissions.uch information is necessary for Beijing’s future energy planningnd guidelines for policy-making, and highlights possible sugges-ions for urban energy conservation and carbon emission reduction.
. Study area and methodology
.1. Overview of the study area
Beijing is the capital of China which is located on the north-est border of the North China Plain and is surrounded byanshan Mountain in the west, north and northeast. Beijing occu-ies an administrative area of around 16,808 km2, comprising of6 districts and 2 counties (Dong et al., 2012). Similar to otheretropolises in developing countries, Beijing is undergoing rapid
ransformation, with a growing population, many new buildings,nd increasing automobile traffic. In 2010, Beijing’s GDP increased0.3% compared with the previous year, reaching 1411.36 billionhinese Yuan (CNY), and the per capita GDP was 71,938.43 CNY.he population of Beijing exceeded 19.61 million with the floatingopulation accounting for 35.89%, and the civil motor vehicle fleetxceeded 4.80 million units (including 3.74 million privately ownedehicles) at the end of 2010 (BMSB, 2011). The Beijing metropolis islso characterized by a scarcity of natural resources, demonstratedy the fact that all of the natural gas and crude oil consumed byhe city, as well as 95% of the coal, 64% of the electricity, and 60% ofhe refined oil consumed has to be imported from outside (Li et al.,010b). Along with the rapid economic and social development,eijing has witnessed manifold increase in the energy consump-ion and related carbon emissions in the last three decades. In 2010,he total energy consumption reached 69.54 Mtce and, correspond-ngly, the per capita energy consumption was 3.54 tce, 1.5 times theational average, ranking second amongst Chinese cities, only infe-ior to Shanghai (NBS, 2011). The high levels of energy consumptionave, in turn, resulted in high carbon emissions. The per capita CO2missions reached 6.91 tonnes in 2009, i.e., 1.3 times the nationalverage.
It is worthwhile to note that Beijing is the most representa-ive city experiencing the rapid urbanization and economic growth,he accelerated changes in technology, lifestyle, and societal trans-ormation, as well as increasing energy consumption and carbonmissions. For this reason, we chose Beijing as the case area forynamic modeling of urban energy consumption and CO2 emis-ions.
.2. Concept of system dynamics
System dynamics (SD), introduced by Jay Forrester in the 1960s,
s a well-established system simulation methodology for under-tanding, visualizing and analyzing complex dynamic feedbackystems (Zhao et al., 2011). In light of systems thinking, we can ana-yze the cause-and-effect relationship among the factors inside theelling 252 (2013) 44– 52 45
system and depend on the computer simulation to quantitativelyanalyze the structure of the information feedback system and thedynamic relation between function and behavior. SD is robust inthat it could reflect the driving forces, incorporate individual sub-systems into a general framework and analyze their interactions,thereby providing holistic understanding of the whole system aswell as the relevant policy responses for urban sustainability (Yuanet al., 2008). However, it suffers from the shortcoming that all theinput data necessary for the operation of SD model need externalgeneration.
In fact, SD has been applied extensively to many areas includingsocial-economic systems (Forrester, 1969, 1971), ecological sys-tems (Saysel and Barlas, 2001), transport systems (Suryani et al.,2010), environmental management and policy assessment, such assolid waste management (Dyson and Chang, 2005), water resourcemanagement (Stave, 2003; Rehan et al., 2011), GHG mitigation(Anand et al., 2005; Kunsch and Springael, 2008), sustainable eval-uation and environmental planning (Guo et al., 2001). Within theenergy management regime, SD models have been developed andapplied to national energy policy evaluation (Ford, 1983; Naill,1992; Qudrat-Ullah, 2005), energy efficiency analysis (Dyner et al.,1995), and the development of energy industry (Bunn and Larsen,1992; Chi et al., 2009). To the best of our knowledge, not muchattention has been paid to the research of urban energy and carbonemissions from the perspective of system dynamics.
It is important to note that the software Vensim® and Stella® arewidely adopted by system dynamics models for simulation appli-cations, which provide a user-friendly interface. In addition, theyoffer a flexible way to dynamically visualize and communicate howcomplex systems and ideas really work by building a variety of sim-ulation models from causal loops or stock and flow (Isee System,2006). In this study, the software package Stella® was employedto the model building of urban energy consumption and relatedcarbon emissions.
2.3. Formulation of the Beijing-STELLA Model
In this study, a system dynamics based computer simulationmodel was developed, which has been named as Beijing-STELLAModel, for estimation and prediction of urban energy consump-tion trends and CO2 emissions in Beijing. The boundary of theBeijing-STELLA Model is the total administrative area of BeijingCity. The concerned period for the dynamic modeling is from 2005to 2030. In light of the research target and data availability, thestructure of Beijing-STELLA Model was designed as a compound ofsix sub-models, i.e., socioeconomic, agricultural, industrial, service,residential, and transport sub-models. The stock-flow diagram forthe model is shown in Fig. 1.
It should be emphasized that it is impossible to describe thedynamics of socio-economic processes by a single empirical equa-tion or classical formula as that in biological or ecological areas dueto complexity of socio-economic issues. With regard to this, a set ofempirical equations were developed based on different combina-tions of input variables for various sub-models. Real-world datarelevant to various internal linkages among socioeconomic andmanagerial factors were processed to retrieve regression analysesperformed using the SPSS statistical software (SPSS Inc., Chicago,IL) that support flows and conditions within and among these sixsub-models. The regression equation can be expressed as follows:
Y = f (X1, X2, . . . , Xn) (1)
where X is the independent variable, Y is the dependent variable,
and the simulation error rate �i for every value of Y (Yi) is given by�i =∣∣∣ (Yi − Ai)
Ai
∣∣∣ (2)

46 Y.Y. Feng et al. / Ecological Modelling 252 (2013) 44– 52
gram
wv
sita2itEdsNsma
2
hetgdeB89aawiooaa
Fig. 1. The stock-flow dia
here Ai represents the actual value and Yi is the simulatedalue.
Among the alternatives, the best regression equations wereelected according to two criteria, i.e., the equation has to be log-cal (i.e., it has to provide a causal explanation for an observedrend), and it needs to have a high goodness of fit (i.e., R2) (Leind Wang, 2008). In addition, the energy consumption data from006 to 2010 was reserved for later model validation, and the ver-
fication results are shown in Appendix B. Most of the data used inhis paper were collected from Beijing Statistical Yearbook, Chinanergy Statistical Yearbook, and the survey data of governmentepartments, including Beijing Development and Reform Commis-ion, Beijing Transportation Bureau, Beijing Statistical Bureau, andational Energy Administration of China. The modeling details of
ubsystems are described in the following sub-sectors, and theain variables and the final regression equations used in this model
re described in Appendix A.
.3.1. Socio-economic sub-modelSocio-economic sub-model is the core of Beijing-STELLA Model,
aving interactions with all other sectors. As a rule of thumb,conomic growth is closely related to growth in energy consump-ion because the more energy is used, the higher the economicrowth. Thus, assumptions concerning economic development willefinitely affect the estimation result of energy demand and CO2missions. The 12th Five-Year Plan (FYP) of Beijing envisions thateijing’s economic growth rate during 2011–2015 will be about%, and according to the WEO (2008), China is assumed to grow at.2% per year between 2006 and 2015 and at 6.1% between 2006nd 2030. As Beijing is one of the most developed cities in Chinand its economic growth rate is higher than the national average,e assume that the GDP in Beijing will grow at a rate of 8% dur-
ng 2011–2020 and 6% during 2021–2030. Considering the trend
f recent years and the outline perspective plan of Beijing, mostf GDP in 2030 will be contributed by the service sector, whichccounts for 85%, while the remaining come from agricultural (1%)nd industrial (14%) sector.of Beijing-STELLA Model.
Population scale is another essential factor that affects the sizeand composition of energy demand, directly and indirectly throughits impact on economic growth and development (WEO, 2008). Thetotal population in Beijing can be divided into the registered per-manent population and the floating population. Due to the largedemand for cheaper labors and relative higher salary comparedto rural areas in cities, Beijing without exception will experiencethe ever increasing population in China, among which the high netimmigration rate is the dominant contributor (Yuan et al., 2008).In contrast, the registered permanent population will be strictlycontrolled by local government, which is predicted to reach 14.82million in 2030 according to the 12th FYP of Beijing. The floatingpopulation was predicted by Logistic Equation based on the his-torical data from 1978 to 2005, the maximum capacity of whichwas assumed to be no more than 15 million, considering the carry-ing capacity of the urban resources and the environment throughexpert consultations.
2.3.2. Industrial sub-modelLike many other megacities in Asia, Beijing is relocating its major
industries either to peri-urban areas or to areas outside city borders,leaving cities increasingly dominated by the tertiary sector. Conse-quently, the proportion of the industrial energy consumption inBeijing has been declining dramatically, accounting for less thanhalf of the total consumption since 2005. In this study, construc-tion sector was also included in this sub-model. Industrial energyconsumption was calculated as follows:
EDI = EII × VAI (3)
where EDI is the energy consumed by the industrial sector; EII isthe energy consumption per unit of industrial sector value added;VAI is the value added of industrial sector.
Energy intensity, measured as energy consumed per unit of
industrial value added, is a key indicator determining industrialenergy consumption. Industrial energy intensity is closely relatedto economic development and technology innovation. The indus-trial energy structure, described by the share of raw coal in
l Mod
tetAigooma
2
ii
E
wet
ptdaalemetd
2
mCiw0d
E
wth
eiaaReauoan
2
stt
Y.Y. Feng et al. / Ecologica
otal energy consumption, also makes a significant sense to thenergy intensity. By using regression technique on 1995–2005 data,he indicator of industrial energy intensity was formulated (seeppendix A). Different types of energy carriers were distinguished,
.e., solid fuels (coal product), liquid fuels (petroleum product),aseous fuels (natural gas), electricity and heat. The proportionsf coal, natural gas and electricity were estimated in considerationf historical trends, government and special-sector planning docu-ents, taking the energy structure of OECD countries for reference
s well.
.3.3. Service sub-modelFollowing a similar modeling framework, energy consumption
n the service sector was determined by the value added and energyntensity of the service sector:
DS = EIS × VAS (4)
here EDS is the energy consumed by the service sector; EIS is thenergy consumption per unit of service sector value added; VAS ishe value added of service sector.
The energy use of the service sector is dominantly driven by theopulation, the commercial floor area growth, energy structure andhe per capita consumption expenditure. GDP was not used as airect driver but rather as a force that drove the floor area growthnd the per capita consumption expenditure. In this study, the floorrea was expressed as the sales area of commercial space due to theack of data. A regression was performed on 1995–2005 data for thenergy intensity of service sector (see Appendix A). There are fourajor sources of energy in this sector, including coal, natural gas,
lectricity and heat. The proportion of each fuel type was obtainedhrough the use of curve-fitting to historical trends based on theata from 1995 to 2005.
.3.4. Residential sub-modelThe rapid growth of the economy has not only led to dra-
atic changes of wealth, but also lifestyle and energy consumption.hanging lifestyles and the rising living standard have resulted
n rapid growth in the energy consumption of domestic sector,ith the per capita residential energy consumption increasing from
.35 tce in 2000 to 0.63 tce in 2010. Similarly, the residential energyemand can be defined as:
DR =∑
j
EIR × ALR (5)
here EDR is the residential energy consumption; j is the energyype; EIR is the residential energy consumption per capita or perousehold; ALR is the total population or the number of households.
The main energy types consumed in the residential sector arelectricity, fuel gases (natural gas and LPG), coal and heat. Electric-ty use per capita was highly correlated with the stock of electricalppliances and GDP per capita. The growth of household electricalppliances of Beijing was considered as a function of per capita GDP.esidential coal consumption was negatively correlated with thelectricity use (see Appendix A). Besides, heat consumed per capitand fuel gases consumed per household have remained almostnchanged at 47.12 kgce and 280.53 kgce, respectively. The goalf the Beijing government of promoting natural gas application ismbitious, i.e., 100% of the urban households will be connected toatural gas by 2015.
.3.5. Transport sub-model
The transport sector in this study was divided into four sub-ectors, including railway, highway, airway, and intracity passengerransport which was then split into public transit and individualraffic. Energy demand in the transport sector was modeled as a
elling 252 (2013) 44– 52 47
product of activity level, structure and energy intensity, as shownin the following equation:
EDT =∑
i
TT × MSi × FEi × CC−1i
(6)
where EDT is the energy consumption from the transport sector; i isthe transport mode; TT is the freight or passenger traffic turnover;MSi is the mode split of traffic turnover; FEi is the oil consumptionper unit distance; CCi is the carrying capacity.
In general, there are two factors that affect the transport demandincluding macroeconomic condition (GDP growth), and demo-graphic factor (population). Transport turnover was estimated byextrapolating the historical trend from 1994 to 2005 throughregression analyses, where the turnover volume was regardedas the explained variable, and population and GDP were theexplanatory variables (see Appendix A). According to the historicaltechnical data and existing condition analysis, energy intensities(energy consumed per passenger-kilometer/ton-kilometer) in rail-way and highway transport sub-sector will not be improved muchin the near future, which was assumed to be constant in this model.Besides, the fuel efficiency of vehicles in intracity transport wouldincrease by 20% during the study period with reference to inter-national advanced level. The modal share was estimated accordingto the government’s development strategy which assumes that thecontribution of mass transit to passenger capacity will reach 62%in 2030.
2.3.6. Agricultural sub-modelThe agricultural sector is comprised of farming, forestry, animal
husbandry, and fishing. Energy consumption from the agriculturalsector was calculated using the following equation:
EDA = EIA × VAA (7)
where EDA is the energy consumed by the agricultural sector; EIA isthe energy consumption per unit of agricultural sector value added;VAA is the value added of agricultural sector.
It is important to note that the proportion of energy consumedby agricultural sector is relatively small, about 1.5% of the total con-sumption in Beijing. The energy consumption per unit of GDP hasdecreased by 40% over the past decade, which can be attributed tothe improvement of machinery and equipment, the optimization ofagricultural structure, and changes in the structure of agriculturalproducts. Coal, oil and electricity are three major sources of energyin this sector. A multiple linear regression model was developed torelate agricultural energy intensity to the total agricultural outputvalue and agricultural structure, based on the data from 1995 to2005 (see Appendix A).
2.3.7. CO2 emissionsThe projected CO2 emissions were estimated based on the
energy demand and the carbon emission factors. The CO2 emissionfactors for different energy types were taken from the correctedvalue based on the 2006 IPCC recommended method (Dhakal, 2009;Bi et al., 2011). Carbon emissions from electricity and heat wereallocated to the primary energy including coal and natural gas basedon the conversion efficiency of power generation and heating (NBS,2011). CO2 emissions were calculated using the following equation:
CE =∑
i,j
EDi,j × EFj (8)
where CE is the total carbon emissions of the whole city; i is thesub-sector; j is the energy type; EDi,j is the energy consumed bysub-sector i in energy type j; and EFj is the carbon emission factorof energy type j.

48 Y.Y. Feng et al. / Ecological Mod
F
3
3
3
2uc5gs0atccapt
3
i
ig. 2. Total energy consumption and energy intensity in Beijing from 2005 to 2030.
. Results and discussion
.1. Energy consumption
.1.1. Overall energy consumptionThe values of modeling results by Beijing-STELLA Model from
005 to 2030 are shown in Fig. 2. Along with the intensifiedrban development and expanding population, the total energyonsumption in Beijing is predicted to increase steadily from5.99 Mtce in 2005 to 114.30 Mtce in 2030, with an annualrowth rate of 2.90%. However, the energy consumption inten-ity, measured by consumption per unit GDP, will reduce from.80 tce/10,000 CNY in 2005 to 0.19 tce/10,000 CNY in 2030, withn average annual decreasing rate of 5.56%. Beijing will makeremendous achievements in the improvement of energy effi-iency, although it does not achieve a real decline in total energyonsumption. Moreover, the modeling result for 2015 shows thatbout 26.98% reduction of energy intensity can be achieved com-ared with the 2010 level, while the target of Beijing’s 12th FYP iso reduce energy intensity by 17%.
.1.2. Sectoral energy consumptionThe share of total final energy consumption by different sectors
s presented in Fig. 3. In 2005, industrial sector contributed to the
Fig. 3. Structure of final energy consumption
elling 252 (2013) 44– 52
major share (53.38%) of the final energy consumption, followed bythe service sector. During the period from 2005 to 2030, however,the service sector will gradually replace the industrial dominantstatus and become the largest energy consuming sector, reachingthe proportion of 42.37% in 2030. The transport sector also deservesattention paid to it, since it is likely to confront a large increase inenergy consumption resulting from fast growth of private vehicles.In 2021, the transport sector will account for 19.09% of the totalfinal energy consumption, a 6.74% increase over the level of the year2005. Nevertheless, the share of energy consumed in the transportsector will basically maintain stable after 2021 due to the trafficmodal shift and the improvement of vehicle fuel efficiency. Theabsolute energy consumption of the residential sector also showsan upward trend with an annual growth rate of 3.26%, while theshare will remain more or less unchanged from 2005 to 2030.
3.1.3. Energy mixThe structural changes of energy consumption from 2005 to
2030 are shown in Fig. 4. It is apparent that the energy usage struc-ture in Beijing will experience a tremendous change. In 2005, coaland oil were the primary fuels in the final energy consumption sys-tem, with the proportion of 39.55% and 29.56%, respectively. Alongwith the optimization of energy structure, in 2030, the proportionof coal consumption will decrease to 6.87%, while the clean energyusage, including electricity and natural gas, will increase rapidly,reaching a total of 52.92%, nearly 2.39 times higher than the 2005value. It is also worthwhile to note that the share of oil consumptionwill decline since 2015. Overall, the energy usage structure will befurther optimized, with rapid growth in the use of alternative cleanenergy. This, in turn, will play an important role in the mitigationof carbon emissions (see Section 3.2).
3.2. CO2 emissions
3.2.1. Overall CO2 emissionsPresented in Fig. 5 are the total CO2 emissions in Beijing from
2005 to 2030. On the whole, the total CO2 emissions show an
increasing trend, yet with a slight drop between 2011 and 2015.The total emissions will increase from 118.41 Mt CO2-eq in 2005 to169.67 Mt CO2-eq in 2030, with an annual growth rate of 1.45%. Thegrowth rate of carbon emissions is much lower than that of energyby sector in Beijing from 2005 to 2030.

Y.Y. Feng et al. / Ecological Modelling 252 (2013) 44– 52 49
Fig. 4. Final energy mix in Beijing by
ceT2icsseaote
Cp
TC
Fig. 5. Total CO2 emissions in Beijing from 2005 to 2030.
onsumption, which is probably due to the optimization of thenergy structure, i.e., the increasing proportion of low-carbon fuels.he evident decline of carbon emissions during the period from011 to 2015 is attributable to the two facts, i.e., (1) Beijing munic-
pal government will continuously eliminate backward productionapacity, e.g., the coking production capacity, which will declineharply due to the steel works-Shougang Group moving to Tang-han City; (2) Beijing has made significant efforts to improve energyfficiency by developing thermal power plants with high capacitynd performance and phasing out smaller plants. The constructionf “Four Major Thermoelectric Centers” will be accelerated duringhe 12th Five-Year period. This will cause a rapid decrease in carbonmissions in Beijing between 2011 and 2015.
The CO2 emission intensity of economic activities and per capitaO2 emission value are shown in Table 1. The emission intensityresents an overall declining trend, with an average annual rate
able 1O2 emission intensity and per capita CO2 emissions of Beijing.
CO2 emission intensity(t CO2-eq/104 CNY)
Per capita CO2
emissions(t CO2-eq)
2005 1.70 7.672010 0.93 7.122020 0.44 5.852030 0.29 6.00
fuel type from 2005 to 2030.
of 6.83%. The per capita carbon emissions will decrease steadilyfrom 7.67 t CO2-eq in 2005 to 5.85 t CO2-eq in 2020, but then riseslightly afterward, reaching 6.00 t CO2-eq in 2030. In the shorttime, the adjustment of industrial structure and the optimiza-tion of energy structure will make a big difference in reducingper capita emissions. However, to realize the long-term reductiongoal, more strict control of the total energy consumption growthis still essential. Reports show that the per capita emission lev-els of China, the United States, Australia, and the EU-27 countrieswere 6.8 t CO2-eq, 16.9 t CO2-eq, 18.0 t CO2-eq, and 8.1 t CO2-eqin 2010, respectively (IES-JRC, 2011). Although Beijing’s per capitacarbon emissions are a little higher than the national average,they are still significantly lower than those of the United Statesand many developed countries, but relatively close to those ofEurope.
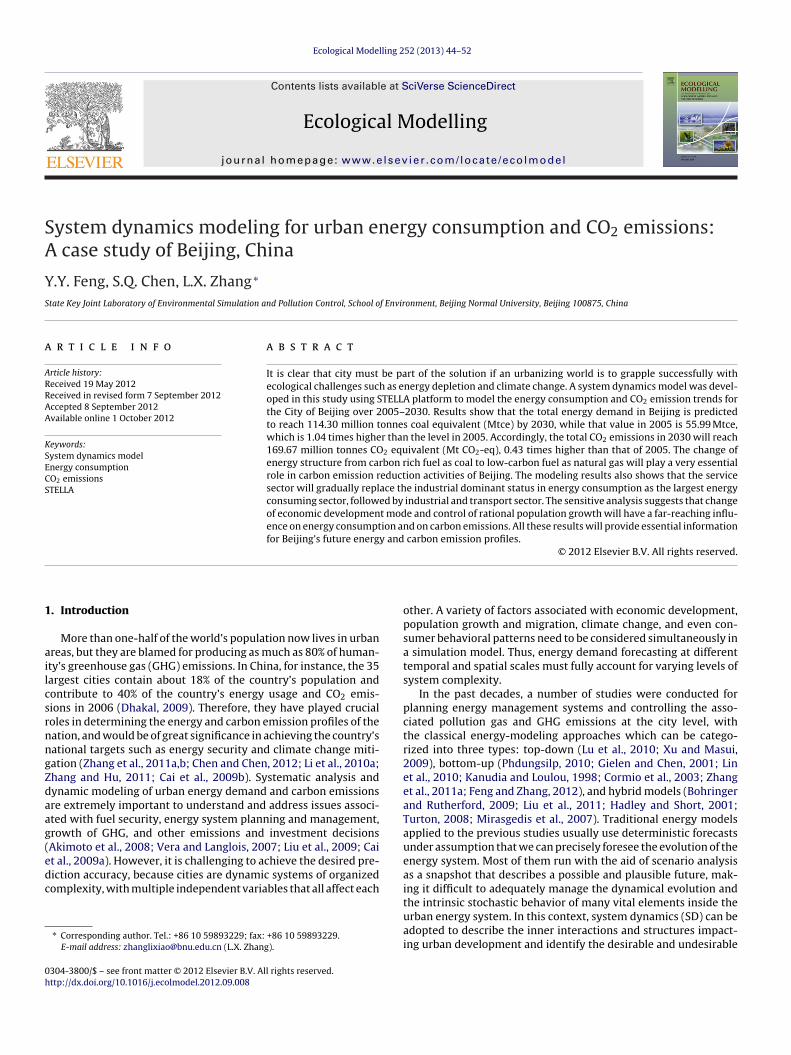
3.2.2. Emission contributor analysisThe share of sectoral contribution in total emissions from 2005
to 2030 is shown in Fig. 6. Among all of the sectors, the industrialsector contributed the largest share of CO2 emissions at 42.09% in2005, followed by the electricity and heating generation (i.e., trans-formation) sector. With the continuous adjustment of the industrialstructure, the emission contribution of industrial sector will grad-ually decrease to 24.51% in 2030. In contrast, the CO2 emissionsfrom the transport sector will experience a quick growth risingfrom 10.79% in 2005 to 24.52% in 2030 due to the rapidly increasingvehicle stock, making the transport sector another dominant con-tributor to overall emissions. The emissions of the service sectorwill account for 15.98% of the total in 2030, much lower comparedto its share in energy consumption, owning to the dominance ofrelative clean energy type (electricity and natural gas) consumedin this sector.
The detailed break down of absolute CO2 emission growth forBeijing during the period from 2005 to 2030 is presented in Table 2.It can be found that the industrial sector will achieve absolute cutsin emission level, which will definitely ease the burden of urbancarbon emissions. In contrast, the transport sector will become thelargest contributor to the absolute emission growth, followed by
service and transformation sector. In light of identification of keysectors for carbon emission reduction, the transport, service, elec-tricity and heating generation sectors are the ones, due to theircontribution or potential contribution to total emissions.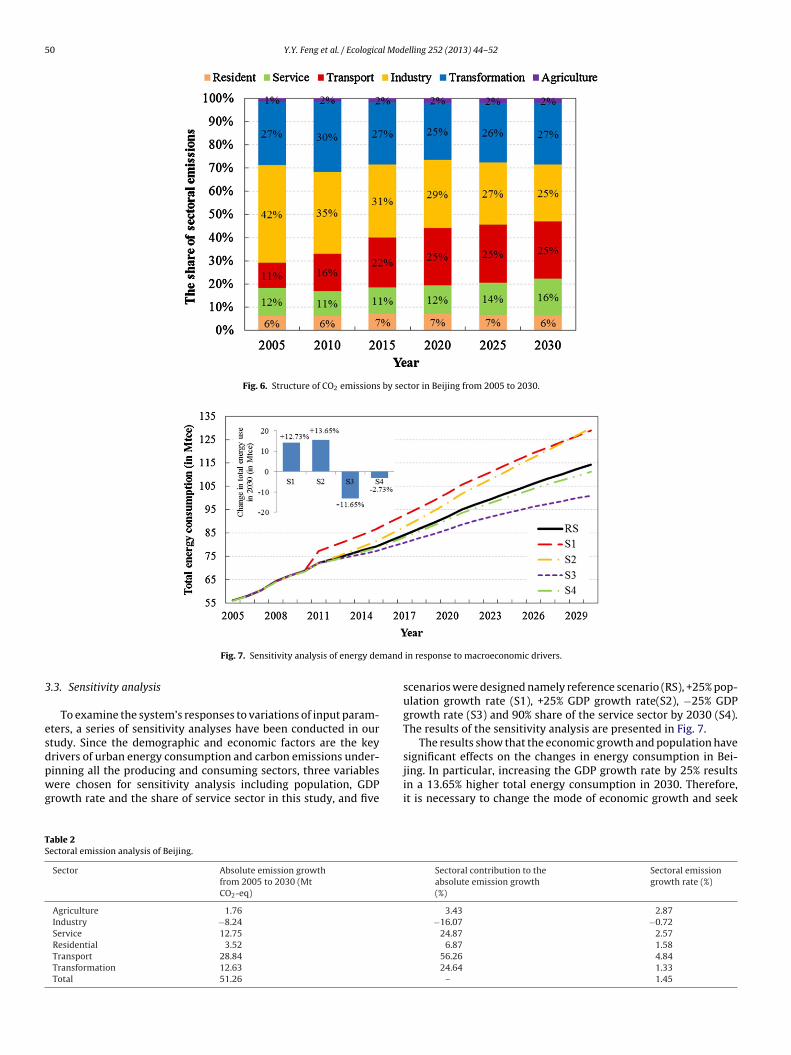
50 Y.Y. Feng et al. / Ecological Modelling 252 (2013) 44– 52
Fig. 6. Structure of CO2 emissions by sector in Beijing from 2005 to 2030.
mand
3
esdpwg
TS
Fig. 7. Sensitivity analysis of energy de
.3. Sensitivity analysis
To examine the system’s responses to variations of input param-ters, a series of sensitivity analyses have been conducted in ourtudy. Since the demographic and economic factors are the keyrivers of urban energy consumption and carbon emissions under-
inning all the producing and consuming sectors, three variablesere chosen for sensitivity analysis including population, GDProwth rate and the share of service sector in this study, and five
able 2ectoral emission analysis of Beijing.
Sector Absolute emission growthfrom 2005 to 2030 (MtCO2-eq)
Agriculture 1.76
Industry −8.24
Service 12.75
Residential 3.52
Transport 28.84
Transformation 12.63
Total 51.26
in response to macroeconomic drivers.
scenarios were designed namely reference scenario (RS), +25% pop-ulation growth rate (S1), +25% GDP growth rate(S2), −25% GDPgrowth rate (S3) and 90% share of the service sector by 2030 (S4).The results of the sensitivity analysis are presented in Fig. 7.
The results show that the economic growth and population havesignificant effects on the changes in energy consumption in Bei-
jing. In particular, increasing the GDP growth rate by 25% resultsin a 13.65% higher total energy consumption in 2030. Therefore,it is necessary to change the mode of economic growth and seekSectoral contribution to theabsolute emission growth(%)
Sectoral emissiongrowth rate (%)
3.43 2.87−16.07 −0.72
24.87 2.576.87 1.58
56.26 4.8424.64 1.33
– 1.45
l Mod
cvaototaFhmtsaw
4
Bwweissfeitbb
bvjp
rttwaaod
orm
aedrtsatf
A
i2
Y.Y. Feng et al. / Ecologica
oordinated development for economic growth and energy conser-ation. In terms of the demographic factor, Beijing has experienced
booming population in recent decades, which has brought seri-us problems including tight water supplies, surge in vehicles andraffic jams, especially excessive energy consumption. The controlf urban population will be another important task for achievinghe sustainable development of Beijing, especially with a reason-ble proportion of floating population. It can also be found fromig. 7 that the improvement in the share of service sector does notave prominent impact on total energy consumption. Beijing hasade great achievements in the optimization of industrial struc-
ure, along with the high development of service sector, so energyaving by structure adjustment will be limited in the future. Thebove factors have similar effects on the total CO2 emissions, whichill not be discussed in detail repeatedly.
. Conclusions
In order to project the energy demand and CO2 emissions ineijing over 2005–2030, an integrated system dynamics modelas developed based on the framework of STELLA software, whichould definitely provide quantitative base for effective urban
nergy planning and management as well as alternative scenar-os for the development of a low-carbon city. The modeling resultshow that Beijing is to be confronted with a heavy burden of energyupply and carbon mitigation, which will stress the urgent needor energy savings and emission reductions. Particularly, the totalnergy consumption in Beijing is predicted to reach 114.30 Mtcen 2030, 1.04 times higher than that of 2005. Correspondingly, theotal CO2 emissions present a general increasing trend which wille 0.43 times higher than that of 2005, in despite of a slight dropetween 2011 and 2015.
In terms of the final energy structure, the optimization from car-on rich fuel as coal to low-carbon fuel as natural gas will play aery essential role in carbon emission reduction activities of Bei-ing. However, it should also be remembered that the reductionotential by readjusting energy structure is very limited.
This study also shows that the service sector will graduallyeplace the industrial dominant status in energy consumption ashe largest energy consuming sector, followed by industrial andransport sector. In terms of carbon emissions, the transport sectorill become the main contributors together with transformation
nd industrial sectors. Therefore, the service and transport sectorsre identified as promising fields for achieving effective controlf energy consumption and carbon emissions over the next fewecades.
The sensitive analysis demonstrates that appropriate controlsf economic development and population growth will have a far-eaching influence on urban energy conservation and on carbonitigation in Beijing.Nevertheless, a number of refinements and model extensions
re required for future consideration: (1) the framework in mod-ling interactions between socioeconomic factors and energyemand in various sectors are highly aggregated, which mayequire the inclusion of some disaggregated schemes to describehe agent behaviors and internal dynamics in finer detail; (2) in thistudy, only macro economic factors were considered for sensitivitynalysis. If the different sensitivity analyses can be conducted athe sectoral level, the results will become more robust and reliableor sustainability policy making.
ppendix A. Supplementary data
Supplementary data associated with this article can be found,n the online version, at http://dx.doi.org/10.1016/j.ecolmodel.012.09.008.
elling 252 (2013) 44– 52 51
References
Akimoto, K., Sano, F., Oda, J., Homma, T., Rout, U.K., Tomoda, T., 2008. Global emissionreductions through a sectoral intensity target scheme. Climate Policy 8, 46–59.
Anand, S., Dahiyaa, R.P., Talyana, V., Vratb, P., 2005. Investigations of methane emis-sions from rice cultivation in Indian context. Environment International 31,469–482.
Bi, J., Zhang, R.R., Wang, H.K., Liu, M.M., Wu, Y., 2011. The benchmarks of carbonemissions and policy implications for China’s cities: case of Nanjing. EnergyPolicy 39, 4785–4794.
BMSB (Beijing Municipal Statistics Bureau), 2011. Beijing Statistical Yearbook 2011.China Statistics Press, Beijing.
Bohringer, C., Rutherford, T.F., 2009. Integrated assessment of energy policies:decomposing top-down and bottom-up. Journal of Economic Dynamic and Con-trol 33, 1648–1661.
Bunn, D., Larsen, E., 1992. Sensitivity reserve margin to factors influencing invest-ment behavior in the electricity market of England and Wales. Energy Policy 29,420–429.
Cai, Y.P., Huang, G.H., Tan, Q., 2009a. An inexact optimization model for regionalenergy systems planning in the mixed stochastic and fuzzy environment. Inter-national Journal of Energy Research 33 (5), 443–468.
Cai, Y.P., Huang, G.H., Yang, Z.F., Sun, W., Chen, B., 2009b. Investigation of public’sperception towards rural sustainable development based on a two-level expertsystem. Expert Systems with Applications 36 (5), 8910–8924.
Chen, S.Q., Chen, B., 2012. Network environ perspective for urban metabolism andcarbon emissions: a case study of Vienna, Austria. Environmental Science andTechnology 46, 4498–4506.
Chi, K.C., Nuttall, W.J., Reiner, D.M., 2009. Dynamics of the UK natural gas industry:system dynamics modelling and long-term energy policy analysis. TechnologicalForecasting & Social Change 76, 339–357.
Cormio, C., Dicorato, M., Minoia, A., Trovato, M., 2003. A regional energy planningmethodology including renewable energy sources and environmental con-straints. Renewable and Sustainable Energy Reviews 7, 99–130.
Dhakal, S., 2009. Urban energy use and carbon emissions from cities in China andpolicy implications. Energy Policy 37, 4208–4219.
Dong, C., Huang, G.H., Cai, Y.P., Liu, Y., 2012. An inexact optimization modelingapproach for supporting energy systems planning and air pollution mitigationin Beijing city. Energy 37, 673–688.
Dyner, I., Smith, R., Pena, G., 1995. System dynamics modeling for energy efficiencyanalysis and management. Journal of Operational Research 46, 1163–1173.
Dyson, B., Chang, N.B., 2005. Forecasting municipal solid waste generation in a fast-growing urban region with system dynamics modeling. Waste Management 25,669–679.
European Commission Joint Research Center Institute for Environment and Sus-tainability (IES-JRC), 2011. Long-term trend in global CO2 emissions: 2011report. Available at: http://edgar.jrc.ec.europa.eu/news docs/C02%20Mondiaal%20webdef 19sept.pdf (accessed on 20.04.12).
Feng, Y.Y., Zhang, L.X., 2012. Scenario analysis of urban energy saving and car-bon emission reduction policies: a case study of Beijing. Resources Science 34,541–550 (in Chinese).
Ford, A., 1983. Using simulation for policy evaluation in the electric utility industry.Simulation 40 (3), 85–92.
Forrester, J.W., 1969. Urban Dynamics. The MIT Press, Cambridge.Forrester, J.W., 1971. World Dynamics. Wright-Allen Press, Cambridge.Gielen, D., Chen, C.H., 2001. The CO2 emission reduction benefits of Chinese
energy policies and environmental policies: a case study for Shanghai, period1995–2020. Ecological Economics 39, 257–270.
Guo, H.C., Liu, L., Huang, G.H., Fuller, G.A., Zou, R., Yin, Y.Y., 2001. A system dynamicsapproach for regional environmental planning and management: a study forLake Erhai Basin. Journal of Environmental Management 61, 93–111.
Hadley, S.W., Short, W., 2001. Electricity sector analysis in the clean energy futuresstudy. Energy Policy 29, 1285–1298.
Isee System, 2006. Technical Document for the iThink and STELLA Software. Avail-able at: http://www.iseesystems.com
Kanudia, A., Loulou, R., 1998. Robust responses to climate change via stochasticMARKAL: the case of Québec. European Journal of Operational Research 106,15–30.
Kunsch, P., Springael, P., 2008. Simulation with system dynamics and fuzzy reason-ing of a tax policy to reduce CO2 emissions in the residential sector. EuropeanJournal of Operational Research 185, 1285–1299.
Lei, K.P., Wang, Z.S., 2008. Emergy synthesis and simulation for Macao. Energy 33,613–625.
Li, L., Chen, C.H., Xie, S.C., Huang, C., Cheng, Z., Wang, H.L., Wang, Y.J., Huang, H.Y.,Lu, J., Dhakal, S., 2010a. Energy demand and carbon emissions under differentdevelopment scenarios for Shanghai, China. Energy Policy 38, 4797–4807.
Li, Z., Tong, L.Z., Sun, J., 2010b. Analysis of energy consumption in Beijing. China’sForeign Trade 1, 58–61.
Lin, J.Y., Cao, B., Cui, S.H., Wang, W., Bai, X.M., 2010. Evaluating the effectiveness ofurban energy conservation and GHG mitigation measures: the case of Xiamencity, China. Energy Policy 38, 5123–5132.
Liu, G.Y., Yang, Z.F., Chen, B., Zhang, L.X., 2011. Emergy-based multiple spatial scale
analysis framework combining resources and emissions impact for urban eco-logical economic evaluation. Entropy 13, 720–743.Liu, Y., Huang, G.H., Cai, Y.P., Cheng, G.H., Niu, Y.T., An, K., 2009. Development of aninexact optimization model for coupled coal and power management in NorthChina. Energy Policy 37 (11), 4345–4363.

5 l Mod
L
M
N
N
P
Q
R
S
S
S
2 Y.Y. Feng et al. / Ecologica
u, C.Y., Zhang, X.L., He, J.K., 2010. A CGE analysis to study the impacts of energyinvestment on economic growth and carbon dioxide emission: a case of ShaanxiProvince in western China. Energy 35, 4319–4327.
irasgedis, S., Sarafidis, Y., Georgopoulou, E., Kotroni, V., Lagouvardos, K., Lalas, D.P.,2007. Modeling framework for estimating impacts of climate change on electric-ity demand at regional level: case of Greece. Energy Conversion & Management48 (15), 1737–1750.
aill, R., 1992. A system dynamics model for national energy policy planning. SystemDynamics Review 8, 1–19.
BS (National Bureau of Statistics), 2011. China Statistical Yearbook 2011. ChinaStatistics Press, Beijing.
hdungsilp, A., 2010. Integrated energy and carbon modeling with a decision supportsystem: policy scenarios for low-carbon city development in Bangkok. EnergyPolicy 38, 4808–4817.
udrat-Ullah, H., 2005. MDESRAP: a model for understanding the dynamics of elec-tricity supply, resources, and pollution. International Journal of Global EnergyIssue 23, 1–14.
ehan, R., Knight, M.A., Haas, C.T., Unger, A.J.A., 2011. Application of system dynamicsfor developing financially self-sustaining management policies for water andwastewater systems. Water Research 45, 4737–4750.
aysel, A.K., Barlas, Y., 2001. A dynamic model of salinization on irrigated lands.Ecological Modeling 139, 177–199.
tave, K.A., 2003. A system dynamics model to facilitate public understanding ofwater management options in Las Vegas, Nevada. Journal of EnvironmentalManagement 67, 303–313.
tella® , High Performance System, Inc., USA. Available at: http://www.hps-inc.com/stellavpsr.htm
elling 252 (2013) 44– 52
Suryani, E., Chou, S.Y., Chen, C.H., 2010. Air passenger demand forecasting andpassenger terminal capacity expansion: a system dynamics framework. ExpertSystems with Applications 37, 2324–2339.
Turton, H., 2008. ECLIPSE: an integrated energy-economy model for climate policyand scenario analysis. Energy 33, 1754–1769.
Vensim® , Ventana System, Inc. Available at: http://www.vensim.comVera, I., Langlois, L., 2007. Energy indicators for sustainable development. Energy 32,
875–882.World Energy Outlook, 2008. International Energy Agency. Head of Communication
and Information Office, France.Xu, Y., Masui, T., 2009. Local air pollutant emission reduction and ancillary car-
bon benefits of SO2 control policies: application of AIM/CGE model to China.European Journal of Operational Research 198, 315–325.
Yuan, X.H., Ji, X., Chen, H., Chen, B., Chen, G.Q., 2008. Urban dynamics and multiple-objective programming: a case study of Beijing. Communications in NonlinearScience and Numerical Simulation 13, 1998–2017.
Zhang, L.X., Feng, Y.Y., Chen, B., 2011a. Alternative scenarios for the development ofa low-carbon city: a case study of Beijing, China. Energies 4, 2295–2310.
Zhang, L.X., Hu, Q.H., 2011. A critical review on material and energetic metabolismfor urban ecosystem: resource metabolism and its contents. Journal of NaturalResources 26, 1801–1810 (in Chinese).
Zhang, L.X., Yang, Z.F., Liang, J., Cai, Y.P., 2011b. Spatial variation and distribution of
urban energy consumptions from cities in China. Energies 4, 26–38.Zhao, W., Ren, H., Rotter, V.S., 2011. A system dynamics model for evaluat-ing the alternative of type in construction and demolition waste recyclingcenter—The case of Chongqing, China. Resources. Conservation and Recycling 55,933–944.