Embed Size (px)
Citation preview

AO-ACO? 31b GENERAL ELECTRIC CO LYNN MA AIRCRAFT ENGINE GROUP F/G 91/5DIASNObIC AND CONDITION MONITORING SYSTEM ASSESSMENT FOR ARMY -ETCIU)OCT 80 H J JORDAN DAAKSI79-C-O020
UCLASSIFIED RSOAE0058 NImhmmmmimhhuEllllllllEEEEIIEIIIIIIIIEEI
EEEE-IIIEEIIIE/IllEE/I/Ill/IElllllllllllu-

11ONt11)W ll0 1AIN)Il.A
AD
A-oft
LEV tDIAGNOSTIC £ CONDITION MONITORING SYSTEM ASSESSMENT FORARMY HELICOPTER MODULAR TURBOSHAFT ENGINES.
Harold J. Jord n
General Electric Company
i Aircraft Engine Group1000 Western Avenue
I Lynn. Mass. 01901
October 1980
Final Report for Period June 1979 - June 1980
DTICELECTE
Prepared forD
APPLIED TECHNOLOGY LABORATORY
* .S. ARMY RESEARCH AND TECHNOLOGY LABORATORIES (AVRADCOM)
ort Eustis. VA, 23604
FmKSA ,'A m 8111 16 046
/ . .0,,,, Im, ,110 i, sww,,II meDibuttg Ui~

,CruMI I Y LLAb,)IFILAIlUN OF THIS PAGE (When Date Entered)
S" yr*, DOCU ¢"'TATION PAGE READ INSTRUCTIONS- -"EFORE COMPLETING FORM
i. REPORT NUMBER 1 . 2. GOVT ACCESSION NO. 3. RE9I,4NT'S CATALOG NUMBER
4. TITLE (and Subt.itiei -Diagnostic and Condition PERIOD COVERED
Monitoring System Assessment for Army Helicopter in 9J 8M odular Turboshaft Engines "'-7 i - 9- " Jun UW 8
7. AUTHORs; , CONTRAC-"A#+1r NUMBER(-)
Harold J. Jordan DAAK51- C
9 PERFORMING ORGANIZATION NAME AND ADDRESS 10 PROGRAM ELEMENT. PROJECT. TASK
General Electric Company, Aircraft Engine Group A-N
1000 Western AvenueLynn, Massachusetts 01910
1. CONTROLLING OFFICE NAME AND ADDRESS 1"- 2 i T DATE
Applied Technology Laboratory Octobow"8(U. S. Army Research & Technology Laboratories 13. NUMBER OF PAGES
Fort Eustis, Virginia 23604 (AVRADCOM) 15214 MONITORING AGENCY NAME & ADORESS(if dilferent fron Contr)lling Office) Ii. SECURITY CLASS. (of this report)
UnclassifiedIS.. DECLASSIFICATION DOWNGRADING
SCHEDULE
16 DISTRIBUTION STATEMENT (of thi, Report)
DISTRIBUTION STATEMENT AApproved for public release;
Distribution Unlimited
17 DISTRIBUTION STATEMENT ,of the abstract entered in 13,),ck 20, if different Iron, Report)
18 SUPPLEMENTARY NOTES
19 W.EY WORDS (Continue on reverse side if necesserv and identify tv block n, nmberi
Diagnostic and Condition Monitoring (D&CM), Modular Design, Control System AnalyzerChip Detector, Modular Engine Test System (METS), Line Replacable Unit (LRU), LowCycle Fatigue Counter, T700 Engine Aviation Intermediate Maintenance (AVI), Avia-tion Unit Maintenance (AVUM).
2 o ABSTRACT 'Contine on reverse side It npree.sar and idrnt,iY b block number) Needs for and means of improv-ing D&CM and troubleshooting to modules and LRUs for T 700-GE-700 engine in Armyenvironment were studied. Recommendations are: (1) Do not modify existing METS formodular fault isolation. However, do computerize the acquisition of the overall engineperformance data, (2) introduce the slave chip detector to the depot, (3) expand evaluationof the control system analyzer by Black Hawk companies, (4) support the development ofdegaussing chip detector, (5) initiate Phase I of multipurpose airborne D&CM systemwhich combines performance, life, overtemp and chip detector monitors, and (6) continueto acquire T700 field data and develop a method to quantify D&CM payoffs such as better
DD I J 1473 EDN OF I NOV 65 IS OBSOLETE nlsi- -lDD/2SECURITY Unclassified I 'n t-1/2 SECU RTY CLASSIFICATION OF THIS PAGE .. !h etn ate F~ntered '

TABLE OF CONTENTS
Page
LIST OF ILLUSTRATIONS ............................. 5
LIST OF TABLES ................................... 7
INTRODUCTION AND SUMMARY ........................ 9
TASK I - D&CM APPROACH IDENTIFICATION AND ANALYSIS .... 14Field Event Analysis and D&CM Approach Methodology ....... 14Field Event Analysis Findings and Discussion ................ 15D&CM Approach - Summary and Description of Candidate
Item s ....................................... 27Estimated Impact of D&CM Approach on Existing Maintenance
Philosophy ................................... 29D&CM Impact of Tasks Performed at AVIM Utilizing the
Modular Engine Test Systems ...................... 31
TASK 1I - D&CM SYSTEM DEFINITION .................... 32Modified METS for Modular Performance Fault Isolation (MPFI). 33Standard METS with Computerized Overall Performance
Measurement .................................. 34Slave Chip Detectors .............................. 35Control System Analyzer Set ........................ 41Multipurpose Airborne D&CM System .................. 48Degaussing Discriminating Chip Detector ................... 60
TASK III - LIFE CYCLE COST (LCC) ASSESSMENT ............ 78Introduction .................................... 78LCC Analysis of Modified METS for MPFI .................. 82Operation and Support .............................. 91LCC Analysis of Slave Chip Detectors for T700 Oil-Wetted
Part Fault Isolation ............................. 95LCC Analysis of Control System Analyzer Set ............... 102LCC Analysis of Multipurpose Airborne D&CM Systems ...... 113LCC Assessment of Automatic Performance Monitor ........ 115LCC Analysis for a Degaussing-Type Discriminating Chip
Detector ..................................... 125LCC Analysis for the Engine Life Usage Monitor (ELUM) ..... 131LCC Analysis for the Overtemperature Monitor ............. 134
-3 -

TABLE OF CONTENTS - Continued
TASK IV - D&CM HARDWARE DEVELOPMENT REQUIREMENTS .. 138Modified METS for Modular Performance Fault Isolation ...... 138Computer for Standard METS Overall Engine Performance . . . . 138Slave Chip Detectors ............................. 138Control System Analyzer (CSA) ...................... 139Multipurpose Airborne D&CM (MADACM) System ........... 139Degaussing Chip Detector Development .................... 145
Follow-On D&CM Analysis ...................... ... . 146
CONCLUSIONS ..................................... 147
RECOMMENDATIONS ................................ 149
LIST OF ABBREVIATIONS ............................. 151
Accessinn For
NTT,-
l Unanili,.nced V
Justif 4cation--
ilt.ibtion/L e
Availability Codes
Dist Special DTICS EL ECTE
__ __ __ __ _NOV1718
D
4-

LIST OF ILLUSTRATIONS
Figure
1 D&CM Approach Logic ...................... 162 Lubrication System Schematic .................... 363 Transistorized Chip Detector Assembly ........... 394 Engine Chip Detector ...... ...................... 425 T700 Electrical Control Unit (ECU) Sstems
Tester ............................... 446 T700 Engine Harness and Sensor Circuit Tester 457 Diagnostic and Condition Monitoring System
Configuration I - Engine Mounted Hardware ...... 508 Diagnostic and Condition Monitoring System
Configuration 2 - Airframe Mounted Hardware ..... 519 Diagnostic and Condition Monitoring System
Configuration 3 - Airframe Computer, EngineMemory .............................. 52
10 Multipurpose Airborne Diagnostic and ConditionMonitoring (MADACM) System Block Diagram ..... 56
11 D&CM Electronic Airborne Module ................ 5712 Removable Memory Module ...................... 5813 Cockpit Display Module ..................... 6014 Typical Cockpit Readout - MADACM Display
M odule .............................. 6215 Magnetic Particle Detector Assembly .............. 6916 Electronic Module Packaging Concept - Prototype .... 7017 Electronic Module for Lube Oil Magnetic Particle
Detection System - Block Diagram ............... 7118 Electronic Module Schematic .................... 7219 Electronic Module Production Package -
Configuration I .......................... 7320 Magnetic Particle Detection System Electrical
Interface Diagram ....................... 7421 Magnetic Particle Detector 7622 Life Cycle (Cost Savings)/(Cost) Ratio Definition .... 79
23 T700-GE-700 Predicted All-Cause Shop Visit Rate(SVR) and Engine Hours per Year ............. 81
24 Logic Flow Chart for Effectiveness Analysis ofModified METS for Modular PerformanceFault Isolation .......................... 83
-5 -

LIST OF ILLUSTRATIONS - Continued
FigurePage
25 AVUM Troubleshooting Procedure 39 - ElectricalChip Detector Light (No Contamination Found) ..... 97
26 AVIM Troubleshooting Procedure 27 - ElectricalChip Detector Light (No Contamination Found) ..... 98
27 T700-GE-700/UH-60A Nuisance Chip Signal Trends • 12728 Above Ground Idle Engine Overtemperature
Removal Limits ......................... 13529 Starts and Shutdown Engine Overtemperature
Removal Limits ......................... 13630 Development Multipurpose Airborne D&CM
Schedule - Phase I ................. ..... 14131 Development Multipurpose Airborne D&CM
Schedule - Phase I ...................... 14232 Development Multipurpose Airborne D&C M
Schedule - Phase I ...................... 14333 Development Degaussing Chip Detector ............. 144
- 6 -

LIST OF TABLES
Table Page
1 D&CM System Candidate Items - Task I Findings ....... 10
2 D&CM Life Cycle Cost Results ................. 123 T700 Component Failure Analysis - 15, 000 Actual
Engine Operating Hours - All-Caut , Predictedversus Actual ............................ 17
4 Predicted and Actual Failure Rate Correlation ....... 185 T700 Field Event History (May 1977 - April 1979) -
15, 000 Engine Hours - All-Cause Field FailureSymptom and Consequence Analysis ............... 20
6 T700 Field Event History (May 1977 - April 1979) -15, 000 Engine Hours - All-Cause Field FailureSymptom and Affected Component Analysis .......... 21
7 Predicted All-Cause T700 Field Event Symptoms -15, 000 Engine Hours ....................... 22
8 T700 Diagnostic Needs Based on Predicted T700Failure Symptoms ......................... 23
9 Modular Engine Test Systems Test Status ............. 25
10 D& CM Approach - Candidate D&C M ImprovementItem s ................................ 27
11 H1ow Candidate D&CM Functions are Accomplished .... 32
12 10-Year Predicted Engine Hours and Shop Visits(All-Causes) ............................ 80
13 TL700 METS Modular Performance Fault Isolation(MPFI) - Time Line Analysis in Hours ............. 85
14 T700 METS Modular Performance Fault Isolation(MPFI) - 10-Year Operating Cost and SupportCost Analysis ........................... 87
15 Component Characterization Utilized in CostEffectiveness Study for Control System Tester ....... 104
16 Engine 'rests Required After LRU Replacement -False LRU Removals Only ................... 106
17 Life Cycle Cost Summary for '[700 Control SystemAnalyzer Set - Predicted Savings .................. 106
- -

LIST OF TCABLES - Continued
Table Page
18 Control System Analyzer (Option 1) - Cost and Results 10919 Control System Analyzer (Option 2) - Cost and Results 11120 Control System Analyzer (Option 3) - Cost and Results 11221 Operational Health Indicator Test - Current Procedure. 11622 Maximum Power Check - Current lPrcedure ......... 11623 Baseline Health Indicator Test - Current Procedure .... 11724 Nuisance Signal Maintenance Checks ................ 125

INTRODUCTION AND SUMMARY
The introduction of the TT00-GE-700 Engine into operational Army units is the
beginning of a new era in Army Aviation. These engines are a highly maintainable,modular design which provides the Army with a rapid repair and return to servicecapability. To fully realize this capability, the U. S. Army Advanced TechnologyLaboratories (ATL) of the Aviation Research and Development Command (AVRAD-
COM), has contracted with the General Electric Company to investigate and pro-vide an assessment of a diagnostic and condition moaitoring (D&CM) system for
Army modular turboshaft engines. This report documents the methodology andresults of the studies and analysis carried out under Contract DAAK1-C-79-0020.Prior D&CM analyses performed for ATL (AVRADCOM) under contract DAAJ02-77-C-0065 and for the NAVAIR T700-GE-401 LAMPS application under contractN00019-77-C-0065 provided valuable background data and experience which wasutilized in this program. The contracted effort was conducted utilizing severalorganizations within General Electric and provides recommendations for furtherdevelopment. These recommendations are supported by the affected organiza-
tions within General Electric's Aircraft Engine Group (AEG) and Aerospace In-
strument and Electrical Systems Department.
SUMMARY
A four-task analysis was conducted to assess the needs for and means of achieving
improved D&CM capabilities for modular Army turboshaft engines. Primary em-
phasis was placed on the D&CM impact on maintenance at the Aviation Unit Maint-
enance (AVUM) and the Aviation Intermediate Maintenance (AVIM) levels using the
modular engine test system (METS). The T700-GE-700 engine for the UH-60Aand the UH-64 aircraft was used as an example of a modern modular turboshaftengine. The four tasks performed in numerical sequence as shown in the following
paragraphs provided a simple, logical technique for assessing Army D&CM needs.
Task I - D&CM Approach Identification
This task selected candidate D&CM functions based primarily on analysis of T700
engine maintenance event history of Black Hawk and UH-64 Advance Assault Hel-
icopter (AAH) flight test aircraft as documented by General Electric Field Service
Reports, DV-7.
t- -

Iask I - D&CM System Definition
This task defined in some detail, the hardware, software and/or diagnostic tech-niques to implement the candidate functions selected in Task I and provided thedata needed for life cycle cost (LCC) analysis.
Task I - Life Cycle Cost (LCC) Assessment
In this task, life cycle cost analyses were performed on the candidate D&CM itemsas the criteria to determine which items were to be recommended for development.
Task lV - D&CM Hardware Development Requirements
The hardware and software development programs to implement the recommendedD&CM systems are described in Task IV including program description, approx-imate schedule, and assessment of technical risks.
The following paragraphs contain a brief summary of the results of each task:
Task I Results - Candidate Functions
Seven D&CM functions were identified in the Task I analysis as candidate aids toimprove T700 module and line replaceable unit (LRU) fault detection and isolation.The proposed D&CM approaches to performing these functions consisted of threeground support systems and four airframe mounted systems as shown in Table 1.
TABLE 1, D&CM SYSTEM CANDIDATE ITEMS - TASK I FINDINGS
GROUND SUPPORT FUNCTIONS GROUND SUPPORT EQUIPMENT
1. Modular Performance Fault Isolation. Modified METS for Gas Path Analysis.
2. Modular Oil-Wetted Parts Fault Slave Chip Detector for METS.Isolation.
3. Control LRU Fault Isolation. Control System Analyzer Set.
AIRBORNE FUNCTIONS AIRBORNE EQUIPMENT
4. Computerize Engine Performance Automatic Performance Monitor.Measurement.
5. Life Usage Measurement and Re- Engine Life Usage Monitor (ELUM).cording.
6. Discriminating Chip Detection. Degaussing Chip Detector System.
7. Overtemperature Caution. Overtemperature Monitor.
- 10 -
.. .' - - .. . & . . . . -. . .. . - - - -i $iii. . . .. .. . . ., . . .. . ... i . .. . -

Task II Results - D&CM System Definition
Three ground support systems, one unique sensor, and one airborne computer
and display system were defined in Task II to meet the functional needs identified
in Task I. This equipment is briefly described in the following paragraphs.
A modified modular engine test system (METS) for performing gas path analysisto isolate performance problems to the faulty module was defined including mod-
ifications to the six existing METS. This included computer hardware and soft-ware, main and inlet particle separator air flow m asurement, added instrument-ation, and structural changes.
A slave chip detector system to determine the source of oil-wetted part failure
debris by testing on METS was defined. The system currently being used success-fully in the contractor's test cells was described and recommended to meet thisneed.
A control system analyser set to isolate the most commonly reported faults toLRU or aircraft system was defined. 'This is a ground support equipment set con-sisting of tvo "yellow boxes" for flight line use that can troubleshoot the system
without the engine operating. One set which is currently undergoing field tests,
has proven to be almost completely effective in isolating faults.
A multipurpose airborne 1)&CM system (MADACMS) was defined consisting of asix-pound central processor and memory unit and one-pound alphanumeric cockpitdisplay that wxould meet all four primary airborne needs for two engines with the
capability of performing additional aircraft and engine functions, Human factorsconsiderations dictate highly visible dichroic LCD display, nonambiguous mes-sages, and simple call-up control.
A degaussing discriminating magnetic c~ip detector having capture, count, and
release capability by means of a built-in degaussing coil is described. Its purposeis to eliminate nuisance chip signals. D)iscriminating logic would be included inthe MADACA\s computer. Such a system is currently in the feasibility demon-
stration stage at GE.
Task I Results - LCC Assessment
Life cycle cost analyses were performed to evaluate each of the seven D&CMfunctions based on a ten-year Black Hawk projected service period from 1982 to1992 with 5 million engine flight operating hours. The LCC analytical process
provides an input for management decisions and is especially helpful in assessingthe relative values of each D&CM function. There are, however, other extremelyimportant aspects to the decision process that the contractor is currently unable
-- II
"ll" 1 -- - II ... .... . . .. . . .. . . .

Io quWL1Ai; t. g. the beitunts of increased aircraft availability, timely fault iso-
lation, rapid repair and return to flight status in hostile environment, and safety.
The quantitative results expressed as the ratio of cost savings to cost (CS/C) are
shown on Table 2, are, therefore, very conservative. On this conservative basis,
a CS/C ratio of 1. 5/1 for a ten-year period was considered to be a favorable re-
sult. For the ten-year period used in the analyses, a CS/C ratio of 1. A/1 was
considered to be a favorable result with CS/C ratios of 1. 0-1. 5/1 to be a gray
area wherein management decisions could be determined by evaluation of the
unquantifiable factors involved.
TABLE 2. D&CM LIFE CYCLE COST RESULTS
D& CM SYSTEM CS/C*
Modified METS for MPFI 0.49
Slave Chip Detectors 1.(;9
Control System Analyser - Option 2 1. (;1
Multipurpose Airborne D& CM System 1.57
Automatic Performance Monitor 1.36
Option I
Degaussing Chip Detector 3. 60
Engine Life Usage Moitor (ELT.M) 1.89
Overtemperature Monitor (OTM) N/A
* Lcost Saving's]/[Cost (Development v Acquisition Operation and Support)]
General Electric, on the basis of this D&CM program assessment, makes the
following recommendations:
1. Add a computer to each of the six existing METS facilities for the pur-
posu of obtaining overall engine performance. Do not modify METS to
perform modular performance fajit isolation by gas path analysis.
2. Equip METS with slave chip detectors for T700 oil-wetted part modular
fault isolation.
-12-

3. Complete the field evaluation of the control system analyser and type-classify for Black Ilawk and SOTAS deployment. Deployment to be theArmy' s choice; either one set per Battalion (Operation 3) or one sen-sor and circuit tester per Company, and one ECU tester per AVIM(Option 2).
4. Design, build, and evaluate by flight test the Multipurpose AirborneD& CM System (MADACMS).
Task IV Results - D&CM Hardware Development Qequirement
General Electric Company recommends the following D&CM hardware develop-ment work based on the findings of this D&CM assessment program:
1. Modular Engine Test System. It. is expected that the General Electric
developed software would be provided by ATL to the successful bidderfor a subsequent computer contract. This would allow for more tasksand capacity in the resultant computer.
2. Slave Chip Detector. No development required. Generd Electric
Will propose kit procurement to the proper AVRADCOM branch.The kits will identify the indicating magnetic chip detectors to fitT700 scavenge pumI) ports.
3. Control Sy'stem Arnalyser Set. No further development is required
for the control system analyser set. Procure enough sets to supportan Army type-clasbification program, iitiate program to incorp-
orate Operation and ,Maitenance Manu d changes.
4. .Multipurpose Airbot-ne j&C.\ S\.sti: . l)csign and develop flightworthy
brassboard computer and displa\ )(lule h;ardv are and softwrare for
the Multipurpose Airborne D&CM System. Build three sets for flight
test evaluation. Develop and qualify the degaussing chip detector aspart of the MADACM System.
5. Support hardware development wt h to,1(,\-on I)&C. I analYsis includingthe following:
a. T700 production Cngine Iield evIt Aalvsis - 15, 00) hours.
b. Develop methodology to evaluate the cItects of timel. fault isola-
tion :and the repair and return to flight status ol the LCC, consider-ing aircraft availability and aireraft saluty.
c. Modify LCC model, if practical, utilizing up-dated Failure Modes,Effects, and Criticality Analysis ("MI-CA) and production enginefield history.
d. hlefintu '700 Automatic Performance M,,nitor LCC and perform Over-temnpuraturc Monitor I,(.C \nalysis.
- 13 -

"IASK I - LDCAI AP1PROACIH [DENTIFICA'ION AND ANALYSIS
This section documents the analysis of Black Hawk T700-GE-700 engine field ser-vice history for the purpose of identifying promising areas for improvement ofT700 engine condition monitoring, LRU, and modular fault detection and isolation.Candidate D&CM techniques and/or equipment to implement the improved diag-nostics and condition monitoring will be recommended if justified by life cyclecost analyses or other payoff considerations. The impact on current maintenancephilosophy and oil the tasks of the Aviation Unit Maintenance (AV NI) and modularengine test system (METS) are also assessed. A fi(:d event an, sis of theT700-GE-700 engine covering the first 11,000 engine hours of black Hawk andAAH flight testing from October 1974 to June 1977 was performed under ContractDAAJ02-77-C-0065, and reported in Report Number USARTi :'R-78-32. Thepresent report covers the analyses of the next 15, 000 engine ,urs of T700 flighttest data as documented in General Electric Field Service Reports (DV-7) cov-ering the period June 1977 to April 1979.
FIELD EVEN'T, ANALYSIS ,VND D&CM [APPROACII METIIODOLOGY
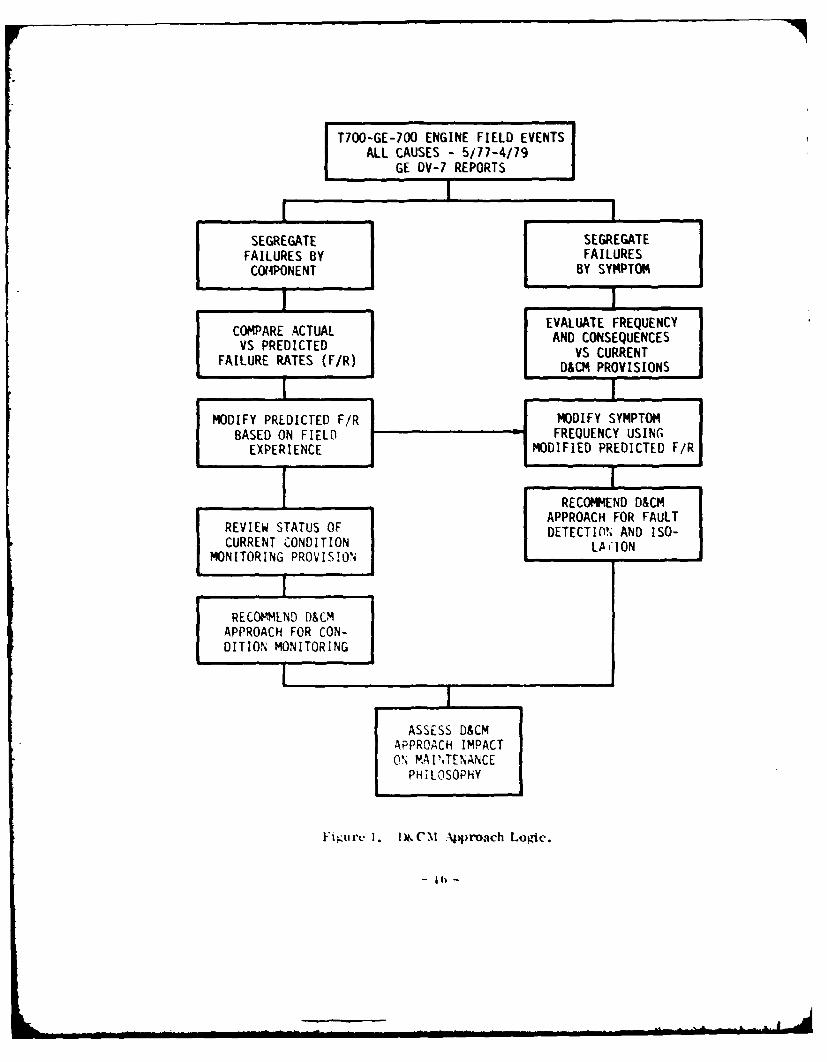
The procedure used to arrive at the candidate D&CM approach is shown in Figure 1.A brief description of the procedure follows:
1. Reviewed approx.lmately 500 DV-7s to eliminate all convenience re-movals, special engineering checks, and other nonfailure eventrecords. One hundred twenty-eight recorded events remained re-presenting all-cause maintenance actions to correct reported ral-functions or failures.
2. Segregated failures by component (Table 3).
3. Compared actual component failure rates with predicted rates.Reviewed the failure rates with T700 design engineering to discountthose failures for which design fixes have been introduced (Table 4).
4. Revised predicted failure rates (Table 3).
5 T Tabulated actual failures bV sympl)toms and consequence (Table 5)wuid by affected component (Table 6).
6. Adjusted actual failure symptom rates from Table 6 to be compatiblewith revised predicted component failure rates (Table 3) to produceTable 7.
7. Constructed diagnostic needs tabulation based on predicted symptomfrequency (Table 7) to make Table 8.
6. Defined l)& CM aliproach.
- 1,4 -

FIELD EVENT ANALYSIS FINDINGS AND DISCUSSION
The results of the field event analysis covering all T700-GE-700 engine flight testexperience between June 1977 and April 1979 (15, 000 engine hours) are listed in'Fables 3 through 8.
Following the methodology described above and shown in Figure 1, the actualcomponent field failures were analyzed by T700 design engineering and comparedwith the original predicted rates to determine if any changes to current predic-tions should be made. Two changes were made as noted by the asterisk itemsin Table 3. Only one change was significant, lub( Al debris. This field event,
the occurrence of nuisance chip detector signals ( lusing maintenance actions, wasadded as a conditional item and estimated at five events per 15, 000 engine hours.Then, using Table 6, which defines the components causing the actual fieldevents, the number of component failures were reduced to be consistent with thepredicted component failure rates. The result of this process is Table 7.
Analysis of the actual and predicted field event data resulting in the major findingsare summarized in the following paragraphs and from which the recommendedD&CM approach was derived:
Inspection Finds
Maintenance action items detected by visual inspection (see Tables 5 through 7) asinspection finds, premature oil filter popouts, oil leaks, and erroneous enginehistory recorder display, comprised 26 to 38 percent of all field events. Fre-quent visual inspection is and will continue to be an important D& CM function thatis not likely to be supplanted by electronic aids.
Nuisance Chip Signals
Nuisance chip signals as shown in Table 5 were the predominant cause of missionaborts, with 12 of 19 engine caused mission aborts (63,') caused by nuisance chipsignals. Some of the other nuisance chip signals (there were 27 in all) may havecaused ground mission aborts, however, the available data does not specify.This field data makes a strong case for a discriminating chip detector that wouldallow the flight crew to distinguish between benign and failure debris. It shouldbe analyzed for cost effectiveness.
Control Problems
Nineteen control system problems such as torque splits, speed oscillations, lowand erratic T4 . 5 indications and other sympltoms of control anomalies listed inTable 6 were detected and reported accurately by flight crews aided by cockpit
-15-
T700-GE-700 ENGINE FIELD EVENTSALL CAUSES -5/77-4/79
GE DV-7 REPORTS
SEGREGATE SEGREGATEFAILURES BY FAILURESC4PONENT BY SYPTOM
EVALUATE FREQUENCYC PAREDCTED AND CONSEQUENCESFL RATE VS CURRENT
FAILURE RATES (FIR) D&CM PROVISIONS
BASED ON FIELD REFREQUENCY USINGEXPERIENCE MODIFIED PREDICTED F/R
RECO"I4END D&CME U APPROACH FOR FAULT
CURRENT CONDITION DETECTION AND ISO-
MONITORING PROVIS!ON 1A 'ION
I
RECOMNEND D&CMAPPROACH FOR CON-DITION MONITORING
ASSESS D&CMAPPROACH IMPACT0% MAINTENANCE
PHILOSOPHY
Figurc 1. IC.I ,p )roach Loijc.
- jib -

TABLE 3. T700 COMPONENT FAILURE ANALYSIS -
15, 000 ENGINE OPERATING HOURSALL-CAUSE PREDICTED VERSUS ACTUAL
Failures per 15, 000 Engine Operating Hours(EOH), All-Causes Discovered at AVUM
Original RevisedPredicted Actual Predicted
Control and Fuel SystemElectronic Control Unit (ECU) 5 10 5Hydromechanical Unit (HMU) 6 9 6Sequence Valve 3 5 3Fuel Boost Pump 2 5 2Primer Nozzles 0 3 0Fuel Filter Assembly 2 1 2Anti-Icing and Starting Bleed 2 1 2
Valve
Oil-Wetted Parts (OWP)Lube Filter Bypass Button 1 14 3*No. 3 Bearing Labyrinth Seal 0 4 0C-Sump Cover 0 3 0Power Take-off Drive 0 3 3Chip Detector 0 2 0Lube and Scavenge Pump 2 2 2No. 1 Bearing 1 1 1No. 3 Bearing 1 1 1No. 4 Bearing 1 1 1Radial Drive Shaft 1 1 1Accessory Gear Box 2 1 1
ElectricalHistory Recorder 0 7 1*Electrical flarnesses 1 7 1Thermocouple fHarness 2 6 2Ignition Leads 1 3 1Igniter 1 2 1Exciter I I I
*Revised based on field experience
-17 -

TABLE 3. - Continued
Failures per 15, 000 Engine Operating Hours{EO, All-Causes Discovered at AVUMOriginal RevisedPredicted Actual Predicted
External ConfigurationSeparator Blower 2 2 2Fuel Lines 1 1 1Air Lines 1 1 1Mounting Brackets 2 2 2
CompressorVariable Geometry Linkage 1 1 1Compressor Rotor Assembly 0 1 0
TOTALS 42 101 44
Lube Oil Debris 0 27 5
TABLE 4. PREDICTED AND ACTUAL FAILURE RATE C(IRELATION
ECU - Of the 10 actual failures, 3 are considered to have been fixedthrough redesign and three others were on developmental prototype units.The remaining 4 failures do not indicate that an adjustment il the pre-dicted failure rate of 5 is warranted.
HMU - Of the 9 actual failures, 3 have been fixed through redesign. Theremaining six actual failures equals the predicted failures, therefore, nochange to the predicted failure rate is indicated.
Sequence Valve - Four of the 5 actual failures were associated with con-tamination. Redesign to reduce sensitivity to contaminate should reducethe actual failure rate to the predicted 3.
Fuel Boost Pu1ip - Four of the 5 actual failures were with helicoils. Thisquality problem will be climinated reducing the actual failure rate to thepredicted 2.
18-

TABLE 4. - Continued
Primer Nozzles - The mode of the 3 actual failures was clogging. Redesign
is expected to eliminate this problem reducing the actual failure rate to thepredicted failure rate of zero.
Lube Filter Bypass Button - Improved manufacturing methods and increased
capacity should reduce the actual failures from 14. It is predicted that thefailure rate will be 3 per 15, 000 engine operating hours (EOH).
No. 3 Bearing Labyrinth Seal - Current redesig, efforts will eliminatethis problem. Predicted failure rate will remain at zero per 15. 000 EOH.
Thermocouple Harness - Only 1 of the 6 failures was associat,-d withconnectors. The other 5 wvere quality problems that are expected to bereduced substantially; therefore, the predicted failure rate of 2 per 15, 000EOH seems appropriate.
Lube Oil Debris - Based on recent field experience the predicted ratefor failures of this type will be assumed to be reduced to 20 per 15, 000EOII.
C-Sump Cover - These quality probleans. missing retaining bolts andO-ring problems, wvill be climinated reducing the actual failure rate tothe predicted.
PTO Drive - These 3 failures are associated with a loosening of the PTOassenPly on the front frame mounting pads. It is expected that thisproblem will be eliminated; therefore, the original predicted failure ratefor this part should be maintained.
History Recorder - Of thu 7 actual failures, 5 have been eliminatedthrough redesign. (A the other 2, one was a broken window, the otherwas a broken mount. Based on evidence of susceptibility to mishandlingdamage, the predicted failure rate will be increased to one per 15, 000EOII.
Electrical ttarnesses - Five of the 7 actual failures were associatedwith connectors (bent pins, contamination, and looseness). New scoop-proof connector design should eliminate these types of failures; there-fore, the present predicted failure rate of one per 15, 000 EOII will bemaintained.
-1 19 -

TABLLE 5. '1'700 FIELD EVENT HISTORY (MAY 1977 - APRIL 1979) -15,000 ENGINE HOURS
ALL-CAUSE FIELD FAILURE SYMI'T'OM AND CONSEQUENCE ANALYSIS
Consequence
Unsched- Unsched- Unsched-uled En- uled Corn- uled Maint-
Mission gine ponent enanceFrequency Symptom Abort Removal Removal Action
27 Nuisance Chip Signals 12 - - 2721 Inspection Finds - 21 -14 Premature Oil Filter
Popouts - 1411 Miscellaneous Control
Anomalies 11 -
8 Starting Problems 8 -
7 Erroneous EngineHistory RecorderDisplay 7
7 Oil Leaks - -
5 T4.5 Overtemp-eratures 2 4 1 -
5 Stalls 3 5 - -
4 Torque Splits - - 4 -4 Ng Oscillations - - 4 -4 Low Performance - 1 3 -4 Flameouts During
Overspeed Checks - - 4 -3 Bearing Failures 2 3 - -4 Miscellaneous - - 4 -
128 TOTAL
- 20 -

TABLE 6. '1700 FIELI) EVENT H1ISTORY (MAY 1977 - APRIL 1979) -
15, 000 ENGINE HOURSALL-CAUSE FIELI) FAILURE SYMPTOM AND AFFECTED
COMPONENT ANALYSIS
Trouble-shooting Module Actual
Frequency Symptoms Procedures Affected Components Affected
27 Nuisance Chip Sigmils Yes None Chip Detector
21 Inspection Finds No n. ,e Miscellaneous Exter-nal Components
14 Premature Oil Filter No None Oil FilterPopouts
11 Miscellaneaus Control Yes None HydromechanicalAnomalies Unit (HMU), Alter-
nator Stator, 3 Yel-low (Y) Harnesses,2 Electrical ControlUnits (ECU), 4 T4 . 5
Harnesses
b Startinp Problems XVes None Igniter, ScquenceValve, Primer Man-ifold, 3 IIMU, 2Primer Nozzles
7 Erroneous Engine History No None Engie History Re-Recorder Display corder
7 Oil Leaks Yes Cold Axis-G Seal, 2 SumpSection Covers, 2 Chip De-
tectors, 2 Postnasal
Drip
5 T4.5 Overtemperature Yes Cold Compressor Spacer,Section No. 4 Bearing ECU,
2 X-Bleed Valves
5 Stdls Yes Cold 2 Power Takeoff,Section Compressor Spacer,
No. 4 Bearing,Diffuser
-21-

TABLE 6. - Continued
Troubl e-shooting Module Actual
Frequency Symptoms Procedures Affected Components Affected
4 Torque Splits Yes None 3 ECU, 1 YellowHarness
4 Ng Oscillations Yes None 4 ECU, YellowHarness
4 Low Performance Yes None 2 :Anti-icing Valve,T2 Sensor, InletGuide Vane (IGV)Rod End
4 Flameouts During Over- Yes None Sequence Valvespeed Checks
3 Bearing Failures Yes Cold No. 1 Bearing, No. 3Section Bearing, No. 4 Bearing
4 Miscellaneous ColdSection
126 TOT AL
FABLE 7. PREDICTED ALL-CAUSE T700 FIELD EVENT SYMPTOMS -
15,000 ENGINE HOURS
Predicted Frequency Symptom
5 Nuisance Chip Signals10 Inspection Finds
Premature Oil Filter PopoutsMiscellaneous Control AnomaliesStarting Problems
Erroneous Engine History Recorder DisplayOil L, eaks
AT-. 5 ()vertemperaturesStall s
'2 Torque SplitsN g Oscillations
2 Low Perform ance
2 Fl ameouts3l licaring Failures'- Nlisceilaneous
I'()' F TAL

TABLE 8. '700 DIAGNOSTIC NEEDS BASED ON PREDICTEDTP700 FAIILURE SYMPTOMS
Predicted
Frequency Symptom Detection Method Isolation
5 Nuisance Chip Signals Discriminating Not ApplicableChip Detector I
10 Inspection Finds Visual Visual
3 Premature Oil Filter \isuad Not Appli, able
Popouts
6 Miscellaneous Control Cockpit Signals Control System
Anomalies Analyze e
Starting Problems Pilot and Cockpit Control System
Indicators Analyzer I2 Erroneous Engine Itis- Visual Not Applicable
tory Recorder Display
3 Oil Leaks VisuA Visual
4 '4.5 (vcrtcnperature Time at ()%er- f Control System
temperature Re- j Analyzer uidcorder or Display Borescopt
3 Stalls Pilot Not Applicable
2 Torque Splits Cockpit Signals Control S -,I inAnalyzer
3 N Oscillations Cockpit Signals Control SystemI Analyzer
2 Low Performance Automatic Per- [ Control S3 stem
formance (Ifealth) Analyzer and
Monitor Modified MV TS
2 Flameouts Pilot FControl System/Analyzer
Bearing Failures Chip Detector Slave ChiprIDetector2 Miscellaneous Not Applicable Not Applicable
54 TOTAL
- 23 -

instruments. Control fault detection by an on-board monitor, therefore, is notrequired for those faults detectable by the flight crew. There is a definite need,however ' for aids to control fault isolation as indicated by the "Actual Compo-
nents Affected" colun of Table 6. The data shows as many as five different
causes for the same symptom. The time and parts expended by maintenance per-
sonnel to identify and replace the faulty components, even when following the
troubleshooting procedures in the maintenance manual, may well justify the costof the ground support control system analyzer developed by GE and under eval-
uation by the Army. This cost study should be performed.
Low Performance Events
Four low performance events in 15, 000 hours (three percent of all field events)
were detected by the daily IlT (Health Indication lest) check and confirmed by an
in-flight maximum power check. In all four cases, the problems were control
related, not caused by gas path or seal leakage degradation. Performance moni-
toring, therefore, will detect not only performance degradation but those control
system problems that are not easily identified from cockpit instrument readings
or from observed engine phenomenon such as slow acceleration, etc. Automated
performance measurement would eliminate manual reading, recording, and com-
putation of cockpit instrument data by the flight crew in the cockpit, would save
time, fuel and engine operating costs, and produce more accurate and useful data.
A LCC analysis should be performed to determine if automated performance
monitoring is cost effective.
Engine Overtemperature Events
Five overtemperature events occurred in 15, 000 hours on the T700 engine (see
Table 6). The Black Hawk vertical scale cockpit engine instruments provide a
red lighted scale when overtemperature of the engine hot section occurs. Ilhere
is no annunciator panel caution signal for a turbine overtemperature, however.
Hot section overtemperature damage will occur if specific time at overtempera-
ture relationships defined by two curves (see Figures 28 and 29) arc exceeded.
The time functions are measured in seconds and can easily be inaccurately esti-
mated by the flight crew. An automatic system that computes the time at over-
temperature relationships and displays the overtemperature severity message
would be a valuable maintenance tool and should be evaluated for cost effective-
ness.
-24-
MONSOON

Modular Perf ormance Fault Isolation (MPY1)
Performing MPIH on installed '700 engines was determined by analysis (see
D&CM Monthly Report No. 7, January 15, 1980) to be impractical and should be
done at AVIM on the modular engine test system (METS). Major modifications
to the METS were defined to enable gas path analysis data of sufficient accuracy
to be obtained for identifying the module or modules reqtiring replacement.
Field event analysis (see Table 6) did not identify any low performance events
caused by gas path performance degradation, however, GE agreed to conduct a
LCC analysis of modular performance tault isolation on METS by gas path analy-
sis and recommend an alternate method should gas path analysis not be cost
effective. Status of Army METS is shown in Table 9.
TABLE I_. MODUL,-R ENGINE TEST SYSTEMS STATUS
System
Configuration Qty. o, ated 'rests Description
Original 1 Germany '153, T55, T63 lnalog instruments,
Design 1 Air National Guard T173, 1-74 hita taken, corn-
1 Fort food puted and evaluated
I Fort C anpbell in anually.
Total 4
Updated 1 Fort Rucker All above I)iital indicators.
Design (Prototype) plus 1700 Automatic Data(see Below) Scanning.
Total 2 Data AcquisitionSystem - calculates
zind prints perfor-Iii-...ce daita;.
T700 METS .\DAPTEi? KITS
T700 2 Installed on Updated '1P700 Mout s, instruments,
Adapter METS dil, shaft, brack-
Kits 1 Unassigned ets. , ater brake,sta; ,-'tr, etc.
Total 3
-25 -

Modular uil-\Vetted Part (OWP) Fault Isolation
Modtlar OWP fault isolation was considered practical by use of so-called slavechip detectors that would be installed at each scavenge pump inlet to determinewhich engine sump was the source of failure debris in the oil. Engine testing forO\WP fault isolation was determined to be a METS facility function rather thanone performed on installed engines for the following reasons:
1. OWl, failures require engine removal reg:ardless of which module isinvolved. Engine testin,; in the aircraft reduces aircraft availability.
2. Opening up the lube oil system at AVUM level to install slave chip de-tector exposes engine to the possibility of contaminating the oil system.
3. The character of the slave chip detector kit with a control unit and a
six branch wviring harness makes the set very susceptible to handlingdamage at the AVUM level.
Engine Life Usage Monitoring (ELIUM)
There were no low cycle fatigue or stress rupture related field events. This isto be expected, given the low average age of appro.,dimately 100 hours time sincenew (TSN) of the engines in this data sample and more importantly, the conserva-tive design and long predicted hot part life of the present T70U-GE-700 enginemodel. This assessment, however, is to cover all modern modular Army turbo-shaft engines, including for example, future growt]h versions of the '700. Maint-enance and logistic experts in GE* and elsewhere have concluded that for most
* AGARD Symposium Pport, May ! 9. 19 0, ''he Application of I lcsign-to-Cost
Method Lo Aircraft Engine Design. " Paper by (. Walker, Mgr. Logistics Anal-ysis and Planning, G. E. , AEG, Lyrn, Mass. "Logistics Forecasting forAchieving Low Life Cycle Costs."
21 -

military engine applications, the efficient application of on-condition maintenance(to which all services are committed) requires a measurement of life usage moredefinitive tliu merely engine hours. GE has developed an engine life measure-
ant concept called ELUM (engine life usage monitoring) and has implementedlhe concept in hardware and software specifically for Army '7700 engine evaluation.
It is recommended, therefore, that the ELUM concept be included as a candidateD&CM function and be evaluated for cost effectiveness.
D&CM APPRlOACI - SUMMARY ANtD DESCRIPTION OF CANDIDATE ITEMS
The results of the Task I definitia, of the D)&CM ar. ioach are depicted graphi-cally in Table 8 with the exception of the engine lift isage function. All of thesymptoms revealed by 15, 000 hours of engine field operation are shown togetherwith the methods for fault detection and isolation. D&CM candidati improvementitems are lighlighted as the boxed items. Missing by intent is a vibration nion-itoring item. There were no vibration events reported in the peri.)d studied. Norhas there been any significant vibration problem history during the entire pro-gram. A previous study for the NAVAIR Lamps program under Contract N00019-77-C-0201 concluded that neither An airborne vibtration monitoriii,; system nordedicated 'P700 vibration ground support equipment at A.VI would be cost ef-
fective. There is vibration instrumentation eqJuipment av'aila.ble on the MEL'Sfacility if required for off-aircrAif diagniosis.
A suminar\ of the candidate l)D& C candidate functions aind items is presented inTable 10 and is briefly described in the following paragraphs.
TABLE 10. )&C l AlPPROACIH - CA I ).\ ii I)&CM I.MI'H( VI,1EN "S 1!'E.MS
Ground lFunctions (i'oLId LquiiJ)Iunt
Modular Perform ance l."aul IiSoLttion Modified MIFFSModular Oil-Wetted Parts Faudt Isol.tion Slave Chip DetectorControl LI( Fault Isolation Control System Anialyzer
Airborne Functions Airborne Equipment
Engine Hcalth Measurement Automatic Performanice MonitorEngine Parts Lifc - .Measurement 1.ow Cycle Fatigue Monitor lDegaus-(il-Wetted 1'arts Iaul Detclioll sing Chip l)etector ( )ertempcratureHot Part Condition Monitor (Time at ()\ertemperature)
* GE Report H7.' AEIGI 023, 't?0U-t V.- t lih- .light Engine Analyzer l'radc-()t
Study. " (October 19071, pIages ,-:)' to 7-11.

Modified MIETS for Modular Performance Fault Isolation
NEED: To isolate a performance loss of 7, or more to the correct module ormodules when the loss has been determined to be a gas path problem.
CONCEPT: A modification of the updated METS to add instrumentation, adap-ters, a computer, and air flow measurement capability to approach in the field
equipment the capability of existing factory T700 facilities.
Slave Chip Detector GSE Kits
NEED: To isolate the source of oil system lfailure debris to the module in-vol ved.
CONCEPT: A GSE kit containing six magnetic chip detectors thai could replacethe six scavenge screens at the scavenge pump inlets. Engine operation on the
METS would be expected to generate debris that would be captured and detectedby these slave units.
Control System Analyzer
NEED: A diagnostic aid or technique for Army AVUM personnel that will isolate
control related problems to engine or airframe, and if engine caused, isolate tothe LRU with effectiveness at least as high as achieved in flight test with GE
support.
CONCEPT: An AVUAl level GSE control system analyzer utilizing available en-
gine and aircraft interface, MEll check cockpit instruments and aircraft electricalwiring betveen engines, check ungine wiring and LRU's and istate faults vithan estimated effectiveness of at least. 90"..
Automated Performance Mlonitor
NEED: Reduce or eliminate preflig-ht checkout time for HIT check, simplify andimprove accuracy and consistency of IIT and maximum power checks and provide
data to support MPI or other performance analysis such as trending.
CONCEPT: An airframe-mounted unit that will, on command, provide a cockpit
go-no-go signal for preflight IIIT or in-flight maxinauin x)wer checks and also
produce a record of the performanc meaisurements.
-2, -

Lov Cycle Fatigue Monitor
NI:ED: An accurate means of measuring mission load profiles and cvclic life onkey engine parts exposed to a wide range of missions and environmental con-ditions. Recent advances in analytical techniques for cyclic life usage computa-tions will improve cyclic life measurement over that possible with the presentengine history recorder (EHR).
CONCEPT: A microprocessor-based unit that measures 20 partial and full speedand thermal cycles (versus 2 for present EHR) and computes equivalent fullcycles on each of five key parts on each of two engines.
Degaussing Discriminating Chip Detector
NEED: Reduce or eliminate mission aborts and unscheduled maintenance actionscaused by nuisance chip signals.
CONCEPT: A chip detector similar to the current '1700 device but with the addi-tion of a degaussing coil that releases the chips after capture and provides asuitable cockpit signal.
rinie at Temperature Overtemperature Caution
NEED: A latching-type caution indication of potentially damn,q ,;g overtemperaturewhere the occurrence or duration are not observed by the flight crew.
CONCEPT: A persisting or latching-type signal available to the aircraft crewand requiring some maintenance action is currently the only information whichcould be derived from the T700 engine history recorder time at temperaturecounts by computing the difference between the preflight and postflight readings.
ESTIMATED IMPACT OF D&CM APPROACH ON EXISTING MAINTENANCE
PMILOSOPHY
Existing AVUM Tasks
I. Ten-hour five-day inspection.
2. 500-hour inspection.
3. Troubleshooting fault isolation.
- 29 -

4. LinL udpaccalh Ludt removal (1. HWt) replacement.
5. Engine rninovl/replacement.
i. IlT chec s and maximnum power tests.
D&CM Impact on AVUM Tasks
1. Performance - go, no-go, dcci Aon with aircraft installed automatedperformance monitor replaces manual HIT check and maximum power
check.
2. LRU troubleshooting and t~ult isolation. Improve accuracy with con-
trol system analyzer.
3. Utilize discriminating chip duc ector to tainimize or eliminate ground
engine runs.
4. Increase LC F counting capability for life-cycle limited components.
5. Overtemperature caution provides accurate time-at-temperaturerneasurement for better maintenance decisions.
6. Preventive inspection - no change (see above).
7. Corrective maintenance tasks - no change (see above).
Existing AVIM Tasks
1. Troubleshoot using METS.
2. Module removal or replacement.
3. Component removal or replacement.
4. Repair verification using METS.
D&CM Inpact on AVIM Tasks
1. Troubleshoot to module for p,rformn)mce and mechanical problems utili-zin ,- ,Mt;TS modification p(r ;F proposal dated 10/17/79 and slave chipdetector.
2. Control svstcra aalv ;'r set tor control fault isolation.
3. Corrective maintenalce tasks ino ohanige.
4. Po'Centivc waIltellncc tasks no c'ltngt,.
- O -

Lxijti g Depot Tasks
I. Hepair modules.
2. Repair 1,RU' s.
3, Repair damaged or worn parts.
L)& CM Impact on Depot
I. Control system analyzer set for LRU fault isolation.
2. Repair and test functions - no change.
3. OWP fault isolation with slave chip detector.
D&CI IMPACT OF TASKS PERFORMED AT AVIM UTILIZING THE MODULAR
ENGINE TEST SYSTEMS
If the recommendations resulting from this D&CM assessment art- implemented for
both AVUM and AVIM organizations, METS tasks will be affected as follows:
1. Fewer T700 engines will be shipped to AVIM and tested on METS.
a. More accurate and faster maximum power and HIT checks willreduce the number of marginal engines sent to AVIM.
h. Much more accurate and faster control LRU fault isolation usingthe control system analyzer set at AVUM may result in fewer
engines returned to AVIM for diagnosis which, because of time,
facilities or personnel limitations could not previousl\ be diag-nosed at AVUM.
2. Faster ME'IS diagnostic and check-out tests.
a. Computerized data processing as recommended will produce moreaccurate results faster than with the present manual data recording
and compul ation.
). Thu use of the same type control system analyzer set as used at
AVIUM will also speed up troubleshooting at METS.
NOI'E: For METS Status, see Table 9.
-31 -

TASK II - l)&CM SYSTEM DEFINITION
The D&CM approach developed in Task I requires equipment for three ground
support D&CM systems; a modified METS for performance fault isolation, a slave
chip detector system for oil-wetted parts (OWP) fault isolation, and the Control
Syatem Analyzer. In addition, the following non-GSE systems were identified:
one engine mounted sensor; the discriminating chip detector to replace the present
master chip detector; and an airframe-mrounted Di& CM system consisting of one
cockpit digital indicator, one mictoproccs)r base() data computer and one free
air temperature sensor resistance temperature device (RTD) (probably airframe-
mounted). These systems are described herein. Table 11 categorizes the meansby \\hich the functions are performed, i. e. , by manual means, computer-aided,
or automated.
TABLE ii. HOW CANDIDATE D&CM FUNCTIONS ARE ACCOMPLISHED
C omputerl)&CM Function Aided Automated Manual
Modular Perlormance Fault Isolation X X
(Modified M E TS)
Oil-Wetted Part Fault Isolation X
(Slave Chip Detector)
Multipurpose Airborne D&CM
Automatic Performance Indication X X -
Degaussing Discriminating Chip X X -
Detection
Overtemperature Caution X X -
Engine Life Usage, Computation X X -
and Recording
- 32 -

MODIFIED METS FOR MODULAR PERFORMANCE FAULT ISOLATION (MPFI)
Description of METS Modification for MPFI
Modification of the basic METS for performing MPFI means, in essence, repro-ducing in the six METS in the field the capability of a computerized GE, Lynn,Mass., 1700 test facility complete with a GE systems engineer for data analysis.The basic improvements to METS are the following:
1. Accurate measurement of l)tal inlet and scav, age blower air flow.
2. New high accuracy pressuro transducer package.
3. Suitable microcomputer with recording, display, and printout cap-
ability.
4. Miscellaneous mechanical and electrical modifications to accomplish
the above.
5. Computer program (software) and comprehensive operators instruc-
tions for gas path analysis.
Hardware Required
In order to provide the desired inlet air flow measuring capability, new designsand hardware are required for the bellmouth, inlet fairing, torque tube, torqueshaft, inlet duct and screen, inlet baffle, engine mount frame, and inlet pressureand temperature probes. The longer bellmouth and fairing will require the newtorque shaft and tube designs. The inlet duct, screen, and baffle will provide
temperature probe mounts and shielding from the sun. The longer bell mouth willalso require that the water brake be located further from the engine, which mod-ifies the forward mount frame. An instrumented scavenge blower flow measure-ment section and environmentally protected pressure transducer assembly arealso required. The control console will be modified to accept the new micro-computer, display, and printer.
Software and Engineering Support
The following software and engineering support are required for the modifiedMETS for MPFI:
1. Prepare flow charts (algorithms) describing the executive program;data acquisition, smoothing and/or averaging; computations, errorauditing, plotting and display for each of the following:
- 33 -

a. Overall engine performance.b. Compressor efficiency.c. lIP (gas generator) turbine efficiency.d. LP (power) turbine efficiency.
2. Prepare computer programs in the appropriate machine language forthe above functions.
3. Perform computer simulation of engine operation to debug the programs.
4. Prepare detailed user's -ianual.
5. '700 performance and systems analysis support on bellmouth andscavenge flow sections definition.
6. Aerodynamic instrumentation unit support for services, to approve andqualify new inlet temperature and pressure problems.
7. Engine evaluation and test cell work for calibration of the inlet particleseparator and the belimouth.
8. Structural stress analysis support to perform a VAST study to analyzethe system resonances.
9. Vibration survey as a part of engineering checkout of th,. prototypehard& are.
10. Prepare computer system specification, obtain competitive bids, andprocure computer system.
11. Modify, TM55-2640-2 t6-23, Aviation Unit and Intermediate MaintenanceInstructions for the T700-GE-700 Engine.
STANDARD METS WITH COMPUTErIIZED OVERALL PERFORMANCEMEASUREMENT
Hardware Required
The following hardware is required for the standard METS with computerizedoverall )erform ance mneasu rement.
1. Suit : ,bIk '.o0nurcr Vi h displiay, record, and printout capability.
2. Control console modification for computer system.
-34-
The following software and engineering support are required for standard METSwith computerized overall performance measurement.
1. Prepare computer system specification, obtain competitive bids, andprocure computer system.
2. Modify TM55-2840-248-23, Aviation Unit and Intermediate Maintenance
Instructions for T700-GE-700 Engine.
3. Compare flow charts (algorithms) describih,, the executive program,data acquisition, smoothing and/or averaging; computation, errorediting. plotting, and display for overall engine performance.
4. Prepare computer program in appropriate machine language.
5. Perform computer simulation of engine operation to debug tIs program.
6. Prepare user's manual.
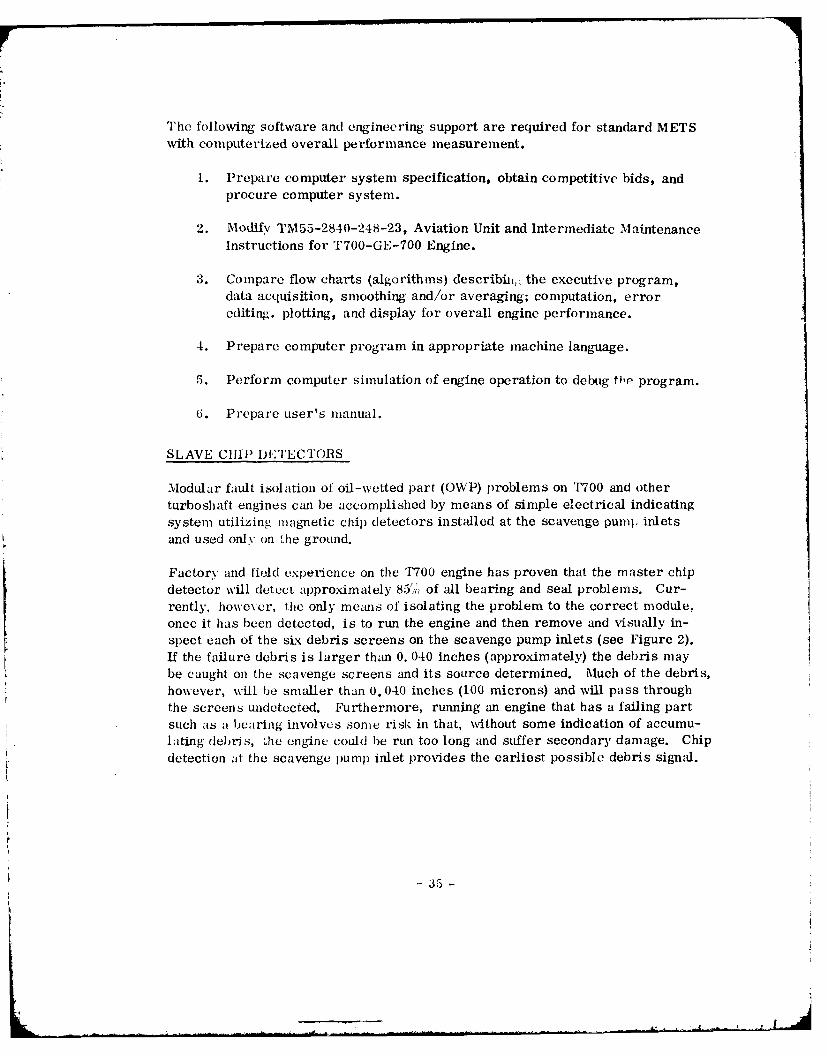
SLAVE CHIP DETECTORS
Modular fault isolation of oil-wetted part (OWP) problems on T700 and otherturboshaft engines can be accomplished by means of simple electrical indicating
system utilizing inagnetic chip detectors installed at the scavenge pumj inlets
and used only on the ground.
Factory and field experience on the T700 engine has proven that the master chip
detector will detect approximately 85,1) of all bearing and seal problems. Cur-rently, however, the only means of isolating the problem to the correct module,once it has been detected, is to run the engine and then remove and visually in-spect each of the six debris screens on the scavenge pump inlets (see Figure 2).
If the failure debris is larger than 0. 040 inches (approximately) the debris maybe caught on the scavenge screens and its source determined. Much of the debris,
however, will be smaller than 0. 040 inches (100 microns) and will pass throughthe screens undetected. Furthermore, running an engine that has a failing partsuch as a bearing involves some risk in that, without some indication of accumu-lating debris, dhe engine could be run too long and suffer secondary damage. Chip
detection at the scavenge pump inlet provides the earliest possible debris signal.
35-
.1

C)
C)
C)
C)v~1 []Lj C#2
0
C)
Cl
C)
:L4
-J

D& C I Approach
The IR&CM approach for oil-wetted parts fault isolation proposed in Task I for
further study and evaluation was the use of so-called "slave" chip detectors.
These devices are conventional magnetic chip detectors designed to be installed
at the six scavenge pump inlets in place of the scavenge screens. The detectorswould have electrical connectors for connection to a transistorized chip detector
monitoring unit. The detector design would bz similar to the interim T700 B-
sunmp chip detector, which has proven very satisfactory. The concept and hard-
ware would be identical with that used with excellent results for several years in
Lynn GE TF34 and F1.04 test cells. Althiugh this concept could be applied at theAVIUM level and fault isolation ground runs made with an installed engine, it isnot recommended for the following reasons:
1. Decreases aircraft availability.
2. Creates opportunity for introducing contamination into the oil system.
3. Requires a slave detector system for each helicopter company rather
than for each MIE'S - a ten or fifteen fold increase in GSE costs.
4. Requires a calibration circuit checker for each helicopter company.
5. Creates a situation wherein it is likely that parts of the little used
equipment may be lost or damaged in storage and the time required
to set up and run the fault isolation checks correctly may be excessive
due to their intreqpent occurrance.
The practical application of this technique, if it is adopted, would be at the AVIMlevel utilizing the METS for engine run-ups. Only six sets of detector systems
would be required. Systems could be permanently installed and the METS oper-ating personnel servicing en4,ines from many helicopter companies would he
more adept at using and maintaining this equipment.
There are four principal sources for failure debris in the basic engine, excluding
the LRIT's:
Detectable ScavengeScreen Dvtectors
A-Sump Cold Section Module Yes
Accessory Gear-box (AGB) Accessory Module No*
B-Sump Cold Section Module YesC-Sump Power "1 arbine Module "es
*The design of the T''O0 engine does not provide any conveni means for
T

chip detection of oil coming iroin the tecessory gearbox as this oil drainsby gravity directly into the engine oil tank. Although there ib a threaded
oil drain plug at the bottom o1 the oil tank, installation of an indicating chip
detector at this point is not feasible because of false signals that will becaused by system debris that will collect at this, the lowest point in thesystem. The factory and field experience on the T700 engine covering ap-
proximately 75, 000 engine hours without any AGB bearing or gear failures
indicates no real need for AGB chip detection.
Oil-Wetted Parts Fault Isolation ,Procedurc Utilizin the Proposed Transistorized
Chip Detector Circuit (TCDC) Sm i!m
In the event of an OWVP failure detected by the master chip detector on an in-
stalled engine, AVUM troubleshooting Procedure 39 in TM55-2840-248-23*,
should be followed and engine removed and sent to AVIM if failure is confirmed.To determine the source of the debris at AVIM, the six scavenge screens should
be removed and inspected before preparing engine for METS installation. A
significant accumulation of chips on one or more screens from the same sumpwould be a clear indication of the source of the problem and the engine would be
either sent to the depot if debris is from A- or B-sumps, or have its power turbinemodule changed if the debris is from the C-sump. If there is no clear indication
of failure location, the indicating chip detectors should be installed on the six
scavenge pump inlets and the engines run on METS until a TCDC chip signal isgenerated. The test would then be terminated immediately and the appropriate
a, 'on taken based on the indicated source of th,- debris. If no chips are detected,
the engine would be returned to service following T'55-2b40-24b-23 procedures.
Hardware Description Cost
The components required to equip one ME'TS facility for oil-wetted part fault
isolation are as follo\ws:
1. One transistorized chip detector circuit (TCDC) unit containing power
supply, and adjustLeic decction circuits wvith provisions for processingsix chip detectors. The 'CDC operates on 60 lz, 115 V ac power in
a standard 5-1/4 in. x 19! in. i'ich mounting panel, and weighs 47
pounds (see Figure :),
2. Six magnetic (ip dutu, toc . for scavenge pump inlet installation.
* Aviation Unit and Intermediil Iin:,cnce Instructions for the T700-GE-700Engine.

0
-z
cf~
7K V
-, 'II [
N
0
- C12
{0
_ 0
000000
I ___
- 39 -
I -

3. Si- (:ahlu sets - ]'CDC to cip defcctor.
-hi-:; rt i)lC calibration bo)x uInii.
>stniated "ball park" cost is $10, 000-15, 000 per system plus a nonrecurringcost for MIL specification conformance wnd enginceering support for installationchieck-out iand operating instructions of $15, 000-:30, 000 per system.
Software Reuired
No software is requi red for oil- ( tud pa:rt [aull is ation.
Genoral spucificiin
Speciticaitions for thc transis torized 1iiji(u cctol stin, Part No. 17 Al 12-611iroup) 02, are as follows:
Part No. li AI 12-6;11 Group 2:
Power RU(iUiremunt s: Iir;Ucisxons (ill.)
I)a-I23' V ac, 17-6;;tl/ 1/ 1).0 x :j. 2 x 13. 0).
D er[Ae ICtY, 50 l/,~v
POVCOV SUpplyV RIted OULput: NO't \\'ight (Ib):
(e11 ag (norn1. ,,-1 V dc, L'i
(urrnt (nliax. ) 1. A :
tOperatfing: ; jto ;' 1
11alin 1 )erate 2 of (I)o U 10 1'
Theory of Opuration
The chip duCLOOr1 utiliZe - L11e ol tiauc di 'ide network triggered by foreign miioa-
netitc Vu atkcri-lI uo01t-lilng onie 1,12chilt detectOr, his p0oides al io\% currentsensing (i tTcnit 111 (IOt etChip)S. t hree m ioia 5ip indicatecs a cleL!an det ectc 1'.
Twety ill a. .ki sc it,. iridic e t11w cipj detector (,i ip is filledwith a iolid ( hip' wr Ch;'' I~ t)-~ I'C[ \\' ill drawI\ t ma~iimum ol 20 ,,nA
uider short-cir, iii t 'Oiil f-. liit -te n is, sct to ifliictt c ipj (conditions
vlsually wheni tin: iiOUte 'e O i ,A liz is he tiValentI Of (AIL hundred011s1118 flialtefd WI-OSS t1C 01it) dutl an -Ior .

L
For normal operation, refer to GE Dwg. 17Al26-113 (see Figure 4). The cable
to the chip detector must be plugged in to provide a ground for switching transistor
Q1. When power is turned on, relay K is energized through Q1 and Q2 which open
the circuit to Li (chip indicator light) and closes interlock circuit to cell chip
status light relay. The milliammeter reads about 3 mA. If the cable is not plug-
ged into the chip detector, Q1 will not turn on to provide power to Q2 and relayK, Li will be on and the cell chip status light will be on. This condition is recog-
nized by a milliammeter reading of zero. To correct, the harness must be plugged
in or the disable switch must be turned on. During normal operation when chips
cause the resistance across the --Iiip detector to drqp to 100 ohms, trip set point,
transistor Q4 is turned on which iurns on Q3, this nirns off Q2 and relay K drops
out causing LI to turn on and cell chip status light to turn on. The milliammeter
will read 12. 5 mA or higher. To reduce meter reading, the chip detector must
be cleaned.
The disable switch is a two pole manMl toggle switch with one circuit across the
relay K contacts which is in series with the cell chip status light relay. The other
circuit lights the disable Ianp and picks up relay K. The disable switch can be
used to bypass (not correct) a fault at the chip detector or a circuit component
failure.
Noise interference is filtered by capacitor C -aid resistor R9. When Q2 is driven
off the effect on the speed of response would delay the time required to dischargecapacitor C in about 2. 5 seconds. 1is action allows any sharp signal or pulse
of short duration (noise) to he ignored"by (22 consequently keeping relay K ener-
gized.
CONTROL SYSTEM NA'LYZEI Sl
Background
During the Black Hlawk development and Iovernment competitive test (GCT) phaseof field testing, a requirement was identified for improved engine and controlsystem troubleshooting iand rapid isolation to the faudty component. )uring dis-
cussions at tuchidcal ruiews and ]ntegrated Logistics Support Management Team
(ILSMT) meetings, the UE' recommended the development of a suitcase-type tester
which could be readily connected to the helicopter and engine to identify a mal-
function within the engi~L cotrol system or in the interfacing airframe system.
- 41. -

-zo
*Lj
4 0
V -1 ~ j 0
21)
-.- -U
< C.)

In January 1978, GE proposed the development and evaluation of a prototype fieldunit suitcase tester to be used in troubleshooting and fault isolation of the TP700engine and control electrical system on the lack Hawk and AAH helicopters.Subsequently, funding for a prototype units was provided and one unit was builtand sent to the field for evaluation. This tester is in use at Ft. Rucker and isundergoing Army and GE evaluation. A second prototype incorporating modifi-cations based on first unit experience was shipped in August 1980.
General Description
The T700 control system analyzer set is a portable test set built of rugged solidstate electrical components. The test set can be powered by the Black Hawk'sAPU power supply and does not require engine operation. The unit has built incomparator currents to give go or no-go indications eliminating the requirementfor a meter reading. The test set consists of two portable units which are:
Weight (lb)*
1. '1700 Engine Harness and Sensor Circuit Tester 20(Figure 5).
2. 1 700 Electrical Control Unit (ECU) Systems Tester 30(Figure 6).
*Including all cables and test pieces.
Features
The control system analyzer set has the following features:
1. Single-point connection utilizing ECU's S-39 diagnostic connector.2. Used with engines in nonoperating mode (APU must be operating for
electrical power or ground power required).
3. Nonengineering displatys - go or no-go logic.
4. Self-check circuits (bite).
5. Environmentally packaged.
..............................
t 7 C K;
* ~
(4
I -t t
* "K-' ~ ~'~1* I
a
I'lL I * o. ii I ( -, Itsh

P 9 ow
k'igurt: :i .lc hl I II( ;!I SCn, or1 Circu'it Tester.

Fal l! isolition Capability
Ihe control system analyzer set has the lollowing fault isolation capability:
1. Electrical Control System LRl1s:
a. Np and torque sensors.b. Sequence valve overspeed solenoid.
c. Alternator.d. Thermocouple harness.
e. Aircraft Np demand potentiometer.f. lbdromechanical unit (IIMtJ) torque motor.
g. Hlydromechanical unit linear variable differential transformer.
h. Yellow harness.i. Blue harness.
j. \ircraft E-1 harness.
2. Electrical control Luit.
3. Engine system dynamics.
1. Cockpit engine instruments.
1"700 Engine Harness and Sensor Circuit Tester
The T7o0 engine harness and sensor circuit tester Part No. i013145-b32 has beenspccifical (Csigued for use ,vith the electrical control unit's S39 diagnostic con-nector for troubleshooting control system problems with the aircraft and engine
in the nonoperating mode.
Th rough the diagnostic cornector, control s stem electrical harnessing, inter-connecting components and aircraft interface connections can be tesled for opens,
shorts, and nominal resistance values when troubleshooting engine control system
problems as directed in Section I of TM,55-284(-248-23 maintenance manual. Thetester operates on 115 V, G0 to -t00 liz power which is available at the aircrafts
J-257 utility receptacle in the cockpit or from external sources and will displa* apass or fail logic with no additional instrumentation or test eqiuipment required.
A built-in test (BIT) or self-check feature has been incorporated which tests the
inlternall cir.ta 2;i 1i . iJi . i lh lHie pass and fail mo, '.
-t,

The go or no-go logic is accomplished and displayed through the use of resistancecomparator circuits whose values are set at the minimum and maximum tolerance
range of the circuit being tested. Circuits which exceed the minimum or maxi-mum allowable ranges will illuminate the failed red light. Circuits that are withinthe allowable range will illuminate the pass or green light. The tester also checks
each circuit for a short to aircraft ground. Shorts to ground will illuminate thered fail light. If all circuits arc normal, the green pass light will illuminate foreach circuit being tested.
The following engine and aircrift components can -e checked using the tester:
Alternator HMU Torque MotorThermocouple Harness Yellow Harness
HMU LDT Blue HarnessNp Sensor Np Demand Circuit (Air-Torque and Overspeed Sensor craft)Sequence Valve Overspeed Load-Share Circuit
Solenoid (Aircraft)
The important htuman factors features are designed into the harness and sensor
circuit tester and greatly enhance its effectiveness as follows:
1. Elimination of the need to look up the correct value of electrical re-sistance for each pair of electrical pins or sockets to be tested, andthen correctly read the multimeter to determine if the readings are
within limits.
2. Elimination of he need tO use multimeter and needlepoint probes tocheck for opens, shorts, and out-of-limits resistance within eachof 18 electrical multipin connectors as well as between connectors.
t'he need to read the pin nt'inbers and e contact with the correct
pins is now very difficult and subject to auman error.
T700 ECU Systems Tester
The T700 ECU.7 systems tester Part No. 4013145-834 is a self-contained test unit
specifically designed to perform functional closed loop tests of the various ECUfunctions, IIMU feedback system, aircraft Np speed trim system, and providecockpit readout of the 'I'GT, '-( Np, and ' torque instruments. All tests are ac-
complished with the engine in the nonoperating mode B7 connection to the ECUS39 diagnostic connector.
-47-

I he EC U tester performs the following specific functions:
I. Tests the ECU and HMJ chanmal by simulating the linear voltage dif-ferential transformer (IVDT) characteristics. This test, by utilizingthe LVDT secondary voltage, will detect and correct the HMU torquemotor current level and confirm proper excitation voltage to theLVDT.
2. Tests the ECU's TGT limiter channel by driving tIL ugine's ther-mocouple harness to the level of the ECU's TGT limiter referencecircuit and displays the limiter value on tht. cockpit instrunent.
3. Tests the ECU's Np governor channel by providing a simulated Nspeed signal to the ECU which is compared to the aircraft Np demandspeed control system. Adjustment of the speed control system willcause the ECU's governor circuitry to respond to the speed refer-ence and display the value on the Np cockpit instrument. Also checkthe Np demand circuit in the aircraft.
4. Tests the ECU's torque computer and load share circuitry by pro-viding fixed values of simulated torque to the input of the ECU. Thesesignals are then computed by the ECU and displayed on the cockpitI) torque instrument. In addition, a load share error signal is pro-vided at S39 which drives the LC U torque circuitry and the resultantNp speed change is displayed on the cockpit ',% Np instrument.
The above tests check all of the ECU t s major control functions and provides passor fail criteria in iddition to functionally checking the cockpit instruments of TGT,U, X and ',, torque.
MULTIPURPOSE AIRBORNE D&CM SYS'TEM
Background
As a result of work performcd during Task I of the D&CM Syst,:.. Assessment, fourairborne elem,:nta of :i condition monitoring system were identifitI as likely cand-idates for further investigation. These elements include:
1. A automatic peeformance monitor.
. A degaussing discrindnating chip detector.
- I" -

3. Engine life usage monitor.
4. An overtemperature monitor.
During Task II of this program, each of the above elements were assessed in or-
der to:
1. Define system hardware and software.
2, Define system operation.
3. Estimate hardware and software costs.
Two particular helicopter configurations were addressed. The first was the Ult-
60A utility aircraft and the second a UH-XX which we envision as an advanced util-ity or attack helicopter. In addition, three D&CM configurations were evaluated:
1. All D&CM hardware engine-mounted with the exception of a cockpit
display.
2. All D&CM hardware airframe-mounted with the exception of enginesensors. This configuration would feature removable, airframe-
mounted history memory modules.
3. All D&CM hardware airframe-mounted with the exception of engine
sensors and on-engine, engine history memory modules.
High level block diagrams of these configurations are shown in Figures 7 through 9.
Configuration I (Figure 7) was examined in some detail during work performed un-der Contract DAAK50-79-C-008* and was found to be suboptimum in several re-
spects. First, separate on-engine computers are required for each engine, result-ing in cost and weight penalties. Second, the higher component count degradessystem MTBF and thus increases aircraft maintainability costs. Finally, each en-
gine held in storage for logistics support would likely be stored with an on-enginecomputer installed, thus impacting the overall cost of implei.: -nting such a system.
Under one condition the on-engine configuration could be effective. If the engine'selectronic control unit were implemented with digital hardware, and if excess
*See General E'lectric Report TIS 1179AEG8036 entitled Design Alternatives for
a T700 Engine Life Usage Monitor.
- -19 -

LA-
(D L/) CD
LJ CQ L-) u) (3 I-C/i LUi LU
Z: C-O H- C((f
0
ly-LL-' --u
-CFC F 9LL-4
af LL,
LU.
-JL
-- -D V
Lli < U < .l

LUI
LUI C) L) L ) --V)LU LUi cl
= CDI (D L/)
CD V) 0
-j
LLU J h> 0) CD
L~L2J
cy V-)-C - '
L>c .. C- L
~i-1 177'co -
< >- LL
CD 0- 0DU~L LUJ C)L
L'I

(D V) CLck
C)J C)))I
F-LUJ LUJ
LUC-1-- C rL/) Z:
- ~ -
'-4
0
0
~~C)
~1FF LU)L
V) C-D CL F- c Zcfl
5 2)

,Ot¢ 'ssing time and memor, were available, most engine health and history data,' mitI be performed by the ECU. Becaust, such controllers have not yet been imp-
lciented, this possibility will not be explored under this contract. At a 1:itertime, as digital ECU's begin to emerge, it should be re-evaluated.
Configuration 2 (Figure 8) has been selected as the most advantageous of the threesystems. It features a single airframe-mounted avionics module and a small pro-grammable cockpit display. This configuration results in the least costly hard-
ware package and provides for the dyn.imic CoMmunication of flight safety, enginehealth, and engine history information to flight an, ground crews.
Importut submodules of the computer include removable memory elements, onefor each engine. These contain a ftll description of each engine's usage profileand may be shipped with each engine as it is; transported to or from intermediate
or depot repair facilities.
A third configuration (Figure 9) was brietix considered and is similar to configur-ation 2, except that the engine-history memory modules are engine-mounted. Thesingular advantage of this approach is that enginu history data is hard-mounted tothe engine and is unlikely to be lost when the engine is transported, Acquisition
and installation costs of sttcn a system are greater than that of configuration 2 andreliability is lower. An important assunption of this study is that airframtemounted history modules can be transported with the engine Nvith the same degreeof security as manually recorded records are presentlb.
Description
The balance of this section of TasR. II describes figuration in detail. is sys-tern is composed of the three primzr\ elements I'll red in the followi'ng j)".i raphs.
Engine-Airframe Sensor: Current engine and airframe sensors are generlly sat-
isfactory for effective engine monitoring, however, a free air temperatur i'AT)signal must be provided. There are two opportunities for sensor cost savilr:,the chromc-alumel turf inc gas temperature (T(,I') signial is now compensal, i for
cold junction effects within the engine's electronic control unit. If this ulleredsignal is transmitted to the D&CM system, rather than the unbuffered chrome-alumel sig-nal, then the need for duplicate cold junction compensation circuits is
eliminated. Additional,, :i significant (,'st saving can be achieved by avoiding theuse of a dedicated pressurC transducer wit!hi: the I)&CM computer and extrictiang
pressutre altitude data instead tror t0( altimeter-transponder interface.
- .1

11h, 1ask I portion of this study indicated that numerous UlI-OA operations were
intetrrupted hy false or misleading signals from the magnetic chip detector. Thistj.:pori specifically recommends that the present blind chip detector be replaced
with a discriminating detector. The ideal device will sense the presence of eachchip as it circulates through the oil path and subsequently capture it for on-the-
ground analysis. Interfacing this type of detector through a computer to a cockpitdisplay presents a unique opportunity to provide truly reliable, quantitative assess-mants of engine bearing condition. The display possibilities are discussed in a
later section of this report.
Computer Functional 11e uireni ts: Primary computer functions include the con-ditionhig, mltiplexing, conversion and smoothing of input data, th' torage of this
data in appropriate files, the processing of data via ap)ropriate a4g. , ithms, thetransfer of data to the cockpit display, and finally, the storage of historical infor-
nmation in nonvolatile memory. Ancillary lunctions include self-caliration and
self-test.
This computer is the basis of the recommended f)&CM system. A small, low-cost, airborne processor dedicated to engine history measurements and health
indicator test (HIT) check calculations. Because these tasks utilize only a small
fraction of the computer's proce ssing power, it is important to consider othertunctions that might be performed at a very modest increase in recurring system
costs. hi addition to the specialized engine monitoring functions addressed here,generalized monitoi" might examine these subsystems as well:
1. tlyd1NaAtjC 5. Transnmission
-. -ul. Stabilization Aiwlocnt-
;i. I{Ot) :ition
t L "..l t 'i. Speed Trim.
:A number ol helicopter pjertrlmance capabilities can also be calculated and dis-
played, providing taSt aCCuSS to ant electronic, on-board operator's manual. Al-
though1 thcsc require ctlucti\ e \%eight and true-airspeed transducers, it seer-b
likely that sensors of this I\ pe, accep)table to the Army, will emerge ii, the coming
years. E;xamplcs of the local and I'lAlOte site )l-anCters that might he computedby the lrdWarill-, deu;cribcd it) t hi CtL-olM include, Iotr Iornal and for engine-out
conditions:
1. l %1-C ( ut-0 o- - i t2 r hi - Ground EIfectLflcci Wei") "'im .eight Margin.
- 7,6

3. 1 over In-u round Ltfect. 7. Obstacle Clearance.Power Margin, .. Weight ,and Balance.
.1. Power Available. I. Ilook Load.5. Vertical Climb. 10. Wind and True Air6. Best Airspeed Climb. Speed (TAS).
Finally, the application of this computer to basic navigation calculations is both
feasible and cost effective, and may increase aircraft utility under infrared radi-ation (IFB) conditions. Possibilities include the co'rputation of luel used, remain-ing, range remaining and multi ,inensional area n igation.
Computer Hardware Requirements: A detailed block diagram of a system whichwill meet the above goals is illustrated in Figure 10, while a potential package foravionics bay-mounting appears in Figure 11. Removable memory modules for usewith this package are shown in Figure 12. This is oily one of many configurationsthat could be effective; and as the number of microprocessors, data acquisitionand memory elements proliferate rapidly, no attempt is made here to identif\individual components. It does seem likely that the D&CMl system, when imple-mented, will incorporate twelve-bit analog-to-digital convcrsion, one (or possiblytwo) eight- or sixteen-bit micropr-ocessors, and a serial data link to the cockpitdisplay.
Software lCqtUirnients
High level soltware functions of the i&C M system are describe, d below:
1. Synchronous Soft \aLr: The synchronous soft ware modules are tiier-driven and prflorm the exv.mi\e and task oriented D&CM functions.These include the acqtuisition. smoothing and conversion of ra\x dlta.self-calibration, (isp1a3 ut datillg and refreshing )lus D CNI statusmonitoring and Idalt isolation.
2. Data Base: A\ m:!jo portiton (t !)i t)- C 7D soft~ are consists of tables.lot 1%,2rsioll lactol'.:. ,et 1,oiwn , ,i jd disjlay format s. Of tlese, stored.
alter t de. (lat', \ lACs xi-lI ,:icc the greatest memory capacity. Thesetables inclu(d. tow-c\c , tcifiueI, tinic-lLumperatui'e integration, and)o\er a it$1fl w'1 t ail'act c' tat 1).
3. .SynC'110onOu S 11-t v, a: The i;jt c'cii; )t-gcnerated pnocesses requiredfor D& C AI operatlion include .ahculations to derive and display crew-requcsfe(, ,,i4 c ial Sliatus, o0 comfi lte a1nd trMster to memoryweiglted ili"ue exCI s, and to a nntlleilate timc-temperattwne extremes
lie- 1-a5h, -
I
.,1

"-4-
712
rJ2
-L4

All
Will

0
C.0
C)
C)
0
2C)
rr
N4-4
C)
EL
V
A) ~± ~ liii)

Data Buses
Engine-side communications with the D&CM computer are expected to be similarto those that now exist in the present UH-60A, at least for the near term. TheUH-60A data that is normally routed to the cockpit indicators would simply beextended to the computer.
On the cockpit-side a straightforward, low-speed serial data link is anticipated;however, the system is amendable to any communication protocol likely to emerge.Possibilities include 1553B, r-f frequency-division multiplexing and fiber optics.The latter seem likely only if a successful helmet mounted display can be de-veloped.
Cockpit Display Systems
General Electric envisions marked advances in helicopter instrumentation anddisplay media during the coming years. These advances will largely be drivenby ever increasing nap-of-the-earth flight operations and the increasing complexityof helicopter subsystems. Particular risk areas include overtorque and over-temperature situations that arise during potentially hazardous flight conditions.
Four types of cockpit display are possible candidates for advanced helicopterapplications. All are multifunction, computer driven devices which differ largelyin the scope of data that might be displayed. The penetron color (cathode ray tube)is a likely candidate and the helmet mounted display, if it can gain pilot accept-ance, is another. The use of audio advisories has received some acclaim fromhelicopter pilots interviewed by us and deserves further investigation. Each ofthese alternatives relate to the entire airframe as a system and to address themindividually is beyond the scope of this report. A single, dedicated display isbest used as an example of how an effective D&CM system might be used andserves as a baseline for the following discussion.
Due to space limitations and environmental conditions, any CRT display dedicatedonly to engine monitoring is not acceptable. Reasonable alternatives include gasplasma devices which have inherent problems under bright light conditions andliquid crystal displays. The latter have emerged as the best candidates for Boeing767 engine monitoring and are recommended for dedicated military helicopter ap-plications. An illustration of a cockpit display employing this media is shown inFigure 13. A detailed description of its operation follows:
- 59-

750
C4
600

Systcti Operation
As noted earlier five parameters for each engine are continuously monitored as
are two airframe signals. These are:
1. Magnetic Chip Detector
2. Turbine Gas Temperature
3. Gas Generator Speed
4. Power Turbine Speed5. Torque6. Free Air Temperature
7. Pressure Altitude
These signals are sequentially scanned each 250 milliseconds and the resultant
data transferred to memory. Subsequently this data is proccssed and the results,tabulated below, are also stored:
1. Health Indication Test - lIlT
2. Magnetic Chip Tally - CHIPS3. Power Margin - PM
4. Low-Cycle Fatigue - LCF
5. Time at Temperature Index - TTI6. Engine Hours - IIRS
Three ol these parameters, power margin and health indication (automatic per-
formance nionitor), and chip tally (discriminating chip detector) are of primaryinterest to the flight crew, while low-cycle fatigue, time at temperature index,and engine hours would norm'ally he accessed only by the ground crew.
Figure 14 illustrates possible data formats that might be accessed from memory
via the cockpit display. After power turn-on the l)&CM system is active but thedisplay is blank. Sequentially depressing the square switch in the lower, right-hand corner of the indicator produces the following data outputs:
BLANK
Hill,IIH PCHIPS
PM
ILANK
- H1 -

KHEALTH MAGNETI 'INDICATION CHIP
TEST TALh
Pi U
POWER LOW- !EMARGINl FAT'
TIME-TEMPERATUREINDEX
Figurc 14. l\Epic d (Jockpit Read(o~lt M MIA)(.!I)splayv Moduic.
(;2I

The interpretation of each of these displays is discussed in the following para-
To the right of the square pushbutton is a smaller round switch mounted nearly
tlush with the panel. This would normally be used by ground crew personnel tosequentially access the following data:
BLANK
LC F-1
LCF-2
LCF-3
LCF-4
LCF-5TTI
HRSBLANK
LC F-I
In addition to the manual selection of data, an automatic call-up feature is also
recommended. As one example, chip warning would flash on the display regard-
less of what information was being normally displayed. A summary of each
functional output is described in the following paragraphs.
Health Indication Test (Automatic Performance Monitor): As shown in Figure
14(A) this mode of operation is identified by the letters tIT and two three-digit
numbers which represent engine power degradation from an as-new or as-installed
baseline. In computing these numbers measured torque is corrected for standard
day conditions and compared with the original torque associated with the corres-
poniding turbine g i-; m, 'npeeratures. These computations are valid only when the
engine has stabilized at a particular operating point. As a result the percent
degradation th:it is displayed is a measure of engine health at the last point in
time when the engine was determined (by the processor) to be in a steady state
condition.
There are several methods of loading baseline data into the processor. The first
is to design in a fixed baseline that is representative of all engines. This method
is not favo red due to the known variances between similar engines.
-. 0;;

A second method is to trim the processor via thumbwheel swithhc6 when the enginei.. installed so as to display 100 percent power (or 0 percent degradation).
IFinally, a third method is to switch the processor into a baseline data mode andtun the engine through its torque range to acquire the baseline data.
A combination of the first and third methods is preferred, using a de igned-inpower performance limit augmented by measured, as-installed torque.
Magnetic Chip Tally (Degaussing Discriminating Chip Detector): Task I of thisstudy noted that the false alarm rate for UH-60A aircraft was inordinately high.
'he degaussing discriminating chip sensor described at the end of this section
partly alleviates this problem and in conjunction with the proposed display should
xirtually eliminate false alarms.
The recommended system maintains a tally of the number of chips detected during
the past hour of engine operation and can be displayed by the crew if desired.Should the number of chips detected during the past hour exceed a preset level.,
this information would flash on the dispay. At power shutdown tbo tally would bestored in nonvolatile mnemory and subsequently referenced during 1 he next hour
of operation.
Power Margin (Automatic Performance Monitor): Power margin i:. easily coM-
puted from D&CM system inputs and is included here as a cost-free benefit. Asused here power margin is a measure of the surplus or deficit of power necessaryto transition out of ground effect under no-wind conditions.
Available power is easily computed from health indication data, and gross weight
is calculated while hovering in ground effect. One method of indicating this flightcondition is to pull the square sequencing switch on the cockpit indicator.
Although not specifically addressed here, the usefulness of the power margin dis-play could be enhanced by an additional airframe input, true air speed. This pos-
sibility should be evaluated if future aircraft are equipped with such sensors.
Low Cycle Fatigue (Engine Lile Usage Monitor): Five low cycle fatigue talliesare maintained fur each engine and can be accessed in two ways. The data can be
directly read from the cockpit display or. alteniately, the memory module thatholds the data can be physically removed. The latter feature is desirable if an
engine is removed from an aircraft for shipment to intermediate or depot facilities.
- (;.I -

Fiwi Tnperature Index (11TI) (Overtemperature Monitor):Smlry alJ! 11InC-tCIIujnrAltUre index counts is maintained for each engine. The informationI, aut!Ussed inl thle sameI fashion as low-cycle fatigue data and share the same
fluillOP'Y modules.
This is the one maintenance parameter that should be flashed to the cockpit: first,if TTI counts ex-ceed a predetermined total and second, if the 'I'llT total is beingincremlentedI above a certain rate.
Engine flours (Enpine Life Usag.. Monitor): Engine flours are read in the samnefashion as LCF 'TTI data and are stored in the same memory modules.
G round Support Eqipment
Although tile airborne portion of the D& CAI system is self- supporting at the unitlevel, there is a need at intermediate and depot facilities to read memory modulesthat have been returned with engines and to program modules that are being re-ttrne(d to thle field with repaired engines. The associated ground support equip-ment, is expected to closely resemble the airborne systemn except that the hardwarewill be packaged as a single unit for ground use and that a small keyboard will beadded for data entry.
Systems Pa rameters
The following parameters are forocazl for thle Djiagnostic and Condition MonitoringSystem:
Airborne Di spl ay Total
Computr Module _ase
Dimensionis (11 x Wx DI) -in, 2 6 1-1/2 x 3-1/8 x -
4-4 '/2
Volume - Cu in. 1129 21 -
Weight, - pounds U.U0. 7
Power - Watts - 10
NMTBF - hours --- 9000
fl~- ours- iDepot --- 4. 0
6 5-

DEGAUSSING DISCRIMINATING C HIP DETECTOR
Background
The Task I findings reported at Ft. Eustis in the December 5, 1979 presentationand documented in D&CM Report 7, January 1980 clearly showed the major causeof UH-60A engine-caused mission aborts to be chip detector nuisance signals.The need for a means to reduce or eliminate these events while retaining the cap-ability of the master chip detector to warn of imperding oil-wetted part failureswas evident. Engineering investigations performed two years ago concluded thatthe degaussing type detector concept had the best probability of success for the'700 engine. This conclusion still prevails. At that time, a CIP program wasinitiated to select a vendor and recommend a hardware development program.Funding priorities caused the program to be terminated before the proposal eval-uation was made. If justified by LCC analysis, the recommendation would bemade to reactivate the program.
General Description
The degaussing type discriminating or "smart" chip detector concept is a designto capture, count, release, and then save magnetic debris. For the T700 engineused in the Black alawk it is assumed that a single capture and release event in oneflight or in one or more hours of engine operation would be considered a randomor nuisance event requiring a visual chip detector inspection but not causing amission abort. Three or more chip signals, however, in one flight or one hourof operation would trigger a fault signal indicating a possible failure in processand requiring a power reduction and possibly a precautionary landing with the pilotmaking the final decision based on his assessment of the situation. This relativelysimple concept can be an important tool for increasing Black Hawk mission effect-iveness and availability.
Nuisance chip signals from the master chip detector are caused by the detection ofbenign magnetic debris in the engine's lube oil system. There are two mainsources of this debris:
1. Manufacturing debris Machining curls and shavinmsflair-like brazing slivers
2. Benign wearmetal "Normal" fuzzLabyrinth seal rubbings
66

LUz.tiUcc .:. A ijiW, Uji,: result froin either: (1) a single randomn chip ur sliverthat is Captured by the magnetic chip detector that bridges the maget gap; or (2)the(, SIaWX aCCUMulation of metallic fuzz (wearnietal) that in many hours may form
bridge across the magnetic gap) (not likely in the T700 because of . -micron fil-tration). A chip) signal resulting from either the random sliver or loe slow debrisbuildupJ Will normally not occur more than once in any flight. By cormparison,failure debris from a bearing or gear will be continually generated as thle failureprogresses. The present master chip detector cannot differentiate between a ran-dom event and the continuous debris greneration situation and, therelore cannotdiscriminate between benign debris and failure debris. Nuisance chip signalsare the greatest contributor to i11-60 A engine caused aborts.
Ihei followving technical description is based on material from a vendor's brochUreand is used k\ith his permission as being representative of the type of hardwvarere(jUired to perform the degaussing function. The description also is based on a
stand-alone" system with at separate electronic signal processing module, whereasthe D)&CM approach is based on processing the chip detector signals in a micro-processor based box that performs several other functions. Both designs arepractical.
Hardware Description
2lagtwtic Particle Sensor: T'he miagnetic particle detector is a cont.; - lirting,resetuthie desi. -i which emiploys ai high energy samiarium cobalt j)crni:cIIeLLt mnagcmetto produce tie .,ril, Ii,01cleto fj2e,. magnetic field needuee Lo pull
magnetic debris from the rapidly moving oil streamn. Contact spacing i : such thata magnietIL. particle 0. 065 inches in miaximumi dimension will b~ridL, the contactsand produce partial short circuit.
'Fhe detector 1'cs(- teature iza coil w~oUnd .IrOund the detector core. When ener-gized with .1 current p01 se of the corr-ect polarit, tl.a, field p)roduced by the per-manent macnmet is momnentarily forced to z~ero. When this occurs, a caIpturedparticle2 is relemet ,d and entrained in the oil streami. A second nonresetalble cali-bra tion 4aj, is contained w\ithin the dectector and positioned donmstreami relativeto the resetalble gal) so thatI jarticlUS Will be perJIl anen~tlN captured and not allow edto float1 treL(- V.ithin tOe detector screened area.
Samarium echl I. perm anent im-anmaterial was selected for this detector appli-cation becauIse Of its uni(Ue aility to withstand at depaussing (opposite pjolaritymnagneto-motive force) field and spriing back to its full iin.gnetic strength once thedegaussing fHeld i a removed.

111C reset feature described above is Lique because only a shurl currunt pulse ofless than I amp and 15 seconds duration is required to release a captured particle.-ncrgv, cosupin and dissipation is therefore very small cormpired to alternate
approaches which use a continuously excited coil to produce the c- ielction field.The pulse reset feature allows a higher continuous level of capture field than Nkouldbe possible wNith a continuously excited electromagnet approach bCcause the pulsereset coil can he driven to a much higher instantaneous degaussing current levelwithout causing overheating. Further, the p~roposed approach is iail-safe sinceparticles will always be collected across the permanent magnet field whereas theelectr()magtiet approach w\OUld I A colle(ct Particle,, if the excitationl eUrient Iilic
W~5shorted or open circuited.
Figure 15 shows the detector cross section. Th'le unit has a threc>-\iilC elect rni(;d
interface and has mechanical1 interface details identical to the noniresettalile devicecurrently used onl the T700O engine
Electronic Module: The electronic module senses when a particle has bridged thedeLtctor contacts, inlitiates theV rest? funct"ion, zand turns on one I'e OIIC-11otil'
counltdown1 timelr chlips. Anl energ!isco counter rums for the One tu iod atnditoniaticalIN resetS. If SuIcceSsive particles are e.Alected suIch 0! Al three
COLUItel'S arc operating at once, a wanting circuit is turned onl :,w i.( mains on untilm1W~aal'lV reset. No wvarning occurs it the first coLunter runs t tgh its one-hourcountdown cycle before the third counter is turned on.
Circuit components tused in the electroaics miodule are hihreliability. off the!shelf, lo%\ cost cleices. For prototvpe flioghtworthv units, onl\ one printed c:ircuLitboard i-eis.;urhig ;. iches bY 4 inches- will he required becaWu Of the nimllum 01components involved. Circuitr 'y is containled withinl a gaUsketed. drawn alu311inulmenclosureU, aS ShownU in Figure 16. A block dia-ram anid cir'cuIt schem~latiC forthe electroic m',odle arc provided in F.igurel's 17 and 1>. Possibleprdcinfigurations for the elctronlic m~odLe, containing electronics Ion two enlgines, Xre
shown jin Fig~ure 19.
Sytem Operation
4111C Hmagnetic dchlri. .- U litl S stem is anl engine condition momi drnad tor kt:c-
ter. li~.2e lie~t (1)fI oil-wene d p)arts in tHie '1.0 tIongine. '111 S.NsiC1en is a I o -
conipon nt -onifi-unoaion (o ulis4tinlg 01 dectoCC[r \Vhieh Motunts inlto anl estncutvit, in the accessory igearhox, of the T700 engine and an ulci ronic module which
.3 mounted at11 soi r'otelcaion ill the airfraime (see Figure :20).

2rZ: LL -L/) CJ) Z
LU) C)U)-4iLh
Li C)C)
CD.
-j~
a: p.CD z
C,
C) -2:2
LC)L
( /H-

-
(0
CDC
-cn
// / 1J
/:' / -'KJ Nj

CD.
o b
Ln --
wDcl C.
L~u.Cl -I

rj
C"JA
LU-
_ __ I +
-D -4CD
(\ 2-', w
C'D
L/) CD CD 1
Lt 7572

0
49bi
0t
19Q

LI
(3
LJJ
00C)i
C~i'
++
C-))
W Uij -
744

Magnetic particles carried by the engine lubrication stream are collected by aI rong permanent magnet field in the detector. Electrically isolated circumfer-III iid contacts are configured as part of the magnetic circuit as shown in Fig-
ure 15. Because the highest gradient magnetic field area is arranged to be directlyacross the contacts, magnetic particles that enter the field are pulled out of theoil stream and collect across the gap. Debris of sufficient size will bridge thecontact gap and yield a partial short circuit.
The partial shorting condition is sensed by a comparator circuit in the electronicsmodule. Other circuitry in lur. initiates detector 'eset (particle release) andenerg z," one of three, olne-hoUr countdown timers. A warning signal in the formof a solid state swvitch closure is established if the collection rate for a specificsize range of debris is three particles per hour or greater. Warning switch clos-ure can be used to turn on a remote master warning lamp and the system remainsin the warning mode until reset manually by a push button or other switch closureMeaus.
Tlw. detector re,,et feature is an important part of the proposed system. Reset isaccomplished by energizing a coil in the detector with a current pulse. When en-ergized, the coil produces a magnetomotive force in direct opposition to the per-manent magnet field, forcing the field momentarily to zero. At zero field, anyparticles collected across the contact area are released, entrained by the oilstreani and then recaptured by a second nonresettable permanent magnet field,shown in Figure 15. Detector reset does require a moderately flowing oil streampast the collection gap to carry released particles down stream. A released par-ticle is otherwise immediately recaptured under static oil condtions and this mustbe avoided. A system 23 V dc excitation lockout will, therefore, be required forengine OFF or subidle situations.
Operation of the resettablc magnetic circuit can best be described by referring toFigure 21. The solid arrows shown in View A of Figure 21 are representative ofmagnetic flux produced by the thin cylindrical samarium cobalt permanent magnetlocated at the center of the core. This material has extremely high energy com-pared to Alnico 5 (see B-l1 curve comparison in View B of Figure 21). For an op-erating load line of 0. b, the samarium cobalt magnet generates flux densities higherthan 3000 gauss whereas a conventional magnet would produce below 500 gauss.Samarium cobalt also has a unique characteristic associated with its intrinsic B-I]cure. Ba-icallv, because of its intrinsic properties, the material can be subjectedto a demagnetization force (dashed lines in View A of Figure 21) that drives themagnet field to zero without loss of original magnetic strength once the degaussing

VIEW A VIEW B
ALNICO V-,,
INRNI 8KG
N - NORMAL SMC0 5 CURVE
CURVE
8K 600~>./FIELD INTENSITY (H) - OERSTEDS
SAMARIUM COBALT (SMCO5)MAGNETIC CIRCUIT B-H CURVE
VIEW C VIEW DPIT OF
ZERO APTIVE
.6 - 80.5 - 60
.4 ~40
~ .2 iy-.1 -20 5 10 15 ',3O L---i------ -i TIME - SECOND(
0 5 10 15 20 25TIME-SECONDS
CAPTURE FIELD DURINGRESET CURRENT PULSE RESET
F'igure 2t. Magnletic PArticle iDet(ctOr,
-76-

field has been removed. l1is spring back feature makes the proposed degaussingai)proacfi possible. Alnico 5, on the other hand, would be completely dead orcvun ru\'erse polarized if subjected to similar treatment.
Software
No software is required for the electronic module.
T

TASK i1 - LIFE CYCLE COST (LCC) ASSESSMENT
IN TRODUCT1)N
Life cycle cost (LCC) analysis is a valuable technical discipline that leads the in-vestigator to consider and quantify as many cost and savings factors as possible inevaluating two or more alternative designs or courses of action. The D&CM as-sessment reported herein includes seven LCC analyses that, in each case, estimatethe added costs of candidate D&CM equipment and procedures and the added mainte-nance savings and other benefit: the candidate systnms are estinated to produce.From these estimates, a judgm, it is then made as to whether the projected savingsarc sufficient tu justify the added costs. These LCC costs normally include non-recurring design and development costs, production acquisition costs, and operationand support costs.
The equivalent dollar value of the D&CM system contributions to Black Hawk oper-ational readiness has not been assessed in this LCC analysis. For this reason, the
LCC results may not accurately reflect the true value of D&CM improvements tothe Army. For example, a D&CM svstem that saves four hours of labor for twoAVULM mechanics would show a labor saving of eight manhours at $37. 00/hour or$296. 00 plus whatever saving in engine operating costs and parts replacement costsare estimated. The cost, however, of making available another aircraft to replacethe downed aircraft for that four-hour period may be many times the maintenancecost saings. The need for a method of assigning a dollar value to military aircraftavailability, or conversely, the cost of unavailability has existed for several years.
(n this and l)rcxious GE LCC analyses of diagnostic systems, an LCC evalualionratio has been used as a measure of cost effectiveness. This ratio - CS/C - grosscost sa\ings (CS) divided b.y LCC cost (C) - is defined graphically in Figure 22.Previous analyses of D&CM systems covering a 20-year projected program lifehave used a CS/C ratio of ; or more as in arbitrary indicator of a cost effectivesystem. Ratios below I would be a questionable investment unless there are over-riding considerations which are not readily quantifiable such as aircraft availabilit\and flight safety considerations. Ratios between 1 and 3 define a gray area in whichjudgment, based on experience and the assessment of the nonquantifiables involveddetermine the decision. In the following LCC analyses, a 10-v\ear period was usedrather than 20 years simply because the 20-year projection was not available. Fora 10-year period 1. 5/1 CS/C would appear to be representative of a cost effectivesystem, with the CSiC of 1 to 1. 5 being in the gray area.
I.CC computer models are available for most GE engines including the T700 and arecommonly used to evaluate engine design changes. Experience has shown, however.that Lit; fault isolation is the only D&CM function for which the engine LCC com-iauter models jre useful. Therefore, only one LCC analysis was done using the17Wj LC( mde l-- the coatri,,1 s stem analyzer a ssessment, and \\'th that analYsis,
Idt!u- . , , , ,,q ally. All of the other anai] ses were form-
0itdJ 11" * 8 t wto ni> >; i dy

NETSAVING
L')
SAVINGS
Z2I TOTAL SAVINGS
CS
DESIGN,DEVELOPMENTAND CQUALIFICATION
COST -
<r
ACQUISITION C2 i
OPERATION JAND SUPPORT
C - + --.C. + C3 COST SAVING/COST RATIOC C+C 2 + 3
Figure life (ycle (Cost Sa-ings)/(Cost) Ratio Definition.
- 79 -
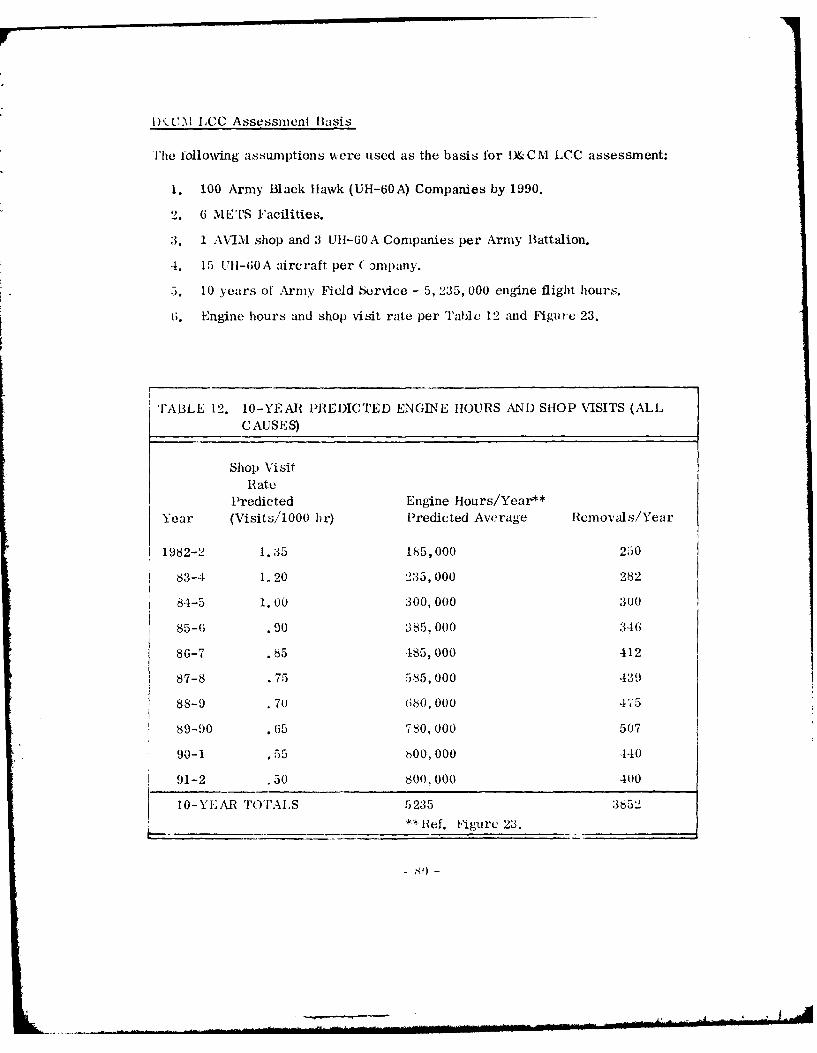
I)'tCM ICC Assessment Basis
l'hc following assumptions were used as the basis for D&CM LCC assessment:
1. 100 Arm' Black Hawk (UH-60A) Companies by 1990.
2. 6 METS Facilities.
3. 1 AVIM shop and 3 Ull-60A Companies per Army Battalion.
4. 15 Utl-60A aircraft per (ompany.
5. 10 years of Arniy Field Scrvice - 5, 235, 000 engine flight hours.
;. Engine hours and shop visit rate per Table 12 and Figure 23.
TABLE 12. 10-YEAR PREDICTED ENGINE HOURS AND SHOP VISITS (ALL
CAUSES)
Shop Visit
RatePredicted Engine Hours/Year**
Year (Visits/1000 br) Predicted Average RCmov'als/Year
1982-2 1.35 185,000 250
83-4 1.20 235,000 282
84-5 1.00 300,000 :300
85-6 .90 :385,000 346
86-7 .85 485,000 412
87-8 .75 585,000 439
88-9 .70 680,000 475
S9-90 .65 730, 000 507
90-1 .55 bOO, 000 440
91-2 .50 00.000 400
10-YEAR TOTALS 5235 3652
R*ef. Figure 23.
f) -

CD dV3A/SOOOI1 NI swfOH 3NION3
CDl
C)
0
co
00
C21
Q)
00
C)
co
00 0
ClD
s~1OOH OOOT/S.LISIA W HS) 31Vdl iSIA dOHS

LCC ANALYSIS CI' MODIFIED METS FOR MPFI
Purpose
The purpose of this study is to compare the cost and operational effectiveness oftwo proposed methods of performing the modular performance fault isolation(MPFI) of T700 engines sent to AVIM for reported low performance that is 71/( ormore below minimum specification requirement as installed in the Black Hawk(as compared to 5% uninstalled). Specifically, the study is to assess the practi-cality of modifying the METS stand to perform computerized MPHI in the samemanner as it is performed in GE factory test cells as compared to utilizing theexisting METS, but equipped with a minicomputer capable of processing andprinting out overall engine performance. Modules would be changed to correctperformance loss based on engine history and accumulated field data. The easeof HP turbine and LP turbine module changes for this highly maintainable enginemakes the latter method worthy of consideration
Methodology
The following methods were usei for the modified METS LCC Analysi-
1. Analysis was performed in accordance with the logic flow cha,shown in Figure 24.
2. Development, acquisition, and operation and suppoft costs and savingsdifferences were computed for modified versus standard METS.
3. METS test times and cost were estimated for standard and modifiedMETS for 10 different low performance conditions (see Tables 13and 14).
4. Five combinations of low performance engine causes were analyzedfor test cost differences between standard and modified METS.
5. Savings by use of modified METS were compared to LCC costs.
1T700 METS Analysis Assumptions
[hc following assumptions were used in this T700 METS analysis:
1. Six METS stands will handle all T700 AVIM requirements throughI1992. All six METS facilities will be equipped with 1700 adapterkits. The cost of '1700 adapter kits is not charged against MPI-.
- 82 -

COMPUTE NUMBER OF ARMYT700 ALL CAUSE SHOP VISITSPER YEAR FOR 10 YEAR PERIOD.
PREDICT PROPORTION OF T700ENGINES REMOVED AND SENTTO AVIM THAT ARE EVALUATEDAS LOW PERFORMANCE ENGINES(LPs).
PERFORM TIME LINE ANALYSIS COMPUTE TOTAL UTILIZATIONOF STANDARD AND MODIFIED METS TIME OF STANDARD & MODIFIEDTESTING OF REPORTED LOW METS AND COMPARE FOR 10PERFORMANCE T700 ENGINES. YEAR PERIOD.
ESTIMATE NONRECURRING IF REDUCTION IN NUMBER OF
DEVELOPMENT AND ACQUISITION MODIFIED METS IS INDICATED-
COSTS FOR MODIFYING SIX METS RECOMPUTE 10 YEAR LCCFACILITIES FOR T700 MPFI. RESULTS.
COMPUTE 10 YEARS OPERATION ANDSUPPORT COSTS FOR T700 MPF1TESTING FOR BOTH THE STANDARDAND MODIFIED METS.
COMPUTE THE ESTIMATED10 YEAR NET COST SAVINGOR LOSS RESULTING FROM MODIFIED METSTHE MODIFICATION; O&S EFFECTIVENESS
OF 6 MODIFIED METS RESULTS
FACILITIES. COMPAREDTO THE fANDARD METS COSTS.
Figure 2.4. Logic Flow Chart for Effectiveness Analysis of ModifiedI ETS for Modular Performance Fault Isolation.
-83/84-
.1

[ TABLE 13. T700 METS MODULAR PERFORMANCE FAULT ISO
Standard Standard ModifiedMETS METS Corn- METS
Manual Data , puterized OverallOverall Per-:Overall 'er- Perform.- Bad iPT UdL2T Bad Cformance -frac ae ~ T M 1' M
Std (C) Moid. 'S-td C) M jSt- (C)1I6' 7 8
Prep and Install T700 4 4 5 4 5 4 5 4
Facility Check-Out andWater-Wash 1 1 /2 2 1 1-1/2 1!-'21 1
Tests - First 2 1-1/2 1 1-1/2 1 1-1/2 1 1-1/2
Data Computation1 - - - K I-Remove and Replace 1-1/2 1-1,/2 1- /2 - 1-1 [HP Turbine
1st Retest or Final Test - - l 1 ijI
Rerr ve and Replace ... . 1 1LP Turbine
2nd Reset1 1/
Reinstall RemovedModules
Remove Engine and 2 2 2-1/2 2 2-1/2 2 2-1/2 2-1/2Prep/Ship 2-__2_2_2-1/__2-1/2
TOTALS 10 8-1/2 10.0 It 12-1/2 13 12 15.0 10
-85/86- /

I :.. . ..-
1 1 1 ' 7
1 1 1 1 1 1
1- ;! !;1 1 1 1 1 1 1 1 1 1 1 I
3 l"2' . '~ ~N
12 1'L) i 1 I1( O r o , q ~ ~ r I 1

TABLE 14. T700 METS MODULAR PERFORMANCE FAULT ISOLATIO
Standard Standard Modified 0METS METS Com- METS
Manual Data puterized OverallOverall Per- Overall Per- Perform- Bad HPT Bad LPT Bad (fornmance form ance anc METS -N .TS M
,_ d Mod. d(C) , Std2 3 4 5 7_
Elapsed Time Hours (1) 10.0 8.5 10.0 11.0 12.5 13.0 ,2.0 15.0
Labor Cost $'s 350 298 350 385 438 455 420 525
METS Operating Hours 3 2.5 2.5 3.5 2.5 4.5 3.5 4.5
METS Operating Cost/Hour 255 260 300 260 300 260 30 260
METS Operating Cost 766 650 750 650 750 1625 1050 1170
Test Cost $'s/rest 1116 948 1100 1035 1188 1625 147011695
NOTE: (1) From Table I
-87/88-
/r

LATION (MPFI) 10-YEAR OPERATING AND SUPPORT COST ANALYSIS
Bad tlPT IBad lPT Bad LPI Bad HPT Bad LPT Bad Comp BadBad Comp &. LPT & Cmllpi &cop & Seals & Seals & Seals Seals
NMFTS METS METS METS METS METS 'METS METSStd (C) Mod. Std(C) Mod Std (C TM,.. Std (C) Mo Std (C)' Mo(( Std (C) M-d Std (C mod. Std (C I'Md.
8 9 to I 12 13 14 15 16 17 18 19 20 21 22 23
15.0 10.5 13.0 13.0 15.0 10.5 15.0 10.5 15.0 16.5 t15.0 16.5115.0 10.5 5.0 16.5
525 368 455 455 525 368 525 368 525 578 525 578 525 368 525 578
5 4.5 2.5 4.5 3.'-' 4.5 2.5 4.5 2.5 4.5 4.5 4.5 4.5 4.5 2.5 4.5 4.5
260 300 260 300 260 300 260 300 260 300 260 300 260 300 260 300
1170 750 1170 1050 1170 750 1170 750 1170 1350 1170 1350 1170 7501170 1350
1695 1118 1625 1505 1695 1138 1695 1138 1169 1928 1695 1928 1695 11181695 928
I'

2. The METS must be converted to 1700 configuration for each test.Note: Since METS service five different engines (T53, T55, T63,173, and T74) in addition to T700 engines, for several years therewill be more "other" engines in service than T700s, therefore,the shared use of one METS at any given location will require frequent
changes in test adapters.
3. As a minimum, every engine returned for low performance will bevisually and borescope inspected for FOD, external damage anddiscrepancies. If okay, the engine will be:
a. Installed on METS and water-washed.
b. Tested for overall performance.
4. For the purpose of this analysis, all engines returned for low perfor-mance are tested for performance only, even though in practice someengines with low performance may have control problems rather thangas path or air seal problems.
5. The percentage of T7700 engines removed for low performance is as-sumed not to exceed 10/ of all engine removals. Thirty percent isalso used for this study as a worst case condition.
6. The standard METS can and will be modified to include a small com-puter suitable for processing overall engine performance without re-quiring major facility modifications. This computer system will cor-rectly and accurately measure and print out overall P700 engineperformance.
7. Present predictions by the 'P700 Systems Analysis are that the mostprobable cause of low performance (LP) will be high-pressure turbineproblems and second most probable cause will be the compressor.Consequently, with the standard METS facility, the MPFI procedureon every low performance engine will be as follows:
a. Confirm low performance with an overall performance test.
b. Change the HP turbine with the engine mounted on the METS.
c. Check overall performance with a second test. If performanceis below specification, change the LP turbine and make anothertest run. If performance is still low, send engine to depot.
-89 -

z. The modified METS will correctly isolate low performance HP tur-bines, LP turbines, and compressors.
9. Neither the standard METS or the modified METS can is late sealwear problems. Seal losses may appear to be compressor, HPturbine or LP turbine problems from the modified METS MPFIcomputer output. Engines with seal or compressor problems willbe sent to the depot.
10. The same number of engines with performance problems will go tothe depot whether the standard or modified METS is used.
11. Depot prep to ship takes 1/2 hour more than for return to service.
12. Engines to be sent to the depot will be shipped with the same HPand LP turbine modules that were on the engines as received atAVIM.
13. The Army will provide calibration facilities and personnel to performinstrument and system calibration tests of either the standard ormodified METS facilities and take the necessary corrective actionto maintain all METS data accuracy within required limits.
14. Performance fault isolation of the 100 compressor using instru-mentation available in the standard METS is theoretically possible.It is not included in this analysis because an estimate of ii seffectiveness is not available and is outside the scope of thiscontract.
Summary - T700 METS MPFI Cost Effectiveness Analysis
The following contains a summary of the T700 METS MPFI cost effectiveness anal-ysis:
Standard Modified
Cost Element METS METS Difference(dollars) (dollars) (dollars)
DEVELOPMENTComputer Specifications 25,000 25,000Software 25,000 50,000Operating Instructions 25,000 75,000Facility Design 10,000 75,000Check-out and Software Modifications 15,000 50,000
100,000 275,000 .175000
- 90 -

Standard Modified
Cost Element METS METS Difference(dollars) (dollars) (dollars)
ACQUISITIONBuy Computer 25,000 75,000Facility Modifications and C. 0. 50, 000 200, 000
Total Each 75,000 275,000
x 6 450,000 1,650,000 +1,200,000
Cost Difference (Added Develop-ment and Acquisition Cost ofModified METS) D&A $ 1,375,000
OPERATION AND SUPPORT
Maintenance: Assume 500 hours/year average T7700 usage and maintenance cost(including calibration) labor and material at 5% of METS replacement cost.(Estimated at $1,250, 000)
7P700 adapter kit installed $ 350, 000METS Computer (overall performance only) 75,000METS MPFI Modification for each facility 275,000
MPFI Computer Software Maintenance 15/hourMiscellaneous Materials 10/hour
Standard METS (1, 250, 000 + 350, 000)(0. 05/500) + 10 - $170/hour
Standard METS with simple computer (1, 250, 000 + 350, 000 + 75, 000) (0. 05/500)+ 10 - $177.50/hour
Modified METS (1, 250, 000 + 350, 000 + 275, 000) (0. 05/500) + 25 - $212. 50/hour
Fuel: Average power setting 900 hp at SFC of 0.55, 7 lb/galJP-4 at 1.18/gallon, J P-5 at 1.32/gallon. Use 1.20/gallon.900 x 0. 55 x 1/7 x 1. 20 $84. 84/hour. Use $85/hour.
- 91 -

Cost! Standard METS - 170 + 85 + $225/hourOperating Standard METS with computer 178 + 85 = $263/hourIlour*: Modified METS 212. 5 + 85 = $297.50. Use $300/hour.
Savings
Case 1 70% - Low performers (LPs) have bad HP turbine20% - LPs have bad compressor10% - Miscellaneous faults
Result: 10-year operation and support cost saving for Black Hawk fleetwith modified METS if:
a. 30% of removed engines have low performance-$27, 977b. 10% of removed engines have low performance-$ 9,326.
Case 2 70% - LPs have bad compressor207o - LPs have bad HP turbine10% - Miscellaneous use average - all others.
Result: 10-year operation and support cost saving for Black Hawk fleetwith modified METS if:
a. 30% of engines are removed for low performance-$449, 912b. 10% of engines are removed for low performance-$166, 304
Case 3 Average of all ten cases (see Table 13).
Result: 10-year operation and support cost saving for Black Hawk fleetwith modified METS if:
a. 30% of engines are removed for low performance- 184, 960b. 10% of engines are removed for low performance-$ 61, 653
Case 4 Bad LP turbine and compressor
Result: 10-year operation and support cost saving for Black Hawk fleetwith modified METS if:
a. 30% of engines are removed for low periormance-$603,432b. 10% of engines are removed for low porformance-S201, 144
*NOTE: It is assumed that the same two men will perform all engine and facility
preparation, assembly operation and evaluation tasks at METS. Their labor costat $17. 50/hour each will be applied to the whole M.PFI process, not just to thetime METS is running and is, therefore, not included here.
- 92 -

Case 5 All LP engines have degraded compressors
Result: 10-year operation and support cost saving for Black Hawk fleetwith modified METS if:
a. 30% of engines are removed for low performance-$667, 012b. 10% of engines are removed for low performance-$222, 337
Results - Operation and Support Cost Savings
Ten-year operation and support METS costs savings for modular performancefault isolation using modified METS with MPFI capability have been comparedwith use of standard METS with computerized m' erall performance measurement.The following tabulation of types and frequency of problems that could exist inthe T700 engines returned to AVIM for low performance are listed in decreasingprobability of occurrence.
Case lb - 10% of shop visits are low performance engines - $ 9, 326Case 2b - 10% of shop visits are low performance engines - $166, 304Case 3b - 10% of shop visits are low performance engines - $ 61, 653Case 4b - 10% of shop visits are low performance engines - $201, 144Case 5b - 10% of shop visits are low performance engines - $222, 337Case la - 30% of shop visits are low performance engines - $ 27, 977Case 2a - 30% of shop visits are low performance engines - $498, 912Case 3a - 30% of shop visits are low performance engines - $184, 960Case 4a - 30% of shop visits are low performance engines - $603, 432Case 5a - 30% of shop visits are low performance engines - $667, 012
Cost Savings/Cost Ratio
Most probable Case lb = $9,326 0.006/11,375,000
Maximum possible (least likely) Case 5a 667, 012 = 0.49/11,375,000
Conclusions
The results of this preliminary analysis clearly shows that it is not cost effectiveto employ a modified METS for performing T700 modular performance fault iso-lation by automated gas path analysis at the AVIM level. Probably not more than
- 93 -

ten to fifteen percent of the estimated $1.4 million nonrecurring cost differentialwould be recovered in 10 years of operation. Several additional factors not in-cluded in the analysis could further reduce thu payoffs are:
1. The probability that the modified METS will not be 100% correctin performance fault isolation.
2. The difficulty in maintaining calibration of the sophisticated MPFIinstrumentation and data processing systems in widely separatedAVIM locations.
3. The probable increase in facility down time resulting from addedmaintenance required for the more complex facility.
4. The accumulation of engine historical data with time and the possibilityof isolating low performance compressors may improve the effectivenessof the standard METS.
The modified METS will shorten the time estimated to perform MPFI on T700 en-gines for many of the cases considered in the time-line analysis of Tables 13 and14. No allowance, however, was included for the additional maintenance time pro-bably required for the more complex facility. A worst case estimate of 10. 4% timesaved probably represents the best Lhat could be expected. Some added improve-ment in modified METS utilization may occur as experience is gained in use of thefacility, particularly with regard to detecting seal leakage if its occurrence shouldbecome a significant factor in future 'P700 performance loss events.
Recommendations
1. Do not modify the Army METS facilities with the special instrument-ation and computer hardware and software necessary to isolate by testand gas path analysis the module or modules causing low T700 engineperformance.
2. Implement a program to equip each METS facility with a computerand automated data acquisition system to perform overall engineperformance computation, display, and recording.
- 94 -

3. Utilize troubleshooting logic as in Assumption 7 (pg 89 or as future
field and factory experience dictates.
4. Fund a GE engineering field service representative who will analyzefield service reports in order to determine the 1700 engine perfor-mance deterioration trends. These data and their evaluation by GEsystems and performance engineers will improve the likelihood ofpinpointing defective modules based on overall engine perfnrmancedata.
NOTE: This same representative would cover the acquisition of lifeusage data for the existing Engine Life Usage Monitors (ELUMS).
LCC ANALYSIS OF SLAVE CHIP DETECTORS FOR 1700 OIL-WETTEDPART FAULT ISOLATION
Background
The performance of modular fault isolation for T700 engine oil-wetted part prob-lems was identified in Task I as a candidate D&CM function worthy to be evaluated.A method of performing this function and specific hardware recommended for itsimplementation was described in Task II. The equipment, an existing GE designedsystem called the transistorized chip detector system (TCDS), has been in suc-cessful use in GE's Lynn plant in TF34 and F404 engine test cells and is easilyadaptable to '1700 engines and the Army METS facilities. It is also adaptable foruse in installed engines at AVUM but is not recommended because of the cost ofequipping all Black Hawk Companies with TCDS kits at $10,000-15, 000 each plusthe aircraft down time that would be required to install the system on a suspectengine and perform the testing. This LCC assessment therefore, is related tothe use of the TCDS at the AVIM level.
The master chip detector is the primary detector of oil-wetted part failures. Theprobable sources of magnetic failure debris are cold section, AGB or LP turbinemodules. (The hot section contains no oil-wetted parts.) Modular oil-wettedpart fault isolation of failures occurring in any of the three bearing sumps - A-,B-, or C-, can be done by detecting the presence of metal debris in the sixscavenge pump filters. There is no scavenge line from the AGB - only a gravitydrain to the oil reservoir. It is not feasible to fault isolate AGB failures inthe same fashion as could be done for the three sumps.
-95 -
.1
The current maintenance policy for engine oil-wetted parts events at AVIM is asfollows:
1. Engine having cold section oil-wetted parts problems - bearing, sealor PTO drive failures go to depot for repair.
2. Engines with AGB or LP turbine module oil-wetted parts problemsmay have that module replaced at AVIM provided the engine testsspecified in the Maintenance Manual (TM55-2840-248-23) are fol-lowed.
Maintenance Options With TCDS
Upon receipt of engines at the AVIM shop with reported oil-wetted part failures,detected and/or confirmed by AVUM Troubleshooting Procedure 39 (Figure 26).The following maintenance actions could be taken at AVIM:
1. Inspect scavenge screens for indications of debris. If debris is onscavenge screens 4, 5, or 6, replace PT module and test perTroubleshooting Procedure 27 (Figure 27).
2. If debris is on screens 1, 2, or 3 indicating A- or B-sump failurelocation, ship engine to the depot.
3. If no debris is found on any screen or there is no report of debrisfound on screens at the AVUM level, there are two options:
a. Ship the engines to depot as specified in Maintenance Manual.
b. Install TCDS sensors and wiring harness on engines and runMETS test to isolate debris source. If there is no debris onany of the six chip detectors, remove and inspect the AGBmodule.
(1) If debris source is A- or B-sump, ship enginne to depot.
(2) If debris source is C-sump, replace PT module.
Trade-offs of Option a vs Option b is the subject of the LCC Assessment.
- 96 -

CHIP DETECTOR LIGHT COMES ONDURING ENGINE OPERATION BUT NOCONTAMINATION FOUND ON DETECTOR.DISCONNECT GREEN CABLE FROMCHIP DETECTOR. CHECK COCKPIT LIGHTWITHi AIRCRAFT POWER ON.
LIGHT ON LGT W
FRO OREE CAENGI E CONNECTOR G"LA TPP -4 E
RESSTACE USTBE T AD RI ~ CHECKHI CCPIP T -4? 4LEAST 1000 OCKP T LLECU PA AICRFTPOERO
J 97 E%

DIAGNObTIC AND CONDITION MONITORING SYSTEM ASSESSMENT FOR ARMY --ETCIWOCT GO N J JORDAN OAAK179C-0020
UNCLASSIFIED RGOAE0058 NG.-.22 flfflfflfflfflfflf

11112.011111'-.III1 ul'- IIIII
MICROCOPY RESOLUTION TEST CHART
NATIONAL BUR[ALI OF Y!T NDARDS 19U3 A

CHIP LIGHT ON.FAULT IS ELECTRICAL NOTMECHANICAL. WITH GREENCABLE DISCONNECTED FROMCHIP DETECTOR, CHECK PANELLIGHT ON WITH METS POWER ONi LIGHTON IGH° T°OFF I
FROM GREEN CABLE CONNECTOR TO CHIP DETECTOR
LES C0,0 HMS, OTERWLISE HTPN IH NWT
SI RHT F F I N L IGH T O N R -C U I TO N
ICHECKG ONN 1IG TN OFFF
(PRREMOVE (PARA 8-43),GREEN CABLE ENGINE CO1NNECTOR i CAN REISAL 8-H4)
W3J]. RESISTNACE MUST BE AT DETOR (PARA 8-47)LEAST 10,000 OHMS, OTHERWISE i DTTO(PR8-7
THERE IS A SHORT CDRCUIT A
REPLACE CHIP l FLEX GREEN
I eDETECTOR CABLE TO(PARA 8-42)t CHECK FOR
INTERMITTENTTROUBLESHOOT SHORTS
REPLACE GREEN METS
CABLE (PARA 7-35) ELECTRICALSYSTEM ACCORDINGTC METS MANUAL
[LIGHT DOES NOT ILIGHT FLICKERS}
| FLICKER OR OR COMES ONLCOME ON
REMOVE (PARA B-43), CLEAN AND METS
(PARA 8-44) AND REINSTALL ELECTRICALRELEGENCHIP DETECTOR (PARA 8-47) CONNECTORS.RELCGEN
LREPLACE ANY CABLE (PARA 7-35)
DAMAGED PARTS
' 1 MAKE CHECKS REQUIRED
REPAIRACCORDING TO
' METS MANUAL0
REQUIRED -- I ONT[NUF TO OPIRA71E0PARA 1-144) T700-0857-3
Figure 26. AVIM Troubleshooting Procedure 27 - Electrical ChipDetector Light (No Contamination Found).
-98 -

Oil-Wetted Part Predictions and Assumptions
1. For a ten-year period - mid 1982 to mid 1991 - there are predictedto be 3852 engine removals resulting in shop visits to AVIM and/ordepot. Refer to Table 12 and Figure 23.
2. T700 predictions based on service engineering data show oil-wettedpart components all-cause failures resulting in 32% of T700 shopvisits (SVs) or 1233 SVs for the ten-year period.
3. The presence or lack of metallic debris on the six scavenge screenshas a major effect on the procedures and costs to fault isolate oil-wetted part problems. However, little hard data is available onthe subject. Working with available information, the following isthe basis for this analysis:
Oil-Wetted Part % Failures ResultingComponent in Scavenge Debris
Bearings No. 1, 2, 3, 20%5, 6No. 4 90%
Seals for A-, B-, C-sump 20%PTO Drive 207
4. The cost of one METS test for oil-wetted part fault isolation is $1000.Refer to METS MPFI analysis below.
5. The cost of one depot test for oil-wetted part fault isolation using theTCDS is $1250 computed as follows:
Assume depot test cell is roughly comparable to the modified METS asdescribed in the METS effectiveness analysis for modular performance
fault isolation.METS Depot
Elapsed prep and test time 10 hr 10 hrManpower 2 men 2 menLabor Cost - 2 men $ 35/hr $ 50/hr
Total Labor Cost 350 500Facility Operation and Support Cost/Hour $ 260 $ 300Test Hours 2-1/2 2-1/2
Total Facility Cost 650 750$1000 $1250
- 99 -

6. The average cost of shipping one T00 from any AVIM to depot andreturn is $1. 00/pound or $1000/engine.
7. The same number of spare engines and modules are required witheither Option a or Option b . No AGB will be replaced at AVIM,only AGB modules.
8. The costs of the TCDS Military specifications qualifications and kitacquisition are as follows:
TCDS engineering and qualification $ 30,000
Kit Cost 15, 000Operation and Support Cost at 750 ea/year
5% year*
9. Oil-wetted part fault isolation testing does not result in secondaryengine damage.
10. The cost of module replacement at AVIM and depot are the same. Itis expected that although the labor cost at depot is higher than atAVIM the depot production facilities and methods are more efficientso that the overall cost is approximately the same at AVIM.
Cost Comparison of Options a. and b
A cost comparison to evaluate cost differences between Option a where engineis sent directly to Depot without troubleshooting, and Option b which utilizesslave chip detector system is as follows:
Option a Option b
TCDS Engineering and Qualification 30,000 30,000Procure TCDS Kits at $15,000 + 50 spares 30,000 (2) 135,000 (9)TCDS Operation and Support at 5%/yr - 10 years 15,000 68,000Depot Diagnostic Tests (977 at $1250) 1,221,000AVIM Diagnostic Tests (977 x 1000) 977,000Return PT Modules to Depot -
( 54 x 415 lb) 22, 000(271 x 415 lb) 112,000
1,318,000 1,322,000
* TF34-GE-400 General Electric trim box experience.
- 100 -

O'Ption (a) Optiog (b)
Cost Saving of post module change tests - 54, 000at AVIM (217 x 250)
Cost avoidance - 217 shipping costs at - 217,000$1000/each
$1,318,000 $1,051,000
Saving:. 1318
1051
$ 267, 000 net saving by Option (b) in ten years.
Cost Differentials: Option (a) Option (b) Difference
$ 75, 000 $ 233, 000 $158, 000
267CS/C = L- = 1.69
158
Conclusions and Recommendation
The estimated saving of $267, 000 in ten years by adopting Option (b) at an addedcost of $158, 000 over Option (a) provides a favorable CS/C ratio of 1.69. Theslave detector system is recommended for use at both depot and METS facilities.
- 101 -

LCC ANALYSIS OF CONTROL SYSTEM ANALYZER SET
Background
The purpose of this study is to determine the long term effectiveness of the ControlSystem Test Set in the Army environment in reducing engine/airframe trouble-shooting maintenance time and prevention of unnecessary removals of high valuecomponents. The T700 Life Cycle Cost Model developed for the Army by GE andused to evaluate ECP submittals has been utilized in this analysis.
Assumptions and estimates have been made based on predicted mature component(engine and suitcase tester) reliability rates and limited operating experienceaccumulated on the engine to date.
Control System Analyzer Description
The control system set consists of two separate units: the T700 engine harnessand sensor circuit tester and the T700 ECU systems tester.
T700 Engine Harness and Sensor Circuit Tester:
The T700 engine harness and sensor circuit tester has been specifically designedfor use with the electrical control unit's S39 Diagnostic Connector for trouble-shooting control system problems with the aircraft and engine in the nonoperatingmode.
Through the diagnostic connector, control system electrical harnessing, inter-connecting components and aircraft interface connections can be tested for opens,shorts and nominal resistance values when troubleshooting engine control systemproblems as directed in Section I of TM55-2840-248-23 maintenance manual.The tester operates on 115 V 60-to 400 Hz power which is availhle at the aircraftsJ-257 utility receptacle in the cockpit or from external sources and will displaya "pass or fail" logic with no additional instrumentation or test equipment required.
T700 ECU Systems Tester:
The T700 ECU systems tester Part No. 4013145-834 is a self-contained test unitspecifically designed to perform functional closed loop tests of the various ECUfunctions, HMU feedback system, aircraft Np speed trim system and providecockpit readout of the TGT, % Np and % torque instruments. All tests are ac-complished with the aircraft and engine in the nonoperating mode.
- 102 -

Assumptions and Methodology
The following assumptions and methods were used for LCC analysis of the controlsystem analyzer set.
1. Control troubleshooting will be performed with the control systemanalyzer set following GE supplied procedures.
2. The LCC savings will be computed based on reductions in the fol-lowing areas affected by use of the control system analyzer set:
a. Number of lay-in spare LRU' s.b. Cost of flightline LRU removed and replaced.c. Engines shipped to AVIM for METS and control diagnosis.d. Personnel training.e. LRU Depot transportation and testing.f. AVUM engine troubleshooting labor.g. AVUM aircraft-engine troubleshooting labor.h. Engine tests following LRU replacement.i. Control troubleshooting at AVIM using METS.
3. The troubleshooting effectiveness at AVUM of the control system harnessand sensor tester is 75% of the effectiveness (and gross saving) of thecontrol system analyzer set.
4. A favorable LCC cost saving to cost ratio for a ten-year period is1. 5/1 or greater. Results between 1/1 - 1. 5/1 may be acceptabledependent on value placed on nonquantifiable benefits.
5. The number of false removals for each engine component capable ofbeing checked by the tester was determined. The number of non-failures was estimated from reliability estimates for a mature (1 x10⁶ engine flight hours) T1 00 engine. The rates are summarized inTable 15.
6. Based on production engine component removal data, it is estimatedthat approximately 95% of false component removals can be preventedby use of the test set. It is felt that a prevention rate of 95% can berealized in the field if the test set is fully utilized in conjunction withthe troubleshooting logic charts.
- 103 -

0000
~0 W ~ 00L0.4 0 0 caO
NO
0 _
40 0. Q C0 4) C(I 0 Q 0 C 14 0 Ci
4 0
Ur) &)0 - 4
~Z
0 0
w2 'Do O L 0
- 4 V4

7. The checkout test time at the depot was estimated for components re-moved and returned as the result of improper troubleshooting. These
values are shown in Table 16.
8. The cost of components used to determine the cost of additional lay-inspares required as the result of false removals is shown in Table 17.These costs are at the selling price in 1980 dollars.
9. Component removal and replacement task times are taken from theT700 Prime Item Development Specifications (PIDS) for LRU replace-ment and multiplied by 1. 84 to reflect expected hours.
10. A ten-year period, 1982-1992, in which approximately 5. 5 x 10⁶ engineflight hours are accumulated was utilized in the life cycle cost study.All other factors used in the LCC model such as labor rates, trans-portation costs, etc., are the same as those being used for life cyclecost analyses of proposed engineering change proposal (ECP) sub-mittals to the Army.
11. Cost of control system tester maintenance has been estimated at 5%of the selling price per year or approximately $1500/unit/year.This estimate is based on experience with GE-built TF34 trim checkerwhich is a modern solid state tester similar to the T700 unit. Theexperience to date on this analogous unit indicates 5% to be a reason-able allowance. On the TF34 trim checker, most of the maintenanceproblems are related to cable and connector damage and it is likelyto be similar on the T700 tester.
12. Three deployment plans for the control analyzer sets will be considered:
a. Option 1 - 110 control analyzer sets will be procured and dis-tributed, 1 to each Black Hawk Company and AVIMshop plus 4 spare sets in a rotatable pool.
b. Option 2 - 110 harness and sensor circuit testers procured anddistributed, 1 to each Black Hawk Company and AVIMshop plus 4 spares in a rotatable pool and 10 ECUsystem testers procured and distributed, 1 to eachAVIM shop plus 4 spares at AVIM.
- 105 -
t . . .J.

TABLE 16. ENGINE TESTS REQUIRED AFTER LRU REPLACEMENT -
FALSE LRU REMOVALS ONLY
Failures Failures CheckoutRate Per Per 5. 5 x Test (1) Cost at106 Hours 106 Hours Hours $225/Hr.
Electrical Control Unit 152 836 .5 94050
Hydromechanical Control 33 182 .7 28665Unit
Yellow Harness 15 82.5 None -
PT Torque and Speed 50 275 .5 30937
Sensor
Gas Generator Turbine 14 77 None -
Sequence Valve 90 495 .7 77963
Blue Harness 15 83 .5 9338
$240, 953
1. NOTE: From TM55-2840-248-23, Table 1-7 "Checks RequiredFollowing Replacement of Parts." Pg 1-142.
TABLE 17. LIFE CYCLE COST SUMMARY FOR T700 CONTROLSYSTEM ANALYZER SET - PREDICTED SAVINGS
Cost Saving1980 Dollars
COST ELEMENT
C2 - Cost of Spare Components (lay-in spares) - 744, 623C 3 - Cost of Flight Line Maintenance (Remove and
Replace Components and Engines) - 12, 511C4 - Cost of Off-Equipment Maintenance (Transportation
of Components to depot, checkout and return toservice) - 959, 070
C7 - Cost of Personnel Training - 35 645
TOTAL (Engine Components Only) - 1, 751, 849
- 106 -

TABLE 17 - Continued
Cost Saving1980 Dollars
OTHER COST SAVINGS
Eliminate 1 engine/company/year shipped to AVIM for Diaxnosis
I/Company x No. of Companies x No. of Years ($1000/transportation + $1000/test)
1 x 100 x 10 (2000) - 2. 000, 000
Reduce Aircraft-Engine Troubleshooting2 Company/Year x No. of Companies x No. ofYears x 6 hours x $35/hr
2 x 100 x 10 x 6 x 35 - 420,000Unnecessary Engine Test for Falsely Removed
LRU's (see Table 16) - 240, 953
Reduce AVUM Troubleshooting Time at $35/hr -
2118 x 1/2 x 35. 00 - 37. 066
Reduce AVIM Test and Labor Cost for ControlTroubleshooting - 200 engines save 1 test hour,2 labor hours each. (263 + 35) x 200 - 59, 600
Total Cost Saved Using LCC Model - 1,751,849Control System Analyzer Set Other - 2. 757. 619
At All AVUM and AVIM Stations TOTAL - 4,509,468
- 107 -
NNW

c. Option 3 -40 control analyzer sets procured and deployed as follows:
1 to each Black Hawk Battalion AVIM - 301 to each METS 6Spares in a rotatable pair 4
Total 40 Control
Analyzer Sets
13. It is assumed that an average of one engine per Company per year willbe shipped to AVIM for control system diagnosis if the control systemanalyzer sets are not available at AVUM.
14. The estimated selling prices of the two control system analyzer unitsin 1980 dollars are as follows:
ECU Systems Tester $17,684Harness and Sensor Circuit 11,771
Set Total $29, 455
15. Methodology for the above assumptions were used in the T700 lifecycle cost model developed by the General Electric Company forthe Army and utilized on ECP and CIP program evaluations andsubmittals. The model was used for engine components since nodata is available to the engine manufacturer on the interfacing air-craft components which form part of the engine control and mon-itoring system.
Additional factors affecting overall system cost effectiveness which cannot be eval-uated by the LCC model are computed separately.
Conclusions
1. The 10-year saving that can be predicted from use of the control systemanalyzer sets in all 100 planned operational Black Hawk Companies and6 AVIM shops for Option 1 is $4. 5 million with a comparable cost of$4. 3 million (see Table 18). The cost saving to cost ratio of 4. 5/4. 3or 1. 04 may not justify Option 1 deployment, however, field experiencewith additional control system analyzer sets could generate data tochange this conclusion.
-108 -
L: ....

TFABLE 18. CONTROL SYSTEM ANALYZER (OPTION 1) -COST AND RESULTS
110 Control System Analyzer S~f. Deployed - Totals
1 to each Black Hawk Company 1001 to each AVIM Shop 6
4 Spare Sets 4
110
Estimated Selling PricesCircuit-Sensor Tester $ 11,771ECU Tester 17. 684
$ 29,455
Development and Qualification $ 100, 000Maintenance and Manual Revisions 100, 000Acquisition - 110 x 29, 455 3, 240, 050Operation and Support Cost at 5'/year for 10 years 1, 000, 000
$ 4, 440, 050
Less 110 Continuity Testers at $7005%/year Operation and Support
Cost for 10 years 115,500
$ 4, 324, 550
LCC Results
Cost Saving 4, 509, 468Cost 4, 324, 550
$ 184,918
CS/C Ratio = 4 5 68 = 1.04/14, 324, 550
- 109 -

2. The 10-year saving predicted for Option 2 of $3. 9 million at a cos,of $2. 1 million and a cost saving to cost ratio of 1. 61/1 is an indi-cation of program viability (see Table 19).
3. The 10-year saving predicted for Option 3 of $4, 509, 468 (same asOption 1) at a cost of $1, 950, 200 and a cost saving to cost ratio of2. 31/1 makes this, along with Option 2, a viable program (seeTable 20). Option 3 requires approximately $300, 000 less invest-
ment than Option 2.
4. There are several benefits that the Army will gain from the use ofthe control system analyzer set that are difficult to quantify; theseinclude:
a. Per hour cost of added aircraft availability because ofmore efficient (faster) control troubleshooting.
b. Fewer false removals of interfacing high value componentssuch as the Marconi VIDS (visual information display system)and the SDC (signal data conditioner) and the N demandpotentimeter.
c. Improvement in troubleshooting due to the ability to test theinterfacing airframe system while fully powered, ratherthan simple resistance and ground checks (particularly TGTindicating systems).
5. The control system analyzer set has several features that make itideally suited to the rugged field usage it will receive if adopted bythe Army:
a. Both units of the set utilize solid state electronics for re-liability and survivability under hard usage.
b. All readouts are simple go or no-go signals - red and greenlights. No meters to read.
c. Diagnostic routines do not require engine operation.
d. All ECU fault isolation cloed loop systems testing and someof the sensor and circuit testing can be accomplished withthe mechanic and test box inside the aircraft.
- 110 -

TABLE 19. CONTROL SYSTEM ANALYZER (OPTION 2) -
COST AND RESULTS
110 Control System Sensor/Harness Testers Totals
1 to each Black Hawk Company 1001 to each AVIM Shop 64 Spares 4
110
Estimated Selling Price $ 11,771
10 Close Loop ECU Testers
I to each AVIM Shop 64 Spares 4
10
Estimated Selling Price $ 17,684
Estimated Program Cost
Qualification 100, 000Maintenance Manual Revisions 75, 000Sensor and Harness Tester Acquisition 110 x 11, 771 1,294, 810
Operation and Support Cost at 5%/yr - 106 units 400, 000ECU Tester - Acquisition 10 at 17, 684 176, 840Operation and Support Cost at 5% - 6 units 53, 052
2, 099, 702
LCC Results
Saving - 4, 509, 468 x .75 = 3, 382, 101Cost 2, 099, 702
Net Saving $1,282, 499
CS/C Ratio $3, 382, 101
$2, 099, 702 l* 61/1
- 111 -

TABLE 20. CONTROL SYSTEM ANALYZER (OPTION 3) -
COST AND RESULTS
40 Control System Analyzer Sets Deployed Totals
1 to each Black Hawk Battalion 301 to each AVIM Shop 64 Spare Sets 4
40
Estimated Selling Price
Circuit-Sensor Tester $ 11,771Closed Loop Test 17, 684
29, 455
Development and Qualification $ 100,000Maintenance Manual Revisions 100, 000Acquisition - 40 x 29,455 1,178,200Operation and Support Cost at 5%/year 600, 000
$1,978, 200
Less 40 Continuity Testers at $700 -28, 000
$1,950, 200
LCC Results
Cost Saving $4, 509, 468*Cost 1,950,200
Net Saving $2, 559, 268
CS/C Ratio = 4.509468 = 2.281,950,200
*Assumes no reduction in effectiveness in prevention of unnecessary
removals as compared to Option 1.
- 112 -
__~w m f v . .. 4 0.. . . . . . . . ,1 A .. - d

Recommendations
1. Continue current two-set field evaluation program at Ft. Ruckerand Ft. Campbell to collect data on troubleshooting time and
effectiveness as well as reliability and durability of the test set.
2. Obtain funding to modify the AVUM and AVIM troubleshooting flowcharts and written procedures for future incorporation in the T700maintenance manual.
3. Procurement of four additional sets of analyzers for use at an AVIM,
the Army mechanics training school, one operational company, and
the factory. Perform the required Military specification tests onone set.
4. Conduct an in-depth study of the control analyzer set utilizing fielddata from production engines, field experience of the deployed testsets, and an update on the LCC analysis for the purpose of deter-
mining the optimum usage of the equipment, that is, Option 2 orOption 3.
LCC ANALYSIS OF MULTIPURPOSE AIRBORNE D&CM SYSTEMS
Each of the elements of the Multipurpose Airborne D&CM System defined in the
section entitled Task 11 - D&CM System Definition, is subjected to an LCC anal-
ysis described in the following section. These elements include:
1. Automatic Performance Monitor.
2. Discriminating Chip Detector (Degaussing).
3. Engine Life Usage Monitor.
4. Overtemperature Monitor.
- 113 -
I

The sununary of the LCC Analysis Results of each of the four MADACMS functionsas well as the cost effectiveness of the System as a whole, is tabulated below.This is followed by the four sub-system analyses.
LCC Analyses Summary of the Multipurpose Airborne D&CM System
CostResults Costs Savings CS/C
Automatic Performance Monitor $ 7, 200, 000 $12, 168, 263 1.69/1(APM) (Option 2)
Discriminating Chip Detector 663, 000 2, 389, 750 3. 60/1(DCD)
Engine Life Usage Monitor 6, 572, 000 12, 661,250 1.93/1(ELUM)
Overtemperature Monitor (OTM) 1,428, 458 - -
$ 15, 863, 458 $ 27, 219, 263* 1. 89/1*
*Calculated without overtemperature monitoring
program savings not now available.
Conclusions
The Multipurpose Airborne D&CM System is a cost effective system.
Recommendation
It is recommended that the Army award a contract to initiate the developmentand evaluation testing of the Multipurpose Airborne D&CM System.
- 114 -

LCC ASSESSMENT OF AUTOMATIC PERFORMANCE MONITOR
Introduction
The purpose of this LCC assessment is to evaluate the cost and operational bene-fits of an aircraft-mounted electronic engine performance monitoring system forArmy turboshaft helicopter engines. The analysis is restricted to the benefitsassociated with the performance of the three traditional installed performancetests by use of an automated electronic system as compared with the existingmethods utilizing cockpit indicator readings as specified in the aircraft operator'smanual and engine maintenance manual
The measurement of installed engine performance in Army helicopters has been
performed for many -,ears by the flight crews using the readings taken from thecockpit engine instruments, outside thermometer for free air temperature (FAT)and barometer or altimeter for pressure altitude. This data is then manually re-corded and referred to performance curves in the aircraft operating manual toobtain a determination of engine performance compared to a specification or priorsatisfactory status. Three types of performance checks are performed in thismanner:
1. Operational health indication test (HIT) done on the ground prior tothe first flight of the day for each engine at 60% engine torque and100% shaft speed (see Table 21).
2. Maximum power check done in flight by the maintenance test pilotat 100% output shaft speed, maximum engine power and 110 knotsindicated air speed (KIAS) (see Table 22). The HIT procedure pro-vides an approximate indication of engine condition and, if belowlimits, requires the more accurate maximum power check to berun. The latter test becomes the pass or fail test that demands en-
gine maintenance or removal when failed.
3. The baseline HIT check is performed on the ground by the maint-enance test pilot immediately after the maximum power check toestablish a new baseline for future operational HIT checks (seeTable 23).
Automatic Performance Monitor (APM) Description
The automatic performance monitor is one of several proposed functions that canbe performed by an airframe-mounted digital computer and a simple cockpitalphanumeric digital display unit. The same functions proposed for this digital
-115 -

TABLE 21. OPERATIONAL HEALTH INDICATOR TEST -
CURRENT PROCEDURE*Estimated Time - 5 Minutes
1. Position helicopter into the wind.2. Record FAT and pressure altitude (PA).3. Turn anti-icing and heater to off.4. Set one engine to idle.5. Set other engine to 100% NP.6. Use collective pitch to increase torque to 60%.7. Hold at 60% for 30 seconds.8. Record aircraft hours, FAT, PA, and TGT on HIT Test Log (see
Appendix*).9. Repeat steps 4 through 8 for other engine.10. Calculate average TGT indicated.11. Find TGT from Table 1-9 (Appendix pg 1-148).12. Subtract indicated TGT from table TGT (Table 1-8).13. Compute and record TGT acceptance limits.
*Reference TM55-2840-248-23, para 1-88 and Appendix, p6 L-147.
TABLE 22. MAXIMUM POWER CHECK - CURRENT PROCEDURE*Estimated Time - 30 Minutes
1. Set both power available levers in the FLY position, and 110 knotslevel flight at 100% N
2. Retard one engine to 04t torque and increase other engine to TGT8350 - 845 0C.
3. Stabilize for 10 seconds. Increase collective pitch until Np drops 2%.4. Stabilize for 30 seconds.5. Read and record Ng, TGT, % torque, FAT, PA, EOT, and EOP.6. Reduce collective pitch until Np = 100%.7. Increase other engine power level to maximum power. Repeat steps
1 through 4.8. Plot FAT and PA. Determine minimum torque from Figure 1-38 (see
Appendix*).9. Compare results of step 8 with torque in step 5.
*Reference TM55-2840-248-23, para 1-85 and Appendix, pg 1-146.
-116 -

TABLE 23. BASELINE HEALTH INDICATOR TEST -
CURRENT PROCEDURE*
Estimated Time - 5 Minutes
1. Position helicopter into the wind.2. Record FAT and pressure altitude (PA).3. Turn anti-icing and heater to off.4. Set one engine to idle.5. Set other engine to 100% Np.6. Use collective pitch to increase torque to 60%.7. Hold 60% for 30 seconds.8. Record aircraft hours, FAT, PA, and TGT on HIT baseline sheet
(see Appendix*).9. Repeat steps 4 through 8 twice.10. Calculate average TGT indicated.11. Find actual TGT from Table 1-9 (Appendix pg 1-148).12. Subtract indicated TGT from table TGT (Table 1-8).13. Compute and record TGT acceptance limits.
*Reference TM55-2840-248-23, para 1-86 and Appendix, pg 1-147.
system were successfully demonstrated in Lynn T700 test cells with the enginehealth monitor, a portable analog device built as a demonstrator during the T700engine development and qualification program (reference GE Report R78AEG032,28 April 1978). The current GE concept is a six-pound airframe-mountedcomputer-processor and a simple one-pound dichroic liquid crystal cockpit dis-play unit servicing two engines and having two push button controls. It providesa simple means of obtaining both HIT and maximum power check data without theproblems associated with obtaining and recording cockpit instrument readings andusing engineering curves and tables to determine engine performance.
LCC Analysis Rationale
The APM characteristics that can be qualified with assurance for evaluation of costand operational effectiveness are related to the engine and aircraft operating time,costs, and fuel saved in more efficient conduct of HIT and maximum power checksas compared to the current methods. A number of other APM potential benefitsmay ultimately prove to have greater impact on weapon system cost and operationaleffectiveness but are not quantifiable for lack of operational service experience.These "other" benefits would be derived from the following system characteristics:
- 117 -

Other Benefits - Not Quantified
1. More accurate HIT check data:
a. Fewer maximum power checks.b. Reduced mission aborts and better fault detectionc. "Trendable" data for degradation tracking.d. Better data for factory analysis.
2. More accurate maximum power checks:
a. Reduced mission aborts and better fault detection.b. Fewer maximum power reruns.
3. Simplified cockpit procedure - eliminates reference to charts and tables:
a. Reduces flight crev, workload.b. Reduces chances for hkiman error.c. Simplifies pilot training.
Alternate Rationale - ElinJ: qte. (Some or All) Daily HIT Checks
Instead ot traditional (.ierational HIT check, the pilot could, with APM, call upthe performance status of both engines as measured and stored in high-volatilecomputer memory from C4 last flight. This data together with the pilots know-ledge of recent history of the aircraft and/or his general assessment of enginestatus as they are started may convince him that HIT check is not required. Acontinuation of the excellent record of negligibly low performance problems ofthe T700 engines could also influence a future change in Army policy in this area.
An important consideration, perhaps the overriding one for HIT, is the added con-fidence a good preflight check may instill in the flight crew; that is an importanthuman factors item. It is conceivable, however, that when the automatic per-formance monitor is proven to be accurate and reliable, daily HIT checks mightbe eliminated as a requirement and left to the pilot's discretion.
Assumptions
1. The maximum power check as presently performed by the maintenancetest pilot Is done satisfactorily. The computations to determine per-formance status are done inflight to check data validity before termin-ating flight. The average maximum power check flight is of 1/2-hourduration.
- 118 -
2. Current HIT takes approximately 5 minutes including computation,recording, and data "look up" time. Engine remains in operationduring entire HIT procedure.
3. HIT checks to confirm engine condition each day before first flightwill continue to be performed.
4. The automatic performance monitor is the principal function of adigital airframe-mounted computer-processor and display systemwhich has a number of ancillary functions utilizing a common mi-croprocessor and related electronics.
5. Ten percent of daily HIT checks require reruns because of humanerror or marginal results.
6. For purposes of this and the other effectiveness studies of theairframe-mounted D&CM systems, the costs and failure rate ofthe common computer-processor unit, cockpit display unit, andsoftware are apportioned as follows:
Automatic Performance Monitor 50%Life Usage Monitor 30%Discriminating Chip Detector 10%Overtemperature- Time- at- 10%
Temperature Monitor100%
7. The cost of aircraft flight time Is $1500/hour*. The cost of ground
operation is $225/hour (15% of flight cost)*.
*Derived in LCC Analysis for Discriminating Chip Detector in
TM80AEG1163.
8. The average engine power output (for fuel consumption computation)during installed T700 performance checks is as follows:
Maximum Power Checks 900 HP at .50 SFCHIT Check 600 HP at .55 SFC
9. Estimated engine operating time saved with automatic performancemonitor*:
a. Operational HIT check - 2-2/3 minutes.b. Maximum power check - 3 minutes.c. Baseline HIT check - 3-3/4 minutes.
*Reference TM80AEG1181 entitled LCC Analysis of T700/UH-60A
Automatic Performance Monitor.
-119-

10. The LCC analysis will be carried out for the following automaticperformance monitor options:
Option 1 - assumes that all HIT and power checks willbe carried out at the currently establishedfrequency.
Option 2 - assumes that favorable engine experience mayjustify in the future, the elimination of 2/3 ofthe HIT checks.
Estimated Savings Usng Automatic Performance Monitor ODtion 1
1. Operational HIT Checks:
Number of tests - Each engine HIT tested on first flight of the day.
Number of sorties =5 090. 000 engine hours x 12 engines/aircraft x 1. 5 hr/sortie
1, 696, 667 sorties
Assume 1/2 of sorties are first flights of the day.
1, 696, 667 = 848, 333 + 10% reruns = 933, 167 HIT Checks/10 Years2
a. Time saved by automatic performance monitor in HIT checksat 2-2/3 minutes for each check:
60Z x 933, 167 = 41, 526 hours aircraft ground 'est time60
- 83, 052 hours engine ground te.t operation.
b. Total cost saved by automatic performance monitor:
41, 526 hrs x $225/hr. = $9, 343, 350*.
c. Fuel saved (savings included above):
83, 052 eng hrs x . 55 lb/hr x 6006. 5 lb/gal 4, 216, 486 gallons
*Savings will increase as fuel costs rise above the ,i erage figure
of $1. 20/gal assumed in this analysis.
- 120 -

2. Maximum Power Checks:
a. Number of checks in 10 years:
1 for each shop visit 38521 for each fai1 d HIT check 678
(Use 2/1500 hours - reference -
Task I analysis) 4530
10% miscellaneous control causedperformance losses 450
Use 5000 Maximum Power 4980Checks
b. Time saved:
3- x 5000 = 250 hours aircraft flight time500 hours engine flight time
c. Total cost saved:
250 x $1500/hr = $375, 000
d. Fuel saved (included above):
250 x 2 engine hours x .50 x 900 - 34,605 gallons6. 5
3. Baseline HIT Checks:
a. Time saved:
5000 x 3-3/4 = 312. 5 aircraft hours, 625 engine hours.60
b. Cost saved:
312. 5 hours x $225/hr = $70, 313
c. Fuel saved (included above):
625 x 500 x .556.5 = 31,731 gallons.
- 121 -

Option 1 Automatic Performance Monitor Cost Computation in 1980 Dollars
1. Electronic Hardware and Software Design and Development: $415, 040
a. Acquisition cost:
$8260 x. 5 = $4130 per Aircraft System
1500 systems at $4130 $6, 195, 000
b. Operation and Support Cost based on system MTFB of 9000 hours:
F/R = 19 000, 000 hr*= 111 F/10 6 hours System Failure Rate- F/R9000
*See Assumption 6 (pg 119).
c. Apportioned failure rate for automatic performance monitor:
F/R 111/100 x . 50 = 56/10 6 /aircraft system= 28/10 6 /engine hours
285, 090, 000 engine hours x 0--w- = 143 failures at $4130 $590, 600.
d. Cost of total program:
Dev. $ 415,000
Acq. - 1500 x 4130 = 6, 195, 000O&S 590, 600
$7,200, 600
2. Results (Assumes all HIT and maximum power checks are carried out):
a. Cost:
Gross Savings $9, 788, 663Total Cost 7, 200, 600Net Saving $2, 588, 063
Cost Saving Ratio = 9.788,663 = 1.f/1
Cost $7,200, 600
b. Time:
84, 177 engine operating hours saved.
c. Fuel:
4, 282, 822 gallons saved.
- 122 -

Estimated Savings Using Automatic Performance Monitor Option 2
1. Results:
Assume 2/3 of all HIT checks are eliminated.Assume no change in maximum power checks.
a. HIT check savings:
Time - 2/3 x 933, 166 x 52, 102 hours aircraft ground60 test x 2
104, 204 engine hours
Cost - 52,102 x $225/hr = $11,722,950
Cost Savings - $11,722, 950 $12,168,26370,313 7,210,600
375, 000$ 4,957,663 Net
Gross $12,168,263
12,168, 263cs/c Ratio -- 7,210, 000 1.69/1
Fuel (Savings included above)
I HIT Check - 5 x 600 x .55 x 2 = 8.46 gallons(2 Engines) 60 6. 5
10 Years = 2/3 x 933, 166 x 8. 46 = 5, 263, 056 gallons.
Discussion of LCC Analysis Results for Automatic Performance Monitor
The basis for this analysis is believed to be conservative in the folio ,ing respects:
1. The projected 10-year estimate of 5, 090, 000 engine hours is lowerthan current estimates.
2. The result of assigning a dollar cost per flying hour based on aircraftLCC divided by aircraft flying hours is believed sound but probably lowfor lack of up-to-date information using current projected fuel costs.
3 The estimate of 10% reruns of HIT checks in the first 10 years of BlackHlawk service may be low because, during this period, 100 new BlackHawk Companies will be activated with many new and inexperiencedpersonnel.
- 123 -
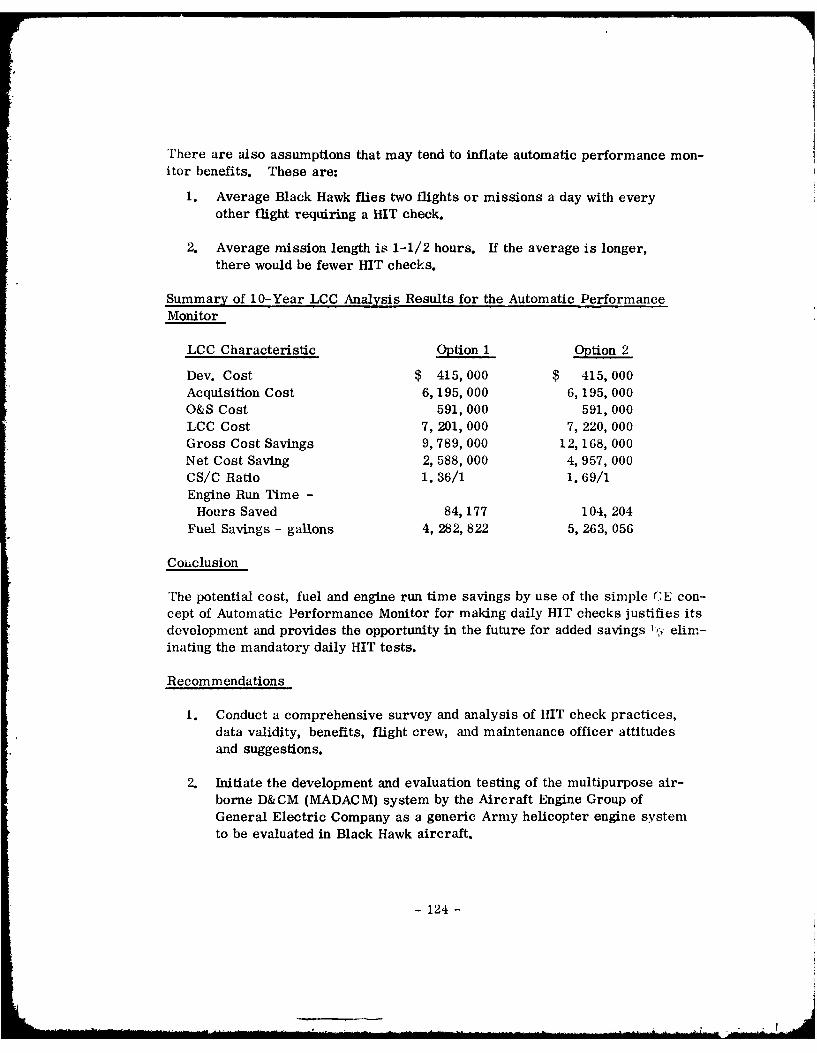
There are also assumptions that may tend to inflate automatic performance mon-itor benefits. These are:
1. Average Black Hawk flies two flights or missions a day with everyother flight requiring a HIT check.
2. Average mission length is 1-1/2 hours. If the average is longer,there would be fewer HIT checks.
Summary of 10-Year LCC Analysis Results for the Automatic PerformanceMonitor
LCC Characteristic Option 1 Option 2
Dev. Cost $ 415, 000 $ 415, 000Acquisition Cost 6, 195, 000 6, 195, 000O&S Cost 591,000 591,000LCC Cost 7,201,000 7, 220, 000Gross Cost Savings 9,789, 000 12, 168, 000Net Cost Saving 2, 588, 000 4, 957,000CS/C Ratio 1.36/1 1.69/1Engine Run Time -
Hours Saved 84, 177 104, 204Fuel Savings - gallons 4, 282, 822 5, 263, 056
Coiiclusion
The potential cost, fuel and engine run time savings by use of the simple CE con-cept of Automatic Performance Monitor for making daily HIT checks justifies itsdevelopment and provides the opportunity in the future for added savings ', elim-inating the mandatory daily HIT tests.
Recommendations
1. Conduct a comprehensive survey and analysis of HIT check practices,data validity, benefits, flight crew, and maintenance officer attitudesand suggestions.
2. Initiate the development and evaluation testing of the multipurpose air-borne D&CM (MADACM) system by the Aircraft Engine Group ofGeneral Electric Company as a generic Army helicopter engine systemto be evaluated in Black Hawk aircraft.
- 124 -

3. Develop the Automatic Performance Monitor functions as the primary
function of the MADACM system.
4. Provide hardware and software for such ancillary functions as can beincorporated in MADAC M without degrading its reliability and human
factors advantages of simplicity of operation and nonambiguous readout.
5. Implement the Option 2 approach following satisfactory results fromthe above steps.
LCC ANALYSIS FOR A DEGAUSSING-TYPE DISCRIMINATING CHIP DETECTOR
Methodology
For this analysis, the cost of developing and introducing the "smart" -hip de-tector into the UH-60A fleet will be compared with the savings achieved by thereduced number of nuisance signals causing a reduction in mission aborts, air-craft down time, and maintenance costs.
Analysis Basis and Assumptions:
1. Derived from Figure 23 data for a 10-year period from 1982 to1992 for 5, 090, 000 engine hours assuming, 3150 engines ataverage hours/engine of 2700 for 10 years.
2. Each nuisance signal will cause a one-hour maintenance checkper Table 24, and 75% of the nuisance signals will cause amission abort.
TABLE 24, NUISANCE SIGNAL MAINTENANCE CHECKS
Individual Elapsed Total Elapsed
Maintenance Action Time (minutes) Time (minutes)
Shutdown Engine 2.0 2. 0Obtain Materials and Tools 10.0 12.0Access Engine 5.0 17.0Disconnect Chip Detector Cable 0. 5 17.5Remove and Inspect Chip Detector 1.5 19. 0Clean and Reinstall Chip Detector 3. 0 22. 0Close Engine Access 5. 0 27.0Start Engine and Run 15 Minutes 17.0 44. 0Access Engine and Leak Check 7.0 51.0Close Engine Access 5. 0 56. 0
- 125 -

Although the frequency of nuisance chip signals is often expressed as a ratio ofnuisance to true signals, 5 or 6:1 being not uncommon, there is little direct rela-tionship between the two. The frequency of nuisance signals is more likely to bea function of: (1) engine operating hours, (2) time since new or repair, and(3) the cleanliness discipline exercised in the manufacture or repair of the en-gine. Available data on the T700-GE-700 engine seems to bear this out. Figure25 depicts these trends. Explanation follows:
Point 1 Early flight test data reported in Report USARTL-TR-78-32,December 1980-11, 000 engine hours, average engine timesince new was 118 hours.
NCR* 2. 4 27 nuisance signals, time period 1974 - 77.
Point 2 Full scale development of flight test data reported in ReportNo. 7 DAAK-51-79-C-0020, January 1980-15, 000 enginehours, average engine time since new was 127 hours.
NCR* 1. 8 27 nuisance signals, time period 1977 - 79.
Point 3 Army service at Ft. Campbell for Production Engines in GEDV-7 Field Service Reports-5811 engine hours, average en-gine time since new was 109 hours.
NCR* 1.45 8 nuisance signals, time period January - May 1980.
Point 4 Army service at Ft. Rucker for Production Engines in GEDV-7 Field Service Reports-4397 engine hours, iverage en-gine time since new was 363 hours.
NCR* 0. 68 3 nuisance signals, time period January - May 1981.
*NOTE: NCR - Nuisance Signals/1000 Engine Hours.
The data definitely indicates a very favorable trend in decreasing nuisance signalratio (NCR) over the 6-year period, 1974-1980; showing that cleaning-up of theengine manufacturing debris and a reduction in detection system sensitivity hasbeen effective from early preliminary flight rating test (PFRT) engines to thecurrent production engines: Points 1 to Point 3 of Figure 24; all of these enginesbeing of about the same average age in terms of time since new (TSN).
The second example shown by comparing Points 3 and 4 shows a very favorabletrend of decreasing NCR with increasing TSN. The data sample, however, is smalland may not be an accurate quantitative representation of what may occur in laterservice. The trend, however, is logical and probably indicates that with increas-ing engine hours, the efficient 3 micron filters are gradually cleaning up residualdebris.
- 126 -

oc
C) C
SS3NI1NV313 AIOVA CA
O]AO~dWI Ag O1N 9NISV30i30
w C) 0
Cp 00
m V LLJL)w /L U,CA ~ ~ N C.) L A I
C))
0D =~ '. CDi =.-4
0LLJLC ZY >.
r- a, I L- :a m
C .- I> 0a - Lim
C) L-.CCI/ In 1J ICVAW- C C-1 z,
ICA LUI 0 )- 000
w i U) N . J c W C~L- C..) "I
W j -4 CA l CC ) C) C~ CF- <CC L ii C m .= = L= C-0 C
LULC ) = - -I - C L I- L.)L 0- 4 -. C
ul LLD L i. /. 4=LJ >
LL - 0C 0 r2
0 C3 u C = L-4
- 4N~ M =0- A
- L< L P-4 V).- L
C) LA- 0 L<
c'j C\J m -JC
SC) fl: OOT/VNI " (AJN J1V-I dIHJ 3JV
.:C~~ ~ ~ ~ 12 :-.=) L. cic

Nuisance Chip Rate Future Prediction
There does not appear to be any mathematical method to predict the future NCRrate that can be achieved with the present chip detector. A linear extrapolationof Points 3 and 4 would show NCR approaching zero when those engines reachedan average TSN of 600 hours. Such a conclusion based on only a four-monthperiod with a small number of engines would be unsound. Several factors willprevent the ac hievement of the ideal condition.
1. There is now and will probably continue to be, some internally gen-erated debris of the types cited above.
2. LRU replacement, module replacement, and depot repair of LRU' s,modules, and engines will introduce debris to some degree yet to bedetermined.
3. Future service conditions, introduction of second source componentsuppliers, and future design changes for such things as cost reductionsmay affect the NCR.
4. Past history of engines of all types equipped with magnetic chipdetectors would not lead one to predict that the nuisance chip prob-lem would go away.
On the positive side, however, it is also recognized that there is no long-termexperience with engines having 3 micron filters in their lubrication systems.
For the purposes of this study, therefore, it will be assumed that the NCR for thepresent master chip detector will reach 0. 4/1000 hours on 100 hour TSN enginesby 1982 and would ultimately reach 0. 3/1000 hours. The average NCR for the10-year period will reach 0. 35/1000 hours. Likewise, it will be assumed thatthe average NCR for the discriminating chip detector will fall in a band of 0. 05 -0. 1/1000 hours for the ten-year period.
Computation of Degaussing Discriminating Chip Detector Cost Effectiveness
1. Cost of a Nuisance Signal Assume the following:
Average Mission - 1. 5 hours75/L of nuisance signals result in aborts plus chip inspection check.2517(, of nuisance signals result in chip inspection only.
- 128 -
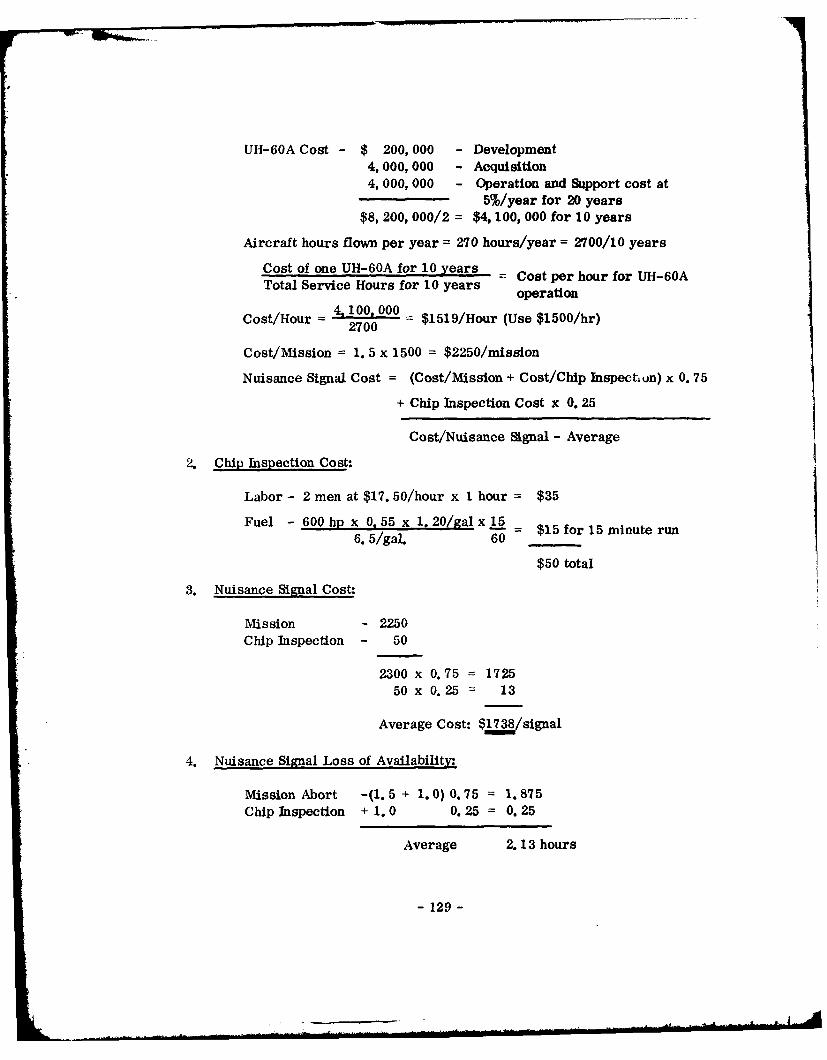
UH-60A Cost - $ 200, 000 - Development4,000, 000 - Acquisition4, 000, 000 - Operation and Support cost at
5%/year for 20 years$8, 200, 000/2 = $4, 100, 000 for 10 years
Aircraft hours flown per year = 270 hours/year = 2700/10 years
Cost of one UH-60A for 10 years = Cost per hour for UH-60ATotal Service Hours for 10 years operation
Cost/Hour = 4200, 000 = $1519/Hour (Use $1500/hr)2700
Cost/Mission = 1. 5 x 1500 = $2250/mission
Nuisance Signal Cost = (Cost/Mission + Cost/Chip Inspechon) x 0. 75
+ Chip Inspection Cost x 0. 25
Cost/Nuisance Signal - Average
2. Chip Inspection Cost:
Labor - 2 men at $17. 50/hour x 1 hour = $35
Fuel - 600 hp x 0. 55 x 1. 20/gal x 15 =
6. 5/gal. 6 $15 for 15 minute run
$50 total
3. Nuisance Signal Cost:
Mission - 2250Chip Inspection - 50
2300 x 0.75 = 1725
50 x 0. 25 = 13
Average Cost: $1738/signal
4. Nuisance Signal Loss of AvailabilitW
Mission Abort -(1. 5 + 1.0) 0.75 = 1.875Chip Inspection + 1. 0 0. 25 = 0. 25
Average 2. 13 hours
- 129 -

5. Cost of Degaussing Discriminating Chip Detector:.
Apportioned Cost of Sensors, D&CM Display
and Computer Development = $220, 000
Acquisition Differential Cost per Aircraftis $200 for 1575 Systems = 315, 000
Opperation and Support Cost for Sparesat F/R of 30/106 hours is 150 x $850 = 128, 000
$663, 000
6. Number of Nuisance Events for 10 Years:
Present System Discriminating System Reduction
Maximum 0. 1 x 5 x 106
Average 0. 35 x 5 x Hours = 500 1250106 Hours= 1750 Minimum 0. 05 x 5 x 106
Hours = 250 1500
Median - 1375 Nuisance Events Avoided
7. Savings in Ten Years:
1375 Events at $1738 = 2, 389, 750System Cost - 663, 000
$1, 726, 750
Time Average - 1375 x 2. 13 = 2929 Hours Aircraft Availability
Savings/Cost Ratio 2390 =
63 3. 60/1663
Conclusions
The degaussing type discriminating chip detector system with a CS/C ratio of
3. 6/1 indicate it is cost effective. In terms of the Army's operational effective-
ness, the savings in aircraft availability and reduction in mission aborts will be
- 130 -

quite significant and measurable. In the combat situation even one mission abort
avoidance or one correct pilot decision on engine condition aided by the "smart"
detector could more than justify the system.
The system cost and savings should be approximately the same whether built as
a stand-alone system or integrated into the airborne D&CM system.
Recommendation
The GE degaussing discriminating chip detector development program for the
T700 and future Army engines conducted in logical phases with discrete decision
points should be funded, either as a stand-alone system or as part of an airframe-mounted integrated D&CM system.
LCC ANALYSIS FOR THE ENGINE LIFE USAGE MONITOR (ELUM )
Background
One of the principal functions of the multipurpose airborne D&CM (MADACM)
system described in this section is the measurement and recording of tempera-ture, time, and speed related parameters whose cyclic variations have a major
effect on the life of key rotating and hot parts. An on-going CIP funded program
has authorized the construction and flight test of three airframe-mounted ELUMdevelopment units. Two of these units measure, compute, and display life usage
measures for five key parts on each of the two Black Hawk engines. Data is read
manually from electro-mechanical counters and recorded by hand. If this sys-tem were to be adopted the concept might be changed as suggested in GE Report
R79AEG1036, 31 December 1979 to incorporate solid state memory modules on
each enginc whose stored data would be periodically extracted electronically.The ELUM concept analyzed herein would measure, compute, and record the
same life usage parameter with the same logic (software) that is being developed
from the current program; the data display would be by cockpit LCD unit on pilot
or mechanic demand instead of by electromechanical "wheels"; and the record-ing would be by solid state memory modules as suggested for present units.The current program results are directly applicable and relevant to the D&CMELUM concept. The principal advantage of the candidate D&CM ELUM functionover the present dedicated ELUM is that it would share the use of a common com-puter, display, and wiring system on the aircraft with three or more other cost
effective functions with resulting cost, weight, and volume savings.
1
i - 131 -

Assumptions
1. The D&CM ELUM function is chargeable with 30 percent of theMADACM development cost, acquisition cost, and failure rate.
2. The D&CM ELUM would replace the present engine-mountedengine history recorder (EHR).
3. The hot part cost figure for the T700-GE-401 engine hot parts
(1975 dollars) cited in GE LAMPS Report R7'iAEG1023 "InflightEngine Analyzer Study" can be updated, extrapolated, and utilizedin this analysis.
4. The Army will utilize the ELUM data in their future maintenance
and ILS program to determine when and/or if key hot parts shouldbe replaced.
5. The present EHR can save 2% on hot parts replacement costs.
6. The ELUM or D&CM ELUM can save 7% on hot parts cost or 5%above the savings of the present EHR.
7. The present EHR cost (including wiring, etc.) to the Army in 1980dollars is $4500. Three-quarters of the T700 engines shipped inthe ten-year period between mid-1982-1992 would be shipped withoutEHR, a saving of 3/4 x 3150 x $4500, or $10, 631, 250. The re-maining 25% would be retrofitted to remove the EHRs and replaceone wiring harness at $2000/engine.
8. The cost of hot parts has escalated from 1975 to 1980 at the sameratio as the engine cost.
Program Costs
Development $ 280, 000Acquisition
1500 x 0. 3 x 0. 8260 3, 717,000GSE - 10 x 50, 000 500, 000
Operation and Support 500, 000Retrofit
25 x 3150 x 2000 1, 575, 000
$6, 572, 000
- 132 -

Program Savings
Reduction in Hot Parts and Labor
275 5235$4. 02 x - x 0. 05 - 2, 030,000
Elimination of EHR Engnes to be Shipped Between 1982 and 1992
10, 631,250
Gross Savings - $12, 661, 250
Results
Net Savings 12, 661,258
6, 572, 000
$ 6, 089, 250CS/C - 12 661, 250 1.93/1
6, 572, 000
Conclusions
1. The incorporation of the sophisticated ELUMS life usage measure-ments, recording, and display system into the multipurpose airborneD&CM system provides the opportunity for the T700 and other Armyengines to have the life usage measurement function at the lowestpossible cost. This digital programable microprocessor based sys-tem has the flexibility of reprogramming to new or revised lifemeasurement logic and/or limits to suit the engine or application.In the case of the T700-GE-700 engine, substantial cost savingswill be realized due to the lower-per-engine cost of ELUM as com-pared to the cost of the present engine history recorder.
2. The use of engine life usage data for engine maintenance and logisticmanagement in the Army needs to be studied in-depth and related tothe ELUMS concept.
3. This cost effectiveness study is a first approximation and shouldbe redone with emphasis on fleet introduction timing, retrofit plan,if any, and transition from the engine history recorder to ELUM.
- 133 -

Recommendations
1. Proceed with the development of the ELUM concept as an integralpart of the multipurpose airborne D&CM system through flight test.
2. Concurrently, initiate an analysis of methods of engine life man-
agement in the Army environment.
3. Refine the ELUM cost effectiveness study to include the effects offleet introduction, retrofit, transition schedules, and detailed costsavings.
LCC ANALYSIS FOR THE OVERTEMPERATURE MONITOR
Background
The field event analysis reported in Task I indicated a predicted 4 overtempera-tures per 15, 000 hours. If this is representative of the average rate of occur-
rence for the next 5 million hours, there would be approximately 1400 occur-
rences in the ten-year period covered by this study. To determine the appropriate
reaction to a cockpit instrument indicalion of overtemperature, both temperatureand the number of seconds at that temperature must be known fairly accurately.For example, in Figure 28, an overtemperature at 910 0 C for 40 seconds requirestroubleshooting; for 45 seconds or more, overtemperature requires an engineremoval and a shop visit to AVIM or Depot. The consequences of underestimatingthe overtemperature time can be severe; a mission abort, secondary enginedamage, etc. Overestimation can result in an unnecessary engine removal.There is no system intelligence on Black Hawk now to compute the time-at-temp-erature relationship represented by Figures 28 and 29.
Rationale
There is not sufficient data to perform a meaningful LCC analysis at this time.However, overtemperatures have continued to occur with the production engines
resulting in engine removals. It is reasonable to assume that the overtemperaturefunction will be cost effective though not quantifiable at this time. Later, whenmore data are available, particularly from the Depot, an LCC analysis can beperformed. Assuming that either or both the performance and life usage monitor-ing functions are provided, processing and computation capabilities will be avail-able to perform the overtemperature function at no additional cost, other thanprovision of its software for its implementation.
- 134 -
II |1 II I illlll .. .. . .. ... il i lli N ... . .. ,-: lll l ".. 9 :
- "

lii
LI
Li
Lii 0
- CL
W LO
Li-II
LiiL C5 L
0 '-,A- - 4
Ur CoC-u;0D m (.0
Z- 0
-44
m ON 0l m 0 0 0 o 0o c0 o 00
o, - 3ifl1\l3dW3I SV9 3NISbfl
-135 -

- ~ :1
LLXJ
000
0 ~~L4.J l -u-i>
0-0I4Vj -'
V)-
LLii
AA U-'-' Q- C
Li-i C~L J
ci: -- LAJ0 c''F- C-/7
C:) VJ
LJ u-
C)
CL r0 C) -:
0 n~ C= Dc i w
- - 0
0 CD 0 CD CD C0 0D 0 :m' (Vj .4 <D 0) 00 Ll I) Ln ;I
0- 3bnfIV83dW31 SV9 3NIOI
-136-

LCC Assessment Results
Program Cost
Development $ 90, 300Acquisition 1, 126, 00n
Operation and Support 212, 158
TOTAL $1,428, 458
D&CM Saving
(Insufficient data to estimate savings.)
Conclusions
The overtemperature function is a valuable contributor to flight safety, aircraftavailability and reduced maintenance costs and should be part of anA future BlackHawk monitoring system.
Recommendations
Include overtemperature monitoring as going "piggy-back" on a basic MADACMrequirement. Quantify overtemperature savings as part of any follow-on D&CManalysis based on latest field and Depot data.
- 137 -

TASK IV - D&CM HARDWARE DEVELOPMENT REQUIREMENTS
The engineering development work required to implement the D&CM programsrecommended in accordance with this technical assessment is outlined below.The requirements for software and/or any additional data collection or analysiswill be addressed in addition to that of hardware.
MODIFIED METS FOR MODULAR PERFORMANCE FAULT ISOLATION
Not recommended for development. No hardware, software, or further analyticalwork required.
COMPUTER FOR STANDARD METS OVERALL ENGINE PERFORMANCE
Computerized measurement of overall engine performance was recommended asthe cost effective means of acheiving modular performance fault isolation formodern modular Army turboshaft engines. GE would be required to providetechnical assistance to the government agency or contractor chosen to define thehardware and software to perform the signal conditioning, computation, etc., forT700 performance measurement. Presumably a similar effort would be re-quired from other Army engine suppliers. The GE effort could amount to severalman-months of engineering support to the computer hardware and software con-tractor.
SLAVE CHIP DETECTORS
Recommended for OWP modular fault isolation for METS and depot.
The Transistorized Chip Detector System (TCDS) electronic signal processing,detection and display module is fully developed and requires no further design ortest effort for depot use. Six chip detector sensors, similar to the T700 B-sumpinterim chip detector and a suitable wiring harness would have to be defined, pro-cured and packaged as a set or kit. There is no software involved.
To equip each METS facility with the TCDS, the electronic module might requireMIL-STD tests for humidity, and/or mechanical shock.
Procurement for T700 applications would be through GE's Aerospace GroundEquipment Operation in Lynn, Massachusetts.
- 138 -

CONTROL SYSTEM ANALYZER (CSA)
Recommended for deployment to AVUM (Black Hawk companies), and/or AVIM(Black Hawk Battalions and METS), Options 2 or 3 per LCC analysis.
Hardware development essentially completed. Two sets deployed and in use forfield evaluation. Design and/or quality refinements were incorporated in thesecond unit which is a production prototype.
Software Development - Electronic circuit design is solid state analog type. Nosoftware required.
Type Certification - In order for the Control System Analyzer to be authorizedfor issue to the operational units, the equipment must be Type Certified. TypeCertification of ground support equipment (GSE) can be accomplished either by:
1. Completion of a series of environmental and simulated operationallaboratory tests in accordance with MIL-STD specifications, or
2. Certifying the GSE along with the weapon system by deploying andusing the equipment as the aircraft is subjected to the variety ofenvironmental and operational conditions required for TypeCertification. Although the Black Hawk is already Type Certified,the certification for SOTAS, the Black Hawk derivative, has notbegun. There is time available to procure Control System Anal-yzers for Type Certification with the SOTAS aircraft after whichthese GSE units could be procured for both weapon systems.
MULTIPURPOSE AIRBORNE D&CM (MADACM) SYSTEM
Recommended for development. Development of the Multipurpose Airborne D&CMSystem involves four closely related tasks as follows:
Hardware - Airborne Computer-microprocessor based- Sensors-Degaussing Chip Detector
-Free Air Temperature Sensor - RTD Type(Commercial item - no development required)
- Display Module - Alphanumeric Dichroic LCDSoftware - Algorithms, data tables, computer programming for moni-
toring performance, life usage, overtemperature and oil-wetted parts.
- 139 -

Program Structure and Timing
The MADACM System Development program logically fits into two p, ses.Phase I proves out the software and functional design of hardware with two setsof brassboard electronics and factory testing using T700 engine signal inputs.Phase 11 produces three sets of production prototype hardware for flight test.The Degaussing Chip Detector development, because of GE funded developmentalready underway, would produce flight-worthy sensors in Phase I with no de-velopment envisioned in Phase IL Phase III is for preparation of hard toolingand qualification of units built from this tooling. The MADACMS and degaussingchip detector programs are depicted in Figures 30 - 33, and further describedbelow.
Phase I
During Phase I of the development program, the major portions of the electricaldesign, display evaluation and software development tasks will be completed. Theobjective is to deliver to General Electric/Lynn, three D&CM brassboard systemssuitable for test cell and flight test evaluation. During this phase of the program,a fourth system shall be fabricated and retained by GE/Wilmington for detailedbench evaluations. The fabrication techniques shall be based upon solderless-wrap technology. Field support for GE/Wilmington personnel are included in thePhase L It is expected that the Phase I Program would require 21 months tocomplete.
Phase II
Phase 11 of the follow-on program will build upon lessons learned during brass-board evaluation and result in the delivery of three sets of production prototypehardware for test cell and flight evaluation. These prototypes will meet the form,fit and function requirements of production systems. They shall be proven flight-worthy; however, formal qualification tests will be performed only on the chipdetector. Field support is included in the Phase H for GE/Wilmington personnel.It is expected the Phase II portion of this effort would have a 9 month overlap withPhase I and will require a total of 48 months to complete.
Phase III
Phase III can be concurrent with Phase U as shown in Figure 32.
- 140 -

-.-- 0
C ~ r~r V~.-o ~ -I T - ~ I
-) II IIi I 0II r12
3
N I CUV
~1 I 0
N -~ -r -~ -~
'I II 0Ii (J2
N II -III ii
~ I To( -
N Co0
& ~t4-r-~ Ho
-~ 0
N0
I -t{~ ~7i H IIV
2 -~ j _ - -
K -~
U ~ ~
- 141 -

-
- z 71,1 ii
I I
V a)
142

(roz:
02
.0
0
o
0044
a
9 -6-.
lu-
aa
14

log-
z 0 0~gJ ~ LI-v IL w; -
75 -. -t a
~ ~ ~ gED z
cma
Uc
ob
-1>1
-- -j -
i~144

DEGAUSSING CHIP DETECTOR DEVELOPMENT
The initiation of the Chip Detector Development is predicated upon the successfulcompletion of the contractor funded Degaussing Chip Detector Feasibility Evalu-ation scheduled for the first quarter of calendar 1981 as shown in Figure 33.Three units to be delivered will be production prototypes.
Hardware Development
Hardware development is proposed to be done by GE's Aerospace Instrument andElectrical Systems Department of Wilmington, Massachusetts - the organizationand people responsible for the design aad construction of the current Engine LifeUsage Monitor (ELUM) now being flight tested by the Army. Previous T700 D&CMhardware by the AI& ES Department include the Engine Health Monitor, Oil Mon-itor, FOD and Bearing Monitors and a bread-board digital combined Health andLife Usage Monitor. A description of the hardware to be developed for MADACMis found in the preceeding section covering Task IL
Software Development
Software development is the responsibility of the electronic systems designerbased on the logic flow charts (Algorithms), curves and data tables provided byT700 Engineering. The major software task is programming for the AutomaticPerformance Monitor functions or Maximum Power Checks, Operational andBaseline HIT checks, and Power Margin. Of probably equal or greater complex-ity are the ELUM functions. This work, however, was already accomplished forthe ELUM boxes currently being flight-tested and will essentially be duplicatedfor MADACM. Software logic for overtemperature monitoring and chip detection,as well as for BIT and the executive routine are considered relatively simpleand straightforward.
Software development is a significant portion of projected costs. Based upon re-cent experience, it is estimated that this effort would be apportioned as follows:
Software Requirements - 20%Design - 20%
Coding - 20%Verification/Validation - 40%
Initial work would include comprehensive hardware and software systems analysisand result in a firm system specification. From this, d |n.-led software require-ments would be developed and, subsequently, detailed design hiitiated. Duringthis process formal reviews of requirements, quality assurance and overall de-sign would occur.
- 145 -

As the program continues through coding and unit evaluation, detailed test planswould be developed. These would be applied prior to and following the integrationof hardware and software.
Memory requirements are expected to total 7 to 10 thousand words, of which some5 thousand will be parameter values. Although the source code could be writtenin FORTRAN, for programs of this type and size it is more effective to use as-sembly language. A microcomputer development system appropriate for the
processor selected would be used for program assembly.
FOLLOW-ON D&CM ANALYSIS
The comprehensive analyses performed under the current Contract DAAK51-79-C-0020, enabled GE to arrive at definitive conclusions, based on quantitative LCCanalysis of available data. In this process, however, several areas were ident-ified where follow-on analytical work is needed to further verify and update theconclusions. These analyses would cover the following areas:
1. Extend the T700 field event analysis from the period ending May 1979covered by current contract, to some point encompassing at least15, 000 hours of production engine field operation. This analysis isshown as a line item in MADACM Phase I, Figure 30, but could beauthorized separately.
2. Develop methodology to evaluate the effects of timely fault isolation,repair and return to flight status on LCC considering:
a. Aircraft availability.b. Aircraft safety.
3. Modify LCC model, if practical. (Utilize up-dated FMECA and pro-duction engine field history to establish component contribution toeach symptom.)
4. Refine T700 APM LCC and perform O/T LCC analysis.
- 146 -

CONCLUSIONS
General
The conduct of this D&CM assessment by the Aircraft Engine Group was an ex-cellent experience for those who were involved in it. The effort, by utilizing theT700 as typical of future Army Modular engines, involved the functions of Design,Maintainability, Service, Support, Systems, Product Assurance and InstrumentDepartment personnel from several functions. The approach was to identify theexpected problems/symptoms, and define the most reasonable way to diagnoseand/or monitor the expected occurrences in operational use. This approach wasnot directed toward new equipment development, but attempted to utilize availableassets, e.g. Manpower, Technical Manuals, and Test Stands with a minimum ofnew equipment to be carried on board the helicopter. As such, the results andrecommendations are equally oriented toward development of ground support andhelicopter on-board equipment.
One of the disappointments with this effort was the contractors' inability to applysufficient time and effort toward quantifying the pay-off for the Army to developthis equipment. The LCC studies were a sufficient first order conservativeapproach for early management decisions, however, it was recognized that someof the more important aspects, such as availability, were not quantified and assuch, the pay-off computations are low and incomplete.
Specific:
1. Modular Performance Fault Isolation (MPFI) by component and gas path
analysis performed in the field on specially modified METS facilitieswould not be cost effective and would be difficult to implement under Armyfield maintenance conditions.
2. Automating the present METS data acquisition and processing functions toimprove the evaluation of engine overall performance is the practical andcost effective approach to MPFI at the AVIM level.
3. The Slave Chip Detector (SCD) concept applied to METS at the AVIM levelis cost effective based on predicted OWP failure rates.
4. The Control System Analyzer (CSA) set is a useful and necessary tool foraircraft and engine control system fault isolation at both AVTTM and AVIMlevels. The deployment plan for the CSA set, however, is critical to itscost effectiveness.
- 147 -

5. The Degaussing Chip Detector (DCD) is clearly cost effective either byitself or as part of MADACM and has a great potential for reduction ofmission aborts and maintenance at the AVUM level due to nuisance chipsignals.
6. The Multi-purpose Airborne D&CM (MADACM) System is cost effectiveusing a common micro-processor for the following four major functions.
a. Automatic Performance Monitor (APM) - savings in fuel and engineoperating time.
b. Engine Life Usage Monitor (ELUM) - savings by replacement of twoEHRs with one MADACM.
c. Degaussing Discriminating Chip Detector (DCD) - savings by reduc-tion in nuisance signals and mission aborts.
d. Overtemperature Monitor (OTM) - potential savings by automatictime-temperature monitoring (not yet quantified).
7. The effective implementation of the MADACM concept dictates a simplesystem which will have a low risk development program and produce asystem adaptable to other applications. In addition the MADA( A4 musthave:
a. Easy to read cockpit display.b. Operating simplicity.c. Simple software and hardware for reliability.
8. The T700 Black Hawk field event analysis by D&CM Symptom should becontinued to cover production aircraft and engines in the Army operatingenvironment and include refinement of the LCC analysis of the AutomaticPerformance Monitor and completion of the LCC analyses of the Over-temperature Monitor.
9. The LCC Analyses performed under this contract resulted in dollar costpay-offs that, in most cases, did not fully reflect the operational benefitsthe use of the proposed D&CM improvements would produce. To improvethe accuracy of Army LCC analyses, a method of quantifying severalmeasures necessary for improving the validity of LCC analyses and shouldbe developed and tested by applying them to one or more T700 LCC analysisusing the T700 LCC computer model. Included would be dollar Isavings forground test, mission aborts, aircraft and engine availability, ultimatereduction of spares, and reduced flight time.
- 148 -

RECOMMENDATIONS
1. Do not modify the six existing METS facilities for performing ModularPerformance Isolation by gas path analysis.
2. Initiate a program to provide computerized overall engine performance
data acquisition and processing on all Army METS facilities.
3. Procure and install T700 Slave Chip Detector sets at each Army METSfacility and at the T700 depot facility for Oil-Wetted Part Modular FaultIsolation.
4. Complete the field evaluation of the Control System Analyzer Set and TypeClassify.
5. Support the development and evaluation of the T700 Degaussing Chip Detec-tor as soon as the G.E. funded feasibility demonstration is successfullycompleted. (First quarter of calendar 1981).
6. Initiate the Phase I MADACM development program.
7. Contract for a follow-on to the current D&CM contract DAAK-51-79-C-0020to cover production Black Hawk/T700 field event symptom analysis andrefinement of LCC analysis.
8. Request a G.E. proposal for development of a method for quantifying severalmeasures necessary for performing Army helicopter engine LCC analyses.Use T700 as example. Measures to be quantified include installed engineground test, mission aborts, aircraft and engine availability and aircraftand engine flight time.
-149/150-

LIST OF ABBREVIATIONS
A/C AircraftAGB Accessory GearboxAPU Auxiliary Power UnitAVIM Aviation Intermediate MaintenanceAVUM Aviation Unit MaintenanceB-H Flux-Field IntensityC HI PS Magnetic Chip TallyCIP Component Improvement ProgramCMD CommandD&CM Diagnostics and Condition MonitoringECU Electrical Control UnitEOP Engine Operating PressureEOT Engine Operating TimeEXC ExcitationFAT Free Air TemperatureGCT Government Competitive TestGSE Ground Support EquipmentH FluxHIGE Hover In Ground EffectHIT Health Indicator TestsHMU Hydromechanical UnitHOGE Hover Out of Ground EffectHP High PressureHPT High Pressure Turbine (Gas Generator Turbine)HRS Engine HloursIFR Infrared RadiationILS Integrated Logistics SupportKG KilogaussKIAS Knots Indicated Air SpeedLCC Life Cycle CostLCF Low Cycle FatigueLDT Linear Differential TransformerLP Low PressureLPT Low Pressure Turbine (Power Turbine)LRU Line Replaceable UnitLVDT Linear Variable Differential Transformer
- 151 -

LIST OF ABBREVIATIONS - Continued
MA Mission AbortMADAC M Multipurpose Airborne Diagnostics and Condition MonitoringMETS Modular Engine Test SystemMPFI Modular Performance F-4ult IsolationMTBF Mean Time Between FailuresMTTR Mean Time to RepairNG (Ng) Gas Generator SpeedNp (NP) Power Turbine SpeedNr Aircraft Rotor SpeedOWP Oil-Wetted PartsPA Pressure AltitudePIDS Prime Item Development SpecificationPM Power MarginPTO Power Take OffQL Torque - Left EngineQR Torque - Right EngineRID Resistance Temperature DeviceT..%S True Air SpeedTCDC Transistorized Chip Detector CircuitTCDS Transistorized Chip Detector SystemTGT Turbine Gas TemperatureTRQ TorqueTTI Time at Temperature IndexUCR Unscheduled Component RemovalUER Unscheduled Engine RemovalUMA Unscheduled Maintenance ActionSOTAS
- 152 -