Embed Size (px)
Citation preview

Confidential Page 1 of 46 SYSTAT 12 CAPABILITY MATRIX v7
SYSTAT 12 CAPABILITY MATRIX
MORE STATISTICS
New Feature Description Advantages Benefits
Mixed Model
Analysis
Analysis of a variety of mixed models, providing
• different types of estimates of fixed effects parameters and variance components,
• with standard errors, confidence intervals and tests of hypotheses (pairwise or in terms of contrast matrices),
• under various covariance structures for random effects and errors.
• AIC, AICc, BIC computation
• Many types of data such as repeated measures, growth curves, and longitudinal data can be analyzed with this feature.
• Extends the capability of Linear Models, Regression, ANOVA and GLM.
• Comparison of models is possible using the new criteria.
• Targets users from such disciplines as agronomy, animal breeding, and more generally, experimental biologists.
• An advanced statistical feature that catches up with competing software.
• Meets a long-standing demand of some loyal users.
Partial Least-
Squares Regression
This is least-squares regression when the data set consists of a large number of predictor variables, maybe more in number than the number of cases.
• Two standard algorithms -- NIPALS and SIMPLS are provided.
• Standard errors and confidence intervals are provided by cross-validation methods.
Extends the scope of multiple linear regression considerably.
• Significant applications are in Chemometry, Economics, Medicine, Psychology, and Pharmaceutical Science.
• Not many standard statistical software have this feature.

Confidential Page 2 of 46 SYSTAT 12 CAPABILITY MATRIX v7
MORE STATISTICS New Feature Description Advantages Benefits
Robust Regression Two new robust regression techniques:
• Least Trimmed Squares (LTS),
• Scaled (S), have been added to the regression suite.
• LMS, LAD and M regression features have been modified to be consistent with these new techniques.
Extends the regression suite considerably to deal with problematic data -- non-normal, with outliers, multiple dependent variables, etc.
• Helps users carry out a better analysis of their data with more predictive power to their regression fits.
• Particularly useful in analysis of economic data.
Response Surface
Methods
Given data suitable to fit a second-degree polynomial to one or more responses on several factors,
• regression coefficients are estimated,
• analysis of variance and tests of significance are carried out,
• optimum factor settings can be computed, using canonical (for each response) or desirability (for all responses jointly) analysis,
• desirability plots are produced,
• ridge analysis is carried out, and
• contour or surface plots, with fixed settings for one or more factors, can be displayed.
• The analysis determines combinations of input factors that produce optimal levels of response. If the optimal level is outside the experimental range, it points to the direction in which the experiment should be continued to move towards the optimum.
• A useful addition to the design of experiments, ANOVA, and GLM features.
Helps industries to discover the levels of input factors and process settings that will produce the best yield in terms of product characteristics, by means of suitably designed and conducted controlled experiments.
Cluster Analysis • New linkage methods � uniform and k-neighborhood, � flexible beta, � weighted linkage
Considerably strengthens the Classification suite of routines by offering users a very wide choice of
Social and natural scientists who use Cluster Analysis for exploratory or confirmatory work now have a wide variety

Confidential Page 3 of 46 SYSTAT 12 CAPABILITY MATRIX v7
MORE STATISTICS New Feature Description Advantages Benefits
have been added.
• New distance measures � Absolute � Anderberg � Jaccard � Mahalanobis � RT � Russel � SS
have been added.
• For hierarchical clustering: � five indices of cluster validity
(RMSTTD, Dunn, Davies—Bouldin, Pseudo F, Pseudo T2),
� facilities for cutting cluster trees based on leaf nodes and tree heights
have been added.
• K-medians clustering has been provided.
• For K-means and K-medians: � Initial seeds can be specified
through various means � Scatterplot matrix with coloring
based on final cluster identifiers, appears as an additional Quick Graph
techniques and criteria to suit the differing nature of data sets and user requirements.
of distance and similarity matrices, clustering criteria, validation indices, cutting and pruning methods, to try and get a most satisfactory hierarchical classification or grouping from their data.

Confidential Page 4 of 46 SYSTAT 12 CAPABILITY MATRIX v7
MORE STATISTICS New Feature Description Advantages Benefits
Trend Analysis • Mann-Kendall test with Sen Slope Estimator for non-seasonal data, and
• seasonal Kendall test and Homogeneity tests with Sen slope estimator for seasonal data
have been provided.
Trend analysis can be performed on seasonal and non-seasonal time series.
• Long-term movements can be studied removing seasonal effects if necessary.
• Target users are economists and financial analysts.
Probability
Distributions
The following distributions have been added:
• Benford’s law,
• logarithmic series,
• Erlang,
• generalized lambda,
• log-logistic,
• noncentral t, χ2, and F,
• smallest extreme value,
• Studentized maximum modulus,
• half-normal.
Eleven new distributions have been added to the existing suite of 33 distributions.
• From these, probability calculations and data transformations can be performed;
• They can be used for fitting and goodness-of-fit tests;
• function plots and probability plots can be drawn;
• random samples can be drawn.
Very useful for modeling data, for checking assumptions, for simulation exercises, for Bayesian computations, for MCMC computations, etc. Very useful in risk management and other financial studies.
Multiple
Comparisons
The following multiple comparison procedures have been added:
• Equal variances: � Sidak,
With these additions, the multiple comparison suite consists of fifteen tests, giving the user tests
• Useful for comparing and ordering treatments, groups in terms of their means.
• Applications are mainly in

Confidential Page 5 of 46 SYSTAT 12 CAPABILITY MATRIX v7
MORE STATISTICS New Feature Description Advantages Benefits
� Tukey’s b, � Duncan, � R-E-G-W-Q, � Hochberg GT2, � Gabriel, � Student-Newman-Kuels (SNK).
• Unequal variances: � Tamhane T2, � Games-Howell, and � Dunnett’s T3.
These tests can be requested simultaneously.
appropriate to their data and the type of comparisons.
agricultural, medical, and industrial research.
Descriptive
Statistics (Update)
The following additions have been made in Column and Row Statistics:
• Trimmed, Geometric, and Harmonic means
• Anderson-Darling test
• Mardia multivariate skewness and kurtosis; testing for significance
• Henze-Zirkler test for multivariate normality
• Bootstrap estimates, standard errors, confidence intervals, and histogram of estimates.
• Computation of averages other than the arithmetic mean is possible.
• Testing for multivariate normality is possible.
• Not just bootstrapped samples, but also estimates based on these can be obtained.
• A deeper analysis of data is possible with the additional statistics being provided.
• Effort is reduced in the case of bootstrapped samples.
Confidential Page 6 of 46 SYSTAT 12 CAPABILITY MATRIX v7
MORE STATISTICS New Feature Description Advantages Benefits
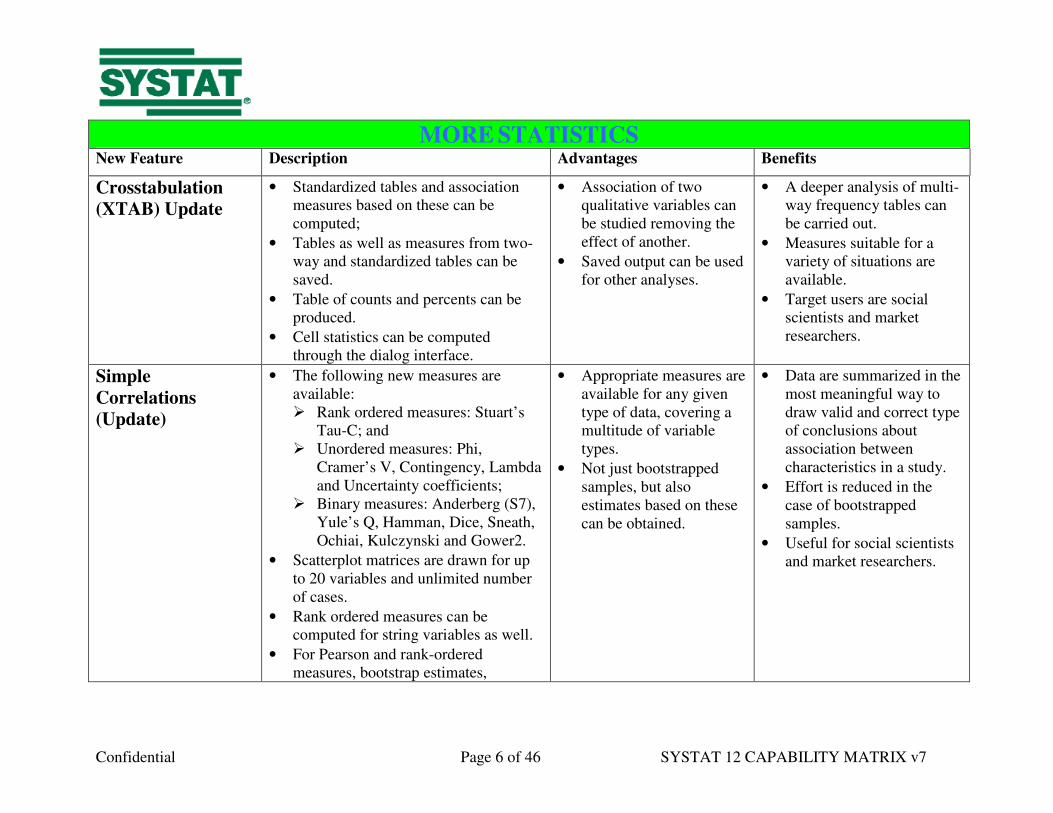
Crosstabulation
(XTAB) Update
• Standardized tables and association measures based on these can be computed;
• Tables as well as measures from two-way and standardized tables can be saved.
• Table of counts and percents can be produced.
• Cell statistics can be computed through the dialog interface.
• Association of two qualitative variables can be studied removing the effect of another.
• Saved output can be used for other analyses.
• A deeper analysis of multi-way frequency tables can be carried out.
• Measures suitable for a variety of situations are available.
• Target users are social scientists and market researchers.
Simple
Correlations
(Update)
• The following new measures are available: � Rank ordered measures: Stuart’s
Tau-C; and � Unordered measures: Phi,
Cramer’s V, Contingency, Lambda and Uncertainty coefficients;
� Binary measures: Anderberg (S7), Yule’s Q, Hamman, Dice, Sneath, Ochiai, Kulczynski and Gower2.
• Scatterplot matrices are drawn for up to 20 variables and unlimited number of cases.
• Rank ordered measures can be computed for string variables as well.
• For Pearson and rank-ordered measures, bootstrap estimates,
• Appropriate measures are available for any given type of data, covering a multitude of variable types.
• Not just bootstrapped samples, but also estimates based on these can be obtained.
• Data are summarized in the most meaningful way to draw valid and correct type of conclusions about association between characteristics in a study.
• Effort is reduced in the case of bootstrapped samples.
• Useful for social scientists and market researchers.
Confidential Page 7 of 46 SYSTAT 12 CAPABILITY MATRIX v7
MORE STATISTICS New Feature Description Advantages Benefits
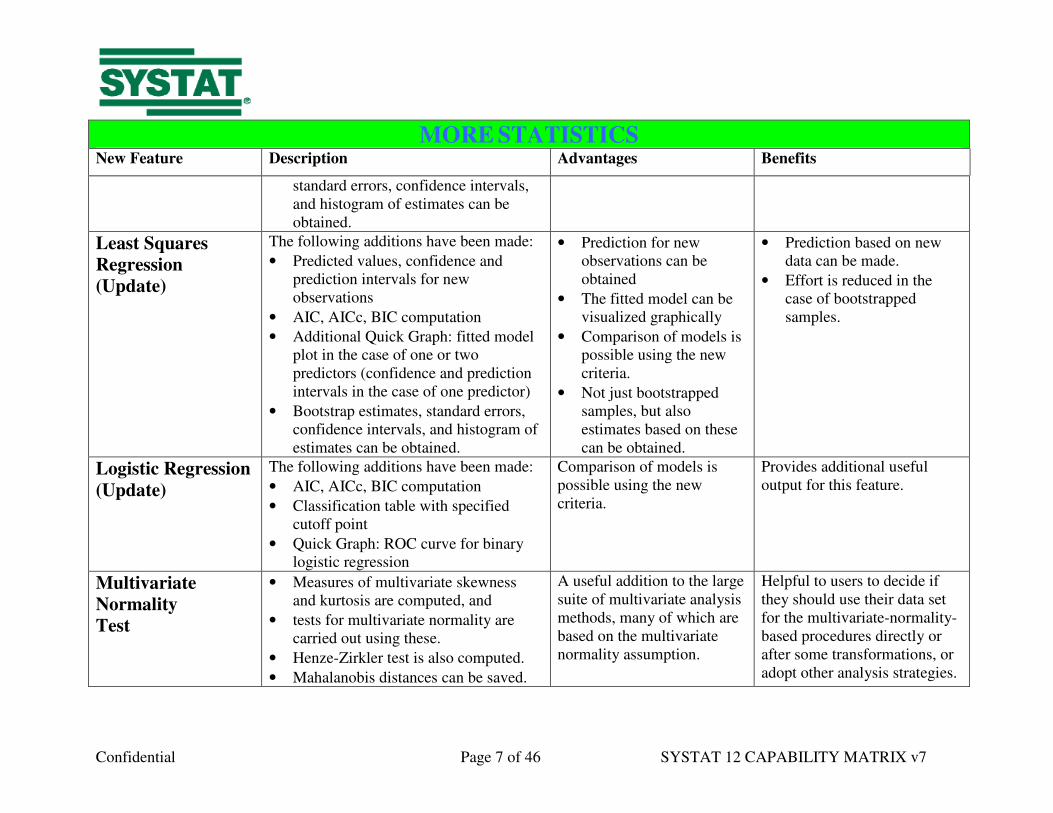
standard errors, confidence intervals, and histogram of estimates can be obtained.
Least Squares
Regression
(Update)
The following additions have been made:
• Predicted values, confidence and prediction intervals for new observations
• AIC, AICc, BIC computation
• Additional Quick Graph: fitted model plot in the case of one or two predictors (confidence and prediction intervals in the case of one predictor)
• Bootstrap estimates, standard errors, confidence intervals, and histogram of estimates can be obtained.
• Prediction for new observations can be obtained
• The fitted model can be visualized graphically
• Comparison of models is possible using the new criteria.
• Not just bootstrapped samples, but also estimates based on these can be obtained.
• Prediction based on new data can be made.
• Effort is reduced in the case of bootstrapped samples.
Logistic Regression
(Update)
The following additions have been made:
• AIC, AICc, BIC computation
• Classification table with specified cutoff point
• Quick Graph: ROC curve for binary logistic regression
Comparison of models is possible using the new criteria.
Provides additional useful output for this feature.
Multivariate
Normality
Test
• Measures of multivariate skewness and kurtosis are computed, and
• tests for multivariate normality are carried out using these.
• Henze-Zirkler test is also computed.
• Mahalanobis distances can be saved.
A useful addition to the large suite of multivariate analysis methods, many of which are based on the multivariate normality assumption.
Helpful to users to decide if they should use their data set for the multivariate-normality-based procedures directly or after some transformations, or adopt other analysis strategies.

Confidential Page 8 of 46 SYSTAT 12 CAPABILITY MATRIX v7
MORE STATISTICS New Feature Description Advantages Benefits
• The Quick Graph using scaled squared Mahalanobis distances is drawn.
Analysis of
Variance, General
Linear Model
(Update)
• Options to test normality and homoscedasticity assumptions are provided.
• Type I and type II sums of squares are also provided as options.
• Confidence intervals and hypotheses tests for � Helmert, � reverse Helmert, � Deviation, and � Simple contrasts
are provided.
Considerably enhances the capability of ANOVA/GLM and its applicability.
Various standard treatment comparisons can be made easily. Validity of ANOVA/GLM can be checked. Many unbalanced designs can be correctly analyzed.
Nonparametric
Tests (Update)
The following additions have been made:
• Quade test to measure differences among related samples
• The one-sample Kolmogorov-Smirnov test now provides 9 discrete and 28 continuous univariate distributions
• Anderson-Darling test to examine the distribution of a sample; 28 continuous univariate distributions are available.
• Statistic and p-value obtained from any nonparametric test can be saved to a file
• The Quade test is a nonparametric version of the two-way ANOVA, and provides an alternative to the Friedman test. It also provides multiple comparison tests.
• The Anderson-Darling test provides an alternative to the Kolmogorov-Smirnov test in the case of
• Alternatives to existing tests may allow the user to confirm results obtained from one test.
• Saved results can be processed further conveniently.

Confidential Page 9 of 46 SYSTAT 12 CAPABILITY MATRIX v7
MORE STATISTICS New Feature Description Advantages Benefits
continuous distributions
• The saved statistics and p-values can be further processed suitably, for instance, to compute bootstrap estimates.
Survival Analysis
(Update)
The following additions have been made:
• Nelson-Aalen cumulative and log cumulative hazards with confidence intervals
• Confidence intervals for Kaplan-Meier probabilities, mean survival time, and quantiles with specified confidence levels
• AIC, AICc, BIC computation
• An additional Quick Graph, the Cox-Snell residual plot, for parametric models
• Estimates for the cumulative hazard can be obtained directly using the Nelson-Aalen estimator.
• Models can be compared using the AIC, AICc, and BIC criterion.
• The Cox-Snell residual plot can be used to test the goodness of fit of the model.
Provides additional useful output for this feature.
AIC, AICc, BIC • Akaike Information Criterion,
• its corrected version, and
• Schwarz’s Bayesian Information Criterion
are computed as a part of the output for least squares regression, ANOVA, GLM, MANOVA, logistic regression, probit analysis, mixed models and survival analysis.
These are useful additional statistics relating to models based on the values of likelihood and the number of parameters. They measure model complexity and goodness of fit.
Very useful in comparing models taking into account model fit and parameter parsimony.

Confidential Page 10 of 46 SYSTAT 12 CAPABILITY MATRIX v7
MORE STATISTICS New Feature Description Advantages Benefits
Resampling
(Update)
• Results of bootstrap analysis are provided as options in: � Descriptive Statistics, � Pearson correlation and measures
for rank ordered data (except Tau-c),
� Regression, and � ANOVA.
• Bootstrap estimates and confidence intervals are provided.
An analysis of the most useful part of the large number of bootstrap outputs are provided.
Point estimates, standard errors and confidence intervals based on bootstrap analysis are provided; these are robust and have validity even when standard parametric assumptions fail.
Statistics, Matrix,
and BASIC are
Global Modules
Commands relating to
• Statistics (Descriptive statistics),
• Matrix features, and the
• BASIC programming language, are now global commands and can be used anywhere without getting into these modules.
The command syntax gets simplified and the powers of the BASIC language and matrix computations are available in any module; moreover descriptive statistics for any intermediate variables can be computed at once.
Work can now be done faster, in a simpler manner, and in a single session, avoiding saving and opening temporary files and/or breaking work into several sessions.

Confidential Page 11 of 46 SYSTAT 12 CAPABILITY MATRIX v7
SYSTAT 12 CAPABILITY MATRIX
MORE GRAPHICS
New Feature Description Advantages Benefits
Single Dialog for
Interactive
Graphics
• A single dialog box with interactivity at the levels: Graph, Frame, Axis, Legend, Element. has been provided.
• The dialog is context sensitive in the sense that, the options relevant to the graph object that you click on will be immediately available.
• You can still access the other options by clicking the desired tab.
A large number of options are available for making graphs appear the way you want them to.
Attractive graphs can now be produced quickly and conveniently.
New Interactivity
Features
• Quick Graphs and BEGIN..END graphs can be edited interactively.
• Each object in the graph is identified by a rectangular frame around it with handles at the corners.
• You can reposition graph titles using the mouse.
• Quick Graphs can be customized according to need.
• Identifying individual objects is easier.
• Graph title can be positioned conveniently.
• Greater flexibility in editing graphs produced through statistical features.
• Extended Graph interactivity capabilities.

Confidential Page 12 of 46 SYSTAT 12 CAPABILITY MATRIX v7
MORE GRAPHICS New Feature Description Advantages Benefits
Hexagonal Binning • This is a form of bivariate histogram for large data sets. The x-y plane is tessellated by a regular mesh of hexagons. The radius of the hexagons is the same throughout but its color depends on the range of the frequency of the x-y values.
• SYSTAT can be set to do automatic hexagonal binning.
An improved and more clarified version of the scatterplot is obtained when the data size is large.
Visually useful and attractive way of presenting the structure of a large data set.
Easier Gradient
and Wireframe
• The Gradient and Wireframe options are now available at the time of drawing the surfaces.
• Use the GRADIENT and WIREFRAME options with the DENSITY, PLOT, PPLOT, and FPLOT commands.
• Interactivity controls have also been minimized to achieve the same results as earlier.
Gradient and Wireframe plotting has been made available at the time of drawing graphs, and they have been made simpler.
User time and effort has been reduced.
Frame Titles • Frame titles can be turned off in graphs having multiple frames
• Use the FTITLE = OFF option with any graph command except MAP, FPLOT, DRAW and WRITE.
This is particularly useful when you are drawing graphs using BEGIN..END (turn off frame titles for all except one).
More flexibility in drawing graphs with multiple frames that have titles.
Bar Charts
(Update)
• Percentage bar charts are now drawn with separate bars where the height of each bar is a percentage of the total.
• Percentage bar charts are now consistent with the common definition of
• Percentage bar charts can be drawn without having to manipulate the data.

Confidential Page 13 of 46 SYSTAT 12 CAPABILITY MATRIX v7
MORE GRAPHICS New Feature Description Advantages Benefits
• SYSTAT 11’s percentage bar chart can be obtained if you request Stacking with the Percentage option.
• The Stack option for a univariate bar chart will stack the bars one above the other.
• For anchored bar charts, a base line will be drawn at the specified base value.
these.
• An anchored bar chart will seem more visually appealing.
• The feature is further refined by these useful additions.
Enhanced Graph
Editing Tools
The following enhancements have been made to tools in the Graph Editing toolbar:
• The Highlight Point tool automatically shifts the focus to the Data Editor while showing the case corresponding to the highlighted point.
• Graph tooltips show more information in the tooltip (that appears in the status bar). For example, the case number is shown for individual plot points in a scatterplot, and the height of each bar is shown for individual bars in a bar chart.
• More drawing attributes can be specified for annotations, like line style, fill style and fill color to be used in the text and graph annotations.
• There is no need to manually switch to the Data Editor to view the highlighted case.
• A lot more information is available in the graph tooltips about individual elements..
• Graph and text annotations can be customized more than before.
• Graphs can be laid out appropriately on the page before printing.
Graph Editing becomes a lot more easier and convenient.

Confidential Page 14 of 46 SYSTAT 12 CAPABILITY MATRIX v7
MORE GRAPHICS New Feature Description Advantages Benefits
• More text tool font options can be specified, like font rotation, font background color, and case (current, lower or upper case).
• In the Page View mode, graphs/individual frames of graphs can be stretched/shrunk as desired.
Global Graph
Options
• Graphs can be decorated with various canvas backgrounds and borders.
• Ability to change the image type of the graphs appearing in the Output Pane, like PNG, BMP, JPEG, GIF or EMF
• A dialog interface has been provided to set the Origin, Eye, Facet and Depth of subsequently drawn graphs.
• Graph canvas backgrounds can be customized to suit any need, like preparing for presentations.
• The image type can be set to any given format as required. A JPEG format may be suitable if the output is to be saved, whereas a GIF may be appropriate if the output is to be posted on a website.
• The global parameters that influence the perspective of a graph, can be set without the use of commands.
• Additional global options for graphs provide greater flexibility to the user.

Confidential Page 15 of 46 SYSTAT 12 CAPABILITY MATRIX v7
SYSTAT 12 CAPABILITY MATRIX
LESS EFFORT
New Feature Description Advantages Benefits
Startpage • A Startpage has been provided in the Viewspace containing five panes: � Recent Files � Themes � Manuals � Did you know… � Scratchpad
• Clicking the horizontal bar at the top of the Startpage, gives information about what’s new in SYSTAT 12.
• The context (right-click) menu provides options to clear recent files, refresh or close the Startpage.
• An option is provided to prevent the Startpage from appearing at startup.
• Recent files are recalled easily.
• Interface themes can be applied instantly.
• User manuals can be opened easily.
• Useful tips about various aspects of SYSTAT can be conveyed.
• Notes can be written and maintained across sessions.
• Saves time and effort for the user.
• The arrangement of the interface can be instantly altered according to the current need.
Variable Editor • Corresponding to each data file, there are now two tabs (shown as Data and Variable at the bottom edge of the Viewspace) available in the Data Editor – one for editing data and another for editing variable properties.
• These will now be referred to as Data Editor and Variable Editor respectively.
• The variable properties of all variables can be edited in a single window.
• Any value labels that are defined can be immediately seen.
• It reduces effort in defining variables and setting their properties, thereby speeding up analysis time.
• All the information about the variables and current processing conditions is immediately seen in a single window.

Confidential Page 16 of 46 SYSTAT 12 CAPABILITY MATRIX v7
LESS EFFORT New Feature Description Advantages Benefits
• The Variable Editor is variable based, and contains information about variable name (numeric/string), variable labels, type, categorical status, number of characters (this is the field width in the case of numeric variables), number of decimal places, display format (normal or exponential notation), date/time format (if any), and variable comments.
• Double-clicking on a variable name’s row number in the Variable Editor will shift focus to the corresponding column in the Data Editor and vice versa.
• The Variable Editor has a Processing conditions in effect pane containing the current case selection condition, and By Groups, Weight, Frequency, Category, and Order variables, if any.
• If value labels are defined for any variable, they appear as a tooltip when the mouse is paused on the corresponding cell in the Variable Editor.
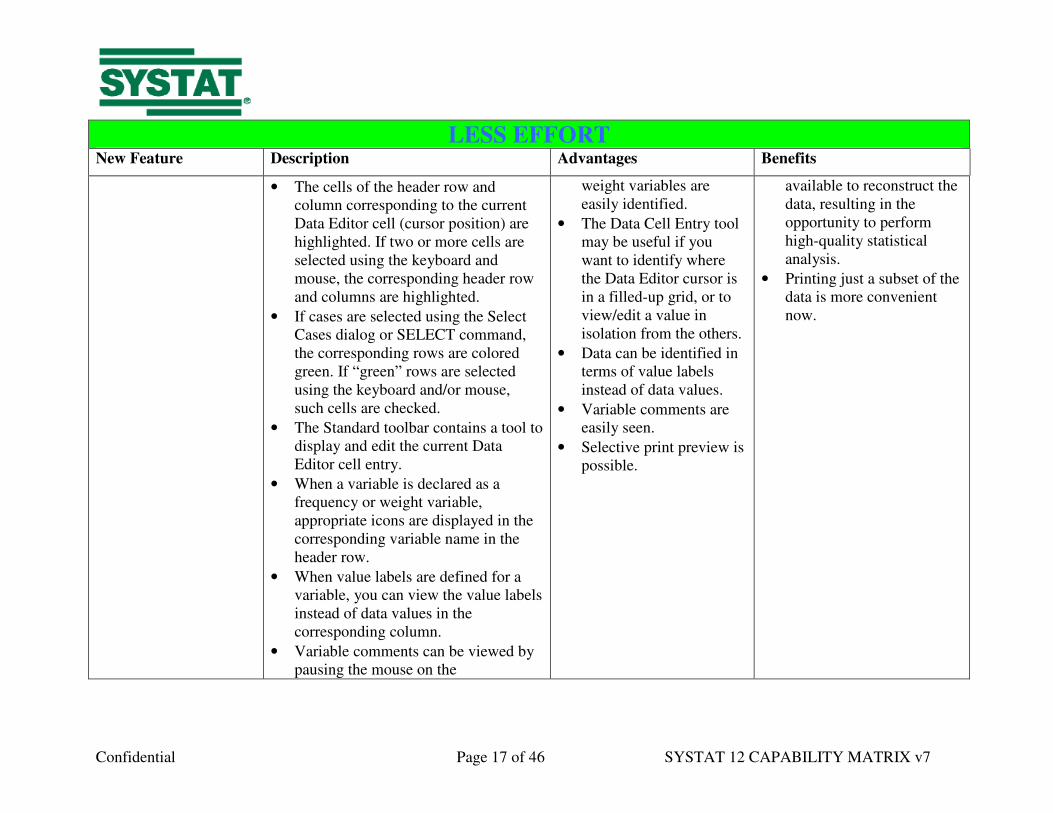
Enhanced Data
Editor
The Data Editor has the following enhancements:
• The current cell(s), case selections, frequency and
• A great deal of flexibility and options are now
Confidential Page 17 of 46 SYSTAT 12 CAPABILITY MATRIX v7
LESS EFFORT New Feature Description Advantages Benefits
• The cells of the header row and column corresponding to the current Data Editor cell (cursor position) are highlighted. If two or more cells are selected using the keyboard and mouse, the corresponding header row and columns are highlighted.
• If cases are selected using the Select Cases dialog or SELECT command, the corresponding rows are colored green. If “green” rows are selected using the keyboard and/or mouse, such cells are checked.
• The Standard toolbar contains a tool to display and edit the current Data Editor cell entry.
• When a variable is declared as a frequency or weight variable, appropriate icons are displayed in the corresponding variable name in the header row.
• When value labels are defined for a variable, you can view the value labels instead of data values in the corresponding column.
• Variable comments can be viewed by pausing the mouse on the
weight variables are easily identified.
• The Data Cell Entry tool may be useful if you want to identify where the Data Editor cursor is in a filled-up grid, or to view/edit a value in isolation from the others.
• Data can be identified in terms of value labels instead of data values.
• Variable comments are easily seen.
• Selective print preview is possible.
available to reconstruct the data, resulting in the opportunity to perform high-quality statistical analysis.
• Printing just a subset of the data is more convenient now.

Confidential Page 18 of 46 SYSTAT 12 CAPABILITY MATRIX v7
LESS EFFORT New Feature Description Advantages Benefits
corresponding variable name in the header row.
• You can select a part of the data in the Data or Variable Editor, and click Print Preview in the File menu to preview just the selected data before printing. You can then print the selected data using the Print button in the Print Preview window.
Opening Multiple
Data Files (View
and Active modes)
• The Data Editor allows for viewing multiple data files simultaneously.
• Data files that are saved by numeric modules are automatically opened in the Viewspace for viewing.
• Any data file that is in the view mode, or has a data file node created in the Output Organizer can be opened for editing conveniently.
• You can distinguish a viewed file from an active data file by the distinct coloring of the corresponding tabs in the Viewspace, and the shading of the Data/Variable Editor cells.
• A global option is provided to set the currently active data file to switch to the view mode, instead of closing down, when another is set active.
Convenient preparation for collating data from several files for subsequent data analysis.
Saves time and effort in opening and closing several files, data from which may be needed for a single analysis.

Confidential Page 19 of 46 SYSTAT 12 CAPABILITY MATRIX v7
LESS EFFORT New Feature Description Advantages Benefits
• To close a data file that is in the view or active mode, right-click on its tab and select Close.
Opening Multiple
Graphs (View and
Active modes)
• Multiple graphs can be viewed simultaneously by right-clicking on a graph’s node in the Output Organizer.
• A global option is provided to set the currently active graph to switch to the view mode, instead of closing down, when another is set active.
• To close a graph that is in the view or active mode, right-click on its tab and select Close.
Comparison of two or more graphs is possible.
Saves time and effort in saving and then opening graphs, possibly in an external application, for comparison.
Enhanced
Viewspace
• A new data file can be created by double-clicking in the empty area next to the tabs of the Viewspace.
• When a new tab is opened in the Viewspace, it is inserted in the beginning of its group of similar tabs. An option is provided to set a new tab to appear as the first tab of the Viewspace. Click the arrow in the top right corner of the Viewspace and check [Active Tab at the Beginning]
• Any tab can be brought into focus by clicking the arrow and checking the name of the desired tab. If there are
• New data files can be created with just a double-click.
• The Active Tab at the Beginning feature is especially useful when a lot of tabs are open in the Viewspace.
• The Window menu can be used to view two data files (or two views of the same data file), a data file along with an output file, and such other useful
Saves time and effort in creating new data files, and handling multiple tabs.

Confidential Page 20 of 46 SYSTAT 12 CAPABILITY MATRIX v7
LESS EFFORT New Feature Description Advantages Benefits
more tabs than are directly visible in the Viewspace, the tab becomes the first tab in the Viewspace or in its group depending on whether [Active Tab at the Beginning] is checked or not.
• A new Window menu is provided to arrange tabs of Viewspace in a few different ways: Tile horizontally, vertically, or cascade.
content.
Examples tab • The Examples tab in the Workspace provides instant access to innumerable worked examples in the user manual organized in a tree structure similar to the folder structure of the SYSTAT Commands folder.
• Clicking the + sign beside a folder or sub-folder shows the examples therein. Double-clicking an example node executes the corresponding command script and shows the outputs in the Output Editor.
• Multiple examples can be executed by selecting them using the Shift or Ctrl keys, right-clicking, and selecting Run.
• The underlying command file(s) can
• Easy access to about 600 example command files which can be run at the click of a mouse.
• Additional examples can be added.
Users can make simple modifications to the command files and carry out similar analyses with ease.
Confidential Page 21 of 46 SYSTAT 12 CAPABILITY MATRIX v7
LESS EFFORT New Feature Description Advantages Benefits
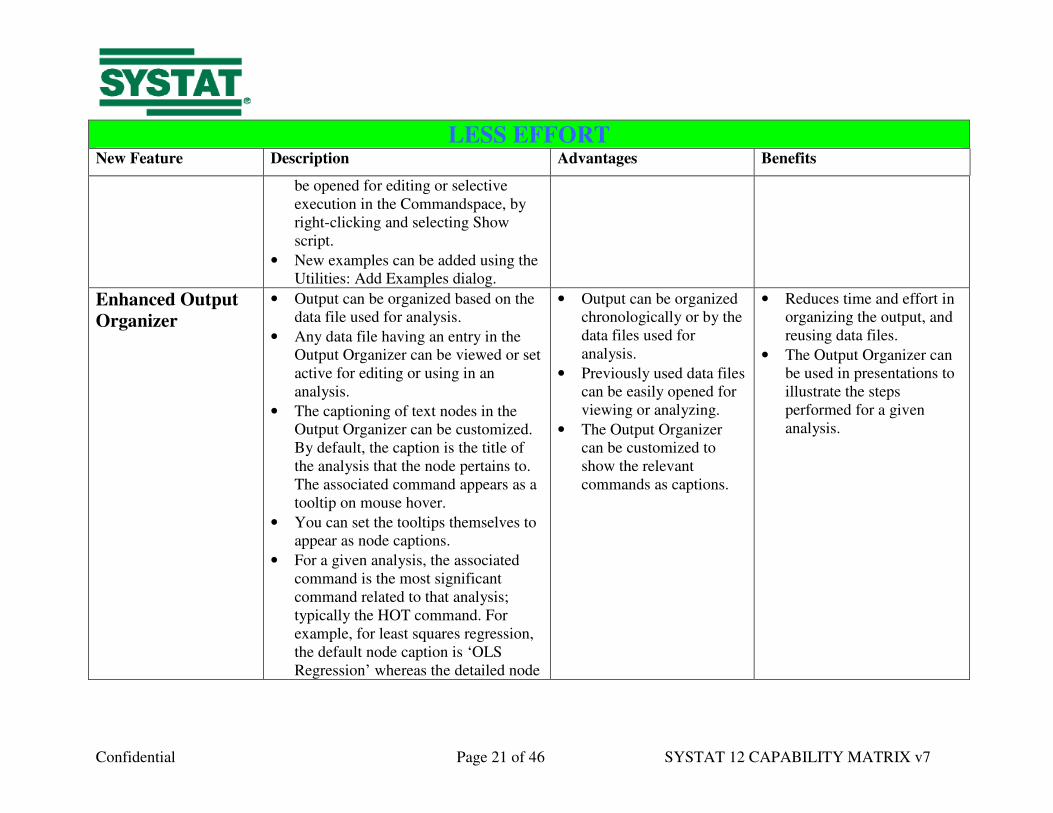
be opened for editing or selective execution in the Commandspace, by right-clicking and selecting Show script.
• New examples can be added using the Utilities: Add Examples dialog.
Enhanced Output
Organizer
• Output can be organized based on the data file used for analysis.
• Any data file having an entry in the Output Organizer can be viewed or set active for editing or using in an analysis.
• The captioning of text nodes in the Output Organizer can be customized. By default, the caption is the title of the analysis that the node pertains to. The associated command appears as a tooltip on mouse hover.
• You can set the tooltips themselves to appear as node captions.
• For a given analysis, the associated command is the most significant command related to that analysis; typically the HOT command. For example, for least squares regression, the default node caption is ‘OLS Regression’ whereas the detailed node
• Output can be organized chronologically or by the data files used for analysis.
• Previously used data files can be easily opened for viewing or analyzing.
• The Output Organizer can be customized to show the relevant commands as captions.
• Reduces time and effort in organizing the output, and reusing data files.
• The Output Organizer can be used in presentations to illustrate the steps performed for a given analysis.

Confidential Page 22 of 46 SYSTAT 12 CAPABILITY MATRIX v7
LESS EFFORT New Feature Description Advantages Benefits
caption is the MODEL command line.
Enhanced
Commandspace
• Multiple command files can be opened in the Commandspace.
• When a new tab is opened in the Commandspace, it is inserted in the beginning of its group of similar tabs. An option is provided to set a new tab to appear as the first tab of the Commandspace. Click the arrow in the top right corner of the Commandspace and check [Active Tab at the Beginning]
• Any tab can be brought into focus by clicking the arrow and checking the name of the desired tab. If there are more tabs than are directly visible in the Commandspace, the tab becomes the first tab in the Commandspace or in its group depending on whether [Active Tab at the Beginning] is checked or not.
• Arrow keys can used to navigate through the command buffer in the
• Commands can be selectively executed from multiple files.
• The Active Tab at the Beginning feature is especially useful when a lot of tabs are open in the Commandspace.
• Arrow keys provide intuitive shortcuts for scrolling through previously typed commands.
• Help on any word or phrase can be obtained instantly.
• Command syntax can be verified easily.
• Reduces time and effort in opening, editing and submitting command files.
• Command coloring makes it easy to identify the various components of a command line thereby reducing the risk of making syntax errors.

Confidential Page 23 of 46 SYSTAT 12 CAPABILITY MATRIX v7
LESS EFFORT New Feature Description Advantages Benefits
Interactive tab.
• Help for any word or phrase in the Online Help Index can be obtained by typing the word in the Interactive or Batch (Untitled) tab, right-clicking on it, and selecting Help “phrase”.
• Typed commands, variable names, numbers, strings and comments (REM statements) are colored in distinguishing colors.
• Command files can be saved in the Unicode or ANSI format.
Autocomplete
Facility
• SYSTAT commands are autocompleted as they are typed in the Interactive or Batch (Untitled) tab of the Commandspace.
• When a letter is typed, all commands beginning with that letter will appear in a dropdown list. Double-click the desired command or continue typing.
• On pressing space and then any letter, for the USE and VIEW commands, the data files in the SYSTAT Data folder will be listed. For any other command, if a data file is open, all available variable names beginning with that letter will appear in a
• Quick and easy retrieval of file, variable and command names.
• Spelling errors are avoided.
Saves time and effort by avoiding mistakes in names and the consequent re-run of the job.

Confidential Page 24 of 46 SYSTAT 12 CAPABILITY MATRIX v7
LESS EFFORT New Feature Description Advantages Benefits
dropdown list.
• A global option is provided to turn off command autocompletion.
Command Line and
Dialog Interfaces
Interlinked
• Any commands that are executed in the Commandspace are automatically translated by any dialogs that depend on these commands.
• So, an analysis can be initiated through commands, and then continued through dialogs.
• For example, an analysis of variance can be performed using commands, and the estimated model can be tested through the ANOVA: Hypothesis Test dialog.
• This facility is available for the Hypothesis procedures in ANOVA, General Linear Models, and Mixed Models, as also in the dialogs of Logistic Regression and Response Surface Methods.
Users can make their own choice of a combination of command lines and menu-dialog actions.
Work can now be faster since it can be menu-driven when command syntax is not immediately known.
Bubble Help • Apart from the help provided on the status bar about each menu item, a more detailed description is provided in a "bubble" that appears when you pause the mouse on the menu item for a few seconds.
• Help on a feature can be instantly obtained just by mouse hover.
• A more detailed description can be given than possible through the
• Reduces time and effort in searching for help on a particular feature.

Confidential Page 25 of 46 SYSTAT 12 CAPABILITY MATRIX v7
LESS EFFORT New Feature Description Advantages Benefits
• A global option is provided to specify the number of seconds to pause the mouse before the help appears, or even turn off the help completely.
status bar help.
• The time delay and appearance is controlled by a global option.
Customizable User
Interface
• New menu items linked to command files or a set of typed commands, can be created and dragged to any location in the menu.
• New popup menus can be created in the Menu Bar.
• Status Bar help, tooltip (for toolbar buttons) and Bubble Help for User menu items can be provided using the Utilities: User Menu: Add/Delete/Modify dialog.
• Several new keyboard shortcuts have been introduced. For example, you can press F6 to invoke the Edit: Options dialog, Ctrl+L to submit the current command line, and F4 to invoke the Customize dialog.
• SYSTAT provides several context menus that pop up on right-clicking in various components (tabs or nodes in the three spaces) of its interface. This gives you convenient access to some actions that you would otherwise have
• Links to commands or command files can be created in any part of the menu,
• Entirely custom menus can be created in the Menu Bar,
• Various customized menus can be created, saved and used.
Time and effort can be saved in accessing the features often used.

Confidential Page 26 of 46 SYSTAT 12 CAPABILITY MATRIX v7
LESS EFFORT New Feature Description Advantages Benefits
to perform through other means. For example, you can right-click on a data file tab in the Viewspace, and click Close, to close the data file.
• The customized interface can be saved to a SYSTAT theme file and applied whenever required.
• The interface has the Windows XP style. That means, it adopts the current Windows XP theme that is applied for the Windows Desktop.
Themes • Ready-made interface themes are supplied as an alternative to the default general-purpose theme, to suit different themes and different fields of application.
• Currently, three different interface themes are provided: Classic, Default and Introductory_Statistics. Each theme consists of a selection of menu items relevant to the theme that the name reflects.
• A facility to download themes from the Internet is also provided.
• Any number of customized interface themes can be created and saved.
• The saved theme includes information
Features often used and are special to a specific field of work are made easily available and in a form that is most relevant to a given class of users.
The software is made available in a user-friendly, familiar, and less intimidating format.

Confidential Page 27 of 46 SYSTAT 12 CAPABILITY MATRIX v7
LESS EFFORT New Feature Description Advantages Benefits
about the menu structure, button images, arrangement of various components of the interface including the status bar, toolbars, Viewspace, Commandspace and Workspace, size of the spaces, and the output scheme (font style and color of various components).
New Default Menu
Structure
• The default menu has been reorganized by rearranging and recaptioning menu items to provide easier access to the more common items in a given menu.
• The terminology used is more general and direct so as to be understood by any class of users.
• Some of the items that were only available only through the toolbar, like Recent Dialogs and Submit from File List, have also been accommodated in the menu.
• Likewise, some items that did not appear in any toolbar, like Full Screen Viewspace, Customize and Add/Delete/Modify, now appear in the appropriate toolbar.
• The classic menu structure used in
• All menu items can be accessed either through the menu or through a toolbar as desired.
• The Quick Access menu gives a hint about how you can customize the menu system so as to access all that is required from a single menu.
• A feature can be identified/located more easily.
• The user will get a feel for how to customize the menu structure as required.

Confidential Page 28 of 46 SYSTAT 12 CAPABILITY MATRIX v7
LESS EFFORT New Feature Description Advantages Benefits
SYSTAT 11, is available as a theme that you can apply from the Startpage or Utilities menu.
• A Quick Access menu is provided containing some basic statistical analyses and exploratory graphical techniques of widespread use.
Case Selection
Tools
• Various tools related to case selection are available on the Data toolbar and menu.
• When a case selection (Data: Select Cases dialog or SELECT command) is done, an Invert Case Selection tool is provided to invert the case selection.
• When one or more cases are selected, First Case in Selection, Previous Case in Selection, Next Case in Selection and Last Case in Selection tools are provided to navigate through the selection row-by-row.
Selection of cases for analysis is made easy with the help of toolbars, avoiding commands and dialogs. Thus one can now try out various subsets of cases for analysis very easily.
Reduces working time when exploring with the data to find a suitable subset for the purpose on hand.
Enhanced Status
Bar
• The status bar of SYSTAT has been enhanced significantly to include switches for various global options and processing conditions.
• For example, the switches QGRAPH, HTM and ECHO denote the current global setting for appearance of Quick
• The current global settings are easily seen,
• Global options can be changed at the click of the mouse.
Time and effort is saved in accessing the features involved, or finding out the current settings.

Confidential Page 29 of 46 SYSTAT 12 CAPABILITY MATRIX v7
LESS EFFORT New Feature Description Advantages Benefits
Graphs, mode of output, and echoing commands
• Clicking a status bar item will toggle the setting; the caption enables or disables accordingly.
• There are also switches for processing conditions in effect, like Frequency (FRQ), By Groups (BY) and Case Selection (SEL). Pausing the mouse on any of these displays the current declaration, if any.
• Clicking any of these pops up the corresponding dialog box where you can change the declaration.
• The content can be customized to show just the desired items.
Enhanced Dialog
Boxes
The dialog boxes of SYSTAT have been enhanced as follows:
• If a variable label is defined for a variable, it will appear as a tooltip when you pause the mouse on the variable name in the variable lists appearing in dialog boxes.
• If a variable is declared categorical, an icon will appear to indicate that it is categorical.
• Grid controls have been provided to
• Variable labels and category information are easily seen while working with dialog boxes.
• Multiple rows of input can be easily entered in one go, instead of reopening the dialog for each row of input.
Time and effort is saved in locating or obtaining information about variables, and entering multiple lines of input, while working within a dialog box

Confidential Page 30 of 46 SYSTAT 12 CAPABILITY MATRIX v7
LESS EFFORT New Feature Description Advantages Benefits
take any number of rows in dialog boxes requiring an indefinite amount of input.
• For example, you can specify any number of IF conditions in the If … Then Let dialog. Likewise, you can specify value labels for any number of data values in the Value Labels dialog.
Data File
Comments
• File comments for a data file can be written/edited using the Data Editor.
• Simply right-click the corresponding tab for the data file, or the top-left corner cell of the Data/Variable Editor and select File Comment.
• The File Comment dialog pops up where the comments can be typed.
• The comments can be seen by placing the cursor in the top-left corner cell of the Data/Variable Editor.
• Until now, these could only be added by appending the desired string to the DSAVE command as an option.
• The file comments will get saved in the data file.
• Data file comments can be given through the dialog interface instead of using commands.
• Data file comments can be provided and viewed conveniently.
Crash Recovery
and Rescue System
• In the event of an abnormal termination of the application, SYSTAT attempts to rescue the
• The SYSTAT team can use the rescued files to reproduce the problem
• Reduces time and effort in gathering details about an issue.

Confidential Page 31 of 46 SYSTAT 12 CAPABILITY MATRIX v7
LESS EFFORT New Feature Description Advantages Benefits
command log, active data file and output file.
• A Rescue Report dialog pops up with the paths to the rescued files. Click Send Report, attach the files to the mail message that is automatically generated, and send the message.
• When SYSTAT opens the next time, it displays a Systat File Recovery System dialog that gives the option to save the open data files from the previous session.
and fix it.
• This facility allows you to retrieve any unsaved changes to your data files.
• Saves the time that would otherwise be required in rebuilding data files having unsaved changes.
Longer Variable
Names
• Variable names can now have up to 256 characters.
• String variable values can also have up to 256 characters.
• Consequently, the default width of a string is assumed to be 256 while applying the character functions LPD$ and RPD$.
Variable names in output need not be abbreviated and can be their full names.
Output will be in a suitable form for export needing less editing.
Larger Data Field • The data field is now (23, 14).
• The total number of digits in a data value, including the decimal point and the digits after the decimal point, is now 23, and the number of decimal places is 14.
Your data can now be represented in the data file without losing accuracy.
You can now handle data with a large number of significant digits.
Variable Labels • Variable labels can now be defined; Your numeric output and Exported output and graphs to

Confidential Page 32 of 46 SYSTAT 12 CAPABILITY MATRIX v7
LESS EFFORT New Feature Description Advantages Benefits
they can be up to 256 characters in length.
• You can define variable labels using the VARLAB command, the Variable Labels column in the Variable Editor, or the Variable Properties dialog.
• These labels are saved in the data file.
• Variable labels are reflected in the output of all graphs and numeric modules. You can control the display of variable labels in the output using the VDISPLAY command, or Variable Label Display under Output Format in the Edit menu.
• Select either (variable) Label, (variable) Name, or Both. If you select Both, the output will display “variable label (variable name)”. You can also set this in the Output tab of the Edit: Options dialog.
graphs can be made more informative.
reports and articles need less editing.
Value Labels • Value label information can now be saved to the data file.
• Labeling of variables has been delinked from the Category declaration feature.
• For instance, labels will appear in a bar chart on labeled variables
• Value labels need not be set every time a data file is opened.
• Value labels can be defined for non-categorical variables as well.
• Time and effort is reduced considerably.
• Exported output and graphs to reports and articles need less editing.

Confidential Page 33 of 46 SYSTAT 12 CAPABILITY MATRIX v7
LESS EFFORT New Feature Description Advantages Benefits
regardless of whether the variable has been declared categorical or not.
• The display of labels in the output can be controlled through global options - display labels, names/values or both.
• Your numeric output and graphs can be made more informative.
New Data File
Format with
Compression
• SYSTAT 12 has a new default data file format, with the extension .SYZ. This format achieves file compression and will store variable labels, value labels, category, frequency, weight and ID variable information.
• For backward compatibility, the option of saving in the SYSTAT data file format suitable for versions 8 through 11 is available. The above additional information will not be saved though.
• If you do need to save data in the older file format, and you have value labels defined, you can use the new GENLAB = filename.syc option of the NAMES command to generate a command file containing the corresponding LABEL commands to recreate the value label information in an older version of SYSTAT.
• Data files now contain a lot more information on the variables; and variable names and labels can be longer, etc.; thus file sizes are larger and so compressing them is helpful.
• Data editing and manipulation tasks performed during a session need not be repeated when the data file is used in subsequent work.
• Data files can still be edited in older versions of SYSTAT.
• Valuable information on data is preserved.
• Saves space in data file storage devices.
• Saves time and effort in manually reconstructing the data for use in older versions.

Confidential Page 34 of 46 SYSTAT 12 CAPABILITY MATRIX v7
LESS EFFORT New Feature Description Advantages Benefits
Enhanced Variable
Properties
• There is now a new display format for date variables which allows you to display values with both the date and time written together. Any given valid data format can be combined with any given valid time format.
• With the Variable Properties dialog box, you can navigate through the variables in the data file while setting its properties. You can suppress automatic saving of any changes you make, if you just need to view the properties.
• This dialog box also allows you to specify the variable label, and set the variable as categorical.
• Date and time formats can be defined simultaneously for a variable.
• Variable properties can be viewed/edited as you navigate through the data columns.
• Useful variable information is available with the data file and need not be entered every time you use the file.
• Saves time and effort in defining variables that involve both time and effort.
• Saves user time and effort and ensures consistency in output with repeated use of the same data set.
Copy/Paste Options • The content (text) of one or more cells in the Data or Variable Editor can be copied the content to the clipboard as plain text.
• For example, set a column in the Data Editor to display value labels instead of data values, select part or whole of the column, right-click on it, and select Copy as Text. The value label entries get copied to the clipboard.
• Data from any source can be copied to
• A variety of paste options are provided, each having a definite unique utility.
• Variables can be inserted without having to confirm the variable name to be set..
• Saves time and effort in tailoring the data being pasted to match the format recognized by SYSTAT
• Simple text can be copied from SYSTAT and pasted wherever required.
• Variable properties need not be manually set for each similar variable.
• Variables can be inserted
Confidential Page 35 of 46 SYSTAT 12 CAPABILITY MATRIX v7
LESS EFFORT New Feature Description Advantages Benefits
the clipboard, the characters used as row and column separators in that data can be specified, and then the data can be pasted to the Data Editor.
• By default, SYSTAT assumes the Tab character as the column separator and Enter as the row separator. Copy the data, right-click the desired cell of the Data Editor, and select Paste with Options. Check the column and row separators used, check Other and enter any custom separators you may have used, and press OK.
• The properties of one variable can be pasted onto another variable using the context menu for columns of the Data Editor or rows of the Variable Editor. Copy the desired column(s) of the Data Editor, or row(s) of the Variable Editor, right-click the desired location and select Paste Properties.
• Variables can be inserted directly, the variable name being automatically set as the original name appended by “_1” or a higher number as appropriate.
• Copy a Data Editor column or Variable Editor row, and select Insert
easily.

Confidential Page 36 of 46 SYSTAT 12 CAPABILITY MATRIX v7
LESS EFFORT New Feature Description Advantages Benefits
Variable(s) from Clipboard.
Variable Statistics • Summary statistics of a numeric variable, and a histogram, can be obtained just by right-clicking on the Variable name in the Data Editor, and selecting Variable Statistics.
• The statistics can be sent to the Output Editor by clicking Send to Output in the window that pops up.
• Before beginning any analysis, you have the option to quickly study the distributional properties of the variables of interest in your data set.
• This will help in making decisions such as inclusion or exclusion of the variable, any transformations on it, etc.
A part of exploratory analysis of variables in your data file is easily, conveniently, and quickly performed.
Undo/Redo • Undo facility is provided in the Data Editor. You can undo up to a maximum of 32 recent changes in the same session.
• Any changes you make in the Data Editor can be undone through this facility, for example, manual editing of data, Find and Replace, commands like LET, RANK, SORT, etc.
• In the case of variable properties, undo/redo will work only for the changes made to the variable name and type.
• Undo/redo will not work for any
Material deleted by mistake can easily be recovered. Repeated work can be simplified.
Data editing is made simpler, convenient, and less time-consuming.

Confidential Page 37 of 46 SYSTAT 12 CAPABILITY MATRIX v7
LESS EFFORT New Feature Description Advantages Benefits
modifications in data processing conditions like Category, By groups, Select cases, etc.
Import/Export,
Merge, Append
Data Files
• Importing from or exporting to higher versions of external data files than before, is possible.
• The Merge feature can now be used even if the files are not sorted by key variables.
• When files are merged, both variable properties and data processing conditions are carried over.
• In SYSTAT 11, if two files that are merged contained a common variable, only the contents of the first file of the common variable appeared in the merged file. In SYSTAT 12, contents of both the files appear in the merged file with file names attached to variable names.
• When files are appended, both variable properties and data processing conditions are carried over to the appended file.
• The latest formats of external data files can be handled, in most cases.
• The restrictions on merging files have been reduced.
• There is no loss of information while merging or appending data files.
• Saves time and effort by eliminating the need to do initial data manipulation manually.
• Data files can be imported/exported to the current or near-current versions and used in the respective applications.
• Data files can be merged/appended without loss of information, retaining all the original properties of the data files.

Confidential Page 38 of 46 SYSTAT 12 CAPABILITY MATRIX v7
LESS EFFORT New Feature Description Advantages Benefits
Recoding Variables • You can recode variables using the Data: Transform: Recode dialog box or the RECODE command.
• You can either replace the values of an existing variable or create a new variable with the recoded values.
• You can simultaneously recode more than one variables.
Recoding one or more variables is easily accomplished.
Data reorganization, editing and manipulation is very easy and effortless.
Trimming Data • Data on chosen variables can be subjected to a user-chosen percentage trimming (deletion of cases) of extreme values on one chosen side or on both sides.
• This can either be done using the Data: Trim dialog or the TRIM command.
Extreme values are instantly eliminated by using this facility.
Saves time and effort in trimming data off extreme values before the rest of the data can be analyzed.

Confidential Page 39 of 46 SYSTAT 12 CAPABILITY MATRIX v7
Trimming
Leading/Trailing
Spaces
• SYSTAT allows you to enter string data values with leading and trailing spaces. Some of SYSTAT's character functions, namely LFT$, CNT$, RGT$, LPD$ and RPD$, also insert leading and/or trailing spaces in string values.
• A global option is provided to trim out such spaces before processing by the LABEL, ORDER and RECODE commands.
• Leading and/or trailing spaces are not directly visible to the user.
• The spaces can be ignored by using this option, while setting and ordering value labels, as well as recoding variables.
• The defining of value labels, their order of display, or recoding variables is made easier.
Streamlined
Command
Language
• The command language (syntax) has been streamlined and made logically consistent and natural.
• Informative error and warning messages wherever applicable
• Insert comments at the end of a command line
It is now easier to remember and recall commands and their syntax.
Work with Interactive commands or batch (Untitled) processing will now be faster and less error-prone.
Temporary
Variables and
Arrays
• The variables which are created in memory temporarily for doing data-related operations are called temporary variables.
• Assigning a temporary variable to a data variable is possible; the reverse is also possible with the help of DATA or DATA$ functions.
• You can clear these variables from memory using CLEAR VARIABLES command.
You can assign either numeric or string values to temporary variables and arrays without even having to open a data file.
Temporary assignments can be made easily, and used in expressions, data transformations, etc.

Confidential Page 40 of 46 SYSTAT 12 CAPABILITY MATRIX v7
• Temporary subscripted variables can also be created with the ARRAY command.
• You can clear these variables from memory using the CLEAR ARRAYS command.
New Commands/
Options/Functions
• Multi-line IF statements can now be issued.
• Create a block of statements by writing them within BEGINBLOCK and ENDBLOCK commands.
• Conclude the loop with an ENDIF command.
• WHILE..ENDWHILE loops can be defined.
• User-defined functions can be created.
• New SYSTAT functions like DATA, DATA$, LEN$, NCAT, and multi-case functions can be used.
• MATRIX having been made global, new commands MLET, MSELECT, MDELETE and MSAVE have been provided
• Some useful new options have been added to existing commands like CATEGORY and FPATH.
• Complicated conditional transformations and other actions can be requested using a simple command syntax.
• Reduces time and effort by condensing the command script required to define conditional transformations and other actions.
• All the functionality of the MATRIX module is available with a small change in the related commands.
Smart Output • The output is now HTML based with tabular and text modes.
• Tables can be directly and conveniently selected, and they can be
• Smart-looking output, with tables neatly done.
• Presentation of output can be customized as
Output can be exported to reports and will need very little editing thereafter.

Confidential Page 41 of 46 SYSTAT 12 CAPABILITY MATRIX v7
copied to external applications without distortion.
• There are collapsible links for parts of the output that can be selectively expanded or collapsed with a mouse-click.
• HTML editing is possible; simply select View Source in the context menu.
• Classic output format can be specified for use in plain-text editors. It has now been consistently implemented across features. The tabular format consistently applies the font specified under Proportional output; the classic format consistently applies the font specified under Monospaced output.
• Mouse-wheel scrolling is possible to see the desired parts of output.
• By default, the output is arranged chronologically. You can set it to be grouped by data file nodes so that all the graphs and analyses pertaining to a given data file are placed together. Restart SYSTAT for this option to come into effect.
desired.

Confidential Page 42 of 46 SYSTAT 12 CAPABILITY MATRIX v7
Enhanced Print
Preview of Output
• Previewing output before printing has more options.
• You can: � switch between portrait and
landscape modes � specify the page setup including
headers, footers and margins � turn headers and footers on or off � view full width, full page, various
page views, � preview just a selection of the
output, and � shrink/enlarge the content.
Print preview is more powerful with the added options.
View and customizing the page settings before printing output is very convenient.
Designing Output • Very small font sizes, even below 8 points, can be specified through the Font size option in the Output tab of the Edit: Options dialog.
• Text in tables can be wrapped and/or truncated,
• The text in each cell of a table can be wrapped into multiple lines if they extend beyond 15 characters. Row headers will be wrapped if they extend beyond thrice this number, i.e., 45 characters.
• Similarly, the text in tables can also be truncated. By default, in each cell, the truncation will happen at 45 characters.
• You can set a different number for
• Setting small font sizes may help if the usual font sizes would not fit a very wide table in a printed page.
• Wrapping and truncating text is very useful when variable and/or value labels are defined.
• Large tables in the output can be condensed to fit the current page/print settings.
• Tables can be formatted for the screen as well, by preventing wrapping, truncation and splitting.
• Output can be designed to appear in any desired format and structure.
• Printing of output, especially tabular content, is very convenient.
• The output can be designed for use in presentations as well.

Confidential Page 43 of 46 SYSTAT 12 CAPABILITY MATRIX v7
wrapping and truncating, through the Output tab in the Edit: Options dialog. You can even prevent wrapping and/or truncation.
• For the “Narrow” and “Wide” page width options, the number of characters is dynamically set based on the current font size and output format (tabular or classic).
• Tables exceeding a certain number of columns will be split. While splitting, the number of columns in each split is also dynamically determined based on the page width setting.
• One implication of the page width is that very wide tables will get split into two or more parts (appearing one below the other), even with the Wide setting.
• To prevent splitting, an additional option “None” is provided. This defined an “infinite” width for the output.

Confidential Page 44 of 46 SYSTAT 12 CAPABILITY MATRIX v7
Formatting Tools • Images can be inserted anywhere in the output by clicking the desired location of the image, and using the Insert Image tool on the Format Bar.
• In the Picture dialog that pops up, specify the path to the image file, the alternate text, the layout and spacing.
• The format for the current line or selection of output using the Block Format tool on the Format Bar.
• There are also tools to Indent or Outdent the current line or selection of output.
Formatting tools can be used to edit output within the SYSTAT Output Editor, without having to resort to external HTML editors.
• Formatting the output within SYSTAT is more convenient.
Customizing
Output
• The formatting for various components of the output, viz., echoed commands, text, error and warning messages, headers, sub-headers, table captions, table headers/footers, and table body, can be customized,
• Page background (color and/or image) can be defined,
• Use the Output Scheme tab in the Edit: Options dialog to customize the font color, style (regular or bold) and background (color) of these components, as well as the page background.
• If you create an interface theme with these settings, along with settings in the Output tab, these are also saved to
• Various components of the output can be fully customized in terms of the format.
• Various “output schemes” can thus be designed and even saved to theme files for future use.
• Output can be customized easily and conveniently.
• A choice of various saved output schemes for use in the appropriate situation is available.

Confidential Page 45 of 46 SYSTAT 12 CAPABILITY MATRIX v7
the theme file.
Saving Output • When a SYSTAT output file (.SYO) is saved, the data files are linked to the output file.
• When a SYSTAT output file is saved, the command log will also be saved with it.
• These option can still be disabled by unchecking “Link data files to output file” and “Save command log in output file” respectively in the General tab of the Edit: Options dialog.
• The format of images that appear in the output can be specified.
• Output can be saved in SYSTAT (.SYO), HTML (.HTM), single-page HTML (.MHT), or RTF (Word or Wordpad compatible) formats.
• An output file saved in a previous session, can be opened, and the session can be “resumed”.
• That means, you can open an output file saved in a previous session, and re-use the commands from that session.
• Output can be saved in various formats.
• Work can be split up conveniently across sessions without the need for recreating output every time.
• The size of the output file may be reduced a little, through the global options provided, if many data files and commands have been used, and/or many graphs have been drawn.
• The output can be edited in an editor of choice by saving in the corresponding format.

Confidential Page 46 of 46 SYSTAT 12 CAPABILITY MATRIX v7
More Help The following features have been provided to help the user in any given task:
• Help through the Commandspace Bubble Help
• Data file references
• Acronym expansions
• Tutorial
• FAQ
Innumerable items of Help makes the job of understanding and running SYSTAT much easier, faster, and error-free.
Most of SYSTAT work can be carried out without having to look up the printed manual. A great deal of help is available at the fingertips or at a click of the mouse.