Embed Size (px)
Citation preview
Syst. Biol. 56(04):543–563, 2007Copyright c© Society of Systematic BiologistsISSN: 1063-5157 print / 1076-836X onlineDOI: 10.1080/10635150701477825
Calibration Choice, Rate Smoothing, and the Pattern of Tetrapod DiversificationAccording to the Long Nuclear Gene RAG-1
ANDREW F. HUGALL,1 RALPH FOSTER,2 AND MICHAEL S. Y. LEE1,2
1School of Earth and Environmental Sciences, University of Adelaide, SA 5005, Australia; E-mail: [email protected] (A.F.H.)2Natural Sciences Building, South Australian Museum, Adelaide, SA 5000, Australia
Abstract.— A phylogeny of tetrapods is inferred from nearly complete sequences of the nuclear RAG-1 gene sampled across88 taxa encompassing all major clades, analyzed via parsimony and Bayesian methods. The phylogeny provides supportfor Lissamphibia, Theria, Lepidosauria, a turtle-archosaur clade, as well as most traditionally accepted groupings. This treeallows simultaneous molecular clock dating for all tetrapod groups using a set of well-corroborated calibrations. Relaxedclock (PLRS) methods, using the amniote = 315 Mya (million years ago) calibration or a set of consistent calibrations, recoversreasonable divergence dates for most groups. However, the analysis systematically underestimates divergence dates withinarchosaurs. The bird-crocodile split, robustly documented in the fossil record as being around ∼245 Mya, is estimated at only∼190 Mya, and dates for other divergences within archosaurs are similarly underestimated. Archosaurs, and particularyturtles have slow apparent rates possibly confounding rate modeling, and inclusion of calibrations within archosaurs (despitetheir high deviances) not only improves divergence estimates within archosaurs, but also across other groups. Notably, themonotreme-therian split (∼210 Mya) matches the fossil record; the squamate radiation (∼190 Mya) is younger than suggestedby some recent molecular studies and inconsistent with identification of ∼220 and ∼165 Myo (million-year-old) fossils asacrodont iguanians and ∼95 Myo fossils colubroid snakes; the bird-lizard (reptile) split is considerably older than fossilestimates (≤285 Mya); and Sphenodon is a remarkable phylogenetic relic, being the sole survivor of a lineage more thana quarter of a billion years old. Comparison with other molecular clock studies of tetrapod divergences suggests thatthe common practice of enforcing most calibrations as minima, with a single liberal maximal constraint, will systematicallyoverestimate divergence dates. Similarly, saturation of mitochondrial DNA sequences, and the resultant greater compressionof basal branches means that using only external deep calibrations will also lead to inflated age estimates within the focalingroup. [Amniota; cross-validation; fossil calibration; penalized likelihood rate smoothing; relaxed-clock; Reptilia; tetrapodphylogeny. RAG-1.]
Despite being the most heavily studied organisms,relationships between the major groups of land ver-tebrates (tetrapods) remain incompletely known. Thelong history of morphological work has failed to resolvethe affinities of many highly divergent groups; recentlymolecular data have resolved many uncertainties butconversely challenged some previously well-acceptedgroups. Currently, there is strong morphological andmolecular evidence for the monophyly of the followinghigher-level groups: lissamphibians, amniotes, mam-mals, sauropsids (“reptiles” and birds), and lepidosaurs.However, there remains uncertainty in several otherareas (see Meyer and Zardoya, 2003, and referencestherein). The interrelationships of the three lineages ofliving amphibians remain uncertain, with both morpho-logical and molecular data favoring either the urodele-caecilian or urodele-anuran hypothesis; the most recentstudies (e.g., San Mauro et al., 2005; Zhang et al., 2005)favor the latter but support is not strong. Similarly, long-accepted relationships among monotreme, marsupial,and placental mammals were challenged when somenucleotide and DNA hybridization studies favored aheterodox monotreme and marsupial clade; more re-cent studies have suggested that this might be due tobase composition bias (Phillips and Penny, 2003) andnuclear data corroborate the traditional hypothesis (e.g.,Killian et al., 2001; Baker et al., 2004; van Rheede et al.,2006). The monophyly of diapsids and of archosaurs wasquestioned when multiple molecular studies suggestedthat turtles might be nested within diapsids, and possi-bly even within archosaurs. Nevertheless, these resultsare problematic because of the almost total lack of sup-
porting morphological evidence uniting archosaurs andturtles (see Rieppel, 2000); furthermore, the moleculardatasets disagree on the exact position of turtles withinarchosauromorphs, and “further molecular clarificationis needed” (Meyer and Zardoya, 2003).
Estimates for the divergence times of the major groupsof tetrapods are also contentious, with molecular clockestimates often at odds with fossil-based estimates. Acommon pattern is that the molecular dates imply muchearlier divergences than those suggested by the fos-sil record, e.g. within birds (Cooper and Penny, 1997;Pereira and Baker, 2006), within mammals (Kumar andHedges, 1998; Penny et al., 1999; Springer et al., 2003),and within amphibians (San Mauro et al., 2005; Zhanget al., 2005). Within mammals, the molecular data sug-gests that divergences between monotremes, marsupi-als, and placentals were very closely spaced in time, atodds with morphological and palaeontological evidencethat places monotremes quite distant to the other twoliving groups (Phillips and Penny, 2003). The divergencedates inferred from molecular clock studies, if robust,can also be used to refute phylogenetic hypotheses aboutfossil taxa; for instance, claims of very early advanced(colubroid) snakes. However, rapid advances in molecu-lar clock methodology (e.g., Welch and Bromham, 2005)suggest that the earlier studies need to be revisited. Fur-thermore, only two clock analyses (Vidal and Hedges,2005; Wiens et al., 2006) have so far been applied to datedivergences among the most diverse clade of amniotes,the squamates (lizards and snakes). Vidal and Hedges in-ferred divergences much deeper than those suggested byboth Wiens et al. and the fossil record (e.g., Evans, 2003).
543

544 SYSTEMATIC BIOLOGY VOL. 56
Although molecular data promise to resolve many ofthe above uncertainties about phylogenetic relationshipsand divergence dates, many of the previous data setsare inconclusive for several reasons. First, until recentlythe only well-sampled data sets with long sequencesused mitochondrial DNA (e.g., Janke et al., 2001; Restet al., 2003; Pereira and Baker, 2006), which has evo-lutionary dynamics (fast rate, saturation, nonstationar-ity) that can create misleading topologies and/or branchlengths at the divergences considered here (e.g., Springeret al., 2001; Phillips and Penny, 2003). Second, many ofthe studies which used more appropriate data such asmultiple nuclear genes (e.g., Kumar and Hedges, 1998)had insufficient taxon sampling, with amphibians andreptiles often being poorly represented and many keygroups (e.g., sphenodontids) not sampled at all. Thissparse and unbalanced sampling can lead to errors re-constructing both topology and branch lengths and thusthe pattern and timing of divergences (e.g., Zwickl andHillis, 2002). Surprisingly, there has yet to be a long nu-clear gene sequence sampled extensively across everymajor group of tetrapods and their nearest sarcoptery-gian outgroups. This is due to nuclear genes being poorlysampled in lower tetrapods in general, and the most com-monly used gene (c-mos) is often represented by veryshort (375 bp) fragments. Thus, the extensive nuclear se-quence data sets required for testing hypotheses aboutphylogeny and diversification times in tetrapods do notyet exist.
RAG-1 (recombination-activating gene 1) is an ideallocus for this purpose. It is a long (∼3 kb) gene foundacross vertebrates that exists as a single copy and is unin-terrupted by introns (Groth and Barrowclough, 1999, andreferences therein). It has an overall evolutionary rate ap-propriate to the divergence scales of interest, and further-more contains slightly faster and slightly slower regionsthat could resolve problems at different time scales. Inseparate studies, large regions of this gene have beensampled across several tetrapod groups, but as thesestudies proceeded independently, taxon sampling hasbeen haphazard. Most of the gene (∼ 2.8 kb) has nowbeen sequenced in studies dealing with lungfishes andcoelacanths (Brinkmann et al., 2004), birds (Groth andBarrowclough, 1999), turtles (Krenz et al., 2005), and lep-idosaurs (Townsend et al., 2004); in addition, general ge-nomic studies have resulted in sequences for a urodele, amarsupial, and several placental mammals being avail-able on GenBank. However, major gaps remain withinmonotremes, marsupials, anurans, urodeles, and caecil-ians, though smaller (1 to 1.5 kb) fragments of RAG-1have been sequenced for these taxa (e.g., San Mauro et al.,2004; Baker et al., 2004).
The current study aims to use nearly complete se-quences of RAG-1 across a dense sample of tetrapods toelucidate broad evolutionary patterns. Complete RAG-1is well sampled across birds and reptiles, but relativelypoorly sampled across other land vertebrates. Additionalsequences were obtained from lungfishes, amphibians,monotremes, and marsupials; this denser taxon sam-pling allows a wider choice of calibration points, and
more accurate estimates of model parameters and thus,phylogenetic trees (Zwickl and Hillis, 2002). Phyloge-netic analyses were then performed using parsimonyand Bayesian methods. The optimal trees were testedand corrected for rate variation, and multiple calibrationpoints were used to infer divergence dates between ma-jor tetrapod groups, especially within squamates. Thisdated phylogeny sheds new light on the timing and pat-tern of the radiation of land vertebrates.
SEQUENCING AND ALIGNMENT
Taxon Sampling and Sequencing
Twelve additional mammals and amphibians were se-quenced (Table 1) to improve taxon sampling for thecomplete RAG-1 gene. Some of these species have al-ready been sequenced for smaller portions of RAG-1,and in these instances only the remaining regions weretargeted. Trees were rooted with the coelacanth (Latime-ria); outgroups more divergent than sarcopterygian fishwere not used because of inclusion of these deeply di-vergent groups led to much larger regions of alignmentambiguity. In addition, for the clades that were denselysampled in previous studies (squamates, crocodylians,turtles, and birds), certain species were omitted in or-der to keep the taxon set tractable for detailed phyloge-netic analyses and maintain relatively balanced numbersacross major lineages to aid phylogenetic reconstruction.All major groupings in these clades were represented inthe retained exemplar set, and this pruning had no topo-logical effect, as reconstructed relationships were con-gruent with those obtained using the original full datasets. All new sequences were determined for both strandsusing direct automated sequencing from PCR products.Detailed information on specimens, primers, PCR, andsequencing are available in the supplementary informa-tion (available online at http://systematicbiology.org).
Alignment and Sequence Characteristics
The final aligned data set comprises 88 taxa and 3297sites and is available via TreeBASE accession S1781. TheTownsend et al. (2004) lepidosaur alignment was used asa fixed alignment block, with other taxa assembled andadded to this alignment using ClustalX (Thompson et al.,1997) and amino acid sequences. Because of ambiguousalignment at both amino acid and nucleotide levels, thefirst (5’ end) 474 alignment positions were excluded fromanalysis (for most taxa this amounts to around the first360 sequenced sites). The last (3’ end) 210 sites werealso excluded to minimize missing data leaving 2613sites (871 codons). The entire human RAG-1 coding re-gion (GenBank accession M29474) is 3135 nucleotidesand our included sites set covers 2592 of these (83%).Nearly all taxa have complete data for this region: threeof the five crocodylians (Gatesy et al., 2004) are miss-ing 213 sites at the 5’ end, Lepidosiren is missing 70 sitesat the 5’ end, Hypogeophis is missing 137 sites at 3’ end,and some taxa (Sarcophilus harrisii, Ichthyophis glutinosus,Ornithorhynchus anatinus) assembled from concatenating

2007 HUGALL ET AL.—RAG-1 TETRAPOD PHYLOGENY 545
TABLE 1. Taxa and GenBank accessions. Taxa with accession numbers for both this study and GenBank are composites of our 5’ end sequenceand a Genbank 3’ end sequence. Names are from current (October, 2005) GenBank accessions.
Higher Taxon Genus Species This study GenBank Higher Taxon Genus Species This study GenBank
Squamates Xenosaurus grandis AY662607Lialis jicari AY662628Leposoma parietale AY662621Rhineura floridana AY662618Shinisaurus crocodylurus AY662610Elgaria panamintina AY662603Heloderma suspectum AY662606Eremias sp. AY662615Xantusia vigilis AY662642Varanus griseus AY662608Lanthanotus borneensis AY662609Cylindrophis ruffus AY662613Dinodon sp. AY662611Ramphotyphlops braminus AY662612Basiliscus plumifrons AY662599Anolis paternus AY662589Leiocephalus carinatus AY662598Brookesia thieli AY662577Leiolepis belliana AY662587Japalura tricarinata AY662585Calotes calotes AY662584Physignathus cocincinus AY662582Ctenophorus salinarum AY662580Chamaeleo rudis AY662578Aspidoscelis tigris AY662620Bipes biporus AY662616Dibamus sp. AY662645Ctenotus robustus AY662630Euprepis auratus AY662629Typhlosaurus lomii AY662641Eumeces anthracinus AY662634Asymblepharus sikimmensis AY662631Zonosaurus sp. AY662644Pseudothecadactylus lindneri AY662626Gekko gecko AY662625Crenadactylus ocellatus AY662627Sphenodon punctatus AY662576
Turtles Carettochelys insculpta AY687904Lissemys punctata AY687902Apalone spinifera AY687901Chelonia mydas AY687907Podocnemis expansa AY687924Pelusios williamsi AY687923Elseya latisternum AY687920
Geochelone pardalis AY687912Dermatemys mawii AY687910Platysternon megacephalum AY687905
Mammals Monodelphis domestica U51897Notoryctes typhlops EF551555 AY125040Sarcophilus harrisii EF551556 AY125037Cercartetus concinnus EF551557 AY125036Tachyglossus aculeatus EF551558 AF303971Ornithorhynchus anatinus EF551559 AF303974Homo sapiens M29474Oryctolagus cuniculus M77666Sus scrofa AB091392Lama glama AF305953Rattus norvegicus XM230375Apomys hylocoetes AY294942Mus musculus NM009019Elephas maximus EF551560 AY125021
Amphibians Pleurodeles waltl AJ010258Ambystoma mexicanum EF551561 AY323752Xenopus laevis L19324Litoria ewingii EF551562Typhlonectes natans EF551566Hypogeophis rostratus EF551565Ichthyophis glutinosus EF551563 AY456256Rhinatrema bivittatum EF551564 AY456257
Crocodiles Alligator mississipiensis AF143724Gavialis gangeticus AF143725Caiman latirostris AY239167Tomistoma schlegelii AY239176Crocodylus cataphractus AY239174
Birds Gallus gallus M58530Megapodius freycinet AF143731Anas strepera AF143729Gavia immer AF143733Spheniscus humboldti AF143734Charadrius vociferus AF143736Grus canadensis AF143732Coracias caudata AF143737Passer montanus AF143738Tinamus guttatus AF143726Struthio camelus AF143727
Outgroups Protopterus dolloi AY442928Lepidosiren paradoxa AY442926Latimeria menadoensis AY442925
partial GenBank and newly generated sequences have70 to 90 sites of missing data in the middle region.The 88 taxa data matrix comprises 2613 sites, of which1729 are variable (first codon: 502 variable sites; sec-ond codon: 370 variable sites; third codon: 857 variablesites). This translates to 871 amino acids with 543 variablesites.
PHYLOGENETIC ANALYSES: METHODS AND RESULTS
Parsimony
Parsimony analyses (all changes weighted equally)and nonparametric bootstrapping were performed usingPAUP* (Swofford, 2000), employing heuristic searchesusing 200 random additions with TBR branch swapping.Branch support values (Bremer, 1988) were calculatedin PAUP using batch commands generated by TreeRot
v.2 (Sorenson, 2000), modified to use the above searchsettings.
The nucleotide data yielded two equally parsimonioustrees (length 14,480 steps; consistency index 0.23, reten-tion index 0.64). The two trees are very similar (differingonly in some relationships within eutherians) and simi-lar to the 50% majority-rule bootstrap consensus (shownin Fig. 1). The amino acid data yielded 168 parsimonioustrees of length 3995. All were very similar to one an-other and the two nucleotide trees, differing most no-tably in grouping Sphenodon with the turtle-archosaurlineage.
The parsimony analyses of the nucleotide data re-trieved with strong support (>90% bootstrap) many tra-ditionally accepted higher groupings within tetrapods,such as Mammalia, Archosauria, Lepidosauria,Squamata, Anguimorpha, Iguania, and Serpentes. In

546 SYSTEMATIC BIOLOGY VOL. 56
FIGURE 1. Parsimony tree, with bootstrap and Bremer support values. Tree is a 50% majority-rule consensus of 1000 nonparametric bootstrapreplicates; each of the two MPTs was very similar to this tree.
2007 HUGALL ET AL.—RAG-1 TETRAPOD PHYLOGENY 547
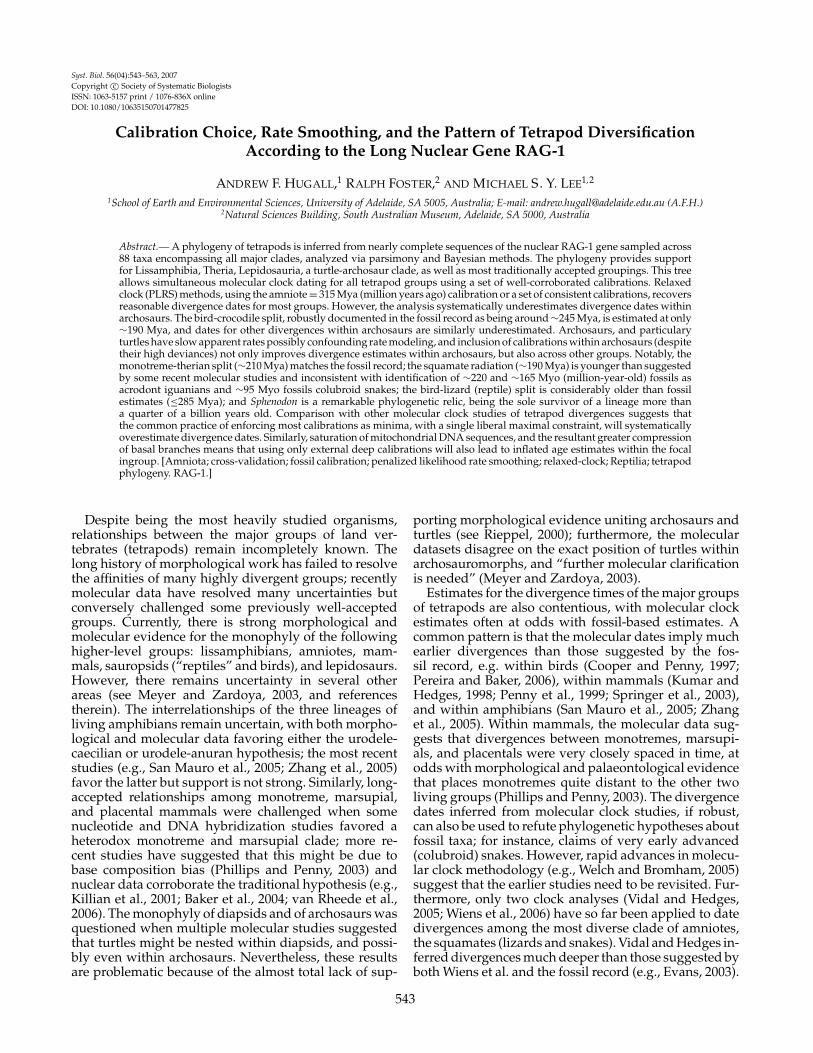
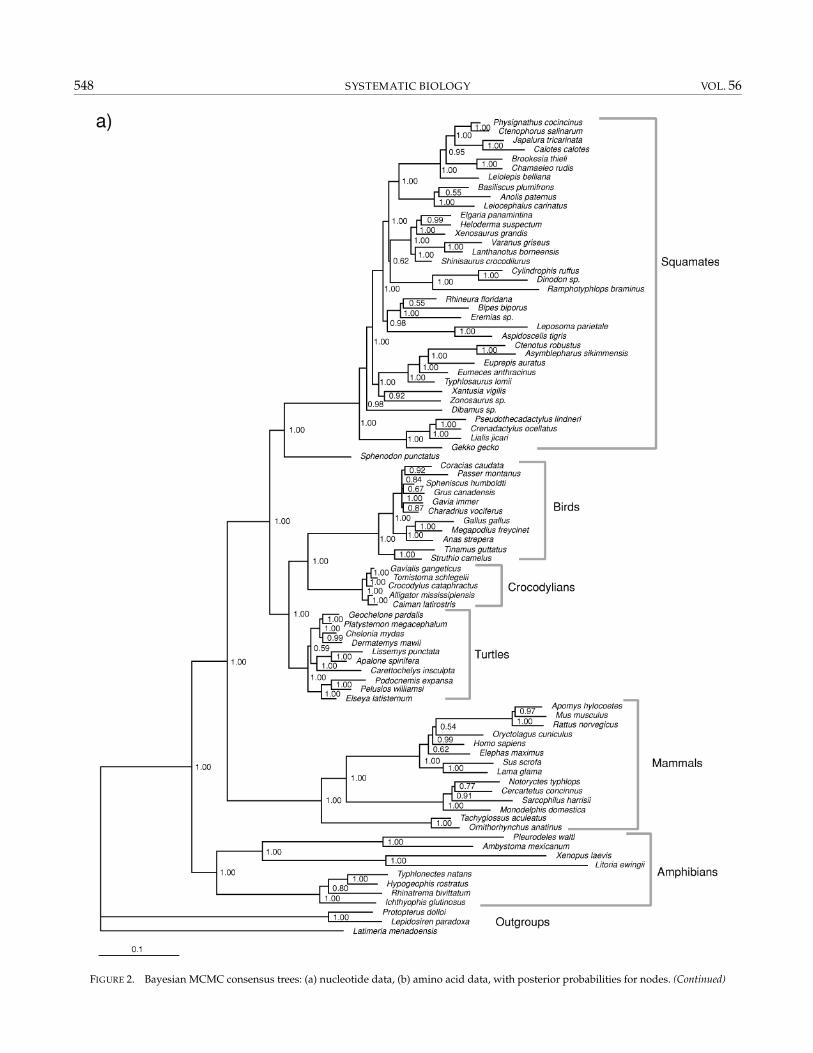
addition, the following groupings of major cladeswithin tetrapods, which have been less certain orrecently questioned (see introductory section), receivestrong support in all the above analyses (bootstrap>90%): Lissamphibia, Batrachia (Urodela + Anura),Theria (Placentalia + Marsupialia), and Testudines plusArchosauria. The branches leading to Lepidosauria,Testudines + Archosauria, Testudines, and Batrachiaare relatively short despite the strong support forthese clades. Relationships within the following cladesare largely congruent with previous analyses cited:Squamata (Townsend et al., 2004), Aves (Groth andBarrowclough, 1999), Crocodylia (Gatesy et al., 2003),and Testudines (Krenz et al., 2005; their parsimony tree).
Bayesian Analyses
Model-based analyses require proper model choice.This involved two stages: determining the appropri-ate number of data partitions and then the best modelfor each partition. Bayesian and corrected Akaikie in-formation criteria (BIC and AICc; Posada and Buckley,2004; Lee and Hugall, 2006) were used to evaluate par-tition strategies, using the MCMC equilibrium averagelnL, running MrBayes v3.04b and 3.1.1 (Ronquist andHuelsenbeck, 2003). For the nucleotide analyses, therewas significant gain (P � 0.01) by partitioning the datainto codon positions (1st, 2nd, 3rd), but further sub-divisions are ill-defined and do not result in large orsignificant gains. Unlinking branch lengths across par-titions did not significantly improve model fit. For eachcodon (partition), hierarchical likelihood-ratio tests andthe Akaikie information criterion (implemented in Mod-elTest; Posada and Crandall, 2001) indicated the follow-ing models: codon 1: HLT = GTRig, AIC = TVMig, codon2: HLT = TRNig, AIC = GTRig; codon 3: HLT and AIC =GTRig. The closest appropriate model available in Mr-Bayes was thus GTRig in all cases (see Lemmon andMoriarty, 2004). Addition of covarion to the model didnot increase likelihoods significantly, and did not changetopology or alter posterior branch length estimates (theincluded gamma parameter presumably already approx-imates it; see Penny et al., 2001), and the results reportedhere do not use this additional parameter. Thus, the finalnucleotide analysis employed a separate GTRig modelfor each codon, with branch lengths linked.
For the amino acid data, MCMC-based BIC and AICanalyses indicated the optimal model was Jones (asimplemented in MrBayes) with rates = invgamma. Runsallowing alternative models (mixed model option) indi-cated that the marginal probability for the Jones modelwas ≥0.99. Addition of covarion to the model did notresult in significant improvement or affect branch lengthestimates, and the results here are for analyses withoutthis extra parameter. Codon models were not consideredas they are computationally intractable for datasets ofthis size (Shapiro et al., 2006). Preliminary BayesianMCMC analyses were conducted to ascertain the bestrun conditions: these used 4 × 1 million step chains (withstandard heating T = 0.2), 1/100 sampling, and a 50%
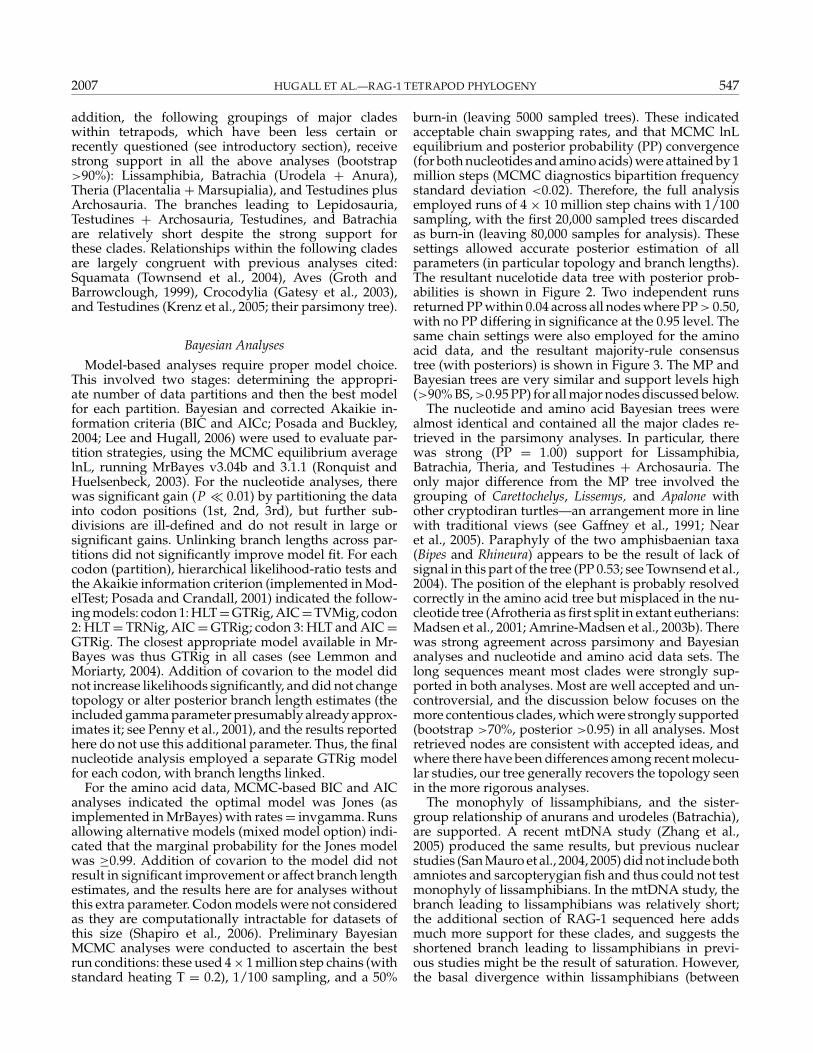
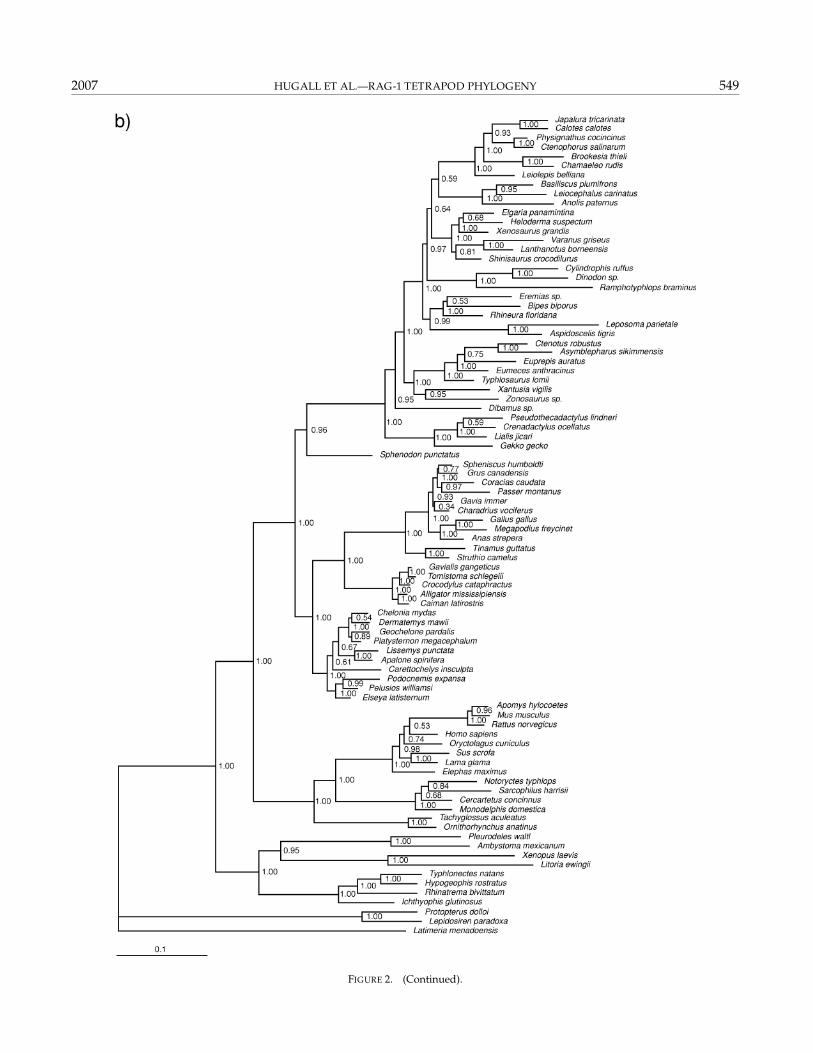
burn-in (leaving 5000 sampled trees). These indicatedacceptable chain swapping rates, and that MCMC lnLequilibrium and posterior probability (PP) convergence(for both nucleotides and amino acids) were attained by 1million steps (MCMC diagnostics bipartition frequencystandard deviation <0.02). Therefore, the full analysisemployed runs of 4 × 10 million step chains with 1/100sampling, with the first 20,000 sampled trees discardedas burn-in (leaving 80,000 samples for analysis). Thesesettings allowed accurate posterior estimation of allparameters (in particular topology and branch lengths).The resultant nucelotide data tree with posterior prob-abilities is shown in Figure 2. Two independent runsreturned PP within 0.04 across all nodes where PP > 0.50,with no PP differing in significance at the 0.95 level. Thesame chain settings were also employed for the aminoacid data, and the resultant majority-rule consensustree (with posteriors) is shown in Figure 3. The MP andBayesian trees are very similar and support levels high(>90% BS, >0.95 PP) for all major nodes discussed below.
The nucleotide and amino acid Bayesian trees werealmost identical and contained all the major clades re-trieved in the parsimony analyses. In particular, therewas strong (PP = 1.00) support for Lissamphibia,Batrachia, Theria, and Testudines + Archosauria. Theonly major difference from the MP tree involved thegrouping of Carettochelys, Lissemys, and Apalone withother cryptodiran turtles—an arrangement more in linewith traditional views (see Gaffney et al., 1991; Nearet al., 2005). Paraphyly of the two amphisbaenian taxa(Bipes and Rhineura) appears to be the result of lack ofsignal in this part of the tree (PP 0.53; see Townsend et al.,2004). The position of the elephant is probably resolvedcorrectly in the amino acid tree but misplaced in the nu-cleotide tree (Afrotheria as first split in extant eutherians:Madsen et al., 2001; Amrine-Madsen et al., 2003b). Therewas strong agreement across parsimony and Bayesiananalyses and nucleotide and amino acid data sets. Thelong sequences meant most clades were strongly sup-ported in both analyses. Most are well accepted and un-controversial, and the discussion below focuses on themore contentious clades, which were strongly supported(bootstrap >70%, posterior >0.95) in all analyses. Mostretrieved nodes are consistent with accepted ideas, andwhere there have been differences among recent molecu-lar studies, our tree generally recovers the topology seenin the more rigorous analyses.
The monophyly of lissamphibians, and the sister-group relationship of anurans and urodeles (Batrachia),are supported. A recent mtDNA study (Zhang et al.,2005) produced the same results, but previous nuclearstudies (San Mauro et al., 2004, 2005) did not include bothamniotes and sarcopterygian fish and thus could not testmonophyly of lissamphibians. In the mtDNA study, thebranch leading to lissamphibians was relatively short;the additional section of RAG-1 sequenced here addsmuch more support for these clades, and suggests theshortened branch leading to lissamphibians in previ-ous studies might be the result of saturation. However,the basal divergence within lissamphibians (between
548 SYSTEMATIC BIOLOGY VOL. 56
FIGURE 2. Bayesian MCMC consensus trees: (a) nucleotide data, (b) amino acid data, with posterior probabilities for nodes. (Continued)
2007 HUGALL ET AL.—RAG-1 TETRAPOD PHYLOGENY 549
FIGURE 2. (Continued).

550 SYSTEMATIC BIOLOGY VOL. 56
FIGURE 3. Comparison of relative node depths across different data types, determined using Bayesian MCMC trees made ultrametric usingPLRS. Branch lengths for amino acids and each of the three codon positions are plotted against branch lengths for linked nucleotides.
caecilians and batrachians) is still quite deep, as dis-cussed in the next section.
Within mammals, monotremes are sister to therians(a marsupial-placental clade), as almost universally rec-ognized in recent times. The previous mtDNA andDNA hybridization studies that favored a heterodoxmonotreme-marsupial clade might have suffered frombase composition bias (Phillips and Penny, 2003). Therehave been few extensive molecular studies aimed at ad-dressing this question; though these have reaffirmed thetraditional hypothesis (e.g., Killian et al., 2001; Bakeret al., 2004), alternatives are still being entertained (e.g.,Musser, 2003). Only very recently has a study of mul-tiple nuclear genes (van Rheede et al., 2006) retrievedTheria. That study used numerous loci but consequentlywas restricted to sparser taxon sampling of nonmam-malian taxa. Our study therefore complements it withmore extensive taxon sampling across nonmammalianoutgroups. These recent nuclear analyses, together withmorphology, and documented biases in the conflictingmtDNA analyses are enough to strongly reaffirm mono-phyly of therians. A notable feature of this RAG-1 resultis the considerable branch length (= time) encompassed
by the stem lineages leading to monotremes, to marsu-pials, and to placentals (see molecular dating analysisbelow).
The grouping of turtles as a sister clade to archosaurshas very little morphological support (Rieppel, 2000) butis in line with many mitochondrial studies (Zardoya andMeyer, 1998; Janke et al., 2001; Rest et al., 2003). Somenuclear studies (based on protein sequences and sparsertaxon sampling) have also found this grouping (e.g.,Iwabe et al., 2005). Other nuclear studies, while sug-gesting archosaur affinities of turtles, have embeddedturtles within archosaurs as sister-group to crocodylians(e.g., Hedges and Poling, 1999; Cao et al., 2000). Thecurrent study appears to be the first well-sampled nu-clear study to retrieve turtles as sister to a monophyleticArchosauria. Turtle-archosaur affinities, as noted by oth-ers (e.g., Rieppel, 2000), means that diapsid reptiles (ar-chosaurs and lepidosaurs) are not monophyletic—eithertemporal fenestration (the diapsid skull) evolved con-vergently, or turtles have secondarily lost their temporalfenestrae. Considering only extant taxa, both possibili-ties are equally parsimonious; addition of fossil taxa tothis tree are required to investigate this issue. Similarly,

2007 HUGALL ET AL.—RAG-1 TETRAPOD PHYLOGENY 551
the status of proposed fossil ancestors of turtles (e.g., pro-colophonids, pareiasaurs, sauropterygians) again cannotbe resolved without morphological analyses, perhapsin the combined analysis or using the molecular treeas a backbone constraint (see Lee, 2005, and referencestherein). Finally, however, we add the caveat that thismolecular turtle-archosaur clade still needs to be furtherevaluated for two reasons. First, morphological supportfor this arrangement continues to be elusive (Rieppel,2000). Second, there are rate differences between tur-tles and diapsid reptiles, due to a severe slow down inturtles (see below). This raises the following possibility:even if the true reptile tree contains a basal dichotomybetween turtles and other reptiles (diapsids) as tradi-tionally inferred based on morphology, the slow molec-ular evolutionary rates in turtles might predispose thereptile RAG-1 tree to be rooted within diapsids. How-ever, turtles do not have such comparatively slow ratesin mitogenome studies (Rest et al., 2003; Janke et al.,2001), yet those studies also place them with archosaurs.Hence, in the following discussion, a turtle-archosaurclade will be provisionally accepted. Within archosaurs,relationships are consistent with other nuclear stud-ies (e.g., Gatesy et al., 2003; Groth and Barrowclough,1999); notably, the nuclear data support the traditionalview that paleognaths are the basal bird lineage, andthe conflicting signal previously found in mtDNA datahas been shown to be ambiguous (Braun and Kimball,2002).
A surprising result is the relatively great distance be-tween Sphenodon and squamates, and the resultant shortlength and low support for the branch leading to Lepi-dosauria. Lepidosaurs are almost universally acceptedas strongly corroborated, yet the results here suggestthat Sphenodon diverged from squamates only relativelyshortly after archosaurs did; i.e., squamates, Sphenodon,and archosaurs almost form a trichotomy. This patterncould explain why an earlier study (Hedges and Poling,1999) that used sparser taxon sampling (but numer-ous loci) failed to corroborate Lepidosauria and inferredsquamates as the most basal reptiles. However, better-sampled analyses of mtDNA (Rest et al., 2003) corrob-orate a monophyletic Lepidosauria. The RAG-1 studyof Townsend et al. (2004) assumed a monophyletic Lepi-dosauria and rooted them with taxa belonging to a singleputative outgroup clade (archosaurs plus turtles). Thepresent study is thus the first nuclear study based on suf-ficient taxon sampling across tetrapods to demonstratelepidosaurian monophyly. The short branch leading toLepidosauria is also consistent with the scarcity of stemlepidosaurs in the fossil record; the most recent reviewonly recognizes kuehneosaurs and Marmoretta (Evans,2003); this contrasts, for instance, with the long branchesand consequent wealth of stem fossil taxa leading to ar-chosaurs and to mammals.
Relationships within turtles, crocodylians, birds, andsquamates are largely congruent with previous analysesmentioned above and will not be discussed in detail here.However, the dating of divergences within those cladesis discussed below.
MOLECULAR DIVERGENCE DATING: METHODSAND RESULTS
The dense taxon sampling and long nuclear sequencesin this analysis allow, for the first time, nuclear estimatesof divergences in many amniote clades simultaneously,using multiple calibration points dispersed across thetree. Previous studies across amniotes employed mtDNA(e.g., Janke et al., 2001; Rest et al., 2003; Pereira and Baker,2006), which may well suffer saturation at the timescalesof interest (see below). Nuclear studies have focusedon individual clades (e.g., mammals: Springer et al.,2003; turtles: Near et al., 2004; birds: Ericson et al., 2006;squamates: Vidal and Hedges, 2005) using only internalcalibrations—other amniote groups were not surveyedsufficiently to enable retrieved dates to be compared withthose obtained using external calibrations. Such compar-isons would be worthwhile as the poor fossil record inmany groups (e.g., birds and squamates) renders manyinternal calibrations contentious (e.g., van Tuinen andDyke, 2004), and there remain large discrepancies in es-timated dates across different studies.
Molecular clock dating is more reliable when there islittle rate heterogeneity across lineages (e.g., Sanderson,2002; Ho et al., 2005). However, molecular phylogeniestypically exhibit uneven root-to-tip path lengths, imply-ing significant apparent rate variation. As can be seenin Figures 2 and 3, the Bayesian trees show consider-able variation in path length. Each data partition (1st,2nd, 3rd, combined, and amino acid) showed signifi-cant apparent rate variation (P < 0.01) across lineagesaccording to the likelihood ratio test (Felsenstein, 1981).For both nucleotides and amino acids (Figs. 2 and 3),turtle and crocodile paths are relatively short and squa-mates long. For nucleotides, mammals and batrachiansare also relatively long, but this is less apparent for aminoacids. This heterogeneity must be adequately accommo-dated to reconstruct the underlying ultrametric chrono-gram. We therefore employed penalized likelihood ratesmoothing (PLRS), as implemented in r8s (versions 1.6and 1.7; Sanderson, 2002), with the TN algorithm and op-timal smoothing factors determined by cross-validation.Smoothing used the additive function but the log func-tion produced similar results (not shown). Trees fromboth nucleotide and amino acid MCMC analyses wereused along with a range of potential fossil-based cali-bration points spread across the major amniote lineages(see next section). In estimating divergence times, majorsources of uncertainty are (1) sampling and stochasticerror in estimation of branch lengths, (2) saturation, (3)calibration error, and (4) variation across lineages in ratesof molecular evolution. We discuss each in turn, focus-ing especially on issues with recent methods aimed ataddressing 3 and 4.
Confidence Intervals
MCMC variance in branch lengths for each data par-tition is minor, indicating that variation due to samplingand model parameterization is minor for the long se-quences employed here. A measure of this was obtained
552 SYSTEMATIC BIOLOGY VOL. 56
from variation in estimated ages across 200 sampled trees(drawn one every 20,000 steps) from the post-burn-inMCMC analyses, and results are included in Table 3.These analyses employed PLRS and only a single (am-niote = 315 Mya) calibration; variation with additionalcalibrations enforced (constraining more nodes) is neces-sarily lower. For nucleotides, the 95% confidence interval(CI) of age was on average 13% of the mean divergenceage estimate; for all divergences it was <20%, except forcaiman-alligator (31%). As there are fewer variable sites,variation in the amino acid MCMC analysis is a littlehigher, with the 95% confidence interval (CI) of averageage 21% of the mean.
Sampling across MCMC trees includes variation due touncertainties in model parameter values, topology, andbranch lengths but does not incorporate uncertainty dueto the smoothing function process itself: even if we knowwithout error the true tree and number of substitutionson each branch, there would be uncertainties in how tostretch the branches to make it ultrametric. Sensitivity tosmoothing factor was assessed by measuring the range ofages seen across the 95% CI of smoothing factors, whichwas based on the r8s cross-validation chi-squared errorwith d.f. = (number of taxa − 2). For both amino acidand nucleotides, the range of ages obtained across allplausible smoothing factors is <10% of the mean exceptwithin crocodylians (15%). Ideally, it would be desirableto incorporate uncertainty in just how to model rate vari-ation into final estimates of error bars. Data sets that arehighly rate-variable generally would be more sensitive tothe rate smoothing method adopted, resulting in greateruncertainty in dating. However, because variation heredue to smoothing factor is much lower than the acrossMCMC sample variation, and the two sources of errorsare not simply multiplicative, we use the latter as it iscommon practice (Sanderson, 2002).
Saturation
To explore effects due to saturation across codon posi-tions and amino acids, we compared the divergence ageestimates from MCMC analyses of amino acids, linkednucleotide codon positions, and each codon position.Figure 3 plots PLRS divergence ages for all compati-ble nodes against estimates from the linked nucleotideanalysis. This used the single and most basal availablecalibration (amniote = 315 Mya) thus showing the re-sult of the RAG-1 with rate smoothing, unconfoundedby imposing age constraints on multiple nodes. The lin-ear relationship of node age across data types suggestssaturation in 3rd positions (and amino acids) is not com-pressing the deeper divergences relative to shallowerones (Fig. 3). For this reason, all codon positions linkedwere used to estimate branch lengths from the nucleotidedata. In contrast, mtDNA divergences typically saturateat these timescales (e.g., Gatesy et al., 2003; Penny andPhillips, 2003). This (and the topology results below) in-dicates that for these divergence times, nuclear gene se-quences are more appropriate than mtDNA sequencesbecause of fewer multiple hits.
Rate Variation
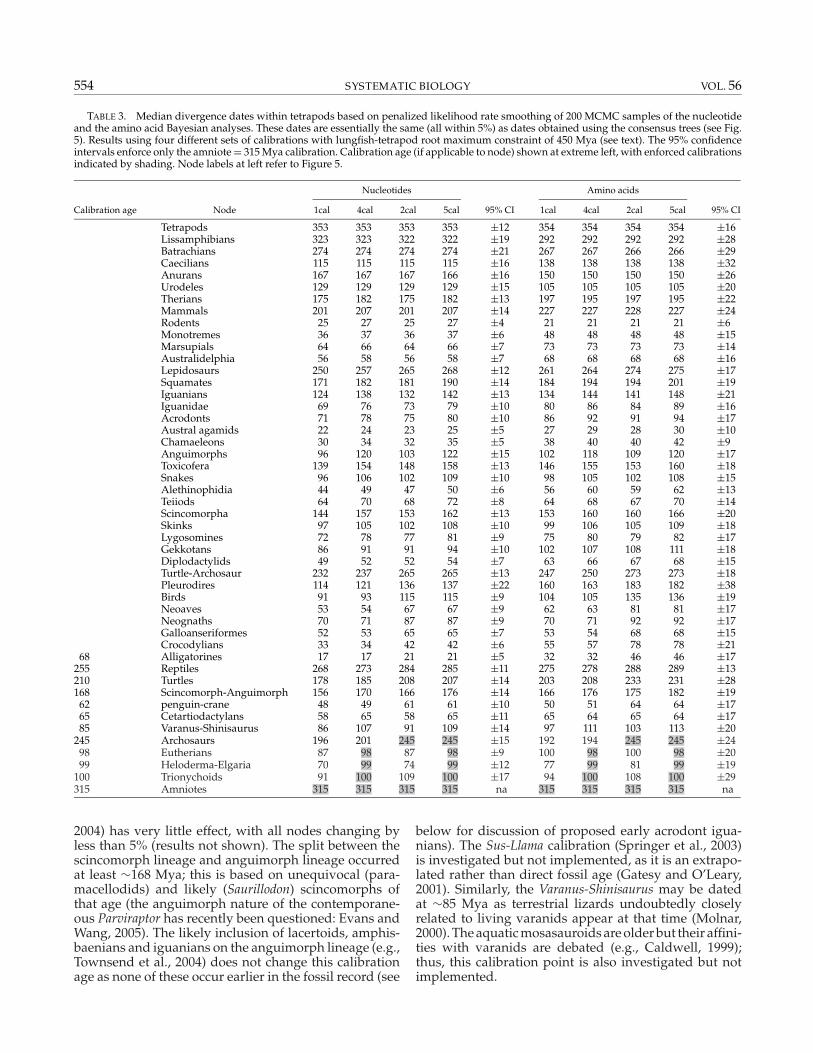
Apparent substitution rates across various brancheswere first calculated applying the basal amniote = 315Mya calibration. Then, these rates were reestimated withthe addition of archosaur and caiman calibrations, whichare the calibrations having the highest effect in changingtree proportions and, thus, inferred rates (see next sec-tion). We assessed how inferred rates changed for dif-ferent data partitions: 1st, 2nd, and 3rd positions, linked1st plus 2nd positions, all positions linked (Fig. 2a) andamino acids (Fig. 2b). Estimated rate varies among thesegroups by about a factor of 2.5 for 1st positions, 3.2 for2nd, 3.5 for 3rd, 3.2 for all nucleotides combined (linked),and 2.9 for the amino acids. Plotting amino acid versusnucleotide evolutionary rates (Fig. 4) reveals that turtlesand crocodiles appear slow, and by comparison, snakesfast. However, it also indicates two trends, with mam-mals and batrachians (urodeles and anurans) having aslower amino acid rate relative to nucleotide rate, com-pared to all other taxa. Base composition analysis indi-cates considerable heterogeneity at 3rd positions. Acrossall terminal taxa, the chi-squared test (in PAUP) is in-significant (>0.05) for 1st and 2nd codons but highlysignificant (�0.01) for 3rd positions. Across the majorclades plotted (Fig. 4), there is 5 to 15 times more basecomposition variation in 3rd positions than in 1st or 2ndpositions, most notably due to mammals and batrachiansbeing less AT rich (40% versus >50%). Therefore, someof the apparent rate variation might be due to base com-position nonstationarity causing model fit error, ratherthan actual substitution rate differences. For example,root-to-tip path lengths for mammals and batrachiansare relatively long for nucleotides (especially 3rd posi-tions), but not so for amino acids; this higher apparentnucleotide rate might in part be driven by asymmetrical(rather than increased) substitution rates. By compari-son, short paths within turtles for both amino acids andnucleotides suggests genuinely slow substitution rates.
Calibration Consistency versus Rate Smoothing Error
Calibration choice is one of the most important factorsinfluencing divergence date estimates but is often barelydiscussed in molecular clock studies. The following 12proposed calibration points were considered (describedas a split between taxa; also labeled in Tables 2 and 3,and Figure 5): (1) bird-mammal = 315 Mya (Amniote;see Reisz and Muller, 2004); (2) elephant-pig (extant eu-therians) = 98 Mya (see Benton and Donoghue, 2007);(3) Lissemys-Apalone=100 Mya (trionychoid turtles: Nearet al., 2005); (4) scincomorphs-anguimorphs = 168 Mya(Evans, 2004; see below); (5) Heloderma-Elgaria = 99 Mya(Wiens et al., 2006); (6) pleurodire-cryptodire turtles =210 Mya (turtles: Near et al., 2005): (7) penguin-crane =62 Mya (Slack et al., 2006); (8) Lepidosaur-Archosaur =255 Mya (reptile: Reisz and Muller, 2004); (9) bird-crocodile 245 Mya (archosaur: Muller and Reisz; 2005);(10) alligator-caiman = 68 Mya (Alligatorines: Mullerand Reisz, 2005); (11) Sus-Llama = 65 Mya (Cetartiodacty-lans: Springer et al., 2003); and (12) Varanus-Shinisaurus

2007 HUGALL ET AL.—RAG-1 TETRAPOD PHYLOGENY 553
FIGURE 4. Comparison of nucleotide and amino acid substitution rates across selected phylogenetic groups, as estimated by PLRS. Diamondsare from using the single amniote = 315 Mya calibration. Effect of additional calibrations on inferred substitution rates: squares indicate effectsof adding bird-croc = 245 Mya; triangles of further adding caiman-alligator = 68 Mya. The last additional calibration has little effect on rateestimates for birds or turtles.
∼ 85 mya. Most of these calibrations have been widelyused before. The amniote calibration is perhaps the sin-gle most commonly used calibration point for tetrapods(Graur and Martin, 2004), allowing direct comparison
with those previous studies, and the best positioned inour tree for methodological reasons, as it is closest tothe root (Sanderson, 2002). Increasing the age of this cal-ibration point from 315 to 330 Mya (Reisz and Muller,
TABLE 2. Cross-validation deviance of candidate calibrations, based on an ultrametric tree derived by PLRS using the amniote = 315 Myacalibration. This tree was rescaled to each candidate calibration in turn.
∑deviance is sum of absolute value of differences between estimated
and proposed fossil (left) dates for the other candidate calibrations.∑
%dev is from deviance expressed as a proportion of proposed date. Nodelabels refer to Figure 5 and Table 3.
Nucleotides Amino acids
Age∑
deviance∑
%dev∑
deviance∑
%dev
168 Scincomorph-Anguimorph 218 1.3 202 1.265 Cetartiodactylans 218 3.4 198 3.198 Eutherians 222 2.3 196 2.085 Varanus-Shinisaurus 230 2.7 257 3.0
100 Trionychoids 242 2.4 269 2.7315 Amniotes 243 0.8 197 0.6210 Turtles 264 1.3 199 0.9255 Reptiles 291 1.1 253 1.0245 Archosaurs 316 1.3 432 1.8
62 Penguin-Crane 419 6.8 463 7.599 Heloderma-Elgaria 630 6.4 556 5.668 Alligatorines 4642 68.3 2023 29.8
554 SYSTEMATIC BIOLOGY VOL. 56
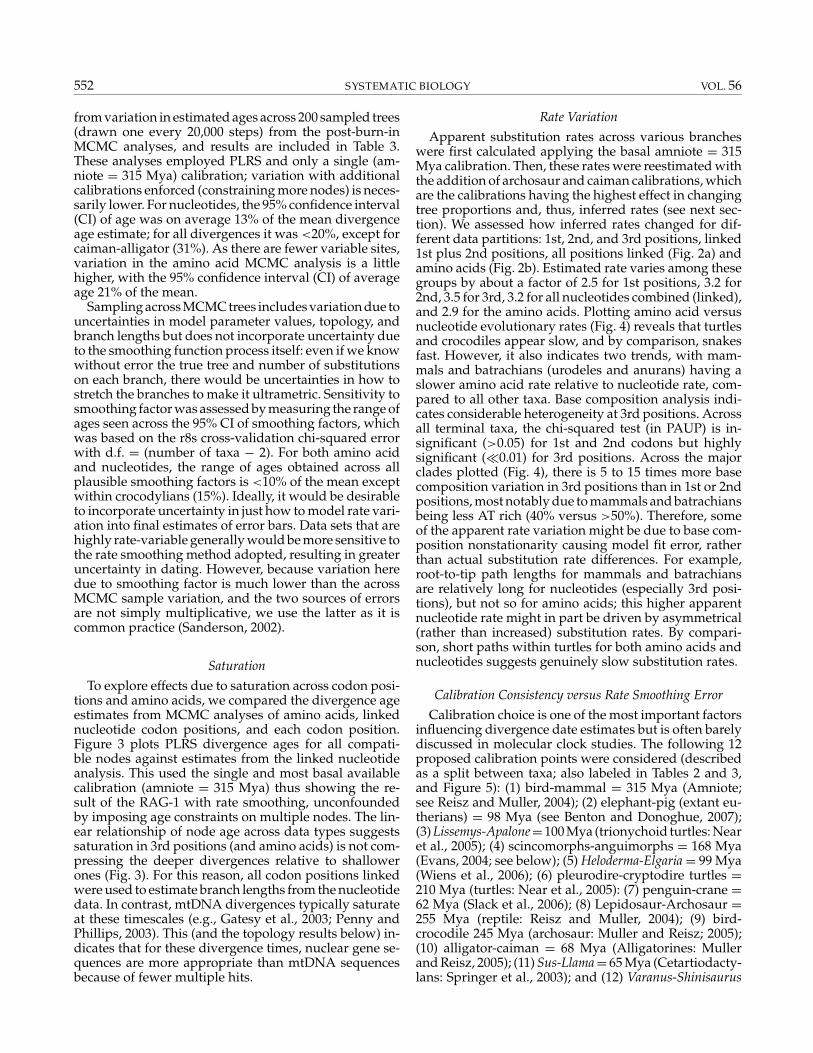
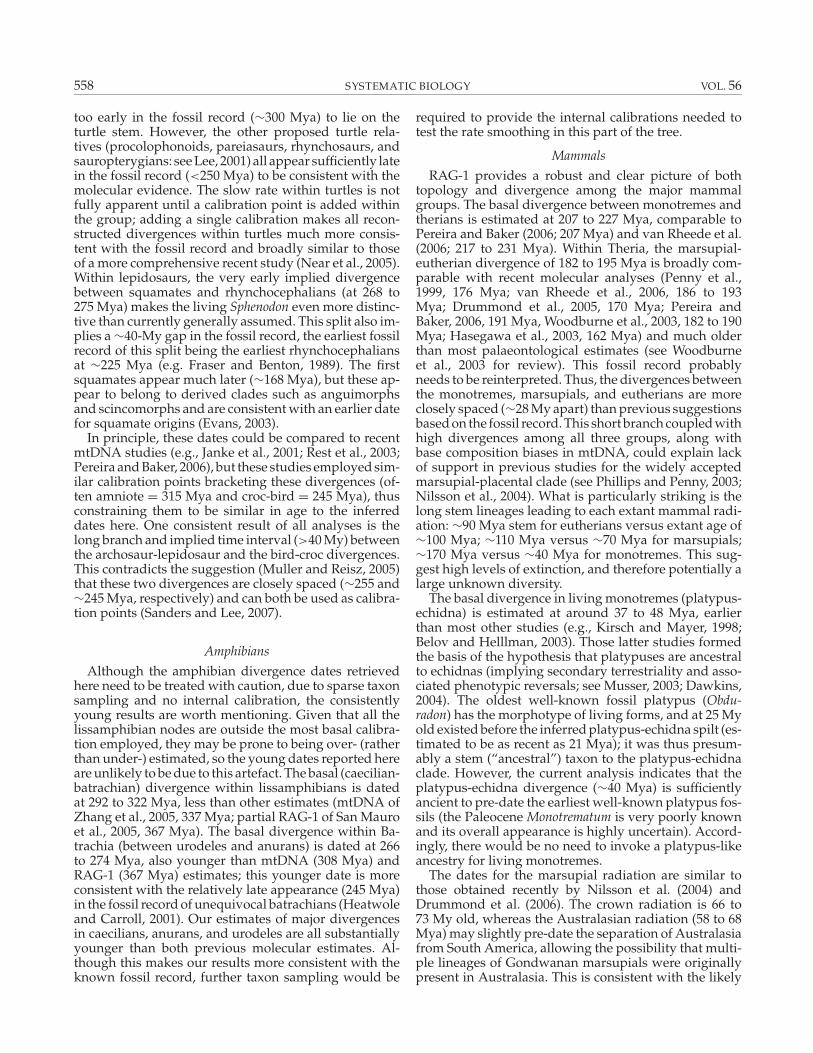
TABLE 3. Median divergence dates within tetrapods based on penalized likelihood rate smoothing of 200 MCMC samples of the nucleotideand the amino acid Bayesian analyses. These dates are essentially the same (all within 5%) as dates obtained using the consensus trees (see Fig.5). Results using four different sets of calibrations with lungfish-tetrapod root maximum constraint of 450 Mya (see text). The 95% confidenceintervals enforce only the amniote = 315 Mya calibration. Calibration age (if applicable to node) shown at extreme left, with enforced calibrationsindicated by shading. Node labels at left refer to Figure 5.
Nucleotides Amino acids
Calibration age Node 1cal 4cal 2cal 5cal 95% CI 1cal 4cal 2cal 5cal 95% CI
Tetrapods 353 353 353 353 ±12 354 354 354 354 ±16Lissamphibians 323 323 322 322 ±19 292 292 292 292 ±28Batrachians 274 274 274 274 ±21 267 267 266 266 ±29Caecilians 115 115 115 115 ±16 138 138 138 138 ±32Anurans 167 167 167 166 ±16 150 150 150 150 ±26Urodeles 129 129 129 129 ±15 105 105 105 105 ±20Therians 175 182 175 182 ±13 197 195 197 195 ±22Mammals 201 207 201 207 ±14 227 227 228 227 ±24Rodents 25 27 25 27 ±4 21 21 21 21 ±6Monotremes 36 37 36 37 ±6 48 48 48 48 ±15Marsupials 64 66 64 66 ±7 73 73 73 73 ±14Australidelphia 56 58 56 58 ±7 68 68 68 68 ±16Lepidosaurs 250 257 265 268 ±12 261 264 274 275 ±17Squamates 171 182 181 190 ±14 184 194 194 201 ±19Iguanians 124 138 132 142 ±13 134 144 141 148 ±21Iguanidae 69 76 73 79 ±10 80 86 84 89 ±16Acrodonts 71 78 75 80 ±10 86 92 91 94 ±17Austral agamids 22 24 23 25 ±5 27 29 28 30 ±10Chamaeleons 30 34 32 35 ±5 38 40 40 42 ±9Anguimorphs 96 120 103 122 ±15 102 118 109 120 ±17Toxicofera 139 154 148 158 ±13 146 155 153 160 ±18Snakes 96 106 102 109 ±10 98 105 102 108 ±15Alethinophidia 44 49 47 50 ±6 56 60 59 62 ±13Teiiods 64 70 68 72 ±8 64 68 67 70 ±14Scincomorpha 144 157 153 162 ±13 153 160 160 166 ±20Skinks 97 105 102 108 ±10 99 106 105 109 ±18Lygosomines 72 78 77 81 ±9 75 80 79 82 ±17Gekkotans 86 91 91 94 ±10 102 107 108 111 ±18Diplodactylids 49 52 52 54 ±7 63 66 67 68 ±15Turtle-Archosaur 232 237 265 265 ±13 247 250 273 273 ±18Pleurodires 114 121 136 137 ±22 160 163 183 182 ±38Birds 91 93 115 115 ±9 104 105 135 136 ±19Neoaves 53 54 67 67 ±9 62 63 81 81 ±17Neognaths 70 71 87 87 ±9 70 71 92 92 ±17Galloanseriformes 52 53 65 65 ±7 53 54 68 68 ±15Crocodylians 33 34 42 42 ±6 55 57 78 78 ±21
68 Alligatorines 17 17 21 21 ±5 32 32 46 46 ±17255 Reptiles 268 273 284 285 ±11 275 278 288 289 ±13210 Turtles 178 185 208 207 ±14 203 208 233 231 ±28168 Scincomorph-Anguimorph 156 170 166 176 ±14 166 176 175 182 ±19
62 penguin-crane 48 49 61 61 ±10 50 51 64 64 ±1765 Cetartiodactylans 58 65 58 65 ±11 65 64 65 64 ±1785 Varanus-Shinisaurus 86 107 91 109 ±14 97 111 103 113 ±20
245 Archosaurs 196 201 245 245 ±15 192 194 245 245 ±2498 Eutherians 87 98 87 98 ±9 100 98 100 98 ±2099 Heloderma-Elgaria 70 99 74 99 ±12 77 99 81 99 ±19
100 Trionychoids 91 100 109 100 ±17 94 100 108 100 ±29315 Amniotes 315 315 315 315 na 315 315 315 315 na
2004) has very little effect, with all nodes changing byless than 5% (results not shown). The split between thescincomorph lineage and anguimorph lineage occurredat least ∼168 Mya; this is based on unequivocal (para-macellodids) and likely (Saurillodon) scincomorphs ofthat age (the anguimorph nature of the contemporane-ous Parviraptor has recently been questioned: Evans andWang, 2005). The likely inclusion of lacertoids, amphis-baenians and iguanians on the anguimorph lineage (e.g.,Townsend et al., 2004) does not change this calibrationage as none of these occur earlier in the fossil record (see
below for discussion of proposed early acrodont igua-nians). The Sus-Llama calibration (Springer et al., 2003)is investigated but not implemented, as it is an extrapo-lated rather than direct fossil age (Gatesy and O’Leary,2001). Similarly, the Varanus-Shinisaurus may be datedat ∼85 Mya as terrestrial lizards undoubtedly closelyrelated to living varanids appear at that time (Molnar,2000). The aquatic mosasauroids are older but their affini-ties with varanids are debated (e.g., Caldwell, 1999);thus, this calibration point is also investigated but notimplemented.

2007 HUGALL ET AL.—RAG-1 TETRAPOD PHYLOGENY 555
FIGURE 5. Chronogram for tetrapods based on nucleotide data. This tree was based on the consensus tree in Figure 2a, rate-smoothed usingPLRS with five calibrations (indicated by circled ages on nodes). Node labels refer to splits in Table 3. Time scale below is in millions of yearsbefore present, above in geological eras. Confidence intervals are indicated in Table 3 to simplify the figure.

556 SYSTEMATIC BIOLOGY VOL. 56
All candidate calibrations, when employed, were usedas absolute constraints for two reasons. In principle, if allcalibrations are treated as minimum ages, the analysistends to stretch all branches to be consistent with the cal-ibration that implies greatest tree depth, pushing all theother calibrations earlier as a result. In effect, the analysiscan become driven by a single, erroneously early calibra-tion, causing a systematic overestimation of ages (see dis-cussion). Further, even if all calibrations are reasonablyaccurate, a methodological artefact (“model overfitting”)of PLRS means shallow calibrations often overestimateages of deep nodes: constraining deeper nodes to be onlyminimum ages allows this error, whereas fixing deepernodes would prevent it (Sanderson, 2002; Welch andBromham, 2005; Welch et al., 2005; Ho et al., 2005; Porteret al., 2005; Yang and Rannala, 2006).
Near and Sanderson (2004) proposed a rational ap-proach to choosing reliable calibrations. Each calibrationpoint is employed in turn and the tree rate-smoothed; theages of other putative calibration nodes are estimated us-ing the resultant ultrametric tree and then compared withthe actual dates. The calibration points that best recon-struct all others are retained, resulting in an internallyconsistent set. Using this approach with typical (rate-variable) data assumes that the rate-smoothing meth-ods adequately reconstruct the underlying ultrametrictree. Because both rate smoothing and calibration con-tain errors, where a calibration point fails to reconstruct(is inconsistent with) all others, this could either reflecta genuine problem with that calibration point or a prob-lem with the data and/or rate smoothing method. Theseissues are exemplified in the current data set.
One problem with the cross-validation approach is the“model overfitting” bias in PLRS, which tends to artifi-cially inflate ages for nodes below the deepest calibrationpoint employed. Therefore, although using only deepcalibrations may accurately reconstruct shallower can-didate calibrations, using only shallower calibrations of-ten greatly overestimate the dates of deeper candidatecalibrations. This artefact will artificially increase the de-viance (defined below) of shallow calibrations. This wasthe case here, under both available rate-smoothing al-gorithms in r8s (the default additive function, and thealternative log rate function intended to ameliorate thisartefact). The deepest (amniote = 315 Mya) calibrationprovided a stable solution and plausible ages for shal-lower candidate calibrations, but the shallower calibra-tions gave unstable solutions and implausible ages forthe deeper calibrations. This problem can be partly rec-tified by using the same ultrametric tree (generated bysmoothing from a basal node) when evaluating each cal-ibration point. Although this approach removes the con-sistent bias inflating the deviance of shallow calibrations,the adopted ultrametric tree could still contain erroneousbranch lengths in regions where rate-smoothing has per-formed poorly, artificially inflating the deviance of accu-rate calibrations in those regions (as discussed below).
We evaluated the deviance of each candidate calibra-tion using a common ultrametric tree, created by smooth-ing across the amniote node (the most basal candidate
calibration). This tree was rescaled to each candidate cal-ibration and used to estimate the ages of the other can-didate calibration nodes. Deviance was measured as theabsolute value of the difference between the estimatedand actual dates. For any one calibration, the sum of thedeviances across all the other calibration nodes indicateshow consistent that calibration is with the remainder:the smaller the value the more consistent (see Table 2;deviance was also calculated as a proportion of the pro-posed date; c.f. cross-validation procedure of Near andSanderson, 2004). These analyses were conducted onall three codon positions (linked and unlinked), 1st +2nd positions only (linked), and amino acids. Results forthe linked nucleotides, and for amino acids, are shown;other nucleotide analyses gave similar results to theformer.
Of the 12 candidate calibrations (see Tables 2 and 3) themost consistent (for nucleotide data) are scincomorph-anguimorph, eutherians, trionychoids, and amniotes(Table 2). The cetartiodactylan and Varanus-Shinisauruscalibrations also performed well, suggesting they shouldbe investigated further. However, for amino acid data,the trionychoid and Varanus-Shinisaurus calibrationswere less consistent. All three archosaur calibrations(penguin-crane, bird-crocodile, and alligator-caiman)are aberrant, especially the last. The conflict betweenthe molecular and the fossil dates for these calibrationpoints suggests that at least one line of evidence is mis-leading. Importantly, the three “inconsistent” archosaurcalibrations are not readily dismissed. All three are inagreement with each other in suggesting deeper diver-gences within archosaurs than predicted by the “consis-tent” calibrations (see Table 3), and are based on strongfossil evidence. The bird-croc divergence is documentedby numerous well-preserved stem-crocodylians (phy-tosaurs, rauisuchians, sphenosuchians, aetosaurs) andstem-birds (ornithischian and saurischian dinosaurs)around 230 to 225 Mya (e.g., Brochu, 2001). However,earlier examples are scarce, consisting of only the stem-bird Marasuchus (= Lagosuchus; Ladinian 230–235; Serenoand Arcucci, 1994). Other earlier crown archosaurs(Lewisuchus, Turfanosaurus, Arizonasaurus: 241–235 Mya)have been questioned (Wu and Russell, 2001; Gower andNesbitt, 2006). A reasonable interpretation of the strati-graphic record would be that the bird-crocodile diver-gence occurred around 245 to 240 Mya, with an increasein diversity in both subclades occurring around 230 Mya.The split is unlikely to be much older than 245 millionyears given that the fossil record of archosaurs is goodbefore this time, but all known examples lie outside thecrocodile-bird clade. Given the wealth of well-supportedcrown archosaurs around 230 Mya, it is almost impossi-ble that the bird-crocodile split could have occurred anylater than this. Similarly, crocodylians have been the fo-cus of extensive phylogenetic studies, which have iden-tified well-preserved stem-alligatorines that are 68 Myold (Reisz and Muller, 2004). The recent molecular ev-idence that gavials are nested deeply within crocody-lines does not challenge the identity of these early fossilsas stem-alligatorines (see Gatesy et al., 2003: fig. 3).

2007 HUGALL ET AL.—RAG-1 TETRAPOD PHYLOGENY 557
Similarly, the minimum age of the penguin-crane diver-gence is well corroborated by complete fossil penguinswith a suite of synapomorphies indicating relationshipto that morphologically distinctive clade (Slack et al.,2006).
Three fossil calibrations suggesting anomalously earlydivergences involving archosaurs therefore are both ro-bust and concordant, suggesting that molecular diver-gence dates for the group are in error. Given the longsequences and robust tree and branch length estimates,the most likely cause for such an anomaly might be thePLRS transformation that generates the ultrametric, rate-smoothed tree. It might fail to recognize the full extent ofthe rate slowdown in the archosaur lineage, because (1)the methodology will intrinsically have difficulty withslow lineages as they yield fewer changes (in absoluteterms) on which to evaluate rate smoothing models, and(2) there are long unbroken branches and therefore fewnodes to help reveal where to distribute the rate changealong different portions of these branches (see Welch andBromham, 2005; Welch et al., 2005; Drummond et al.,2006, for discussion of effects of assuming autocorrelatedrates).
If we provisionally assume that the fossil dates for ar-chosaurs are correct and that the molecular dates areoverly recent, it follows that at least some (”inconsis-tent”) fossil calibrations within archosaurs need to beemployed. If we add the bird-croc = 245 Mya calibra-tion to the amniote = 315 Mya calibration, this length-ens the branches around the archosaur region of thetree. This in turn drives down the inferred molecularrates for crocodiles and birds (considerably) and tur-tles (slightly), both for nucleotides and amino acids (seeFig. 4). Adding the alligator-caiman = 68 Mya calibra-tion drives crocodile rates even lower, to be the slowestof all groups (Fig. 4). If we commence with the amniote =315 Mya calibration alone and successively add nonar-chosaur calibrations, the dates for all archosaur diver-gences are pushed deeper (though not as far as the fossildates). However, divergences across the rest of the tree donot increase as much (Table 3). This pattern suggests thatthere is some systematic bias (e.g., a major slow down)in archosaurs that is being increasingly retrieved as morebranch lengths outside archosaurs are correctly specified(by adding calibrations), though it takes calibrations ac-tually within archosaurs to fully correct for this. Finally,it is notable that adding the archosaur = 245 Mya cali-bration alone to the initial amniote = 315 Mya calibrationsubstantially improves the fit across all the other candi-date calibration nodes (especially those outside the coreset of consistent nodes); indeed, this is the single best ad-dition. Adding only already consistent calibrations (bydefinition) cannot substantially alter branch length pro-portions and thus cannot correct for errors in PLRS, andalso cannot greatly improve fit across other candidate cal-ibrations. Finally, although adding more calibrations canpotentially improve accuracy, it also increasingly con-strains more regions in the tree to closely mirror fossildates. There is a trade-off between multiple calibrationsand letting the molecular data speak for itself.
The Heloderma-Elgaria calibration is older than datesimplied by most other calibrations, but without nu-merous adjacent calibrations it cannot be ascertainedwhether the calibration is an overestimate, or the recon-structed ages underestimates. We retain it here for tworeasons: (1) it is commonly used, and (2) it makes thepresent results (young squamate divergences) conser-vative as excluding this calibration would reduce dateseven further.
For these reasons, we focus on analyses using fivecalibrations spread across the major amniote lineages:bird-mammal (amniote) = 315 Mya; extant eutherians(elephant-pig) = 98 Mya; Heloderma-Elgaria = 99 Mya;bird-croc (archosaur) = 245 Mya; Apalone-Lissemys (tri-onychoid) = 100 Mya. All calibrations were treated asfixed rather than minima for reasons discussed above.We also enforce a maximum age constraint of 450 Myafor the root (lungfish-tetrapod divergence), to amelio-rate the “model overfitting” artefact discussed above.The chronogram discussed here (Figure 5) is based onthe nucleotide rate-smoothed tree. For major nodes, themedian and 95% confidence intervals are provided inTable 3, including several sets of calibrations for boththe nucleotide and amino acid data. For the basis of dis-cussion we present ages as bracketed by nucleotide andamino acid estimates. It also gives reasonable estimatesfor the rest of the tree, including most of the other can-didate calibration nodes (compare calibration date withsingle amniote calibration columns in Table 3).
GENERAL DISCUSSION
The above analyses provide the first robust nuclearmolecular clock divergence date estimates for all ma-jor tetrapod groups simultaneously. It thus complementsprevious studies of particular amniote clades, which of-ten only included calibration points within those clades.In general, where this study disagrees with previousmolecular work, the current dates are more consistentwith the stratigraphic evidence.
Major Amniote Divergences
Although five calibrations were enforced, all other di-vergences within tetrapods were estimated. The splitbetween amphibians and amniotes is estimated at ca.354 Mya matching the fossil record (transitional tetra-pod fossils 365 to 355 Mya: Daeschler et al., 2006), butwe do not place much weight on this result as thisnode is below our most basal calibration. The diver-gence between archosaurs (plus turtles) and lepidosaurswas estimated at 285 to 289 Mya and indicates substan-tial fossil gaps: the first stem archosaurs appear ∼255Mya (e.g., Brochu, 2001) and the first stem lepidosaursoccur ∼240 Mya (Evans, 2003). If the turtle-archosaurclade is accepted, the inferred divergence date betweenturtles and their nearest living relatives is 265 to 273Mya. This relatively late date refutes the suggestion thatcaptorhinids (Gaffney and Meylan, 1988) could be thenearest relatives of turtles, because captorhinids appear
558 SYSTEMATIC BIOLOGY VOL. 56
too early in the fossil record (∼300 Mya) to lie on theturtle stem. However, the other proposed turtle rela-tives (procolophonoids, pareiasaurs, rhynchosaurs, andsauropterygians: see Lee, 2001) all appear sufficiently latein the fossil record (<250 Mya) to be consistent with themolecular evidence. The slow rate within turtles is notfully apparent until a calibration point is added withinthe group; adding a single calibration makes all recon-structed divergences within turtles much more consis-tent with the fossil record and broadly similar to thoseof a more comprehensive recent study (Near et al., 2005).Within lepidosaurs, the very early implied divergencebetween squamates and rhynchocephalians (at 268 to275 Mya) makes the living Sphenodon even more distinc-tive than currently generally assumed. This split also im-plies a ∼40-My gap in the fossil record, the earliest fossilrecord of this split being the earliest rhynchocephaliansat ∼225 Mya (e.g. Fraser and Benton, 1989). The firstsquamates appear much later (∼168 Mya), but these ap-pear to belong to derived clades such as anguimorphsand scincomorphs and are consistent with an earlier datefor squamate origins (Evans, 2003).
In principle, these dates could be compared to recentmtDNA studies (e.g., Janke et al., 2001; Rest et al., 2003;Pereira and Baker, 2006), but these studies employed sim-ilar calibration points bracketing these divergences (of-ten amniote = 315 Mya and croc-bird = 245 Mya), thusconstraining them to be similar in age to the inferreddates here. One consistent result of all analyses is thelong branch and implied time interval (>40 My) betweenthe archosaur-lepidosaur and the bird-croc divergences.This contradicts the suggestion (Muller and Reisz, 2005)that these two divergences are closely spaced (∼255 and∼245 Mya, respectively) and can both be used as calibra-tion points (Sanders and Lee, 2007).
Amphibians
Although the amphibian divergence dates retrievedhere need to be treated with caution, due to sparse taxonsampling and no internal calibration, the consistentlyyoung results are worth mentioning. Given that all thelissamphibian nodes are outside the most basal calibra-tion employed, they may be prone to being over- (ratherthan under-) estimated, so the young dates reported hereare unlikely to be due to this artefact. The basal (caecilian-batrachian) divergence within lissamphibians is datedat 292 to 322 Mya, less than other estimates (mtDNA ofZhang et al., 2005, 337 Mya; partial RAG-1 of San Mauroet al., 2005, 367 Mya). The basal divergence within Ba-trachia (between urodeles and anurans) is dated at 266to 274 Mya, also younger than mtDNA (308 Mya) andRAG-1 (367 Mya) estimates; this younger date is moreconsistent with the relatively late appearance (245 Mya)in the fossil record of unequivocal batrachians (Heatwoleand Carroll, 2001). Our estimates of major divergencesin caecilians, anurans, and urodeles are all substantiallyyounger than both previous molecular estimates. Al-though this makes our results more consistent with theknown fossil record, further taxon sampling would be
required to provide the internal calibrations needed totest the rate smoothing in this part of the tree.
Mammals
RAG-1 provides a robust and clear picture of bothtopology and divergence among the major mammalgroups. The basal divergence between monotremes andtherians is estimated at 207 to 227 Mya, comparable toPereira and Baker (2006; 207 Mya) and van Rheede et al.(2006; 217 to 231 Mya). Within Theria, the marsupial-eutherian divergence of 182 to 195 Mya is broadly com-parable with recent molecular analyses (Penny et al.,1999, 176 Mya; van Rheede et al., 2006, 186 to 193Mya; Drummond et al., 2005, 170 Mya; Pereira andBaker, 2006, 191 Mya, Woodburne et al., 2003, 182 to 190Mya; Hasegawa et al., 2003, 162 Mya) and much olderthan most palaeontological estimates (see Woodburneet al., 2003 for review). This fossil record probablyneeds to be reinterpreted. Thus, the divergences betweenthe monotremes, marsupials, and eutherians are moreclosely spaced (∼28 My apart) than previous suggestionsbased on the fossil record. This short branch coupled withhigh divergences among all three groups, along withbase composition biases in mtDNA, could explain lackof support in previous studies for the widely acceptedmarsupial-placental clade (see Phillips and Penny, 2003;Nilsson et al., 2004). What is particularly striking is thelong stem lineages leading to each extant mammal radi-ation: ∼90 Mya stem for eutherians versus extant age of∼100 Mya; ∼110 Mya versus ∼70 Mya for marsupials;∼170 Mya versus ∼40 Mya for monotremes. This sug-gest high levels of extinction, and therefore potentially alarge unknown diversity.
The basal divergence in living monotremes (platypus-echidna) is estimated at around 37 to 48 Mya, earlierthan most other studies (e.g., Kirsch and Mayer, 1998;Belov and Helllman, 2003). Those latter studies formedthe basis of the hypothesis that platypuses are ancestralto echidnas (implying secondary terrestriality and asso-ciated phenotypic reversals; see Musser, 2003; Dawkins,2004). The oldest well-known fossil platypus (Obdu-radon) has the morphotype of living forms, and at 25 Myold existed before the inferred platypus-echidna spilt (es-timated to be as recent as 21 Mya); it was thus presum-ably a stem (“ancestral”) taxon to the platypus-echidnaclade. However, the current analysis indicates that theplatypus-echidna divergence (∼40 Mya) is sufficientlyancient to pre-date the earliest well-known platypus fos-sils (the Paleocene Monotrematum is very poorly knownand its overall appearance is highly uncertain). Accord-ingly, there would be no need to invoke a platypus-likeancestry for living monotremes.
The dates for the marsupial radiation are similar tothose obtained recently by Nilsson et al. (2004) andDrummond et al. (2006). The crown radiation is 66 to73 My old, whereas the Australasian radiation (58 to 68Mya) may slightly pre-date the separation of Australasiafrom South America, allowing the possibility that multi-ple lineages of Gondwanan marsupials were originallypresent in Australasia. This is consistent with the likely
2007 HUGALL ET AL.—RAG-1 TETRAPOD PHYLOGENY 559
inclusion of the South American Dromiciops within theAustralasian clade (Amrine-Madsen et al., 2003). Theage of the extant eutherians has been estimated at 102to 107 Mya consistently in recent multigene molecularclock studies (e.g., Hasegawa et al., 2003; Springer et al.,2003; Woodburne et al., 2003). This vindicates the fos-sil record (∼98 Mya calibration used here) and refuteshypotheses of much older cryptic lineages (e.g., Hedgeset al., 1996; Penny et al., 1999). Similarly, the age of ex-tant Cetartiodactyla is consistently estimated to around65 Mya (e.g., Hasegawa et al., 2003). Of note is the youngdate for rodents of 21 to 27 Mya, in accord with nuclearanalyses (Springer et al., 2003; Jansa et al., 2006) but againyounger than mtDNA studies (Penny et al., 1999; Pereiraand Baker, 2006). The RAG-1 analyses suggest that thelatter dates are actually an artefact of rate and composi-tion effects in mtDNA.
Archosaurs
Divergences within archosaurs are more consistentwith the fossil record once the bird-croc = 245 Mya cal-ibration is employed (see above). This additional cali-bration deepens crocodylian and basal bird divergencesbut has less effect on dates within Neoaves (Table 3). Us-ing nucleotides, the extant crocodylian radiation is datedat 42 Mya, and the basal alligatorine (alligator-caiman)divergence is dated at 21 Mya; both these dates are incon-sistent with the old fossil ages of crown crocodylians (85Mya: Brochu, 2003) and crown alligators (66 to 71 Mya;Muller and Reisz, 2005). The amino acid estimates forthese divergences are deeper, but even so, the 95% con-fidence intervals do not overlap substantially. This dis-crepancy has no obvious explanation and needs furtherinvestigation. Janke et al. (2005) used mitogenome datawith the bird-croc = 245 Mya calibration to infer mucholder dates for crocodylians not supported by the fos-sil record: 137 to 164 Mya for extant crocodylians and98 to 118 Mya for alligator-caiman. However, saturationcauses mtDNA analyses to compress the basal branchleading to crocodylians relative to branches within thegroup (see Gatesy et al., 2003). This compression of thebasal branch coupled with Janke et al.’s use of a deepexternal calibration would drag all inferred divergenceswithin crocodylians deeper in time.
The basal bird split (paleognath-neognath) at 115 to136 Mya is deeper than proposed by previous studies(Harrison et al., 2004; Slack et al., 2006; Ericson et al.,2006). Basal splits among Neoaves (67 to 81 Mya), occur-ring around or slightly before the KT boundary, are sim-ilar to most recent studies (e.g., Harrison et al., 2004; vanTuinen and Dyke, 2004; Slack et al., 2006; Ericson et al.,2006). Most studies of avian divergences use internal cal-ibrations provided by bird fossils that may not be phylo-genetically placed with great certainty (e.g., Cooper andPenny, 1997; Haddrath and Baker, 2001; Harrison et al.,2004; see also Slack et al., 2006, and Ericson et al., 2006).Our study (with calibrations throughout amniotes) pro-vides additional support for the dates obtained in manyrecent studies. Studies employing such external (nona-
vian) calibrations have usually been based on very sparsetaxon sampling (Hedges et al., 1996), whereas otherswere based on fast evolving mtDNA that would saturateon the timescale of the deeper calibrations used, such asthe mammal-bird divergence (Rest et al., 2003; van Tu-inen and Hadly, 2004; Pereira and Baker, 2006). Thus, thepresent study supports other recent studies indicatingthat the diversification of Neoaves occurred closer to theK-T boundary than previously suggested (e.g., Cooperand Penny, 1997; Van Tuinen and Hedges, 2001).
Squamates
Squamates are a major focus of this study and our re-sults can be compared to the other three detailed anal-yses. Vidal and Hedges (2005) used nine nuclear genes;as half their concatenated sequence was RAG-1, theirresults might be expected to be similar to ours. How-ever, two factors resulted in deeper estimated diver-gences. First, they interpreted Parviraptor (∼165 Mya)as a basal anguimorph (see Evans and Wang, 2005) andthe Ptilotodon (∼110 Mya) as a teiid; these problematictaxa are discussed below. Second, all internal calibra-tion points were treated only as minimum constraints,with the sole maximum age constraint being the squa-mate root node (≤251 Mya, as opposed to 190–201 Myaestimated here). Relaxed clock procedures would predis-pose such an analysis to stretch all basal branches untilthey hit the root constraint. As this root constraint is aliberal maximum possible age, this pattern would causeall basal node dates to be overestimated; this trend isevident in the results discussed below.
Wiens et al. (2006) used RAG-1 and also employed in-ternal calibrations on a “backbone” tree to provide datesfor primary divergences within squamates. However, in-flation of basal dates was avoided as they imposed atight maximum bound on the basal Sphenodon-squamatenode, constraining this to be ≤227 Mya. Accordingly,their dates for basal squamate divergences are morerecent (and often comparable to the dates obtainedhere). Wiens et al. 2006, also inserted mitochondrial treesfor individual squamate groups onto the dated RAG-1“backbone” tree. Kumazawa (2007) used complete mi-tochondrial genomes together with external calibrationpoints. As discussed above, the combination of externalcalibrations and saturation-driven compression of basalnodes may contribute to the generally older dates.
The divergence dates between major squamates cladesin this study are comparable to those in Wiens et al.(2006) but more recent than those proposed by Vidaland Hedges (2005) and Kumazawa (2007). For instance,the crown squamate radiation is 190 to 201 My old(∼179 Mya in Wiens et al., 2006; ∼240 Mya in Vidal andHedges, 2005, and Kumazawa, 2007); divergences be-tween snakes and anguimorphs + iguanians (Toxicofera)are 158 to 160 Mya (c.f. ∼164, ∼179, and ∼210 mya), be-tween scincids and xantusiids 162 to 166 Mya (c.f. ∼158,∼192, and ∼205 Mya). Thus, this study supports theshallower proposed time frame for squamate diversifi-cation. The branches at the base of the squamates tree
560 SYSTEMATIC BIOLOGY VOL. 56
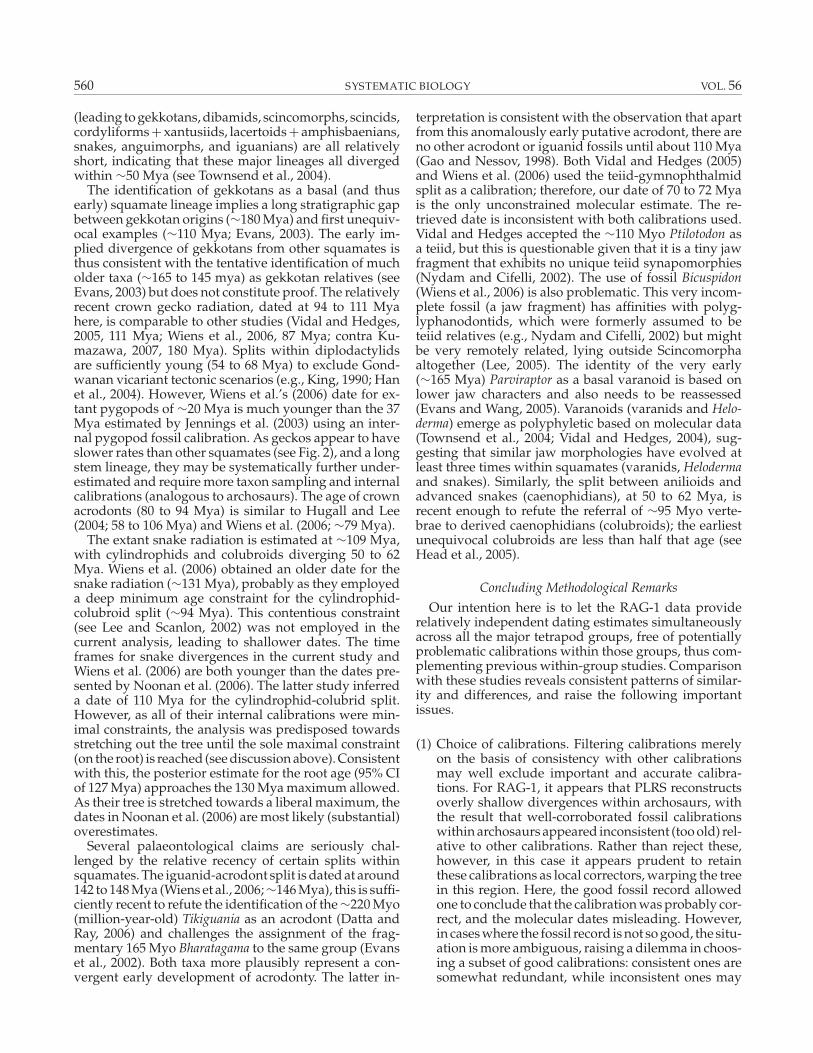
(leading to gekkotans, dibamids, scincomorphs, scincids,cordyliforms + xantusiids, lacertoids + amphisbaenians,snakes, anguimorphs, and iguanians) are all relativelyshort, indicating that these major lineages all divergedwithin ∼50 Mya (see Townsend et al., 2004).
The identification of gekkotans as a basal (and thusearly) squamate lineage implies a long stratigraphic gapbetween gekkotan origins (∼180 Mya) and first unequiv-ocal examples (∼110 Mya; Evans, 2003). The early im-plied divergence of gekkotans from other squamates isthus consistent with the tentative identification of mucholder taxa (∼165 to 145 mya) as gekkotan relatives (seeEvans, 2003) but does not constitute proof. The relativelyrecent crown gecko radiation, dated at 94 to 111 Myahere, is comparable to other studies (Vidal and Hedges,2005, 111 Mya; Wiens et al., 2006, 87 Mya; contra Ku-mazawa, 2007, 180 Mya). Splits within diplodactylidsare sufficiently young (54 to 68 Mya) to exclude Gond-wanan vicariant tectonic scenarios (e.g., King, 1990; Hanet al., 2004). However, Wiens et al.’s (2006) date for ex-tant pygopods of ∼20 Mya is much younger than the 37Mya estimated by Jennings et al. (2003) using an inter-nal pygopod fossil calibration. As geckos appear to haveslower rates than other squamates (see Fig. 2), and a longstem lineage, they may be systematically further under-estimated and require more taxon sampling and internalcalibrations (analogous to archosaurs). The age of crownacrodonts (80 to 94 Mya) is similar to Hugall and Lee(2004; 58 to 106 Mya) and Wiens et al. (2006; ∼79 Mya).
The extant snake radiation is estimated at ∼109 Mya,with cylindrophids and colubroids diverging 50 to 62Mya. Wiens et al. (2006) obtained an older date for thesnake radiation (∼131 Mya), probably as they employeda deep minimum age constraint for the cylindrophid-colubroid split (∼94 Mya). This contentious constraint(see Lee and Scanlon, 2002) was not employed in thecurrent analysis, leading to shallower dates. The timeframes for snake divergences in the current study andWiens et al. (2006) are both younger than the dates pre-sented by Noonan et al. (2006). The latter study inferreda date of 110 Mya for the cylindrophid-colubrid split.However, as all of their internal calibrations were min-imal constraints, the analysis was predisposed towardsstretching out the tree until the sole maximal constraint(on the root) is reached (see discussion above). Consistentwith this, the posterior estimate for the root age (95% CIof 127 Mya) approaches the 130 Mya maximum allowed.As their tree is stretched towards a liberal maximum, thedates in Noonan et al. (2006) are most likely (substantial)overestimates.
Several palaeontological claims are seriously chal-lenged by the relative recency of certain splits withinsquamates. The iguanid-acrodont split is dated at around142 to 148 Mya (Wiens et al., 2006; ∼146 Mya), this is suffi-ciently recent to refute the identification of the ∼220 Myo(million-year-old) Tikiguania as an acrodont (Datta andRay, 2006) and challenges the assignment of the frag-mentary 165 Myo Bharatagama to the same group (Evanset al., 2002). Both taxa more plausibly represent a con-vergent early development of acrodonty. The latter in-
terpretation is consistent with the observation that apartfrom this anomalously early putative acrodont, there areno other acrodont or iguanid fossils until about 110 Mya(Gao and Nessov, 1998). Both Vidal and Hedges (2005)and Wiens et al. (2006) used the teiid-gymnophthalmidsplit as a calibration; therefore, our date of 70 to 72 Myais the only unconstrained molecular estimate. The re-trieved date is inconsistent with both calibrations used.Vidal and Hedges accepted the ∼110 Myo Ptilotodon asa teiid, but this is questionable given that it is a tiny jawfragment that exhibits no unique teiid synapomorphies(Nydam and Cifelli, 2002). The use of fossil Bicuspidon(Wiens et al., 2006) is also problematic. This very incom-plete fossil (a jaw fragment) has affinities with polyg-lyphanodontids, which were formerly assumed to beteiid relatives (e.g., Nydam and Cifelli, 2002) but mightbe very remotely related, lying outside Scincomorphaaltogether (Lee, 2005). The identity of the very early(∼165 Mya) Parviraptor as a basal varanoid is based onlower jaw characters and also needs to be reassessed(Evans and Wang, 2005). Varanoids (varanids and Helo-derma) emerge as polyphyletic based on molecular data(Townsend et al., 2004; Vidal and Hedges, 2004), sug-gesting that similar jaw morphologies have evolved atleast three times within squamates (varanids, Helodermaand snakes). Similarly, the split between anilioids andadvanced snakes (caenophidians), at 50 to 62 Mya, isrecent enough to refute the referral of ∼95 Myo verte-brae to derived caenophidians (colubroids); the earliestunequivocal colubroids are less than half that age (seeHead et al., 2005).
Concluding Methodological Remarks
Our intention here is to let the RAG-1 data providerelatively independent dating estimates simultaneouslyacross all the major tetrapod groups, free of potentiallyproblematic calibrations within those groups, thus com-plementing previous within-group studies. Comparisonwith these studies reveals consistent patterns of similar-ity and differences, and raise the following importantissues.
(1) Choice of calibrations. Filtering calibrations merelyon the basis of consistency with other calibrationsmay well exclude important and accurate calibra-tions. For RAG-1, it appears that PLRS reconstructsoverly shallow divergences within archosaurs, withthe result that well-corroborated fossil calibrationswithin archosaurs appeared inconsistent (too old) rel-ative to other calibrations. Rather than reject these,however, in this case it appears prudent to retainthese calibrations as local correctors, warping the treein this region. Here, the good fossil record allowedone to conclude that the calibration was probably cor-rect, and the molecular dates misleading. However,in cases where the fossil record is not so good, the situ-ation is more ambiguous, raising a dilemma in choos-ing a subset of good calibrations: consistent ones aresomewhat redundant, while inconsistent ones may

2007 HUGALL ET AL.—RAG-1 TETRAPOD PHYLOGENY 561
be needed to correct weaknesses in the data and/ormethod used to adjust for rate variation.
(2) Type of calibrations. Calibrations may be enforced assingle dates, bounded ranges, or as minima. A currenttrend of applying internal fossil calibrations as min-ima with a maximum root constraint appears logicalbut actually leads to a consistent bias inflating datingestimates (as noted by Yang and Rannala, 2006). Insuch analyses, the single (possibly anomalous) inter-nal calibration suggesting greatest overall tree depthcan largely scale the tree (and all other calibrationswill have little effect), whereas model fitting artefactscan further increase basal branch lengths until themaximum age constraint is reached. The retrieveddates for each node will be estimates of maximumpossible age.
(3) Biases in branch length estimation across differ-ent types of molecular data. Here, saturation ofmtDNA appears to explain a consistent pattern ofdeep mtDNA ages in amphibians, mammals, and ar-chosaurs compared to nuclear data estimates (as seenin Penny et al., 1999; Zhang et al., 2005; Janke et al.,2005; Pereira and Baker, 2006). Greater compressionof deeper branches coupled with use of a deep cali-bration external to the group of interest will drag es-timates of within-group divergences deeper in time.
(4) Finally, there is a trade-off between enforcing mul-tiple calibrations to improve the overall estimate,and letting the molecular data speak for itself (e.g.,Near et al., 2005). If correct, multiple calibrations canimprove accuracy in regions of the tree by overrid-ing poorly estimated divergences and rate changes.However, imposing too many calibrations (includingspeculative and uncorroborated ones) can constrainthe result to say nothing more than those a priori dat-ing assumptions, obscuring information (and weak-nesses) in the molecular data.
ACKNOWLEDGEMENTS
We thank the Australian Research Council for financial support,and J. Gatesy, M. Hedin, R. Page, and an anonymous reviewer forcomments.
REFERENCES
Amrine-Madsen, H., K.-P. Koepfli, R. K. Wayne, and M. S. Springer.2003b. A new phylogenetic marker, apolopoprotein B, providescompelling evidence for eutherian relationships. Mol. Phylo. Evol.28:225–240.
Amrine-Madsen, H., M. Scally, M. Westerman, M. J. Stanhope, C.Krajewski, and M. S. Springer. 2003a. Nuclear gene sequences pro-vide evidence for the monophyly of australidelphian marsupials.Mol. Phylo. Evol. 28:186–196.
Baker, M. L., J. P. Wares, A.G. Harrison, and R. D. Miller. 2004. Rela-tionships among the families and orders of marsupials and the ma-jor mammalian lineages based on recombination activating gene-1.J. Mamm. Evol. 11:1–16.
Belov, K., and L. Hellman. 2003. Immunoglobulin genetics of Or-nithorhynchus anatinus (platypus) and Tachyglossus aculeatus (short-beaked echidna). Comp. Biochem. Physiol. A Mol. Integr. Physiol.136:811–819.
Benton, M. J., and P. C. J. Donoghue. 2007. Paleotological evidence todate the tree of life. Mol. Biol. Evol. 24:26–53.
Braun, E. L., and R. T. Kimball. 2002. Examining basal avian diver-gences with mitochondrial sequences:model complexity, taxon sam-pling and sequence length. Syst. Biol. 51:614–625.
Brinkman, H., B. Venkatesh, S. Brenner, and A. Meyer. 2004. Nuclearprotein-coding genes support lungfish and not coelacanth as the clos-est living relatives of land vertebrates. Proc. Natl. Acad. Sci. USA101:4900–4905.
Brochu, C. A. 2001. Progress and future directions in archosaur system-atics. J. Paleont. 75:1185–1201.
Caldwell, M. W. 1999. Squamate phylogeny and the relationships ofsnakes and mosasauroids. Zool. J. Linn. Soc. 125:115–147.
Cao, Y. M. D. Sorenson, Y. Kumazawa, D. P. Mindell, and M. Hasegawa.2000. Phylogenetic position of turtles among amniotes: Evidencefrom mitochondrial and nuclear genes. Gene 259:139–148.
Cooper, A., and D. Penny. 1997. Mass survival of birds acrossthe Cretaceous-Tertiary boundary: Molecular evidence. Science275:1109–1113.
Daeschler, E. B, N. H. Shubin, and F. A. Jenkins. 2006. A Devoniantetrapod-like fish and the evolution of the tetrapod body plan. Nature440:757–763.
Datta, P. M., and S. Ray. 2006. Earliest lizard from the Late Triassic(Carnian) of India. J. Vert. Paleontol. 26:795–800.
Dawkins, R. 2004. The ancestor’s tale. Houghton Mifflin, New York.Drummond, A. J., S. Y. W. Ho, M. J. Phillips, and A. Rambaut. 2005.
Relaxed phylogenetics and dating with confidence. PLoS Biol. 4:1–12.
Ericson, P. G. P., C. L. Anderson, T. Britton, A. Elzanowski, U. S.Johansson, M. Kallersjo, J. I. Ohlson, T. J. Parsons, D. Zuccon, andG. Mayr. 2006. Diversification of Neoaves: integration of molecularsequence data and fossils. Biol. Lett. 2:543–547.
Evans, S. E., G. V. R. Prasad, and B. K. Manhas. 2002. Fossil lizardsfrom the Jurassic Kota formation of India. J. Vert. Paleontol. 22:299–312.
Evans, S. E., and Y. Wang. 2005. The early Cretaceous lizard Dal-inghosaurus from China. Acta Palaeontol. Pol. 50:724–742.
Felsenstein, J. 1981. Evolutionary trees from DNA sequences: A maxi-mum likelihood approach. J. Mol. Evol. 17:368–376.
Gaffney, E. S., and P. A. Meylan. 1988. A phylogeny of turtles. Pages 157–219 in The phylogeny and classification of tetrapods (M. J. Benton,ed.). Clarendon Press, Oxford.
Gaffney, E. S., P. A. Meylan, and A. R. Wyss, A. R. 1991. A computer as-sisted analysis of the relationships of the higher categories of turtles.Cladistics 7:313–335.
Gatesy, J., G. Amato, M. Norell, R. DeSalle, and C. Hayashi. 2003. Com-bined support for wholesale taxic atavism in gavialine crocodyliansSyst. Biol. 52:403–422.
Gower, D. J., and S. J. Nesbitt. 2006. The braincase of Arizonasaurusbabbitti—Further evidence for the non-monophyly of “rauisuchian”archosaurs. J. Vert. Paleontol. 26:79–87.
Graur, D., and W. Martin. 2004. Reading the entrails of chickens: Molec-ular timescales of evolution and the illusion of precision. TrendsGenet. 20:80–86.
Groth, J. G., and G. F. Barrowclough. 1999. Basal divergences in birdsand the phylogenetic utility of the nuclear RAG-1 gene. Mol. Phylo-genet. Evol. 12:115–123.
Han,D., K. Zhou, and A. Bauer. 2004. Phylogenetic relationships amonggekkotan lizards inferred from c-mos nuclear DNA sequences and anew classification of the Gekkota. Biol. J. Linn. Soc. 83:353–368.
Harrison, G. L., P. A. McLenachan, M. J. Phillips, K. E. Slack, A. Cooper,and D. Penny. 2004. Four new avian mitochondrial genomes help getto basic evolutionary questions in the late Cretaceous. Mol. Biol. Evol.21:974–983.
Hasegawa, M., J. L. Thorne, and H. Kishino. 2003 Time scale of euthe-rian evolution estimated without assuming a constant rate of molec-ular evolution. Genes Genet. Syst. 78:267–283.
Head, J. J., P. A. Holdoyrd, J. H. Hutchison, and R. L. Ciochon. 2005.First report of snakes (Serpentes) From the Late Middle Eocene ofthe Ponduang Formation, Myanmar. J. Vert. Paleontol. 25:246–250.
Heatwole, H., and R. L. Carroll (eds). 2001. Amphibian biology. Volume4: Palaeontology. Surrey Beatty and Sons, Chipping Norton, Sydney.
Hedges S. B., P. H. Parker, C. G. Sibley, and S. Kumar. 1996. Continen-tal breakup and the ordinal diversification of birds and mammals.Nature 381:226–229.
562 SYSTEMATIC BIOLOGY VOL. 56
Hedges, S. B., and L. L. Poling. 1999. A molecular phylogeny of reptiles.Science 283:998–1001.
Higgins, D. G., A. J. Bleasby, and R. Fuchs. 1992. CLUSTAL V: Improvedsoftware for multiple sequence alignment. CABIOS 8:189–191.
Ho, Y. W. S., M. J. Phillips, A. J. Drummond, and A. Cooper. 2005.Accuracy of rate estimation using relaxed-clock models with a criticalfocus on the early Metazoan radiation. Mol. Biol. Evol. 22:1355–1363.
Hoegg, S., M. Vences, H. Brinkmann, and A. Meyer. 2004. Phylogenyand comparative substitution rates of frogs inferred from sequencesof three nuclear genes. Mol. Biol. Evol. 21:1188–1200.
Hugall, A. F., and M. S. Y. Lee. 2004. Molecular claims of Gondwananage for Australian agamid lizards are untenable. Mol. Biol. Evol.21:2102–2110.
Iwabe, N., Y. Hara, Y. Kumazawa, K. Shibamoto, Y. Saito, T. Miyata,and K. Katoh. 2005. Sister group relationship of turtles to the bird-crocodilian clade revealed by nuclear DNA–coded proteins. Mol.Biol. Evol. 22:810–813.
Janke, A., D. Erpenbeck, M. Nilsson, and U. Arnason. 2001. The mito-chondrial genomes of the iguana (Iguana iguana) and the caiman(Caiman crocodylus): Implications for amniote phylogeny. Proc. R.Soc. Lond. B 268:623–631.
Janke, A., A. Gullberg, S. Hughes, R. K. Aggarwal, and U. Arnason.2005. Mitogenomic analyses place the gharial (Gavialis gangeticus) onthe crocodile tree and provide pre-K/T divergence times for mostcrocodilians. J. Mol. Evol. 61:620–626.
Jansa, S. A., F. K. Barker, and L. R. Heaney. 2006. The pattern and tim-ing of diversification of Phillippine endemic rodents: Evidence frommitochondrial and nuclear gene sequences. Syst. Biol. 55:73–88.
Jennings, W. B., E. R. Pianka, and S. Donnellan. 2003. Systematics of thelizard family Pygopodidae with implications for the diversificationof Australia temperate biotas. Syst. Biol. 52:757–780.
Killian, J. K., T. R. Buckley, N, Stewart, B. L. Munday, and R. L. Jirtle.2001. Marsupials and Eutherians reunited: genetic evidence for theTheria. Mamm. Genome 12:513–517.
King, M. 1990. Chromosomal and immunogenetic data: A new perspec-tive on the origin of Australia’s reptiles. Pages 153–180 in Cytogenet-ics of amphibians and reptiles. Advances in life sciences. BirkhauserVerlag, Basel.
Kirsch, J. A. W., and G. C. Mayer. 1998. The platypus is not a rodent:DNA hybridization, amniote phylogeny, and the palimpsest theory.Phil. Trans. R. Soc. B 353:1221–1237.
Krenz, J. G., G. J. P. Naylor, H. B. Shaffer, and F. J. Janzen. 2005. Molecularphylogenetics and evolution of turtles. Mol. Phylo. Evol. 37:178–191.
Kumar, S., and S. B. Hedges. 1998. A molecular timescale for vertebrateevolution. Nature 392:917–920.
Kumazawa, Y. 2007. Mitochondrial genomes from major lizard fami-lies suggest their phylogenetic relationships and ancient radiations.Gene 388:19–26.
Lee, M. S. Y. 2001. Molecules, morphology and the monophyly of di-apsid reptiles. Contrib. Zool. 70:1–22.
Lee, M. S. Y. 2005. Molecular evidence and snake origins. Biol. Lett.1:227–230.
Lee, M. S. Y., and A. F. Hugall. 2006. Model type, implicit data weight-ing, and model averaging in phylogenetics. Mol. Phylogenet. Evol.38:848–857.
Lee, M. S. Y., and J. D. Scanlon. 2002. Snake phylogeny based on oste-ology, soft anatomy and behaviour. Biol. Rev. 77:333–401.
Lemmon, A. R., and E. C. Moriarty. 2004. The importance of propermodel assumption in Bayesian phylogenetics. Syst. Biol. 53:265–277.
Madsen, O., M. Scally, C. J. Douady, D. J. Kao, R. DeBry, R. Adkins, H.M. Amrine, M. J. Stanhope, W. W. de Jong, and M. Springer. 2001. Par-allel adaptive radiations in two major clades of placental mammals.Nature 409:610–614.
Meyer, A., and R. Zardoya. 2003. Recent advances in the (molecular)phylogeny of vertebrates. Ann. Rev. Ecol. Syst. 34:311–338.
Molnar, R. E. 2000. The long and honorable history of monitors andtheir kin. Pages 10–67 in Varanoid lizards of the World (E. R. Piankaand D. R. King, eds.). Indiana University Press: Bloomington andIndianapolis.
Mueller, R. L., R. J. Macey, M. Jaekel, D. B. Wake, and J. Boore. 2004.Morphological homoplasy, life history evolution, and historical bio-geography of plethodontid salamanders inferred from complete mi-tochondrial genomes. Proc. Natl. Acad. Sci. USA 101:13820–13825.
Muller, J., and R. R. Reisz. 2005. Four well-constrained calibrationpoints from the vertebrate fossil record for molecular clock estimates.BioEssays 27:1069–1075.
Musser, A. M. 2003. Review of the monotreme fossil record and com-parison of palaeontological and molecular data. Comp. Biochem.Physiol. A Mol. Physiol. 136:927–942.
Near, T. J., P. A. Meylan, and H. B. Shaffer. 2005. Assessing concordanceof fossil calibration points in molecular clock studies: An exampleusing turtles. Am. Nat. 165:137–146.
Near, T. J., and M. J. Sanderson. 2004. Assessing the quality of molecu-lar divergence time estimates by fossil calibrations and fossil basedmodel selection. Phil Trans. R. Soc. Lond. B 359:1477–1483.
Nesbitt, S. J. 2003. Arizonasaurus and its implications for archosaurdivergence. Proc. R. Soc. Lond. B (Suppl.) 270:S234–S237.
Nilsson, M. A., U. Arnason, P. B. S. Spencer, and A. Janke. 2004. Mar-supial relationships and a timeline for marsupial radiation in SouthGondwana. Gene 340:189–196.
Noonan, B. P., and P. T. Chippindale. 2006. Dispersal and vicariance:The complex evolutionary history of boid snakes. Mol. Phylogenet.Evol. 40:347–358.
Nydam, R. L., and R. L. Cifelli. 2002. A new teiid lizard from the LowerCretaceous (Aptian-Albian) Antlers and Cloverly formations. J. Vert.Paleontol. 22:286–298.
Parker, W. G., R. B. Irmis, S. J. Nesbitt, J. W. Martz, and L. S. Browne.2005. The Late Triassic pseudosuchian Revueltosaurus callenderi andits implications for the diversity of early ornithischian dinosaurs.Proc. Roy. Soc. B 272:963–969.
Penny, D., M. Hasegawa, P. J. Waddell, and M. D. Hendy. 1999.Mammalian evolution: Timing and implications from using theLogDeterminant transformation for proteins of differing amino acidcomposition. Syst. Biol. 48:76–93.
Penny, D., B. J. McComish, M. A. Charleston, and M. D. Hendy.2001. Mathematical elegance with biochemical realism: The covar-ion model of molecular evolution. J. Mol. Evol. 53:711–723.
Pereira, S. L., and A. J. Baker. 2006. A mitogenomic timescale for birdsdetects variable phylogenetic rates of molecular evolution and re-futes the standard molecular clock. Mol. Biol. Evol. 23: 1731–1740.
Phillips, M.J., and D. Penny. 2003. The root of the mammalian tree in-ferred from whole mitochondrial genomes. Mol. Phylo. Evol. 28:171–185.
Poe, S., and A.L. Chubb. 2004. Birds in a bush: Five genes indicateexplosive radiation of avian orders. Evolution 58:404–415.
Porter, M. L., M. Perez-Losada, and K. A. Crandall. 2005. Model-basedmultilocus estimation of decapod phylogeny and divergence times.Mol. Phylogenet. Evol. 37:355–369.
Posada, D., and T. R. Buckely. 2004. Model selection and model av-eraging in phylogenetics: advantages of Akaike Information Crite-rion and Bayesian approaches over likelihood ratio tests. Syst. Biol.53:793–808.
Posada, D., and K. Crandall. 2001. Selecting the best-fit model of nu-cleotide substitution. Syst. Biol. 50:580–601.
Rambaut, A. 1996. Se-Al: Sequence Alignment Editor. Available athttp://evolve.zoo.ox.ac.uk/
Reisz, R. R., and M. Mueller. 2004. Molecular timescales and the fossilrecord: A paleontological perspective. Trends Genet. 20:237–241.
Rest, J. S., J. C. Ast, C. C. Austin, P. J. Waddell, E. A. Tibbetts, J. M. Hay,and D. Mindell. 2003. Molecular systematics of primary reptilian lin-eages and the tuatara mitochondrial genome. Mol. Phylogent. Evol.29:289–297.
Rieppel, O. 2000. Turtles as diapsid reptiles. Zool. Scripta 29:199–212.Roelants, K., and F. Bossuyt. 2005. Archaeobatrachian paraphyly and
Pangaean diversification of crown-group frogs. Syst. Biol. 54:111–126.Ronquist, F., and J. P. Huelsenbeck. 2003. MrBayes 3: Bayesian phy-
logenetic inference under mixed models. Computer program anddocumentation. www.morphbank.ebc.uu.se/mrbayes
Sanders, K. L., and M. S. Y. Lee. 2007. Evaluating molecular clock cal-ibrations using Bayesian analyses with soft and hard bounds. Biol.Lett. 3:275–279.
Sanderson, M. J. 2002. Estimating absolute rates of molecular evolutionand divergence times: a penalized likelihood approach. Mol. Biol.Evol. 19:101–109.
San Mauro, D., D. J. Gower, O. V. Oommen, M. Wilkinson, and R.Zardoya. 2004. Phylogeny of caecilian amphibians (Gymnophiona)

2007 HUGALL ET AL.—RAG-1 TETRAPOD PHYLOGENY 563
based on complete mitochondrial genomes and nuclear RAG1. Mol.Phylogenet. Evol. 33:413–427.
San Mauro, D. M. Vences, M. Alcobendas, R. Zardoya, and A.Meyer. 2005. Initial Diversification of living amphibians predatedthe breakup of Pangaea. Am. Nat. 165:590–599.
Sereno, P. C., and A. B. Arcucci. 1994. Dinosaurian precursors from theMiddle Triassic of Argentina: Lagerpeton canarensis. J. Vert. Paleontol.13:385-399.
Shapiro, B., A. Rambaut, and A. J. Drummond. 2006. Choosing appro-priate substitution models for the phylogenetic analysis of protein-coding sequences. Mol. Biol. Evol. 23:7–9.
Slack, K. E., C. M. Jones, T. Ando, G. L. Harrison, R. E. Fordyce, U.Arnason, and D. Penny. 2006. Early penguin fossils, plus mitochon-drial genomes, calibrate avian evolution. Mol. Biol. Evol. 23:1144–1155.
Sorenson, M. D. 1999. TreeRot. Version 2. Boston University, Boston,MA. Available at people.bu.edu/msoren/TreeRot.html.
Springer, M. S., W. J. Murphy, E. Eizirik, and S. J. O’Brien. 2003. Placen-tal mammal diversification and the Cretaceous–Tertiary boundary.Proc. Natl. Acad. Sci. USA 100:1056–1061.
Swofford, D. L. 2000. PAUP*: Phylogenetic analysis using parsimony(*and other methods). Version 4 (beta). Sinauer Associates, Sunder-land, Massachusetts.
Thompson, J. D., T. J. Gibson, F. Plewniak, F. Jeanmougin, and D. G.Higgins. 1997. The ClustalX windows interface: Flexible strategiesfor multiple sequence alignment aided by quality analysis tools. Nu-cleic Acids Res. 24:4876–4882.
Townsend, T. M., A. Larson, E. Louis, and R. J. Macey. 2004. Molecularphylogenetics of Squamata: The position of snakes, amphisbaenians,and dibamids, and the root of the squamate tree. Syst. Biol. 53:735–757.
Van Rheede, T., T. Bastianns, D. N. Boone, S. B. Hedges, W. W. de Jong,and O. Madsen. 2006. The platypus is in its place: Nuclear genes andindels confirm the sister group relation of monotremes and therians.Mol. Biol. Evol. 23:587–597.
Van Tuinen, M., and G. J. Dyke. 2004. Calibration of galliform molecularclocks using multiple fossils and genetic partitions Mol. Phylogenet.Evol. 30:74–86.
Van Tuinen, M., and E. A. Hadly. 2004. Error in estimation of rate andtime inferred from the early amniote fossil record and avian molec-ular clocks. J. Mol. Evol. 59:267–276.
Van Tuinen, M., and S. B. Hedges. 2001. Calibration of avian molecularclocks. Mol. Biol. Evol. 18:206–213.
Vidal, N., and S. B. Hedges. 2005. The phylogeny of squamate reptiles(lizards, snakes, and amphisbaenians) inferred from nine nuclearprotein-coding genes. C. R. Biol. 328:1000–1008.
Welch, J. J., and L. Bromham. 2005. Molecular dating when rates vary.TREE 20:320–327.
Welch, J. J., E. Fontanillis, and L. Bromham. 2005. Molecular dates forthe “Cambian Explosion”: The influence of prior assumptions. Syst.Biol. 54:672–678.
Wiens, J. J., M. C. Brandley, and T. W. Reeder. 2006. Why does atrait evolve multiple times within a clade? Repeated evolutionof snakelike body form in squamate reptiles. Evolution 60:123–141.
Woodburne, M. O., T. H. Rich, and M. S. Springer. 2003. The evolu-tion of tribospheny and the antiquity of mammalian clades. Mol.Phylogenet. Evol. 28:360–395.
Wu, X.-C., and A. P. Russell. 2001. Redescription of Turfanosuchus daba-nensis (Archosauriformes) and new information on its phylogeneticrelationships. J. Vert. Paleontol. 21:40–50.
Yang, Z., and B. Rannala. 2006. Bayesian estimation of species diver-gence times under a molecular clock using multiple fossil calibrationswith soft bounds. Mol. Biol. Evol. 23:212–226.
Zardoya, R., and A. Meyer. 1998. Complete mitochondrial genome sug-gests diapsid affinities of turtles. Proc. Natl. Acad. Sci. USA 95:14226–14231.
Zhang, P., H. Zhou, Y.-Q. Chen,Y.-F. Liu, and L.-H. Qu. 2005. Mitoge-nomic perspectives on the origin and phylogeny of living amphib-ians. Syst. Biol. 54:391–400.
Zwickl, D. J., and D. M. Hillis. 2002. Increased taxon sampling greatlyreduces phylogenetic error. Syst. Biol. 51:588–598.
First submitted 17 October 2006; reviews returned 5 January 2007;final acceptance 2 April 2007
Associate Editor: Marshal Hedin