Embed Size (px)
DESCRIPTION
A synthesis of the information contained in the National Climate Assessment’s [NCA] Chapters on the Midwest (Ch. 18) and Northeast (Ch. 16), compiled by the Great Lakes Integrated Sciences + Assessments [GLISA].
Citation preview

Synthesis of the Third National Climate Assessment for the Great Lakes Region
Midwest Region AuthorsSara C. Pryror, Indiana UniversityDonald Scavia, University of MichiganCharles Downer, U.S. Army Engineer Research and Development CenterMarc Gaden, Great Lakes Fishery CommissionLouis Iverson, U.S. Forest ServiceRolf Nordstrom, Great Plains Institute Johnathan Patz, University of WisconsinG. Philip Robertson, Michgan State University
Northeast Region AuthorsRadley Horton, Columbia UniversityGary Yohe, Wesleyan UniversityWilliam Easterling, Pennsylavania State UniversityRobert Kates, University of MaineMatthias Ruth, Northeastern UniversityEdna Sussman, Fordham University School of LawAdam Whelchel, The Nature ConservancyDavid Wolfe, Cornell UniversityFrederic Lipschultz, NASA and Bermuda Institute of Ocean Services
Great Lakes Integrated Sciences + Assessments (GLISA) Synthesis AuthorsWilliam Baule, GLISA Research AssociateElizabeth Gibbons, GLISA Program ManagerLaura Briley, GLISA Research AssociateDaniel Brown, GLISA Research Associate
GLISA is a partnership between the University of Michigan and Michigan State University, housed in the Graham Sustainability Institute’s Climate Center at U-M. Learn more at glisa.umich.edu.

NOTE: Material in this report is largely a synthesis of the information contained in the National Climate Assessment’s [NCA] Chapters on the Midwest (Ch. 18) and Northeast (Ch. 16), compiled by the Great Lakes Integrated Sciences + Assessments [GLISA]. The co-director of GLISA, Donald Scavia, was one of the convening authors for the Midwest Region Chapter of the Third NCA. GLISA also served as a hub for the compilation of technical inputs for the Midwest Region Chapter of the NCA. Information taken from these chapters (16 and 18) is not directly cited, references to information contained in other NCA chapters is referenced. Any outside information (including external citations in NCA chapters) are directly cited in this report.

1
Key Messages1. Extreme rainfall events and flooding have increased during the last
century, and these trends are expected to continue. Combined with land cover changes: erosion, declining water quality, and negative impacts on transportation, agriculture, human health, and infrastructure are all potential impacts.
2. In the next few decades, longer growing seasons and rising carbon dioxide levels will increase yields of some crops, though those benefits will be progressively offset by extreme weather events. The region’s fruit crops are particularly vulnerable to anomalous weather events, which are becoming more frequent. Though adaptation options can reduce some of the detrimental effects, in the long term, the combined stresses associated with climate change are expected to decrease agricultural productivity.
3. The composition of forests in the Great Lakes is changing as the climate warms. Many tree species are shifting northward, with more southerly varieties replacing them. Many iconic north wood tree species will lose their advantage and be slowly replaced over the next century.
4. Increased heat wave intensity and frequency, increased humidity, degraded air quality, reduced water quality, and change in vector borne disease patterns will increase public health risks.
5. The Great Lakes region has a highly energy-intensive economy with per capita emissions of greenhouse gases more than 20% higher than the national average. The region also has a large and increasingly utilized potential to reduce emissions that cause climate change.
6. Climate change will exacerbate a range of risks to the Great Lakes, including changes in the range and distribution of certain fish species, increased invasive species and harmful blooms of algae, and declining beach health. Ice cover declines will lengthen the commercial navigation season.
The Great Lakes region of the United States covers all or portions of eight states (Illinois, Indiana, Michigan, Minne-sota, New York, Ohio, and Pennsylvania) and straddles regions typically described as the Midwest and the North-east (See NCA Ch. 16: Northeast and Ch. 18: Midwest).
Approximately 23 million people live in the U.S. side of the Great Lakes Basin. The Great Lakes region is a varied region containing agricultural lands, forests, urban areas (including Buffalo, Chicago, Cleveland, Detroit, Milwaukee, and Rochester), and the Great Lakes themselves. The
GREAT LAKES

2
region’s defining feature (The Great Lakes) is the largest freshwater system on Earth and contains 84% of North America’s surface fresh water (21% of global surface fresh water). These lakes are vital resource for water consump-tion, transportation, recreation, and power generation, among many other uses. In recent decades this region has experienced substantial shifts in populations, socio-economic changes, air and water pollution, and landscape changes. Both natural and the built environment display
potential vulnerabilities to climate variability and climate change.
Climate change will tend to amplify existing risks from climate to impact people, ecosystems, and infrastructure (See: NCA Ch. 10: Energy, Water, Land). The direct effects of increased heat stress, flooding, drought, and late spring freezes on nat-ural and developed ecosystems may be magni-fied by changes in other areas, such as: disease and pest prevalence, increased competition from non-native or opportunistic native species, ecosystem disturbances, land-use change, atmo-spheric pollutants, and economic shocks due to extreme weather events. The above impacts are particularly concerning for the Great Lakes since a major component of the region’s economy relies on the region’s fisheries, recreation, tourism, and commerce generated by the Great Lakes and the northern forests of the region.
Much of the region’s population lives in cities, which are also vulnerable to climate change. In particular, climate change related flooding and life-threatening heat waves are major concerns for municipalities across the region. These impacts can be amplified further by aging infra-structure. Infrastructure built to withstand past climates, especially as it ages, may amplify impacts from heat
Figure 1.The colors on the map show temperature changes over the past 22 years (1991-2012) compared to the 1901-1960 average (1951-1980 average for Alaska and Hawai’i). The bars on the graphs show the average tempera-ture changes by decade for 1901-2012 (relative to the 1901-1960 average) for each region. The far right bar in each graph includes 2011 and 2012. The period from 2001 to 2012 was warmer than any other previous decade in every
region (Figure Source: NCA Ch.2: Our Changing Climate; NOAA NCDC / CICS-NC).
Observed U.S. Temperature Change

3
waves and flooding events. Climate change may also adversely affect urban vegetation. Changing urban veg-etation could be attributed to changes in: atmospheric pollution, heat island effects, a highly variable water cycle, and frequent exposure to new pests and diseases.
Some cities in the region are actively involved in adapta-tion and mitigation planning to confront changes in their environment due to climate change. The Great Lakes region has a highly energy-intensive economy and emits large amounts of greenhouse gases; thus has a large potential for mitigating and adaptive actions in this sector (See NCA Ch. 27: Mitigation; NCA Ch. 28: Adaptation).
TemperatureThe temperatures in the Great Lakes, along with a ma-jority of the United States, have been rising over the past several decades (Figure 1). The average temperature in northern portions of the region has warmed by more than 1.5°F during the period from 1991-2012 when compared to the period from 1901-1960. The most recent decade from 2000-2010 and including 2011 and 2012 has warmed faster in than any decade since 1900. The Midwest region (which includes much of the Great Lakes) has experienced an increasing pace of warming since 1900 (Figure 2). The observed increases in temperature also exhibit a diurnal and seasonal component with winter and nighttime tem-
peratures warming faster than other seasons or daytime temperatures.
The amount of future warming for the region will depend on changes in the atmospheric concentration of heat-trap-ping gases. Projections for the middle of the 21st century (2041-2070) in the Great Lakes region suggest warming of 3.5-4.5°F for a scenario with substantial emissions reduc-tions (B1), and 5.5-6.5°F with continued growth in global emissions of heat trapping gases (A2). The projections for the end of the century (2070-2099) are approximately 5.5-6.5°F for the lower emissions scenarios and 7.5-9.5°F for the higher emissions scenario (See NCA Ch. 2: Our Changing Climate).
PrecipitationAnnual precipitation has generally been increasing over the Great Lakes and much of the country over the past several decades (with some regions increasing up to 20% annually) (Figure 3), with much of this increase being attributable to the increases in the intensity of the heavi-est rainfalls (Figure 5) (Pryor et al. 2009a; Pryor et al. 2009b). This tendency towards more intense precipitation events is projected to continue into the future (Schoof et al. 2010). Interestingly there has been no apparent change in drought duration in the Great Lakes (or the larger Midwest) region as a whole over the past century (Dai 2010).
Model projections for precipitation changes are less certain than those for temperatures (Pryor et al. 2013; Kunkel et al. 2013). Under a higher emissions scenario (A2), models project average winter and spring precipitation by late this century (2071-2099) to increase 10% to 20% relative to 1970-2000. Projected changes under the higher emis-sions scenario in summer and fall are not expected to be larger than natural variations. Regional climate model projections using the same emissions scenarios also project increased spring precipitation and decreased summer precipitation, though the largest increases are to the south of the Great Lakes. Increases in the frequency and intensity of extreme precipitation are projected across the Great Lakes region in both General Circulation Models (GCM) and Regional Cir-culation Models (RCM) simulations and these increases are generally larger than the projected changes in average precipitation (Figure 4).
Increased Pace of Midwest Warming
Figure 2. Annual temperature anomalies for the Midwest from the CRUTEM3 data set. The anomalies are relative to 1961-1990. The data have a spatial res-olution of 5 x 5° thus the domain used to construct this figure is 35°N to 50°N and 95°W to 80°W. Also shown is a 5-year running mean and linear fits to the annual data for 1900-2010, 1950-2010, and 1970-2010. The shading represents the 95% confidence intervals on the fits. The slopes of the region-wide trend estimates are expressed in °C per decade and are shown for 30 time periods: 1900-2010, 1950-2010, and 1979-2010 (Andresen et al. 2012; Pryor and Bar-
thelmie 2009a).

4
Observed U.S. Precipitation Change
Figure 3. The colors on the map show annual total precipitation changes for 1991-2012 compared to the 1901-1960 average, and show average precipitation differences by decade for 1901-2012 (relative to the 1901-1960 average) for each region. The far right bar is for 2001-2012. (Figure Source: NCA Ch.2: Our
Changing Climate; adapted from Peterson et al. 2013).
Projected Change in Heavy Precipitation Events
Figure 4. Maps show the increase in frequency of extreme daily precipitation events (a daily amount that now occurs once in 20 years) by the later part of this century (2081-2100) compared to the later part of last century (1981-2000). Such extreme events are projected to occur more frequently everywhere in the U.S. Under the rapid emissions reduction scenario (RCP 2.6), these events would occur nearly twice as often. For the scenario assuming continued increases in emissions (RCP 8.5) these events would occur up to five times as often. (Figure Source: NCA Ch.2: Our Changing Climate; NOAA NCDC / CICS-NC)

5
Impacts from Increased Flooding
Extreme rainfall events and flooding have increased during the last century, and these trends are expected to continue. Combined with land cover changes: erosion, declining water quality, and negative
impacts on transportation, agriculture, human health, and infrastructure are all potential impacts.
Impacts from increased flooding often span a variety of sectors. Flooding due to/amplified by extreme precipitation (Figure 5) can affect the integrity and diversity of aquatic ecosystems. Flooding also causes major human and eco-nomic consequences by inundating urban and agricultural land and by disrupting navigation in the region’s roads, rivers, and reservoirs (see NCA Ch. 5: Transportation, Ch. 9: Human Health, and Ch. 11: Urban). Water infrastructure for flood control, navigation, and other purposes is suscep-tible to climate change impacts and other forces because the designs are based upon historical patterns of precipi-tation and stream flow, which may no longer be appropri-ate guides in a changing climate.
Changing land use and expanding urbanization are reduc-ing water infiltration into the soil and increasing surface runoff. These changes exacerbate impacts caused by increased precipitation intensity. As more surface area is converted to impervious surfaces and extreme precipita-tion events have intensified, stormwater systems are being overtaxed leading to system failures including combined
sewer overflows and water treatment plant shut-downs .The EPA estimates that more than 800 billion gallons of untreated combined sewage are released into the nation’s waters annually (McLellan et al. 2007). The Great Lakes have been subject to recent sewage overflows. These are of concern since the Great Lakes provide drinking water to more than 40 million people and are home to more than 500 beaches (Patz et al. 2008). In light of a changing climate, municipalities may be forced to invest in new infrastructure to protect human health and water quality. Communities along the Great Lakes could also face tourism losses from fouled near-shore regions and increases in beach clo-sures, resulting from water-borne diseases.
Increased precipitation intensity also increases erosion, damaging ecosystems and augmenting delivery of sediment and subsequent loss of res-ervoir storage capacity. Increased storm-induced agricultural runoff and rising water temperatures have increased non-point source pollution problems in recent years (Mishra et al. 2010). This has lead to increased phosphorus and nitrogen loading, which in turn is contributing to more and prolonged occur-rences of low-oxygen “dead-zones” and to harmful, lengthy, and dense algae growth in the Great Lakes and other Midwest water bodies (Scavia et al. 2014; Michalak et al. 2013). Watershed planning can be used to reduce water quantity and quality problems due to changing climate and land use.
Observed Changes in Very Heavy Precipitation
Figure 5. The map shows percent increases in the amount of pre-cipitation falling in very heavy events (defined as the heaviest 1% of all daily events) from 1958 to 2012 for each region of the conti-nental United States. These trends are larger than natural variations for the Northeast, Midwest, Puerto Rico, Southeast, Great Plains, and Alaska. The trends are not larger than natural variations for the Southwest, Hawai‘i, and the Northwest. The changes shown in this figure are calculated from the beginning and end points of the trends for 1958 to 2012. (Figure source: NCA Ch.2: Our Changing
Climate; updated from Karl et al. 2009).
6
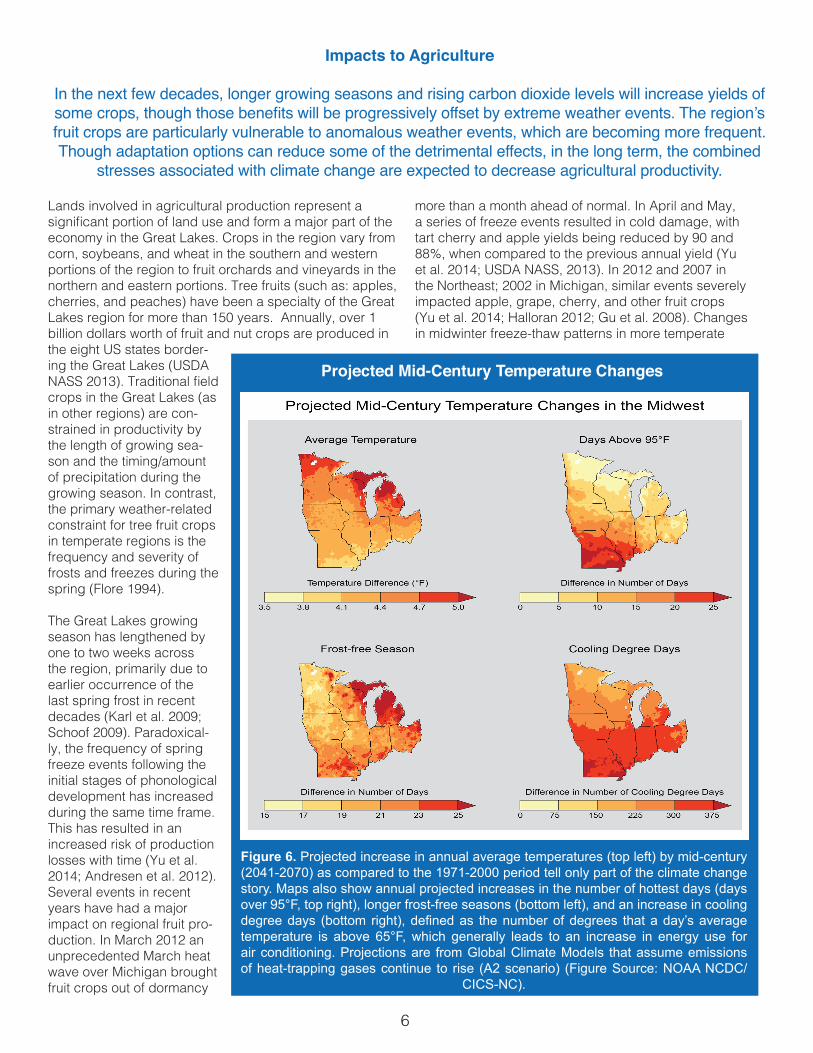
Impacts to Agriculture
In the next few decades, longer growing seasons and rising carbon dioxide levels will increase yields of some crops, though those benefits will be progressively offset by extreme weather events. The region’s fruit crops are particularly vulnerable to anomalous weather events, which are becoming more frequent. Though adaptation options can reduce some of the detrimental effects, in the long term, the combined
stresses associated with climate change are expected to decrease agricultural productivity.
Lands involved in agricultural production represent a significant portion of land use and form a major part of the economy in the Great Lakes. Crops in the region vary from corn, soybeans, and wheat in the southern and western portions of the region to fruit orchards and vineyards in the northern and eastern portions. Tree fruits (such as: apples, cherries, and peaches) have been a specialty of the Great Lakes region for more than 150 years. Annually, over 1 billion dollars worth of fruit and nut crops are produced in the eight US states border-ing the Great Lakes (USDA NASS 2013). Traditional field crops in the Great Lakes (as in other regions) are con-strained in productivity by the length of growing sea-son and the timing/amount of precipitation during the growing season. In contrast, the primary weather-related constraint for tree fruit crops in temperate regions is the frequency and severity of frosts and freezes during the spring (Flore 1994).
The Great Lakes growing season has lengthened by one to two weeks across the region, primarily due to earlier occurrence of the last spring frost in recent decades (Karl et al. 2009; Schoof 2009). Paradoxical-ly, the frequency of spring freeze events following the initial stages of phonological development has increased during the same time frame. This has resulted in an increased risk of production losses with time (Yu et al. 2014; Andresen et al. 2012). Several events in recent years have had a major impact on regional fruit pro-duction. In March 2012 an unprecedented March heat wave over Michigan brought fruit crops out of dormancy
more than a month ahead of normal. In April and May, a series of freeze events resulted in cold damage, with tart cherry and apple yields being reduced by 90 and 88%, when compared to the previous annual yield (Yu et al. 2014; USDA NASS, 2013). In 2012 and 2007 in the Northeast; 2002 in Michigan, similar events severely impacted apple, grape, cherry, and other fruit crops (Yu et al. 2014; Halloran 2012; Gu et al. 2008). Changes in midwinter freeze-thaw patterns in more temperate
Projected Mid-Century Temperature Changes
Figure 6. Projected increase in annual average temperatures (top left) by mid-century (2041-2070) as compared to the 1971-2000 period tell only part of the climate change story. Maps also show annual projected increases in the number of hottest days (days over 95°F, top right), longer frost-free seasons (bottom left), and an increase in cooling degree days (bottom right), defined as the number of degrees that a day’s average temperature is above 65°F, which generally leads to an increase in energy use for air conditioning. Projections are from Global Climate Models that assume emissions of heat-trapping gases continue to rise (A2 scenario) (Figure Source: NOAA NCDC/
CICS-NC).

7
portions of the region have also impacted fruit crops. For example, midwinter-freeze damage cost New York Finger Lakes wine grape growers millions of dollars in losses in the winters of 2003 and 2004 (Levin 2005). This damage was attributed to de-hardening of the vines during an unusually warm December, which increased suscepti-bility to cold damage prior to a subsequent hard freeze. Future crop yields will likely be affected more by anoma-lous weather events such as these, rather than changes in annual precipitation and annual average temperature alone (See NCA Ch. 8: Agriculture). Springtime cold air outbreaks (i.e. at least two consecutive days during which the daily average surface air temperature is below 95% of the simulated average wintertime surface air temperature) are projected to continue to occur throughout this century (Vavrus et al. 2006).
Impacts attributable to a warming climate will not be restricted to fruit and specialty crops. For corn, small long-term average temperature increases will shorten the duration of reproductive development, leading to yield
declines, even when offset by increases of carbon dioxide (CO2) stimulation that will likely occur in a warmer climate (Hatfield et al. 2011; Leakey 2009). For soybeans, yields have a two in three chance of increasing early in the near future due to increased CO2 stimulation, but yields will likely decline towards the end of the century due to in-creased heat stress due to the increased number of days with temperatures above 95 and 100°F likely to increase (Figure 6). Though impacts in the Great Lakes, due to these factors, will likely be less severe than more southerly located field cropping regions (ex. Missouri or southern Illi-nois). Parts of the Great Lakes region (not shown in Figure 5) are expected to have changes similar to those shown in the northern portions of the figure.
In addition to changing temperatures, changing precipitation regimes could also significantly impact agriculture in the Great Lakes region. In the future the average number of days without precipitation is predicted to increase. This could lead to more frequent occurrences of agricultural drought and suppressed crop yields (Niyogi and Mishra 2013).
Forest and Land Cover Composition
The composition of forests in the Great Lakes is changing as the climate warms. Many tree species are shifting northward, with more southerly varieties replacing them. Many iconic north wood species
will lose their advantage and be slowly replaced over the next century.
The Great Lakes region consists of a wide variety of land covers and ecosystems. These include developed, managed, and natural ecosystems. Natural ecosystems, including prairies, forests, streams, and wetlands, are often fragmented by urban and agricultural areas. These areas are often rich with varied species of wildlife. The combined effects of climate change, land-use change, and increasing numbers of invasive species are the primary threats to natural eco-systems in the Great Lakes region. Species that are most vulnerable are those that: occur in isolated habitats; live near their physiological tolerance limits; have specif-ic habitat requirements, low reproductive rates, or limited dispersal capability; are de-pendent on interactions with specific other species and/or have low genetic variability (Brook et al. 2008).
The habitat range of many iconic tree species such
as paper birch, quaking aspen, balsam fir, and black spruce are projected to decline substantially across their current ranges as they shift northward as the climate warms (Figure 7). In the northern stretches of the re
Figure 7. As climate changes, species can often adapt by changing their ranges. Maps show current and projected future distribution of habitats for forest types in the Midwest under two emissions scenarios, a lower scenario that assumes reductions in heat-trapping gas emissions (b1), and a very high scenario that assumes contin-
ued increases in emissions (A1F1). (Figure Source: Prasad et al. 2007).
Shifts in Midwest Forest Composition

8
gion, species such as white/red/jack pine and spruce are predicted to exit the region entirely. There is considerable variability in the likelihood of a species’ habitat changing and the adaptability of the species with regard to climate change.
Presently, global forests capture and store more carbon than they emit, and with climate change the ability of forests to act as large, global carbon absorbers (“sinks”) may be reduced by increases in tree mortality and car-bon emission, forest fires, and drought (Pan et al. 2011; Allen et al. 2010; Bradley et al. 2010; Liu et al. 2010). Some regions may shift from being a carbon sink to a carbon source, though large uncer-tainties exist, such as whether project-ed disturbances to forests will be chronic or episodic (Vanderwel et al. 2013; USFS 2012; Birdsey et al. 2006). Forests in the Great Lakes region (and more so in the southern Midwest and Southeast) are
more resilient to forest carbon losses than most western forests because of relatively high moisture availability, greater nitrogen deposition, and lower wildfire risk (Figure 8) (Williams et al. 2012; Birdsey et al. 2006).
Figure 8. Relative vulnerability of different forest regions to climate change is illustrated in this conceptual risk analysis diagram. Forest carbon exchange is the difference between carbon captured in photosynthesis and carbon released by respiration of vegetation and soils. Both photosynthesis and respiration are generally accelerated by higher temperatures, and slowed by water deficits, but the relative strengths of these controls are highly variable. Western forests are inherently limited by evaporation that exceeds precipitation during much of the growing season. Xeric (drier) eastern forests grow on shallow, coarse textured soils and experience water deficits during long periods without rain. Mesic (wetter) eastern forests experience severe water deficits only for relatively brief periods in abnormally dry years so the carbon exchanges are more controlled by temperature fluctuations (Figure source: NCA Ch. 8.: Forestry; adapted
from Vose et al. 2012).
Carbon Exchange Matrix
Public Health Risks
Increased heat wave intensity and frequency, increased humidity, degraded air quality, reduced water quality, and change in vector borne disease patterns will increase public health risks.
The frequency of major heat waves in the Great Lakes region has increased over the past several decades. For the U.S., mortality increases 4% during heat waves when compared with non-heat days (Anderson and Bell 2011). During July 2011, 132 million people across the U.S. were under a heat alert. Heat stress is projected to increase as a result of increased summer temperatures and humidity, with events like July 2011 becoming more likely to occur (Schoof 2013; Rogers et al. 2009). One study focusing on Chicago projected an increase of between 166 and 2,217 excess deaths per year from heat wave-related mortality
by 2081-2100 (Peng et al. 2011). The lower number assumes a climate scenario with significant reductions in emission of greenhouse gases (B1), while the upper number assumes a scenario under which emissions con-tinue to increase (A2). These projections are significant when compared to recent Chicago heat waves, where 114 people died from the heat wave of 1999 and about 700 died from the heat waves of 1995 (Palecki et al. 2001). Heat wave response plans and warning systems have the potential to save lives by reducing heat-relat-ed stress in vulnerable populations; this is particularly

9
pertinent to cities in Great Lakes region with older/aging infrastructure. Heat waves are not just a threat to popula-tions living in urban centers, populations living in northern portions of the region may not have access to air condi-tioning and their vulnerability to heat stress may increase as the climate warms.
Poor air quality, particularly in urban areas, that fails to meet national standards is an ongoing concern across the Great Lakes region. Impacts on human health due to degraded air quality will likely be amplified in a warming climate. This will be attributable to both human-induced emissions and increased pollen exposure, due to a longer pollen season duration (See NCA Ch. 9: Human Health; Ziska et al. 2011; Jacob and Winner 2009; Hollo-way et al. 2008).
Increases in precipitation and flooding events can increase the risks for water transmitted dis-eases and degraded water quality. Heavy rain events and increased flooding have increased the number of combined sewer overflow events (Patz et al. 2008). These events can affect the water quality and spread diseases to populations who come into contact with the lakes and other water sources. Possible harmful exposures due to sewer overflows include: bacteria (i.e. E. Coli), viruses, protozoa (i.e. Giardia, Cryptosporidium), trash, organic compounds, heavy metals, oil, and toxic pollutants (US EPA 2001). Flooding can also result in water intrusion into building, which can result in mold contamination that manifests later, leading to indoor air quality problems (See NCA Ch. 9: Human Health).
Changes in temperature and precipitation can also change known risks for vector borne dieases
(Ashley and Meentemeyer 2004). The Great Lakes currently exhibits risks from several vector born sources. Two of these in particular are Lyme Disease and the West Nile Virus, the risks of which are largely determined by the amount of favorable habitat for ticks and mosquitoes to survive off of their hosts. Factors that may increase the risks for these two diseases in the Great Lakes include: a lengthened trans-mission season due to earlier onset of higher temperatures in spring and later onset of cold/frost in the fall, a larger tick population due to milder winters and potentially larger ro-dent host populations, and changes in human behavior (i.e. spending more time outdoors in milder weather) (See NCA Ch. 9: Human Health). Whether climate change in the Great Lakes will ultimately increase the chances of exposure to vector borne diseases is uncertain in human terms, since vector-control efforts and lifestyle factors can significantly alter human-carrier contact.
Fossil Fuel Dependent Electricity System
The Great Lakes region has a highly energy-intensive economy with per capita emissions of greenhouse gases more than 20% higher than the national average. The region also has a large and
increasingly utilized potential to reduce emissions that cause climate change.
A majority of the Great Lakes region and its population falls in the Midwest region traditionally outlined in the NCA. Midwest energy use per dollar of GDP is approximately 20% above the national average, and per capita green-house gas emissions are 22% higher than the national av-erage due, in part, to the reliance on fossil fuels, particular-ly coal for energy generation (Pryor and Barthelmie 2013). The demand for heating in cities in the region is often five to seven times that for cooling, although this is expected to shift as a result of longer summers, more frequent heat waves, and higher humidity, leading to an increase in the number of cooling degree days. A large amount of invest-ment will be required to increase the energy generating capacity to deal with the increased demand for cooling. Also a large amount of the electrical generating infrastruc-
ture in the region is susceptible to decreased efficiency due to higher temperatures and decreased frequency of days with precipitation (Gotham et al. 2013). Energy production in the Great Lakes is heavily reliant on coal-based generation (Pryor and Barthelmie 2013). Increased use of natural gas in the region has the potential to reduce the emission of greenhouse gases. The region also has the potential to produce low- or zero-car-bon emission energy sources; these could include a mix of wind, solar, and biomass resources. Expanded nucle-ar energy production is also a consideration. Increasing resiliency and grid security for current and future energy systems in light of a changing climate is essential from a socioeconomic standpoint (See NCA Ch. 4 Energy Supply and Use).

10
Increased Risks to the Great Lakes
Climate change will exacerbate a range of risks to the Great Lakes, including changes in the range and distribution of certain fish species, increased invasive species and harmful blooms of algae, and
declining beach health. Ice cover declines will lengthen the commercial navigation season.
The Great Lakes have recently recorded higher water temperatures and less ice cover as a result of changes in regional climate (see also NCA Ch. 2: Our Changing Climate, Key Message 11). Summer surface water tem-perature in Lakes Huron increased 5.2°F and in Lake Ontario, 2.7°F, between 1968 and 2002, with smaller increases Lake Erie (Lofgren and Gronewald 2012; Do-biesz and Lester 2009). Due to the reduction in ice cover, the temperature of surface waters in Lake Superior during the summer increased 4.5°, twice the rate of increase in air temperature (Austin and Colman 2007). These lake surface temperatures are projected to rise by as much as 7°F by 2050 and 12.1°F by 2100 (Mackey 2012; Trumpickas et al. 2009). Higher temperatures, increases in precipitation, and lengthened growing seasons favor production of blue-green and toxic algae that can harm fish, water quality, habitats, and aesthetics, and could heighten the impact of invasive species already present (Mackey 2012; Reutter et al. 2011; Ficke et al. 2007).
In the Great Lakes, the average annual maximum ice coverage during 2003-2012 was 40% compared to the 1962-2013 average of 52%, lower than any other decade during the period of measurements (Figure 9), although there is substan-tial variability from year to year. During the 1970’s, which included several extremely cold winters, maximum ice coverage averaged 67%. Less ice, coupled with more frequent and intense storms (as indicated by some analyses of historical wind speeds), leaves shores vulnerable to erosion and flooding and could harm property and fish habitat (Mackey 2012; Ferris 2009; Wuebbles et al. 2010). Reduced ice cover also has the potential to lengthen the shipping season (Millerd 2011). The navigation season increased by an average of eight days between 1994 and 2011, and the Welland Canal in the St. Law-rence River remained open nearly two weeks longer. Increased shipping days benefit commerce but could also increase shore-line scouring and bring in more invasive species (Millerd 2011; Hellmann et al. 2008).
Changes in lake levels can also influence the amount of cargo that can be carried on ships. On average, a 1,000-foot ship sinks into the water by one inch per 270 tons of cargo; thus if a ship is currently limited by water depth, any lowering of lake levels will result in a propor-tional reduction in the amount of cargo that it can transport to Great Lakes ports. However, current estimates of lake level changes are uncertain, even for continued increas-es in global greenhouse gas emissions (A2 scenario). The most recent projections suggest a slight decrease or even a small rise in levels (IUGLSB 2012). Recent studies have also indicated that earlier approaches to computing evapotranspiration estimates from temperature may have overestimated evaporation losses (IUGLSB 2012; MacKay and Seglenieks 2012; Angel and Kunkel 2010; Hayhoe et al. 2010). The recent studies, along with the large spread in existing modeling results, indicate that projections of Great Lakes water levels represent evolving research and are still subject to considerable uncertainty (See NCA Cli-mate Science Appendix, Supplemental Message 8).
Figure 9. Bars show decade averages of annual maximum ice coverage from the winter of 1962-1963, when reliable coverage of the entire Great lakes began, to the winter of 2012-2013. Bar labels indicate the end year of the winter; for example, 1963-1972 indicates the winter of 1962-1963 through the winter of 1971-1972. The most recent period includes the eleven years from 2003-2012. (Data updated from Bai and Wang 2012).
Ice Cover in the Great Lakes
11
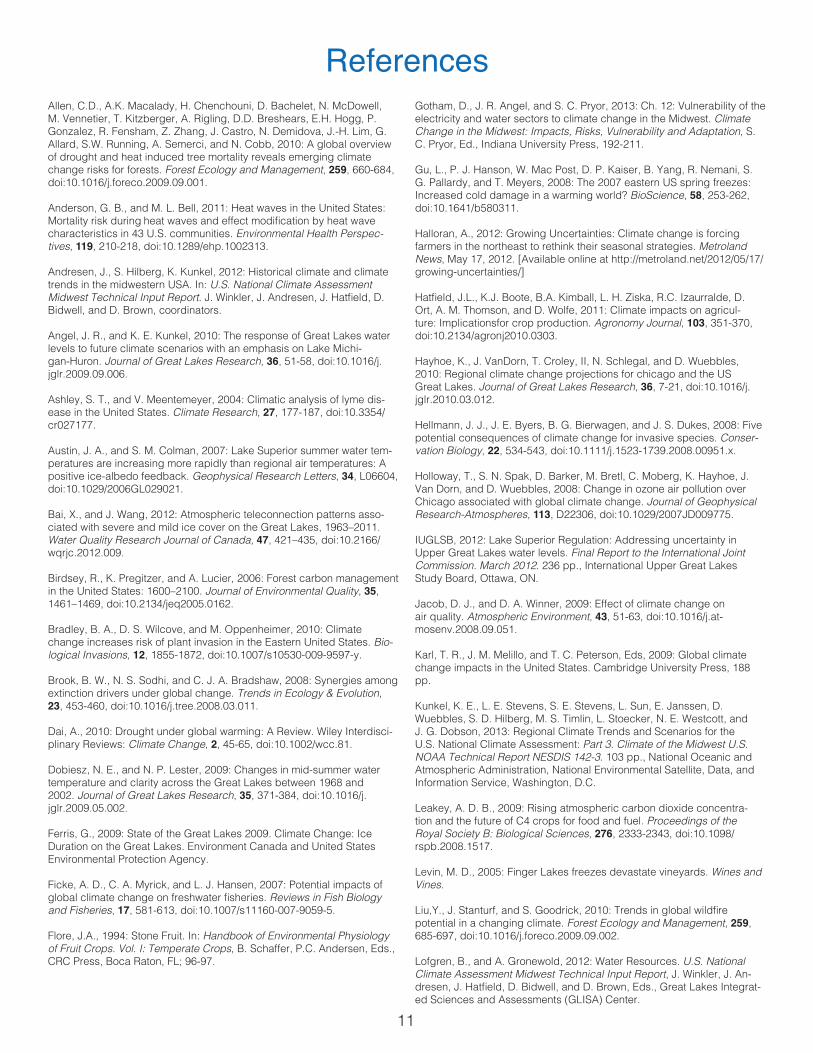
ReferencesAllen, C.D., A.K. Macalady, H. Chenchouni, D. Bachelet, N. McDowell, M. Vennetier, T. Kitzberger, A. Rigling, D.D. Breshears, E.H. Hogg, P. Gonzalez, R. Fensham, Z. Zhang, J. Castro, N. Demidova, J.-H. Lim, G. Allard, S.W. Running, A. Semerci, and N. Cobb, 2010: A global overview of drought and heat induced tree mortality reveals emerging climate change risks for forests. Forest Ecology and Management, 259, 660-684, doi:10.1016/j.foreco.2009.09.001.
Anderson, G. B., and M. L. Bell, 2011: Heat waves in the United States: Mortality risk during heat waves and effect modification by heat wave characteristics in 43 U.S. communities. Environmental Health Perspec-tives, 119, 210-218, doi:10.1289/ehp.1002313.
Andresen, J., S. Hilberg, K. Kunkel, 2012: Historical climate and climate trends in the midwestern USA. In: U.S. National Climate Assessment Midwest Technical Input Report. J. Winkler, J. Andresen, J. Hatfield, D. Bidwell, and D. Brown, coordinators.
Angel, J. R., and K. E. Kunkel, 2010: The response of Great Lakes water levels to future climate scenarios with an emphasis on Lake Michi-gan-Huron. Journal of Great Lakes Research, 36, 51-58, doi:10.1016/j.jglr.2009.09.006.
Ashley, S. T., and V. Meentemeyer, 2004: Climatic analysis of lyme dis-ease in the United States. Climate Research, 27, 177-187, doi:10.3354/cr027177.
Austin, J. A., and S. M. Colman, 2007: Lake Superior summer water tem-peratures are increasing more rapidly than regional air temperatures: A positive ice-albedo feedback. Geophysical Research Letters, 34, L06604, doi:10.1029/2006GL029021.
Bai, X., and J. Wang, 2012: Atmospheric teleconnection patterns asso-ciated with severe and mild ice cover on the Great Lakes, 1963–2011. Water Quality Research Journal of Canada, 47, 421–435, doi:10.2166/wqrjc.2012.009.
Birdsey, R., K. Pregitzer, and A. Lucier, 2006: Forest carbon management in the United States: 1600–2100. Journal of Environmental Quality, 35, 1461–1469, doi:10.2134/jeq2005.0162.
Bradley, B. A., D. S. Wilcove, and M. Oppenheimer, 2010: Climate change increases risk of plant invasion in the Eastern United States. Bio-logical Invasions, 12, 1855-1872, doi:10.1007/s10530-009-9597-y.
Brook, B. W., N. S. Sodhi, and C. J. A. Bradshaw, 2008: Synergies among extinction drivers under global change. Trends in Ecology & Evolution, 23, 453-460, doi:10.1016/j.tree.2008.03.011.
Dai, A., 2010: Drought under global warming: A Review. Wiley Interdisci-plinary Reviews: Climate Change, 2, 45-65, doi:10.1002/wcc.81.
Dobiesz, N. E., and N. P. Lester, 2009: Changes in mid-summer water temperature and clarity across the Great Lakes between 1968 and 2002. Journal of Great Lakes Research, 35, 371-384, doi:10.1016/j.jglr.2009.05.002.
Ferris, G., 2009: State of the Great Lakes 2009. Climate Change: Ice Duration on the Great Lakes. Environment Canada and United States Environmental Protection Agency.
Ficke, A. D., C. A. Myrick, and L. J. Hansen, 2007: Potential impacts of global climate change on freshwater fisheries. Reviews in Fish Biology and Fisheries, 17, 581-613, doi:10.1007/s11160-007-9059-5.
Flore, J.A., 1994: Stone Fruit. In: Handbook of Environmental Physiology of Fruit Crops. Vol. I: Temperate Crops, B. Schaffer, P.C. Andersen, Eds., CRC Press, Boca Raton, FL; 96-97.
Gotham, D., J. R. Angel, and S. C. Pryor, 2013: Ch. 12: Vulnerability of the electricity and water sectors to climate change in the Midwest. Climate Change in the Midwest: Impacts, Risks, Vulnerability and Adaptation, S. C. Pryor, Ed., Indiana University Press, 192-211.
Gu, L., P. J. Hanson, W. Mac Post, D. P. Kaiser, B. Yang, R. Nemani, S. G. Pallardy, and T. Meyers, 2008: The 2007 eastern US spring freezes: Increased cold damage in a warming world? BioScience, 58, 253-262, doi:10.1641/b580311.
Halloran, A., 2012: Growing Uncertainties: Climate change is forcing farmers in the northeast to rethink their seasonal strategies. Metroland News, May 17, 2012. [Available online at http://metroland.net/2012/05/17/growing-uncertainties/]
Hatfield, J.L., K.J. Boote, B.A. Kimball, L. H. Ziska, R.C. Izaurralde, D. Ort, A. M. Thomson, and D. Wolfe, 2011: Climate impacts on agricul-ture: Implicationsfor crop production. Agronomy Journal, 103, 351-370, doi:10.2134/agronj2010.0303.
Hayhoe, K., J. VanDorn, T. Croley, II, N. Schlegal, and D. Wuebbles, 2010: Regional climate change projections for chicago and the US Great Lakes. Journal of Great Lakes Research, 36, 7-21, doi:10.1016/j.jglr.2010.03.012.
Hellmann, J. J., J. E. Byers, B. G. Bierwagen, and J. S. Dukes, 2008: Five potential consequences of climate change for invasive species. Conser-vation Biology, 22, 534-543, doi:10.1111/j.1523-1739.2008.00951.x.
Holloway, T., S. N. Spak, D. Barker, M. Bretl, C. Moberg, K. Hayhoe, J. Van Dorn, and D. Wuebbles, 2008: Change in ozone air pollution over Chicago associated with global climate change. Journal of Geophysical Research-Atmospheres, 113, D22306, doi:10.1029/2007JD009775.
IUGLSB, 2012: Lake Superior Regulation: Addressing uncertainty in Upper Great Lakes water levels. Final Report to the International Joint Commission. March 2012. 236 pp., International Upper Great Lakes Study Board, Ottawa, ON.
Jacob, D. J., and D. A. Winner, 2009: Effect of climate change on air quality. Atmospheric Environment, 43, 51-63, doi:10.1016/j.at-mosenv.2008.09.051.
Karl, T. R., J. M. Melillo, and T. C. Peterson, Eds, 2009: Global climate change impacts in the United States. Cambridge University Press, 188 pp.
Kunkel, K. E., L. E. Stevens, S. E. Stevens, L. Sun, E. Janssen, D. Wuebbles, S. D. Hilberg, M. S. Timlin, L. Stoecker, N. E. Westcott, and J. G. Dobson, 2013: Regional Climate Trends and Scenarios for the U.S. National Climate Assessment: Part 3. Climate of the Midwest U.S. NOAA Technical Report NESDIS 142-3. 103 pp., National Oceanic and Atmospheric Administration, National Environmental Satellite, Data, and Information Service, Washington, D.C.
Leakey, A. D. B., 2009: Rising atmospheric carbon dioxide concentra-tion and the future of C4 crops for food and fuel. Proceedings of the Royal Society B: Biological Sciences, 276, 2333-2343, doi:10.1098/rspb.2008.1517.
Levin, M. D., 2005: Finger Lakes freezes devastate vineyards. Wines and Vines.
Liu,Y., J. Stanturf, and S. Goodrick, 2010: Trends in global wildfire potential in a changing climate. Forest Ecology and Management, 259, 685-697, doi:10.1016/j.foreco.2009.09.002.
Lofgren, B., and A. Gronewold, 2012: Water Resources. U.S. National Climate Assessment Midwest Technical Input Report, J. Winkler, J. An-dresen, J. Hatfield, D. Bidwell, and D. Brown, Eds., Great Lakes Integrat-ed Sciences and Assessments (GLISA) Center.

12
MacKay, M., and F. Seglenieks, 2012: On the simulation of Laurentian Great Lakes water levels under projections of global climate change. Climatic Change, 117, 55-67, doi:10.1007/s10584-012-0560-z.
Mackey, S., 2012: Great Lakes Nearshore and Coastal Systems. U.S. National Climate Assessment Midwest Technical Input Report, J. Winkler, J. Andresen, J. Hatfield, D. Bidwell, and D. Brown, Eds., Great Lakes Integrated Sciences and Assessments (GLISA), National Laboratory for Agriculture and the Environment, 14.
McLellan, S. L., E. J. Hollis, M. M. Depas, M. Van Dyke, J. Harris, and C. O. Scopel, 2007: Distribution and fate of Escherichia coli in Lake Michi-gan following contamination with urban stormwater and combined sewer overflows. Journal of Great Lakes Research, 33, 566-580, doi:10.3394/0380-1330(2007)33[566:DAFOEC]2.0.CO;2.
Michalak, A.M., E. Anderson, D. Beletsky, S. Boland, N.S. Bosch, T.B. Bridgeman, J.D. Chaffin, K.H. Cho, R. Confesor, I. DaloÄŸlu, J. DePinto, M.A. Evans, G.L. Fahnenstiel, L. He, J.C. Ho, L. Jenkins, T. Johengen, K.C. Kuo, E. Laporte, X. Liu, M. McWilliams, M.R. Moore, D.J. Posselt, R.P. Richards, D. Scavia, A.L. Steiner, E. Verhamme, D.M. Wright, M.A. Zagorski 2013: Record-setting algal bloom in Lake Erie caused by agricultural and meteorological trends consistent with expected future conditions. Proceedings of the National Academy of Sciences, 110, 6448-6452
Millerd, F., 2011: The potential impact of climate change on Great Lakes international shipping. Climatic Change, 104, 629-652, doi:10.1007/s10584-010-9872-z.
Mishra, V., K. A. Cherkauer, and S. Shukla, 2010: Assessment of drought due to historic climate variability and projected future climate change in the Midwestern United States. Journal of Hydrometeorology, 11, 46-68, doi:10.1175/2009JHM1156.1.
Niyogi, D. M., and V. Mishra, 2013: Ch. 5: Climate - Agriculture vulnerabil-ity assessment for the Midwestern United States. Climate Change in the Midwest: Impacts, Risks, Vulnerability, and Adaptation, S.C. Pryor, Ed., Indiana University Press, 69-81.
Palecki, M. A., S. A. Changnon, and K. E. Kunkel, 2001: The nature and impacts of the July 1999 heat wave in the Midwestern United States: Learning from the lessons of 1995. Bulletin of the American Meteorolog-ical Society, 82, 1353-1368, doi:10.1175/1520-0477(2001)082<1353:T-NAIOT>2.3.CO;2.
Pan, Y., R. A. Birdsey, J. Fang, R. Houghton, P. E. Kauppi, W. A. Kurz, O. L. Phillips, A. Shvidenko, S. L. Lewis, J. G. Canadell, P. Ciais, R. B. Jack-son, S. W. Pacala, A. D. McGuire, S. Piao, A. Rautiainen, S. Sitch, and D. Hayes, 2011: A large and persistent carbon sink in the world’s forests. Science, 333, 988-993, doi:10.1126/science.1201609.
Patz, J. A., S. J. Vavrus, C. K. Uejio, and S. L. McLellan, 2008: Climate change and waterborne disease risk in the Great Lakes region of the US. American Journal of Preventive Medicine, 35, 451-458, doi:10.1016/j.amepre.2008.08.026.
Peng, R. D., J. F. Bobb, C. Tebaldi, L. McDaniel, M. L. Bell, and F. Domi-nici, 2011: Toward a quantitative estimate of future heat wave mortality under global climate change. Environmental Health Perspectives, 119, 701-706, doi:10.1289/ehp.1002430.
Prasad, A. M., L. R. Iverson, S. Matthews, and M. Peters, cited 2007: A Climate Change Atlas for 134 Forest Tree Species of the Eastern United States [Database]. U.S. Department of Agriculture, Forest Service, North-ern Research Station. [Available online at http://www.nrs.fs.fed.us/atlas/tree]
Pryor, S. C., and R. J. Barthelmie, 2013: Ch. 2: The Midwestern United States: Socio-Economic context and physical climate. Climate Change in the Midwest: Impacts, Risks, Vulnerability and Adaptation, S. C. Pryor, Ed., Indiana University Press, 12-47.
Pryor, S. C., K. E. Kunkel, and J. T. Schoof, 2009a: Ch. 9: Did precipita-tion regimes change during the twentieth century? Understanding Climate Change: Climate Variability, Predictability and Change in the Midwestern United States, Indiana University Press, 100-112.
Pryor, S. C., J. A. Howe, and K. E. Kunkel, 2009b: How spatially coherent andstatistically robust are temporal changes in extreme precipitation in the contiguous USA? International Journal of Climatology, 29, 31-45, doi:10.1002/joc.1696.
Rogers, J.C., S.H. Wang, and J. Coleman, 2009: Ch. 5: Long Term Mid-western USA summer equivalent temperature variability. Understanding Climate Change: Climate Variability, Predictability and Change in the Mid-western United States, S.C. Pryor, Ed., Indiana University Press, 55-65.
Scavia, D., J. D. Allan, K. K. Arend, S. Bartell, D. Beletsky, N. S. Bosch, S. B. Brandt, R. D. Briland, I. Daloğlu, J. V. DePinto, D. M. Dolan, M. A. Evans, T. M. Farmer,D. Goto, H. Han, T. O. Höök, R. Knight, S. A. Ludsin, D. Mason, A. M. Michalak, R. P. Richards, J. J. Roberts, D. K. Rucinski, E. Rutherford, D. J. Schwab, T. Sesterhenn, H. Zhang, Y. Zhou. 2014 As-sessing and addressing the re-eutrophication of Lake Erie: Central Basin Hypoxia. Journal of Great Lakes Research, 40, 226–246. http://dx.doi.org/10.1016/j.jglr.2014.02.004
Schoof, J. T., 2013: Ch. 11: Historical and projected changes in human heat stress in the Midwestern United States. Climate Change in the Midwest: Impacts, Risks, Vulnerability and Adaptation, S. C. Pryor, Ed., Indiana University Press, 146-157.
Schoof, J. T., S. C. Pryor, and J. Suprenant, 2010: Development of daily precipitation projections for the United States based on probabilistic downscaling. Journal of Geophysical Research, 115, 1-13, doi:10.1029/2009JD013030.
Schoof, J. T., 2009: Ch. 4: Historical and projected changes in the length of the frost-free season. Understanding Climate Change: Climate Vari-ability, Predictability and Change in the Midwestern United States, S. C. Pryor, Ed., Indiana University Press, 42-54.
Trumpickas, J., B. J. Shuter, and C. K. Minns, 2009: Forecasting impacts of climate change on Great Lakes surface water temperatures. Journal of Great Lakes Research, 35, 454-463, doi:10.1016/j.jglr.2009.04.005.
U.S. Environmental Protection Agency (2001). Report to Congress: Im-plementation and Enforcement of the CSO Control Policy. EPA 833-R-01-003, U.S. Environmental Protection Agency, Washington, DC.
USDA NASS, 2013: Crop Values 2012 Summary. U.S. Department of Agri-culture National Agricultural Statistics Service, Washington D.C.
USFS, 2012: Future of America’s Forest and Rangelands: 2010 Resourc-es Planning Act Assessment. General Technical Report WO-87. 198 pp., U.S. Department of Agriculture, U.S. Forest Service, Washington, D.C.
Vanderwel, M. C., D. A. Coomes, and D. W. Purves, 2013: Quantifying variation in forest disturbance, and its effects on above ground biomass dynamics, across the Eastern United States. Global Change Biology, 19, 1504-1517, doi:10.1111/gcb.12152.
Vavrus, S., J. E. Walsh, W. L. Chapman, and D. Portis, 2006: The behavior of extreme cold air outbreaks under greenhouse warming. International Journal of Climatology, 26, 1133-1147, doi:10.1002/joc.1301.
Vose, J. M., D. L. Peterson, and T. Patel-Weynand, Eds., 2012: Effects of Climatic Variability and Change on Forest Ecosystems: A Comprehensive Science Synthesis for the U.S. Forest Sector. General Technical Report PNW-GTR-870. U.S. Department of Agriculture, Forest Service, Pacific Northwest Research Station, 265 pp.
Williams, C. A., G. J. Collatz, J. Masek, and S. N. Goward, 2012: Carbon consequences of forest disturbance and recovery across the conter-minous United States. Global Biogeochemical Cycles, 26, GB1005, doi:10.1029/2010gb003947.

13
Wuebbles, D. J., K. Hayhoe, and J. Parzen, 2010: Introduction: Assessing the effects of climate change on Chicago and the Great Lakes. Journal of Great Lakes Research, 36, 1-6, doi:10.1016/j.jglr.2009.09.009.
Yu, L., S. Zhong, X. Bian, W. E. Heilman, and J. A. Andresen, 2014: Temporal and spatial variability of frost-free seasons in the Great Lakes region of the United States. International Journal of Climatology, In Press, doi: 10.1002/joc.3923
Ziska, L., K. Knowlton, C. Rogers, D. Dalan, N. Tierney, M. A. Elder, W. Filley, J. Shropshire, L. B. Ford, C. Hedberg, P. Fleetwood, K. T. Hovanky, T. Kavanaugh, G. Fulford, R. F. Vrtis, J. A. Patz, J. Portnoy, F. Coates, L. Bielory, and D. Frenz, 2011: Recent warming by latitude associated with increased length of ragweed pollen season in Central North America. Proceedings of the National Academy of Sciences, 108, 4248-4251, doi:10.1073/pnas.1014107108.