Embed Size (px)
Citation preview

RESTRICTED - POLICY
1
Synthesis of research related to August 2011 disorder
Summary 1. The most common crime types committed in the disorder were acquisitive. However,
the nature of crimes committed varied across forces suggesting that it was not one type of riot and that different things happened in different places.
2. Commercial premises were the most common target, most commonly clothing and electrical goods stores.
3. The majority of those who were caught for taking part were aged under 25, male and from deprived circumstances. There were, however, some individuals from affluent backgrounds, in employment or students who took part. Moreover, many people in deprived circumstances did not join in.
4. Many of those caught had some form of criminal history or involvement with the police.
5. The overall proportion of those arrested who were affiliated to a gang was 13%. This varied by area and day, for example 19 per cent of those arrested in London were identified as gang members, compared to less than 10 per cent in the majority of other forces. At a more local level, 39 per cent of people arrested for offences committed in Lambeth on the second night and 31 per cent of those arrested for offences committed in Enfield on the second night were gang members.
6. There is some evidence that gang members behaved atypically for the duration of the disorder, e.g. temporary suspension of rivalries in some areas.
7. The reasons why people took part varied and included: the initial trigger event (protesting at the police fatal shooting); anger at perceived unjustness of the police and society more generally; opportunity to get ‘free stuff’; and a sense of excitement / thrill-seeking. We do not have evidence to quantify which of these were most prevalent
8. The importance of perceived unjustness of the police may have been overstated by some individuals who took part as they rationalised / justified their behaviour post-event. However, it should not be discounted altogether as wider evidence supports the view that race-related tensions and perceiving that the police do not treat people fairly are associated with disorder events.
9. Transport links; widespread media images of the police appearing to stand by; peer group encouragement; having little else to do (e.g. school holidays); and the ease of communications with Blackberry Messenger all facilitated getting involved.
10. People were dissuaded from taking part (despite temptation) because they felt they had something to lose (e.g. job, apprenticeship); were aware of a strong attitude amongst friends and family against criminal activity; were influenced by a positive role model (e.g. youth worker); or were on license and felt there was a high risk of being caught.
11. The police were initially too slow to respond which encouraged others to take part as they perceived opportunities to get away with such behaviour (those taking part did not think they would be caught).
12. Some of the main difficulties with the police response included mobilising sufficient resources; equipment shortages; problems with public order training; and officers being unsure about the level of force they could use.
13. The perceived increase in police strength as well as rumours of more forceful tactics being used ultimately brought the disorder to an end.
14. Results from public opinion polls suggest that in general the public think the police handled the disorder well, but that they could have initially dealt with the problem more quickly. There was also high support from the public to allow the police to use more forceful tactics.
15. The response to resolving claims under the Riot Damages Act was criticised for being too slow, with part of the responsibility seen to lie with the Home Office.
16. More widely, the investigation and criminal justice response to the disorder has been

RESTRICTED - POLICY
2
considered a success, with special arrangements being used to bring about swift and efficient justice to those involved in the riots. Moreover, whilst within the guidelines, the sentences awarded to those convicted are substantially longer than those given for similar offences in 2010. It is too early to tell what effect this will have on re-offending, however we expect it will act as a future deterrent (and interviews with those who took part also suggest that some have experienced regret and would not
take part in similar activity again). The public have generally been supportive of these tougher sentences.
17. It is very difficult to predict how likely it is that further riots will occur in the near future. There are clear risk factors, e.g. youth unemployment is rising, economic growth is expected to be very limited over the next few years, perceptions of inequality are getting larger and public service cuts will deepen. We can also expect that there will be future “trigger events” which could lead to disorder. What will be critical to minimising the risk of widespread disorder is the initial police handling of any “trigger event”.
18. The findings have implications for a range of government departments and agencies as well as service providers at a more local level. Just a couple of the key implications for the Home Office are: 1) ensuring the police have access to and use appropriate tactics in handling any future public disorder as a stronger police presence should have a deterrent effect on opportunists; and 2) better monitoring and prediction of future disorder.

RESTRICTED - POLICY
3
Synthesis of research related to August 2011 disorder Introduction In early August 2011, a number of English cities witnessed scenes of rioting, looting and disorderly conduct on the largest scale seen for nearly 30 years. Since then, a range of reports and analyses have been published by central government, academics, independent panels and some of the emergency services to provide evidence on what happened and why. The purpose of this paper is to synthesise these reports, assessing their strength and forming a single evidence-based narrative on:
• What happened and where the disorder took place;
• The characteristics of those involved;
• The reasons and motivations for why people took part;
• The police response;
• Public perceptions of the riots;
• The risk of something happening again; and
• The policy implications for the Home Office. Annex A to this paper details the papers reviewed as part of this synthesis including an assessment of their reliability.
What happened and where The Home Office analysis of police force recorded crime data (published in October 2011)1 provides the most comprehensive evidence on what happened in the August 2011 disorder. This section sets out the main findings from this analysis as well as relevant evidence from the London Fire and Emergency Planning Authority; police service reports; the British Retail Consortium; and applications made for compensation under the Riots Recovery Act. Figure 1 shows the number of disorder-related crimes recorded in each police force area between the 6th and 10th August. The first outbreaks of disorder occurred in Tottenham on Saturday 6th August 2011. Unrest became more widespread in the following days, initially spreading across other areas of London on Sunday 7th August. On Monday 8th August, the disorder spread further across London as well as to other urban areas (particularly Birmingham, Bristol and Liverpool). Across London, 2,460 calls were received by the Fire Service between 9am on Monday 8th August and 9am on Tuesday 10th August – nearly three times the average.2 On the afternoon and evening of Tuesday 9th August, a surge in the numbers of police in London reduced the disorder but it continued in areas outside London (particularly Manchester). By Wednesday 10th August most of the disorder had dissipated, although isolated incidents continued.
1 Home Office (2011) An overview of recorded crimes and arrest resulting from disorder events in August 2011 http://www.homeoffice.gov.uk/publications/science-research-statistics/research-statistics/crime-research/overview-disorder-aug2011/ 2 London Fire and Emergency Planning Authority (2011) Civil Disturbances in London August 2011. Available from www.london-fire.gov.uk

RESTRICTED - POLICY
4
Figure 1: Disorder-related recorded crimes by type of crime, by police force area
Notes: 1. As precise times are not available for all recorded crimes, in a small number of cases this may have
resulted in the incorrect allocation of recorded crimes to the date on which they occurred.
By the time the disorder was quelled, ten police forces most affected by the disorder had recorded 5,112 crimes (with the Metropolitan Police, Greater Manchester, and West Midlands forces most affected). The majority (68%) of crimes occurred in London, with 31 London boroughs experiencing some disorder. The only London boroughs not to experience disorder were Richmond-upon-Thames and the City of London (Figure 2). Figure 2: Map of disorder related crimes recorded across London boroughs
Although the disorder events involved a very high level of visible criminality in some localised areas, the overall impact on national recorded crime figures was small. Figure 3 shows the

RESTRICTED - POLICY
5
total number of crimes recorded in August 2011 in the fifteen local authorities experiencing the highest volumes of disorder-related crimes, together with the number and percentage of crimes reported to be directly associated with the disorder. Across England and Wales, disorder-related crimes made up 1.5 per cent of the total number of crimes recorded for August. However, in both Croydon and Haringey 14% of the total crimes recorded in August were reported to be directly associated with the disorder.3 Figure 3: Total and disorder-related crimes in August 2012
Local authority Total crimes recorded
in August 2011
Total crimes recorded
related to the disorder
% of crimes recorded
that were related to the
disorder
Croydon 3,004 430 14
Manchester 4,863 386 8
Birmingham 7,146 363 5
Southwark 2,901 314 11
Haringey 2,222 303 14
Ealing 2,931 279 10
Lewisham 2,440 213 9
Lambeth 3,084 209 7
Salford 1,798 188 10
Enfield 2,005 182 9
Hackney 2,275 172 8
Greenwich 1,996 156 8
Newham 2,713 152 6
Wandsworth 1,942 150 8
Liverpool 3,764 146 4
England & Wales1 344,937 5,112 1.5
Notes: 1. For recorded crime, this is the total number of crimes in England and Wales. For crimes recorded as part of
the special data collection exercise this is the total number of crimes reported for the ten police forces with most extensive disorder.
Figure 4 shows the crime types recorded in each police force. Across all forces, the most common crimes involved some form of acquisitive crime (burglary, robbery, and theft and handling offences) and these accounted for 50 per cent of all recorded crimes. Offences involving criminal damage (to buildings, vehicles or arson offences) accounted for 36 per cent of the total, whereas crimes of violence against the person were less common, accounting for just seven per cent of the total. The nature of crimes committed varied across areas suggesting that it was not one type of riot, and instead a series of different events in different areas. For example, in the three forces most affected by the disorder (the Met, Greater Manchester and West Midlands), acquisitive crimes were the most common crime type committed. In all other affected forces, criminal damage offences were more commonly committed. Whilst Greater Manchester and West Yorkshire experienced a greater proportion of violent crimes, the most serious were limited to London and Birmingham, where a small number of murders and attempted murders were recorded.
3 Home Office (2012) Crime in England and Wales: Quarterly update to September 2011. HOSB 01/12 http://www.homeoffice.gov.uk/publications/science-research-statistics/research-statistics/crime-research/hosb0112/hosb0112?view=Binary

RESTRICTED - POLICY
6
Figure 4: Disorder-related recorded crimes by type of crime, by police force area
Notes: 1. ‘Acquisitive’ offences include burglary, theft, handling stolen goods and robbery. 2. ‘Criminal damage’ offences include criminal damage and arson. 3. ‘Disorder’ offences include violent disorder and public order offences. 4. ‘Violence against the person’ offences include murder, wounding, grievous bodily harm, assault and
possession of weapons. 5. ‘Other’ offences include drugs offences, driving offences and a range of other miscellaneous offences.
Commercial premises were most commonly targeted (2,584 crimes were committed against commercial premises which was 51% of all crimes recorded). A further 19 per cent were committed against vehicles (993 crimes), 13 per cent against individuals (664 crimes,
typically robbery or assaults) and six per cent against the police (330 crimes). At least 231 crimes against domestic properties were recorded (5% of all crimes). Over 300 officers were injured across all forces. Of the commercial premises targeted, just over six in ten (61%) were retailers (most commonly clothing and electrical goods stores); 13 per cent were restaurants, cafes or public houses; and a further 11 per cent were classified as ‘other business premises’. The costs of the riots were extensive. The British Retail Consortium has estimated that the disorder cost retailers who took part in a survey £18.3 million and affected approximately 6.9 per cent of retail outlets. However, this is likely to be an underestimate of the costs as not all affected retailers took part in the survey designed to measure this (only 53% did so).4 According to data held by the Home Office, around 5,500 claims had been made under the Riots Damages Act (RDA), of which ten per cent were from individuals and businesses without insurance. By the 28th March 2012, approximately 1,100 claims totalling £5.6 million had been settled by police authorities from both uninsured claimants and insurance companies. Approximately 1,300 claims are still ongoing, and nearly 2,800 claims have been rejected (mostly for business interruption and vehicle damage, some for not being within the definition of the RDA or not being from within an agreed “riot area”).5 The operational costs of the riots are estimated by police forces to have cost £85m across England and Wales.
4 British Retail Consortium (2012) Retail Crime Survey 2011 http://www.brc.org.uk/brc_show_document.asp?id=4324&moid=7614 5 Data from CPG Group Finance Unit

RESTRICTED - POLICY
7
Who was involved? Statistics on those appearing in court for offences related to the disorder and those arrested by the police provide the fullest picture of who was involved. However, there is no complete account as not everyone involved has been caught and those who were caught may be different to those who escaped arrest. We do not know how many people took part in the riots. The Riots Communities and Victims Panel estimated 13-14,000 people but they give no detail of how this was calculated and therefore it is likely to be a guess.6 Until everyone is convicted or cautioned the statistics available will also include those who are subsequently acquitted or whose cases do not progress to court. This section summarises what we know about the socio-demographic characteristics of those arrested and appearing in court for taking part in the disorder as well as their criminal history and affiliation to gangs. Socio-demographic characteristics of those involved
By 12 September 2011, approximately four weeks after the disorder, 3,960 people had been arrested across the ten forces most affected by the disorder for the part they played. Of these 3,960 people who had been arrested7:
• The vast majority were male (89% of those arrested) and under 25 years old (46% of arrestees were aged 18-24 and around one quarter were aged 10-17). The proportion of juveniles arrested varied across the forces, ranging from 23 per cent in London to 44 per cent in West Yorkshire.
• About 40 per cent described their ethnicity as White, 39 per cent as Black, 11 per cent as from a Mixed ethnic background, eight per cent as Asian and two per cent as from some other ethnic background. These proportions varied across police force areas, for example 32 per cent of arrestees in London described their ethnicity as White compared to 76 per cent of arrestees in the Greater Manchester Police force area.
• The type of crimes committed varied between men and women. Male arrestees were more likely to be arrested for disorder and violent offences whereas females were more likely to be arrested for acquisitive crimes.8
• Based on data from West Midlands Police force only, students constituted about 6%
of arrestees aged over 16.
By 1st February 2012, 2,710 people had appeared in court for their role in the disorder. This is a subset of those arrested, and their characteristics are broadly similar:
• The majority of those appearing in court were male (89%), and approximately half were aged under 20 (27% were aged 10-17; 26 per cent were aged 18-20; and only six per cent were over 40 years old)
• Compared to those appearing in court for similar offences in 2010, those who appeared in court for riot-related offences were more likely to be younger and slightly more likely to be male.
• Where ethnicity was recorded, data showed that 41 per cent identified themselves as being from a White background, 39 per cent from a Black background, 12 per cent from a Mixed ethnic background, six per cent from an Asian background, and two percent from an Other ethnic group.9
6 Independent Riots Victims and Communities Panel (2011) 5 days in August: interim report. http://www.5daysinaugust.co.uk/PDF/downloads/Interim-Report-UK-Riots.pdf 7 Note that these results are based on a snapshot of those arrested as more people have been arrested subsequently. For example, by the end of February 4,019 people had been arrested by the Met police compared to 2,467 in mid-September. 8 Home Office (2011); Op. cit. 9 MoJ (2012) Statistical bulletin on the public disorder of 6th to 9th August – February 2012 update. http://www.justice.gov.uk/downloads/statistics/criminal-justice-stats/august-public-disorder-stats-bulletin-230212.pdf
RESTRICTED - POLICY
8
Analysis of 1,984 people who had appeared in court by the 12th September 2011 for an offence relating to the disorder showed that they were more likely than the general population to come from deprived or disadvantaged backgrounds. For example:
• Thirty-five per cent of adult defendants were claiming out-of-work benefits, compared to 12 per cent of the working age population;
• Forty-two per cent of young people (aged 10-17) brought before the courts were in receipt of free school meals during their time at school, compared to 16 per cent of pupils in maintained secondary schools;
• Sixty-six per cent of young people (aged 10-17) brought before the courts had Special Educational Needs compared to 21 per cent of pupils in all schools.
• Sixty-four per cent of young people (aged 10-17) brought before the courts lived in one of the 20 most deprived areas in the country (only three per cent lived in one of the 20 least deprived areas.10
In addition, many of the local authorities affected were amongst the higher crime and/or most deprived areas in the country, although some local authorities experiencing disorder had relatively low levels of deprivation (e.g. Bromley). Conversely, many high-crime and high-deprivation areas did not experience any incidents of disorder (e.g. Blackpool, Newcastle).11 Manchester Probation Service12 has analysed more detailed data on factors influencing offending behaviour for a sub-set of 79 adult offenders convicted in Manchester for taking part in the disorder. This sample represents approximately half the population of adults who had appeared in court in Manchester (175) by 1st February 2012. The analysis shows that over half of those convicted were facing problems with the suitability and permanence of their accommodation, 83 per cent had some or significant problems with their employment history and the majority had significant issues in relation to finances. Criminal history and gang affiliation of those involved Many of those caught for taking part in the riots had some form of criminal history or involvement with the police. The great majority (88%) of those arrested by mid-September 2011 were previously known to the police in some way, either through previously being arrested, convicted or cautioned.13 Similarly, just over three-quarters (76%) of the 1,984 people appearing in court by the 12th October 2011 had a previous caution or conviction. About a quarter of these (26%) were more prolific with over ten previous offences, and the same proportion (26%) had been in prison before. In total, those brought before the courts by the 12th October 2011 had committed nearly 20,000 previous offences, at an average of 11 previous offences per individual.14 However, since the majority of arrests have been made as a result of CCTV footage, it is inevitable that many of those apprehended will already be known to the police (because the identification of offenders will to a large extent have been based upon recognition). Therefore, as more people are arrested, there is a chance that the proportion with a criminal history may reduce.15 According to police intelligence, thirteen per cent of those arrested by mid-September for taking part in the riots were affiliated to gangs. The extent of gang involvement varied across
10 Ministry of Justice (2011) Statistical bulletin on the public disorder of 6th to 9th August 2011- October update. http://www.justice.gov.uk/downloads/statistics/criminal-justice-stats/august-public-disorder-stats-bulletin-241011.pdf 11 Home Office (2011). Op. cit. 12 Clarke, B. (2012) Deconstructing the rioters: a case study of individual convicted and sentenced in Greater Manchester. Safer Communities, 11(1), 33-39. 13 Home Office (2011). Op. cit. 14 MoJ (2011). Op. cit. 15 Statistics on the criminal history of those appearing in court are currently only available for the 1,984 people
that had appeared in court for disorder-related offences by the 12th October 2011.

RESTRICTED - POLICY
9
forces; for example 19 per cent of those arrested in London were identified as gang members, whereas outside London the majority of forces identified fewer than 10 per cent of all arrestees as gang members. Only two non-London forces estimated figures in excess of this: West Yorkshire (19%) and Nottinghamshire (17%). In London, the extent of gang involvement varied according to the day and borough where disorder took place. For example, in Lambeth 39 per cent of people arrested for offences committed on the second night and in Enfield 31 per cent of those arrested on the second night were gang members.16 It should be noted that the way in which gang members were identified was not completely consistent between forces as no standard definition of gang membership was used. Force intelligence also suggests that in many areas outside London gangs did not play a pivotal role in the disorder (aside from a few examples of orchestrated gang offending and gang involvement in a serious firearms incident in the West Midlands). Interviews with those who took part suggest that some gang members who did take part behaved atypically for the duration of the disorder. For example, gang rivalries were initially temporarily suspended to allow looting of shops and confrontation with the police. This section has shown that many of those taking part in the riots had a previous criminal history and has also suggested that similar to many of the general offending population they had problems with employment and financial stability. It is important, however, to note that this was not the case for everyone, a minority of people who were involved and caught were well educated and in employment. It is therefore important to understand the reasons why people did take part; this is discussed in the next section.
The reasons and motivations for taking part The majority of the evidence on the motivations for taking part comes from the Cabinet Office17 and LSE/Guardian research18, both of which comprised interviews with individuals who were involved in the disorder.19 These studies cannot quantify which reasons were most prevalent or important, but do show that there are a variety of factors which motivated people to take part and that there was no single or consistent motive. This section summarises the motivations for why people took part (including the different ways they got involved) as well as the factors which facilitated or held people back from joining in. Motivations for taking part The research findings identify four different types of involvement: watchers; rioters; looters and those not-involved (illustrated in figure 5). An individual’s involvement was not necessarily restricted to a single type of behaviour: for example, some people were both rioters and looters; others started as watchers but got drawn into being rioters. Figure 5: Typology of involvement
Watchers: were observing but not involved Bystanders: happened to be there The curious: deliberately chose to be there
Rioters: involved in violent disturbances Protestors: had a specific set of grievances
16 Metropolitan Police Service (2012) 4 days in August: Strategic Review into the Disorder of August 2011. 17 NatCen (2011). The August riots in England: understanding the involvement of young people. http://www.natcen.ac.uk/media/769712/the%20august%20riots%20in%20england%20web.pdf 18 LSE/Guardian (2011) Reading the riots: investigating England’s summer of disorder 19 An unpublished study by the Youth Justice Board interviewed those aged under 18 who took part in the riots, however a small sample size means the findings are very limited, and do not add to the more substantive studies undertaken by Natcen and the Guardian/LSE.

RESTRICTED - POLICY
10
Retaliators: acted against police or “the system” Thrill-seekers: looking for excitement or a buzz
Looters: involved in breaking into and/or stealing from broken-into shops or handling stolen goods
Opportunists: took a rare chance to get free stuff Sellers: planned their involvement to maximise “profits”
Non-involved Wannabes: would have liked to have been involved Stay-aways: choose not to get involved
The motivations for taking part varied both across and within different types of involvement. However, there appears to be a key difference between those who were committing violent acts and those taking advantage of the opportunity to steal goods. Summarised below are four main categories of why people said they took part in the riots. 1. Protesting at the initial trigger event
As with many previous outbreaks of public disorder, the August 2011 riots were precipitated by a trigger event, in this case the fatal shooting of Mark Duggan in Tottenham by the police and the subsequent handling of this incident by the Metropolitan Police Service (MPS). The IPCC has concluded that there were failings with the liaison with the affected
family (e.g. the parents were not informed of their son’s death by either the MPS or the IPCC).20 Moreover, incorrect information about the shooting was mistakenly released to the media and as it became apparent there were shortcomings in the story, the IPCC and Met Police did not comment allowing rumours to circulate. The Met Police have agreed that this was a serious shortcoming which came about through widespread confusion about what the police can say about an investigation involving the IPCC (officers believed that there were limitations on what they could communicate publicly).21 Tensions continued to build as local communities got increasingly angry about what they interpreted as a lack of respect from the police towards Black people. In London, (particularly Tottenham), some people who took part in the riots considered the initial police handling of the fatal shooting as the main reason why they took part in the disorder. This is also consistent with the experience from previous riots in England as well as examples from overseas, i.e. that confrontations between a Black member of the community and the police have acted as a trigger to riots (e.g. Brixton riots of 1981; Broadwater Farm riot of 1985; Paris riots in 2005).22 2. Anger at society / perceived unfair treatment by the police
Other people took part because they were angry at society more generally or perceived the police were treating people unfairly. Such individuals considered their involvement as a ‘protest’ rather than a riot and were more likely to be involved in violent disturbances. A variety of evidence sources suggest that this was the case, for example:
• Analysis of recorded crimes identifies some locations where the nature of the riot was much more violent rather than opportunistic looting (e.g. Salford, Sandwell, Havering and Nottingham). For example, reports received from Nottinghamshire police (and
20 IPCC (2012) Report of the investigation into a complaint made by the family of Mark Duggan about contact with them immediately after his death. 21 Metropolitan Police Service (2012). Op. cit. 22 Angel , H. (2012) Viewpoint: were the riots political. Safer Communities, 11(1), 24-32.

RESTRICTED - POLICY
11
media reports) suggested that in Nottingham five police stations were attacked during the riots.23
• The Metropolitan Police identified that some individuals were using social media to coordinate groups to directly conflict with the police.
• People interviewed from both inside and outside London (Birmingham and Salford, Manchester) spoke of poor relationships between young people and the police in their area, in part fuelled by the use of stop-and-search or containment tactics used by the police.24
In the weeks preceding the riots in London there were reports of heavy-handed policing tactics being used. For example, in Hackney, the police mounted a dawn raid on the Pembury Estate, smashing in doors and making dozens of arrests. Whilst some would perceive this as necessary, other law abiding black citizens consider the approach taken to making the arrests as heavy-handed and discriminatory.25 Stop-and-search is another policing tactic which has been criticised for how it is carried out. Research has found that in London, individuals from a Black or Minority Ethnic background tend to have a more negative view of being stopped and searched than white individuals and perceive the stop encounter differently (25% of BME males reported that they feel fully treated with respect compared to 54% of white males). 26 The Metropolitan Police have concluded from this that stop and search powers should be better targeted and need to be shown to be effective to achieve trust and confidence in its use. Wider research also emphasises the importance of public perceptions of the police in influencing the co-operation of communities. For example, a recent study by the NPIA (building on previous US work on procedural justice by Tyler and colleagues) found that the most important factor motivating people to cooperate with the police and not break the law was the legitimacy of the police. In other words, when the general public felt that the police were on the same side as them they were significantly less likely to say they had personally committed an offence. Key factors which have been shown to be associated with perceptions of police legitimacy are thinking that the police treat people fairly and act effectively (in terms of responding to emergencies and keeping order).27 Thus perceptions of fair decision making and positive public interaction are important to maintaining order. 3. Something exciting to do / boredom
Once the disorder had started in North London by those initially protesting against the police, a wider range of people were motivated to join in. A key theme across individuals interviewed who took part in the disorder was the sense that the usual rules had been suspended and that for a few nights, people could do as they pleased with no repercussions. This included those who considered it something exciting to do. People who took part have described it as moments of madness which led to atypical behaviour for some people, or like a carnival that people got carried away with. Others described it as like a ‘wild party’ or ‘rave’ full of adrenalin and hype which encouraged more and more people to join in. It is likely that the opportunity of an adrenaline rush during the school-free days of August was an incentive for many teenagers. 4. The opportunity to get free stuff
23 e.g. http://www.bbc.co.uk/news/uk-england-nottinghamshire-14472172 24 NatCen (2011). Op. cit. 25 Angel (2012). Op. cit. 26 Metropolitan Police Service (2012). Op. cit. 27 Quinton, P. & Myhill, A. (2011) It’s a fair cop? Police legitimacy, public co-operation and crime reduction. An interpretative evidence commentary. http://www.npia.police.uk/en/docs/Fair_cop_Full_Report.pdf

RESTRICTED - POLICY
12
The opportunity to get free stuff was also a key motivating factor for some people, either as a chance to get things they would not otherwise be able to have or the chance to make money by selling on stolen items. Some perceived that there was a low chance of getting caught due
to the sheer volume of people taking part, the insufficient numbers of police available when the disorder first started and the lack of arrests at the time. Moreover, images of the police appearing to have lost control, and standing by and letting it happen were widely played on news channels, leading to copycatting events in other locations as people realised that the authorities were not in control. Other people taking part already had a criminal record or felt they had no job prospects and therefore had nothing to lose by risking looting shops. Taking advantage of the opportunity appears to have been motivated by material gain rather than a need to have essential items, for example many of the targets of the crimes were retail stores selling trainers and mobile phones. Comparison of Cabinet Office and LSE/Guardian research Similar reasons emerge across both of the two main studies which asked people why they took part in the riots. The LSE/Guardian research, however, places more emphasis on the influence of negative perceptions of the police, and less on thrill-seeking. Whilst evidence suggests that perceived unjustness of the police will have been a key factor for some, its importance may have been overstated as individuals used it as a post-event rationalisation for taking part in criminal and violent behaviour. This does not mean that it should be
discounted altogether as evidence from previous riots supports the view that race-related tensions and a distrust of the police amongst marginalised and deprived communities can be key drivers for initially triggering disorder which then provide opportunities encouraging people to loot: “offered a golden opportunity to the criminal fraternity and to excited children tempted by the good things of our material society made easy for the picking.”28
Facilitators and inhibitors to taking part The Cabinet Office research also interviewed young people who lived in locations where disorder took place, but who had decided against taking part. The potential gains from taking part could have been attractive to these young people, but nevertheless they chose not to get involved. Taken
together with findings from those interviewed who did take part, Figure 6 shows the factors which either encouraged or dissuaded people. Figure 6: Inhibitors and facilitators to taking part
Inhibits taking part Facilitates taking part
Group dynamics / peer pressure
Attitude of family and friends strongly against criminal activity
Family and friends also take part; seeing others ‘get away with it’
Information flow Didn’t get any messages; not watching TV
Seeing images on television; receiving texts, facebook posts or Blackberry Messenger messages on how to join in29
Authority figures Parents, relatives or youth workers telling them not to take part; no negative experience of the police
Knowledge that police don’t appear to be arresting people; negative attitudes towards those in authority
Criminal experience
On licence and therefore higher risk of bring caught, or been to prison previously and don’t want
Experience of committing criminal activity and not worried about consequences
28 Lord Scarman (1981). The Brixton disorders, 10-12 April 1981: The Scarman Report. 29 Blackberry’s encrypted Messenger Service was particularly efficient in enabling users to send private group messages to their contacts simultaneously, whilst proving a level of anonymity.

RESTRICTED - POLICY
13
to go back
Stake in local community
Feels a part of local community and responsible for it (including religious communities); community members actively protected local areas
Prevailing undercurrent of low level criminality and anti social behaviour in locality
Stake in society Has job / apprenticeship or aspirations – perceived a lot to lose
Poor job prospects, low income, limited hope for the future, ‘nothing to lose’
Poverty and materialism
N/A Desire for material goods, but no means to pay for them
Availability to go out
E.g. not allowed out by parents, Ramadan
Some had nothing to do as it was the school summer holidays; or no job to go to the next day
Transport Not easy to get to riot locations Easy to travel to riot locations
The police response
The police demonstrated many acts of bravery in responding to the disorder, with police commanders thrown into managing fast-moving and often violent situations at very short notice. Ultimately the surge in police strength as the mobilisation of large numbers of officers across the Police Service became increasingly effective (as well as rumours of more forceful tactics being used such as water canon) has been credited with bringing the
disorder to an end. However, an independent HMIC review as well as reports by the main affected forces have concluded that the police handling of the disorder was insufficient in two main areas:
1. the liaison with the relatives of the individual shot by the police in Tottenham as well as the national press resulting in open speculation and rumour; and
2. the initial police response to the riots sparked by the resulting tensions. In particular, the images of overwhelmed officers appearing to stand-by during the first outbreaks of disorder resulted in perceived opportunities that the public were getting away with looting and disorder which encouraged copycat incidents.
There were six key challenges faced by the police which are detailed in figure 7. 30,31,32 Figure 7: Key challenges faced by the police
1) Forces took too long to mobilise resources
• Initially in London public order trained officers were not deployed quickly enough to exert control and deal with the speed at which the disorder escalated. This was in part due to delays in requesting support, and because even when officer numbers did arrive they were not in sufficient quantity to deal with how far the disorder had already spread.33
• Fire crews could only be sent to incidents where the police advised that they could support Brigade attendance which impacted on how quickly arson attacks could be dealt with
• There were some good examples of regional contacts being used to bolster resources, however overall the collaboration was not strategic and instead was based
30 HMIC (2011). The rules of engagement: A review of the August 2011 disorders. http://www.hmic.gov.uk/media/a-review-of-the-august-2011-disorders-20111220.pdf 31 West Midlands Police (2011). Interim report following public disorder in August 2011. 32 Metropolitan Police Service (2012). Op. cit. 33 3,480 officers were deployed in London on the 6th August; 4,275 on the 7th August, 6,000 officers on the 8th August and 16,000 on the 9th August.

RESTRICTED - POLICY
14
on who forces had worked with before.
2) Equipment shortages, lack of trained officers, problems with communication systems
• Many officers had not received up-to-date public order training and even where it had been provided it was frequently not sufficiently realistic, e.g. officers did not train in full kit and were unprepared for the rigours required.
• The Met command centre software did not easily allow the monitoring of incidents and communication with ground commanders to enable decisions about where to send officers.
• Radio communications for officers brought in to support the Met from other force areas were initially problematic as they did not have access to the same dedicated radio channels.
• Protected vehicles (Jankels) were used to good effect, but there were insufficient
numbers.34 • Supporting officers from outside forces felt they had insufficient local knowledge available
to them as they were not accompanied by experienced local officers. • There were insufficient numbers of suitably equipped vehicles that necessitated the use
of mini buses which were not compatible with the role required.
3) Traditional dispersal tactics were often ineffective as rioters could move more quickly and with greater agility than the police were geared for
• In some areas dispersal tactics displaced looting to the fringes of main retail areas spreading the problem rather than resolving it.
• Highly mobile crowds were able to form and dissipate rapidly, enabled by social media communications.
• Protecting the emergency services so they could prevent loss of life had to be a priority over substantive action against those rioting. The second priority was then protecting an area to prevent the spread of further disorder and containing the group of rioters until more police resources arrived.
• West Midlands Police decided to maximise arrests to reduce rioters. This was perceived to work well, however it depleted the number of deployable officers as they escorted arrestees to custody suites.
• Other effective tactics included traffic and mounted branch officers limiting access to city centres; and officers in CCTV control rooms spotting troublemakers to make arrests.
4) Officers were hesitant and unsure about the level of force they could use
• Officers reported being concerned that if something unfortunate happened (e.g. similar to G20 protest) then they would be subject to political and public criticism.
• Some officers were not familiar with the level of force they were legally allowed to apply and it appears that there were circumstances when the police operated as if they were policing a legitimate event such as a student demonstration, whereas they should have been treating it as predominantly criminal activity.
• There was, however, high support from the public to allow the police to use more forceful tactics including water canon, rubber bullets and tear gas.35
5) In some areas community engagement was limited and forces did not act on information not graded as ‘intelligence’
• In some areas, good use was made of local networks to provide police with information about community concerns and also to circulate important messages from the police to provide reassurance.
• However, in London, community engagement was weaker (especially in Tottenham) and the Met acknowledge that they did not form an accurate community intelligence picture.
• The Independent Advisory Group model in particular was insufficient as was the tension assessment system which understated the potential risk and led to the Met initially
34 The Metropolitan Police has 12 armoured vehicles, West Yorkshire Police has seven, and West Midlands Police five. 35 HMIC (2011). Op. cit.

RESTRICTED - POLICY
15
declining on-call public order command support.
6) Overwhelmed by volume of social media information
• There were a handful of examples of forces using social media and engaging with influential key figures to prevent disorder in some areas, e.g. the Met successfully blocked disorder in Oxford Circus as a result of monitoring social media.
• However, more commonly forces reported that there was too much information to analyse usefully. Moreover, the information was conflicting and often contained wrong or misleading items.
• In general, forces did not have access to new technologies which can help to analyse social media data (e.g. automatic word scanning).
More widely, the investigation and criminal justice response to the disorder has been considered a success, with special arrangements being used to bring about swift and efficient justice to those involved in the riots. The Metropolitan Police, for example have allocated additional resources to view the large volume of CCTV evidence which has been critical to making arrests and subsequent prosecutions. Her Majesty’s Courts and Tribunals Service (HMCTS) and Crown Prosecution Service (CPS) also agreed special court arrangements in the initial weeks after the disorder to manage the exceptional demand. This included mobilising staff across all agencies to scale up court capacity and selecting three court centres to sit extended hours. As a result, by the 12th September 2011 (one month after the disorder), 1,715 suspects had had an initial hearing at a magistrates court.36 The most recent published statistics show that as of midday 1st February 2012, 1,483 persons had been found guilty and sentenced for their part in the disorder which was 55 per cent of the 2,710 people brought before the courts. Of those sentenced, 945 have been sentenced to immediate custody with an average custodial sentence length of 14.2 months. This compares to an average custodial sentence length of 3.7 months for those convicted at magistrates’ courts (but sentenced at any court) for similar offences in 2010.37 Thus it appears that whilst within the guidelines, the sentences awarded are substantially longer than average to in part reflect the damage done to communities and also to act as a deterrent. Whilst it is too early to tell what effect the tougher sentencing will have on reoffending, interviews with those who took part also suggest that some have experienced regret and would not take part in similar activity again). and also to act as a deterrent.38 The Riots Damages Act (RDA) provided the main route to compensation for individuals or businesses who suffered damage to their buildings or property as a result of the disorder. To make things easier for claimants, the Home Office extended the claims deadline from 14 to 42 days, the claims form was simplified and a special bureau was set up to help individuals without insurance cover. Initially, payment of RDS claims was very slow due to the unprecedented volume of claims and difficulties in getting appropriate documentation from claimants. The Home Office has worked closely with police authorities and the Association of British Insurers to speed up payments and progress is now being made.
Public perceptions of the disorder In the weeks following the riots, a series of public opinion polls were commissioned. The key findings from these are briefly listed below.
36 MoJ (2011) Statistical bulletin on the public disorder of 6th to 9th August 2011. http://www.justice.gov.uk/downloads/statistics/criminal-justice-stats/august-public-disorder-stats-bulletin.pdf 37 MoJ (2012). Op. cit. 38 NatCen (2011). Op. cit.
RESTRICTED - POLICY
16
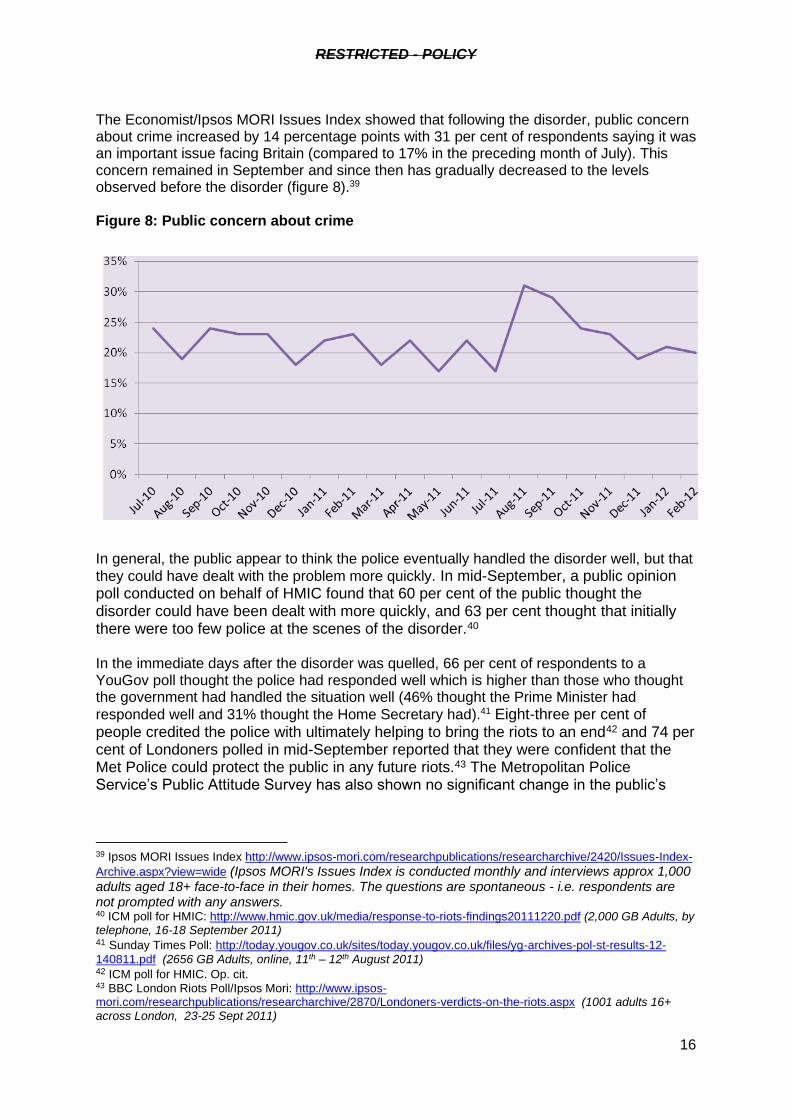
The Economist/Ipsos MORI Issues Index showed that following the disorder, public concern about crime increased by 14 percentage points with 31 per cent of respondents saying it was an important issue facing Britain (compared to 17% in the preceding month of July). This concern remained in September and since then has gradually decreased to the levels observed before the disorder (figure 8).39 Figure 8: Public concern about crime
In general, the public appear to think the police eventually handled the disorder well, but that
they could have dealt with the problem more quickly. In mid-September, a public opinion poll conducted on behalf of HMIC found that 60 per cent of the public thought the disorder could have been dealt with more quickly, and 63 per cent thought that initially there were too few police at the scenes of the disorder.40 In the immediate days after the disorder was quelled, 66 per cent of respondents to a YouGov poll thought the police had responded well which is higher than those who thought the government had handled the situation well (46% thought the Prime Minister had
responded well and 31% thought the Home Secretary had).41 Eight-three per cent of people credited the police with ultimately helping to bring the riots to an end42 and 74 per cent of Londoners polled in mid-September reported that they were confident that the Met Police could protect the public in any future riots.43 The Metropolitan Police Service’s Public Attitude Survey has also shown no significant change in the public’s
39 Ipsos MORI Issues Index http://www.ipsos-mori.com/researchpublications/researcharchive/2420/Issues-Index-
Archive.aspx?view=wide (Ipsos MORI's Issues Index is conducted monthly and interviews approx 1,000 adults aged 18+ face-to-face in their homes. The questions are spontaneous - i.e. respondents are not prompted with any answers. 40 ICM poll for HMIC: http://www.hmic.gov.uk/media/response-to-riots-findings20111220.pdf (2,000 GB Adults, by telephone, 16-18 September 2011) 41 Sunday Times Poll: http://today.yougov.co.uk/sites/today.yougov.co.uk/files/yg-archives-pol-st-results-12-
140811.pdf (2656 GB Adults, online, 11th – 12th August 2011) 42 ICM poll for HMIC. Op. cit. 43 BBC London Riots Poll/Ipsos Mori: http://www.ipsos-mori.com/researchpublications/researcharchive/2870/Londoners-verdicts-on-the-riots.aspx (1001 adults 16+ across London, 23-25 Sept 2011)

RESTRICTED - POLICY
17
general confidence in the MPS since the August disorder (precise figures are not currently available).44 There was also high support from the public to allow the police to use more forceful tactics
including water canon, rubber bullets and tear gas. In fact, the HMIC poll found that almost half of respondents (49%) believed that too little force was used to deal with the disorder (though 43% thought that the level of force was “about right”). Those surveyed in the more troubled locations of Croydon and Haringey were more likely to say that too little force was used. The public were supportive of the tougher sentences passed for those convicted for the role they played in the riots. For example, a YouGov poll conducted on the 17th-18th August found that for those sentenced so far 12 per cent of respondents thought the sentences handed down were too harsh, 49 per cent thought they were about right and
32 per cent thought they were too soft.45 Similarly, an ICM poll showed that 70 per cent of respondents were supportive of those convicted for offences related to the riots receiving a tougher prison sentence than they might ordinarily expect.46 In a poll conducted by the Sunday Times immediately after the riots (10th/11th August) people saw the main causes of the riots as criminality (61%), gang culture (61%) and bad parenting (61%); very few people thought poor policing (11%), spending cuts (10%) or social media (13%) were to blame.47 This is similar to results from other polls conducted in the week following the riots (e.g. for the Sun and Channel 4). Another poll undertaken by ICM for the Guardian/LSE research also reported criminality (86%) and poor parenting (86%) as important causes of the riots, however this poll also found that moral decline (82%), greed (77%) and unemployment (79%) were also considered important causes. This may be because these response options were only available in the Guardian poll, however we do not have detail of the methodology to be sure.
The risk of something similar happening again Little of the published research to date has looked at the likelihood of something similar happening again. Eighty-one per cent of those interviewed in the LSE/Guardian study said that they thought the riots would happen again. However, in the short term, it appears that some people who took part will be deterred from joining in again for two reasons. Firstly, interviews with those who took part suggested that some individuals have since experienced regret over their actions and reported that they would not take part in similar activity again. Secondly, we expect that the large volume of arrests and severe sentences passed on those charged in court so far are likely to act as a future deterrent, and refute the perception that the disorder was an opportunity for people to get away with such behaviour. We can certainly expect that that there will be future “trigger events” (and there have already been some, e.g. the police shooting of a man in Lewisham in February 2012). How the police respond following any such incidents (including effective communication with the public and better monitoring of community tensions) will be critical.
44 Metropolitan Police Service (2012) Op. cit. 45 YouGov poll for the Sun: http://ukpollingreport.co.uk/blog/archives/3884 (2,608 adults, online, 17th-18th August) 46 ICM poll for the Guardian: http://www.guardian.co.uk/uk/2011/aug/23/british-supports-harsher-sentences-riots (1,004 adults, by telephone,19-21 August 2011) 47 Sunday Times Poll. Op. cit.

RESTRICTED - POLICY
18
Policy implications for the Home Office The findings presented in this paper lead to a number of policy implications for many stakeholders, including a range of government departments and agencies (e.g. DWP, DfE, MoJ and DCLG) as well as police forces and other service providers at a more local level.48 Figure 9 lists the main implications for the Home Office in a) mitigating the likelihood of any further disorder events; and b) ensuring the response to any further disorder is as effective as possible. Figure 9: Policy implications for the Home Office
Ensuring the police have access to and use appropriate tactics in handling any future public disorder – a stronger police presence should have a deterrent effect on opportunists
Who?
1) Work with ACPO to review the framework for policing public order situations. This should incorporate the HMIC recommendations from The rules of engagement and cover how to deal with public order situations which escalate to widespread looting and criminal damage.
POU
2) Decide on an appropriate body to oversee the training curriculum for Police Support Units to ensure officers have up-to-date and relevant training on public order
PPU
3) Review police powers, including use of curfew powers (Home Office consultation is already underway)
POU / CASBRU
4) Develop new equipment for tackling public disorder (e.g. smart water which marks offenders to aid detection after the event; light weight body armour) and consider the policy implications of tactical options such as the use of Taser in a public order scenario, or the use of water cannon
CAST / POU
5) Include a minimum public order response in the Strategic Policing Requirement which should cover minimum mutual aid requirements between forces (especially following the introduction of Police and Crime Commissioners) so that officer numbers can be increased more rapidly and the minimum resource which must be dedicated to public order policing is agreed
POU
6) Work with the IPCC to consider how to improve the police complaints procedure.
PTU
Improve police and partnership engagement and interaction with local communities, particularly young people
1) Support ACPO to review guidance on stop and search powers and share good practice on how it can most effectively be used
PTU
2) In advance of the Olympics, improve police service’s use of social media to keep the public informed
POU / OSCT
3) Share effective practice with forces on how to engage with a wide range of the local community (including young people) and not just the usual suspects
Police Professional Body / CSU
4) Support the police service to maximise the use and effective management of volunteers
CSU
5) Improve capacity of local communities to tackle crime and ASB in their area (e.g. through the Neighbourhood Watch Network and Citizen Patrols
CSU
48 Implications for other government departments include policies such as: tackling youth unemployment; improving parenting skills; improving literacy and educational skills of young people; implementing effective rehabilitation programmes to prevent reoffending for those sentenced for their role in the disorder; and improving the provision of diversionary activities for young people.

RESTRICTED - POLICY
19
as well as stronger links with their local Community Safety Partnerships).
Preventing young people from being motivated to take part in disorder
1) Link in with the Troubled Families cross-government programme to divert those at risk of getting involved in criminal behaviour
Louise Casey / VYCPU
2) Agree a cross-government action plan on how young people can be prevented from criminal behaviour
Lord Henley / IMG
3) Support areas with the biggest youth and gang violence to revamp their strategic and operational response to dealing with serious youth violence (including work to protect young people most at risk of serious violence)
VYCPU
4) Support parents worried about their children's behaviour by working with a range of family service providers to develop new advice on gangs
VYCPU
Better monitoring and predicting of future disorder
1) Work with ACPO to develop a national risk assessment for monitoring public order risk
OSCT / POU
2) In advance of the Olympics, improve the police service’s ability to interpret large volumes of social media intelligence and information (likely to require new technology)
OSCT / POU
3) Review processes for community tensions monitoring OSCT / POU
Ensure the Home Office is as well prepared as possible for any similar events in the future
1) Learning the lessons from what went well and what could have been done better from the Home Office handling of situation
CPG Board
2) Agreeing the role of the Home Office in any future situations once PCCs are in place – decide who will be the right staff to deal with such situations
CPG Board
3) Linking into Cabinet Office contingency planning POU
4) Review the riot damages act and learning on how the process can be improved
GFU
Conclusion This paper has summarised the main findings from reports published about the August 2011 disorder. The reports show that the disorder had a different character in different areas, with people stating varied reasons for taking part. The diverse nature of the disorder means that there was not one single cause and that there should be a range of policy responses from the Home Office. The main policy implications for the Home Office relate to policing, as the reports and analysis have identified policing as a key issue in the disorder. Policing was a factor in the initial ‘trigger’ (the shooting of Mark Duggan and the subsequent handling of the incident), the spread (encouraged by the perceived deficiencies in the initial response to the disorder) and the ending of the disorder (facilitated by the large increase in police numbers deployed). However, although anger at perceived unfair treatment from the police has also been identified as one of the motivations for those that took part, broader public confidence in the police appears to have remained relatively unharmed. The analysis of facilitators and inhibitors to taking part in the disorder, in particular among young people, should guide the Home Office approach to preventing young people from taking part in criminal activities. Public perceptions appear to focus on the broader issue of

RESTRICTED - POLICY
20
criminality, caused by bad parenting as the primary cause of the riots and this issue has broader, cross-government policy implications, as seen in the Troubled Families programme.

RESTRICTED - POLICY
21
Annex A: Main studies / analyses of the August disorder published up to 30th March 2012
Title Date published
Lead organisation
Approach Strengths Weaknesses
Recorded crime and arrests resulting from the disorder in August
October 2011 Home Office Quantitative
Statistical analysis of police data on nature and extent of recorded crimes by area; characteristics of arrestees, including gang membership.
Comprehensive coverage of police recorded crimes linked to disorder.
Arrests data gives most complete picture of those involved (includes approx 4,000 arrestees).
Snapshot of data shortly after the riots. Profile of those arrested may change as more people are caught and some are not charged (i.e. No Further Action).
Early arrest data may be skewed if those previously known to the police were arrested first
Characteristics of arrestees may not reflect all offenders involved.
Cannot tell us why people took part.
Statistical bulletin on the public disorder of 6th – 9th August
October 2011 Ministry of Justice
Quantitative
Statistical analysis of characteristics of those coming before the courts, including previous criminal history and deprivation estimates.
Detailed profile of socio-economic / criminal background of those coming before the courts (includes approx 2,000 people).
Includes links to education and benefits data.
Comprehensive geographic coverage of affected areas
Profile may change as more offenders brought to justice.
Characteristics of those going to court may not reflect all offenders involved.
Cannot tell us why people took part.

RESTRICTED - POLICY
22
Title Date published
Lead organisation
Approach Strengths Weaknesses
Statistical bulletin on the public disorder of 6th – 9th August
February 2012 MoJ Quantitative
Statistical analysis of demographics of those coming before the courts, and sentencing outcomes.
Includes statistics for all those who have appeared in court = large sample size.
Comprehensive geographic coverage of affected areas
Does not update deprivation of criminal history statistics.
Characteristics of those going to court may not reflect all offenders involved.
Cannot tell us why people took part.
The August riots in England: understanding the involvement of young people
November 2011
Cabinet Office
Qualitative
Interviews (n = 200) with young people (aged under 25) who took part, others living in affected communities, and those living in areas not affected.
Insight into rioters’ motivations and feelings.
Breadth of views covered.
Interviews (n=150) with those not involved highlights possible protective factors.
Findings may not be representative of all those involved (or communities affected). Small number of all those interviewed admitted involvement (n=50).
Offenders may give post-hoc rationalisation of their actions.
Findings cannot be quantified to understand which reasons were most important / prevalent.
Reading the riots December 2011
Guardian/LSE Qualitative
Interviews (n=270) with those who took part. Analysis of accounts of the riots on social media.
Insight into rioters’ motivations and feelings.
Large number of qualitative interviews ensures breadth and depth of approach.
Captures views of some offenders who had not been arrested – though unclear from methodology how many had not been arrested.
Most in-depth exploration of role of
Offenders may give post-hoc rationalisation of their actions.
Interview-based findings may not be representative of all those involved.
Findings cannot be quantified to understand which reasons were most important / prevalent.

RESTRICTED - POLICY
23
Title Date published
Lead organisation
Approach Strengths Weaknesses
social media.
Policing Large Scale Disorder: Lessons from the disturbances of August 2011
December 2011
Home Affairs Committee
Descriptive account of evidence given to HAC and recommendations for police forces and government departments
Summarises evidence from a range of sources.
Presents little primary / new evidence
5 Days in August November 2011
Independent Riots Communities and Victims Panel
Synthesis and Qualitative
Visits to areas to gather views from individuals on causes and impacts of riots.
Insight into victims’ views and information on costs of riots.
Pulls together evidence from the range of other published sources.
Those who spoke to panel may not fully represent communities affected.
After the Riots March 2012 Independent Riots Communities and Victims Panel
Synthesis, Qualitative and small scale survey
Visits to 4 riot and 2 non-riot deprived areas. Interviews with local public services, focus groups with offenders/members of the community, survey with 1,200 residents.
Collates a range of views from different stakeholders.
Includes views from areas not affected by the riots.
Relies on survey findings heavily, however sample sizes are small and unlikely to be robust or representative. Recommendations are not clearly evidence-based.
Police force reports to local authorities
October 2011 onwards
West Midland Police
Descriptive account of what happened and policing response.
Includes detailed police-based narrative of disorder. Insight into difficulties experienced by police in responding.
Predominantly covers police view and no others

RESTRICTED - POLICY
24
Title Date published
Lead organisation
Approach Strengths Weaknesses
4 days in August March 2012 Metropolitan Police
Descriptive account of what happened including statistics on gang members, number of crime by local authority and some limited survey results
Detailed insight and officer views on what happened; includes unpublished results from robust Met Police Public Attitude Survey.
Predominantly covers police view – though appears quite balanced
Civil disturbances in London, August 2011: Brigade response
September 2011
London Fire and Emergency Planning Authority
Descriptive account of what happened, including statistics on the number and location of calls
Only account of what happened from Fire Brigade’s perspective
Predominantly covers fire brigade view in London and no others
A review of August disorder
December 2011
HMIC Qualitative and quantitative
Review of police tactics in five forces experiencing disorder.
Includes survey of public involvement and attitudes in riot affected areas
Independent assessment of police response.
Survey of public based on quota sampling.
Not all forces affected by the riots are included. Says little about those force areas where riots did not take place.
Retail Crime Survey 2011
January 2012 Retail Business Consortium
Quantitative
Survey of businesses
Provides costs from businesses on what the riots cost them
Likely to be an underestimate as only includes about half of businesses in all of Britain (and not sure how well represented businesses affected by the riots are in it)

RESTRICTED - POLICY
25
Title Date published
Lead organisation
Approach Strengths Weaknesses
Viewpoint: were the riots political
January 2012 Harry Angel, Safer Communities Journal
Summary of research between government austerity and social disorder
Summaries earlier research studies Potential bias as drafted by director of Think Tank (Ironic Investigations)
Deconstructing the rioters: a case study of individual convicted and sentenced in Greater Manchester
January 2012 Becky Clarke, Safer Communities Journal
Statistical analysis of social, economic and ciminogenic information from probation datasets
Provides more detailed information on criminogenic need than available on larger sample of offenders
Only represents Manchester offenders and sample size is approx half of those who had appeared in court by Feb 2012 (79 offenders)


![Avoidant/Restrictive Food Intake Disorder...Social (Pragmatic) Communication Disorder [effective October 1, 2016] Bipolar and Related Disorders .....3 7 . Bipolar I Disorder, Current](https://img.dokumen.tips/doc/110x75/607607e7491663081f51829b/avoidantrestrictive-food-intake-disorder-social-pragmatic-communication-disorder.jpg)