Embed Size (px)
Citation preview
C.M. 1979/E: 60Marine Environmental
Quality CommitteeRef. Biological
Oceanography Committee
Synthesis of research on nutrients
in the Southern Bight of the North Sea
J.P. MOMMAERTS • W. BAEYENS and G. OECAOT
This paper is not to be cited without prior reference to theauthor.

r
Synthesis of research on nutrients
in the Southern Bight of the North Se~
J.P. MOMMAERTS', \/. BAEYENS' end G. DECADT 3
Introduction
When the "nutrients" group was set up in 1977, the problems had al
ready been clearly set forth. Later on, they were regularly recalled, but
progress is very slow. SUch is the case of a fundamental question which
concerns the dynamics of our coastal eco-system and which was raised for
the first time six years ago (1) within the framework of the "Sea Project"
1s there a limiting element? What is it? How does it limit planktonic
production ?
There is clearly a need here for some research which no-one has to
date been disposed to fulfill.
1t is however also in the biogeochemical cycle of an element such as
nitrogen (rather than that of carbon) that the clear translocations between
biological compartments are most apparent.
A major part of the problems is obviously due to the technical dif
ficulties associated with measuring the uptake and excretion activities
and the practical difficulties associated wi th measuring the inputs on the
borders of the systan.
1. This paper is e part of the report "Synthesis of research on nutrients" 0M/17-78/02 of the Belgien NationalProgram , by the same authors.
2. Unit~ da Gestion des Modales Mer et Estuaire, Belgium.
3. Laboratorium Analytische Scheikunde, V.U.8. t Brussels.
(1
216
The research undertaken during the 1977-1978 period covered two main
aspects :
1) the reguZation of phytopZanktonic activity [based on werk of A. Bertels,
Excretie en primaire productiebepaling in de Noordzee, personal communication,
1978; J. Nijs et al., Bruto resultaten van de partikulaire en opgeloste pri
maire produktie voor Oostende - Calais - Hansweert, personal communication,
1978] with
a) examination of the seasonal curves observed in the three media in
order to determine
1° the periods at which the concentrations of certain nutrients fall
to a value such that one can reasonably estimate that they are
limiting ("kinetic" limitation) , G. Decadt et al., Seizoenvariati e
en ruimtelijke verspreiding van de nutriEmten in de Zuidelijke
Noordzee, personal cammunication 1978.
2° the periods at which the N/P ratio varies considerably from its
roean value (- 7 in weight) ("stoechiometric" limitation).
b) enrichment experiments (conducted at seal to determine which nutrient
(therefore limiting) can stimulate photosynthesis.
c) enrichment experiments conducted in a reactor to determine the nature
of the limiting element and to define the nutrient-uptake speed
relation.
d) dosages of nitrate-reductase in the phytoplankton to determine if a
capacity for the use of NO; exists, even in the presence of NH:,
M. Somville, Nitrification et denitrification dans l'estuaire de
l'Escaut, Dosage de la nitrate reductase en Mer du Nord et dans la
partie aval de l'estuaire de l'Escaut, personal communication 1978.
2) the searoh for coherenoe (means of translocation)
If the direct (or calculated) measurements of the flows of consurrption and
regeneration by the biological compartments, plus the inputs and outputs
at the borders of the system are correct, then the variations of nutrient
concentrations observed in the medium must be coherent with the resulting
flow. The following points are discussed
a) method of analysis of nutrients,
b) seasonal variations (time and space) of nutrients in the Belgian coastal
zone,
c) the flows implied by these variations.
•
217
Results
1.- REGULATION OF PHYTOPLANKTONIC ACTIVITY
1.1.- Recall of a few theoretical aspects
Just as light controls the intensity of primary production, the con
centration of one or more nutritious elements (one generally thinks of
NOj, N~, P04--, Si (OH)4 ' but there may be others) influence the rate of
biosynthesis and playadeterminant role in the interspecific competition
within the phytoplankton.
A mathematical model of the ecosystem must necessarily take into
account the regulating effect which the limiting nutrient exercises on
1°) the uptake speed U of this nutrient S it is generally accepted
that the relation has a hyperbolic form, described by Michaelis and Menten :
U = U max x feS)
with
feS)S
K s + S
•
varying between 0 and
2°) the uptake speed of other elements (nutrients or constitutive elements
such as carbon) with two approaches :
a) the simple approach : the speeds are in the same ratio as the cons
tituents of the living matter (phytoplankton) : 41 : 7.2 : 1 for C: N : P
(in weight). The ratios c/N = 5.7 and its inverse
1Yield = Q = 0.18
are particularly used.
b) the complex approach several works indicate that a distinction
should be made :
a) between the metabolism of carbon (photosynthesis, regulated pri
marily by light) and the limiting nutrient (uptake, regulated primarily by
the ambient concentration);
ß) between the uptake and growth mechanisms.
218
In actual fact, whatever Monod might have written, the equation which
best describes the growth (cf. net particulate production) does not necessa
rily have the same Michaelian form as that which describes the uptake :
growth will be achieved rather by drawing from an internal reservoir which
is constituted during aperiod of non-limitation. Droop (1973) proposed a
new formula taking into account the very minute studies made in chemostats
- uptake (e.g. in nitrogen) :
U=UmaxX
- growth (e.g. in carbonl •\l \l max (1
_ Qo)Q
where Q = ~ in the cell (quota) 1 , with S is nitrogen for example andC
Qo is the minimum value of quota;
- evolution of intracellular quota
32.dt u - \lQ
This formula, having been established for a system of constant light
and based, as regard growth, on numbers of cells, cannot therefore be di
rectly used in an ecosystem model.
Also taking into account the re~triction referred to in § (al, Mommaerts
(1978) proposed a model which incorporated these various elements in a logi
cal manner :
- gross primary production (carbon)
dCdt
1x
C •where U~ax is the maximum speed of uptake of C (per unit of C), f 1 (I)
is the function of
of nitrogen (ex.:
light intensity,1 _ Qo)
Q
f(Q) is the function of internal pool
1. The form in which the nutriant reserve is stored is not specified. Whet is importent here is that ""ereis an approach per model which takes into account the biochemical composition of the phytoplankton, cLNijs et al., personal communication, 100. cit.
219
- uptake of nitrogen (if limiting) :
dN x 1dt C
where u Nmax is the maximum speed of uptake of N (per unit of C), f (N)
is the function of the external concentration of nitrogen, f 2 (I) is the
function (to be specified) of light intensity (perhaps, function of stock
of ATP available);
- evolution of the intracellular quota of N
~ - uN_ (U G - r) Qdt -
where r is the rate of respiration.
Corrunent
Since Q can vary only within certain limits, the models provides
for excretion (nitrogen or carbon, depending on the case) of the excess
assimilated. In this, it is coherent with the observations of Fogg (1971)
who writes that the excretion is much more important in an oligotrophie
medium, or other more recent observations, regarding the photoreduction of
02 (with release of glycollate) which can be taken as a means of absorbing
an excess reducing power brought about by photosynthesis, cf. Bertels,
personal communication 1978, loc.cit.
1.2.- Research into the limiting element
1.2.1.- Theoretiaal aonsiderations
It may be useful to recall that there are two fundamental approachese to this problem:
10) the stoeahiometria approaah : the study of the N/P ratio (for example)
in water makes it possible to forecast the nature of the limiting
element or at least that which would be the first limiting at the end
consumption.
2°) the kinetia approaah : below a certain concentration saturating value
(in practice, less than 10 times K.), the negative retroaction on the
assimilation flow can effectively exist. Since the most commonly cited
values of K. (different phytoplanktonic species and different biotopes)
are grouped around 1 jlg at/!/, of N(14 mg/rn3 ) or P (31 rng/rn3 ), one can

220
see that these two nutrients can occasionally be limiting, taking into
account that the ranges observed in the North Sea vary between 3 and
30 Vg at/1 for N and 1.4 to 3 Vg at/1 for P (see also § 1.2.2.).
1.2.2.- Seasonal variations o[ the main nutrients in the three zones
Calais and Hansweert
The table 1 contains a few pieces of information (in VM/1) extracted
from the data of the Belgian team and also from the data issued by P. Man
gelsdorf of the Biologisch Anstalt Helgoland, personal communication, 1978 • •NO; + NO; NH~ PO~-- Si02 Source
Calais
04.04.78 lj.45 3.18 0.50 2 • .! rn/197U : 15
07.04.78 4.40 3.75 0.73 1.0 ..11.04.78 19.33 3.76 0.88 3.2 ..17.04.78 8.48 0.·"n 0.40 3.5 ..18.04.78 11.08 2.81 0.51 3.0 ..
Hansweert
05.05.77 215 61 - - rn/197B : 21
07.04.78 261 28.17 - - ..21.04.78 191-249 18.~-36.3 - - ..
Belgian coastal region
The seasonal variations in the different nutrients are made known to
us by internal reports, cf. Mommaerts et al., personal communication, 1977,
Decadt et al., personal communication, 1978. One can see that the ranges
of concentration are roughly as given in table 2.
These results are discussed more particularly in § 2.3 and 2.4 as
regards the precautions to be taken for their interpretation, the spatial
and temporal variations and the flows they imply.
Discussion
The few results collected here are insufficient to establish a final
comparison of the three biotopes : let us say that the presumption of a
greater wealth in Ostend than in Calais is not invalidated. The even greater

•
221
1977 1976
NO:; + N02- 0 - 850 100 - 2000 in lly N/~
(0 - f,Q) (7 - 143 ) in llM/~
NH~ o - GOO 25 - 175 in llg N/R
(0 - 43) (1.8 - 12.5) in lIM/9.
po~-- 40 - 300 25 - 300 in llg p/9
(1.3 - 9.7) 0.8-9.7) in (iM/R
Si02 300 - 3000 hO - 1000 in lJ<j si/1
(10.7 - 107) (8.9 - 35.7) in lIM/9,
wealth of the Scheldt eannot of course be questioned. As regards Ostend and
Calais, one ean see that the nitrogen and phosphoraus are likely to fall to
levels where they are kinetieally limiting (if one acknowledges that the K.
of the phytoplanktonie organisms of the eutrophie waters in general exeeed
the unit). This would also be the ease of the siliea in Calais. In Ostend,
and outside the main nitrogen peaks, the N!P ratio is always less than 7
whieh indieates that, in the ease of prolonged eonsumption, the nitrogen
would be exhausted in first plaee.
In eonelusion, one eannot define the exaet nature of the most probabZe
limiting element without help of a more direet approach : enrichment expe
riments condueted at sea, enrichment experiments condueted in a reaetor, ta
king into aceount all the "management parameters" who make the establishment
of the exact relationship possible between in vivo and in vitra experiences
(use of chemostat, eontrolled light, disearding effeets of non limiting
elements, ete.).
1.2.3.- Enriahment experiments oonduoted at sea
Stimulation effeets on the primary produetion by adding NO; (presumed
to be limiting) have been studied during two eruises
- in Oetober 1977, positive stimulation effeets have been observed at Ostend
and at Hansweert (Nijs et al., 1978, loe. eit.)/
- in April 1978, no stimulation effects have been observed at the three
plaees under study (Ostend, Calais, hansweert) [cf. Nijs et al., 1978, loe.
cit.J.
222
Discussion
One must first take into account the fact that this type of experience
is not at all perfect in his conceptual formulation : on the contrary of the
speed of uptake of the tested nutrient, the speed of synthesis of living
matter is only indirectly related to the concentration of the limiting sub
strate (see also § 1.1.). Falkowski et al. (1975) have more particularly
shown that the absence of stimulation can result from the competition be
tween carbon dioxide and nitrate in the production schaue of ATP during the
cyclical photophosphorylation processes. The absence of stimulation by
nitrate, observed in the spring-time, near Ostend and near Calais, can ...
also be.a consequence of the limiting effect on the primary production due
to other nutrients (PO~-- for instance) :
~
Concentrations in ,.M/R.
NH: NO, PO;-- Si02
Calais (4-4-78) 3.18 5.30 0.50 2.2
0stend (5-4-78) 5.38 16.81 1. 91 7.30
The stimulation effectively observed in autumn is not however understood
since the concentrations of all nutrients were high. Furthermore, one ob
serves that the curves observed are not at all of the Michaelis-Menten
type (see linear transformations in fig. 1).
These few results therefore leave us perplexed; it is to be regretted
that these experiments were limited to a single type of nutrient.
1.2.4.- Enriahment experienae in a :r>eaato:r'
This study which is currently under way and which forms the object of
a research simultaneously conducted by the Analytical Department (V.U.B.,
Brussels) and the "Unite de Gestion des Modeles Mer et Escaut", sets out
to determine the limiting element and establish kinetic curves which
describe the overall substrate uptake regulation for natural populations
in the North Sea. It is an experiment inspired in part by the experiment
of Harrison and Davis (1977).
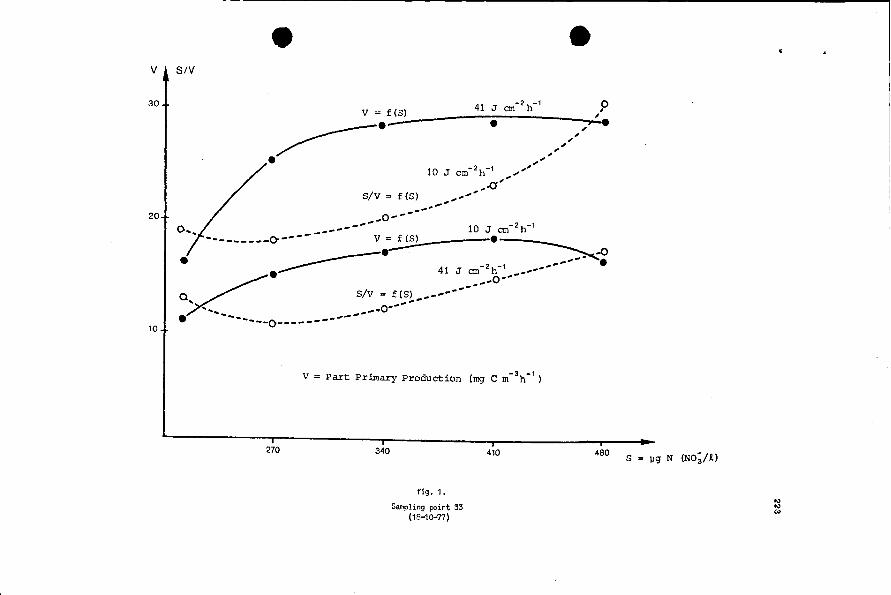
v
30
20
10
SN
v = Part Primary Production (rog C m- 3h- 1 )
270 340
Hg. 1.
Sampling point 33(18-10-77)
410 480 s
'"'"""
224
1.3.- Ammonia-nitrate-reductase interaction
The phytoplankton can use the nitrate and ammonia as sources of
nitrogen. This latter form would however be used preferentially since
the cells thus dispense with a reduction.
To this must be added that, above a certain threshold of concentration
(- 1 ~M NH~/~), the synthesis of the nitrate-reductase would be curbed.
(e.g. Eppley et al., 1969). Since concentrations of NH: of more than 1 ~M
are currently observed, the assimilation of NO; would in theory be
virtually impossible in the three biotopes studied.
To check out this assumption, dosages of nitrate-reductase ware
regularly performed (Somville, personal communication, 1978, loc.cit.) by
testing cellular extracts wi th a coenzyme in a reduced form (NADH in a non
limiting concentration and in the presence of NO;. The nitri te appearing
in the extracts is a mesure of the degree of the enzymatic activity of the
nitrate-reductase.
Results
In winter, the enzymatic activity cannot be determined except for a
few offshore stations. This does indeed seem to be a question of detectabi
lity (very few phytoplankton) rather than a question of the presence or
absence of enzyme.
In spring and in summer, nitrate-reductase is to be found virtually
everywhere, particularly so the nearer one comes to the coast, whereas the
NH: is generally present and sometimes very abundant (e.g. the greater
enzymatic activities in the Scheldt).
In conclusion, the capacity for use of NO;, even in the presence of
NH~ seems to have been established for our regions.
2. - THE SEARCH FOR COHERENCES
2.1.- Terms of the problem
By virtue of the principle of the conservation of matter, the net
variations of concentrations of dissolved nutrients must be coherent with
the direct measurements of the flows of consumption and regeneration (up
take by primary production and regeneration by microbiological processes
"
225
especially) as weIl as the input and output flows at the borders of the
system.
As regards the latter, we have already seen for the Sauth Bay of the
North Sea (Nihaul et al., 1977) that the input and output flows are
virtually equal (namely ~ 300.103 tons N/year) and that the Scheldt and
the coastal region contribute a quantity in the order of 104 tons N/year.
Both this coastal input and the probable error on the "flows" balance
sheet are small in the light of the circulation of matter exclusively due
to biological processes. On,the basis of a net primary production of some
• 200 g C/m2 per annum, one calculates a consumption of some 200.10 tons
N/year.
It is therefore very useful to compare the variations in biological
activities with the variations in nutrients in the three zones (Calais,
Ostend and Hansweert) studied by the "Organie Matter" group (cf. these
proceedings) •
Unfortunately, there are currently two problems being encountered
a) with the exception of the Belgian coastal region which is regularly
visited within the framework of the Monitoring national programme,
the Channel and the Calais zone .are known to us only through measure
ments fairly spaced out in time, and originating from various sources
(problems of intercomparability, a.s.o., see § 1.2.2.). As regards
the Scheldt, which though weIl followed up as regards nitrogen
(Somville, personal communication, 1978, loc.cit.), the problems are
obviously more complex because of the specific hydrodynamic mechanisms
and the pelagic baeterial processes unknown at sea : nitrification and
denitrification. The case of the Scheldt will therefore not be dealte with in this synthesis.
b) As regards the spatiotemporal variations in the concentrations of nu
trients in the Belgian eoastal zone, unexpected phenomena have been
observed, phenomea never observed (or the significance of which was
not realized) in the former network (1970-1975) which was also con
siderably more extensive, and as a result visited mueh 1ess frequent1y.
This double problem (significance of data originating from different
sourees, phenomena with no common measure with known biologieal
mechanisms) has given rise to a great deal of thought and serious re
consideration.
226
The following paragraph in fact illustrates the need for great cauUon
in the interpretation of nutrient analysis results when precise
functional relations with biological campartments are studied.
It is therefore not so much the reliability of the analyses which is
questioned, but rather the need for a dynamic interaction between
biologists and analysts.
2.2.- Discussion of analytical methods
2.2.1.- Brief reminder of the techniques generaZZy studied
2.2.1.1.- Conservation and pre-treatment techniques
In all cases, the parameters are determined on samples·which are neither
filtered nor dialysed and conserved in plastic containers at - 20 'e ,except in the case of PO~-- (glass containers, addition of chloroform and
cold storage).
2.2.1.2.- AnaZytic methode
a) Phosphorous
The analysis only concerns orthophosphate (dissolved and particulate) •
One induces the formation of a phosphomolybdic complex with a well defined
pH (H 2 S04 0.6 N), so as to prevent interference from the silica. This
complex is reduced with ascorbic acid to obtain a blue colouring which
absorbs particularly at 830·nm.
b) Ammonia
With Na phenolate and Na hypochlorite, the ammonia forms a blue
complex of indophenol, the absorption of which depends on the pH and is
measured at 625 nm • The precipitation of Ca and Mg hydroxides is
prevented by the addition of EDTA on the one hand, and a mixture of Na
and K tartrate and Na citrate on the other. A sample of aged seawater
is used for checking.
c) Nitrate + nitrite
There are in fact two measurements :
1°) direct measurement cf the NO; using a classical diazoreaction
with the sulfanilamide, coupled with areaction with the N
naphtylethylene-diamine so as tc induce a purple stained ccmplex,
the absorption cf which is measured at 540 nrn.
2°) measurement, using the same method, of the total (NO; + NO;) following
227
reduction to NO; by passage on a column of cupro-cadmium. The pH of
the sample does not play an essential role whilst it ranges between 5
and 9
d) Silica
One induces the formation of a yellow molybdic complex with a pH of
approximately 1.6 so that there is little interference from the phosphates
(furthermore the addition of oxalic acid considerably reduces the staining
due to phosphorous which becomes negligible up to 5 parts for 1 part of si
licium). This complex is reduced by arnino-l naphtol-2 sUlphonic-4 acid or
~ ascorbic acid so as to obtain a blue staining which is measured either at
815 nm or 765 nm •
2.2.2.- OutZine of the main probZems raised by these methods
In order to ensure correct interpretation of the analytical results
and especially of their significance from the point of view of functional
relations with the biological compartments, the following problem should
be discussed: 1s the information obtained pl'eciseZy that which is sought ?
In actual fact, the analytic methods described above provide the total
concentrations of certain forms of nutrients whereas a more detailed
speciation would be preferred.
Ex :
- the total orthophosphates measured concern the dissolved and particulate
phases (adsorbed or solid) • Moreover, neither the polyphosphates nor
organic forms are measured although it would be interesting to know
more about them.
as regards the ammonia, there is no doubt that the easily degradable
forms (ex. urea, amines) play a major role in the nitrogen cycle. To
what extent can these forms interfere in the consumption patterns of
the actual measured forms (NH:, NO; + NO;) ? To what extent should a
prior UV irradiation stage, before analysis - as recently introduced
e.a. by UK teams - improve our knowledge in uptake mechantsms ?
- as regards the silica, one is faced with a fairly particular problem
considering the values of Si dissolved in the medium, one always
finds values lower than those expected from the thermodynamic balances
between the various solid forms (quartz, amorphous silica, carapaces
of diatoms, etc.) and silica in solution. This situation results
228
either from the absence of some solids or fram the biological activi
ties which prevent the balance being struck. Furthermore, one can ask
oneself if current analytic methods do not influence this balance in
such a way as to provide incorrect results. Inversely, could the
dialysis - which was already sometimes used and which is based on a
completely different prineiple of analysis - not provide more in
formation on this problem ?
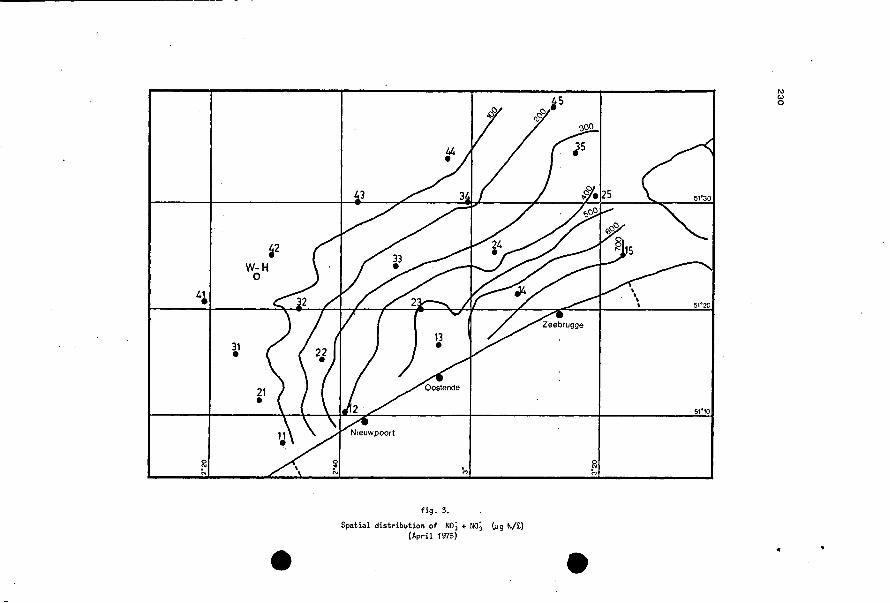
2.3.- Spatial and temporal variations in the concentrations of NO; , NO; ,NHZ ' PO;--, Si02 in the Belgian coastal zone
The data are drawn out fran internal reports (Mammaerts et al.,
personal ccmmunication 1977, loe.ei t.; Deeadt et al., personal cOlllDunication
1978, loe.eit.). These data give same idea of the major variations whieh
occurred in the Belgian eoastal zone in 1974, 1977 and 1978.
One can synthesize the information as follows
- during the periods of (May-June) and/or (August-September) there same
times occur very important peaks in coneentration as regards the (NO;
+ NO;) and the NH;. These peaks do not correspond to the overall summer
consumptlon-winter regeneration plan which ean be observed for the other
nutrients.
the variations (both spatial and temporal) in (NO; + NO;) and NH; are
more or less associated. This applies also to those of the PO~--and Si02 •
The behaviour of these two couples is however radieally different.
- regionally, the greatest values are always observed near the mouth of the
estuary (Sector III) outside the peak periods. The map with the sectors
is given in figure 2. The general trend is one of a decreasing coastal
offshore gradient (see figure 3). Inversely, when there is a seasonal
maximum. (peak) the highest values are observed offshore and to the west
(Sector II) • There is no longer a coast-offshore gradient, but high
concentration nuclei situated rather more offshore than on the coast cr
in the estuary (see figure 4).

o
'"N"•
•
32
34
fig. 2.
Belgian coastal zone (sec tors)
•
IV35•
o'";.,
51'30
5,'20
51'10
'"'"'"
;2
W-H0
4151·20
31•
21•51·'0
fig. 3.
Spatial distribution of NO; + NO; tJ,g Nil)(April 1978)
'"'"o

41.1000
•
.2WH
o500--__~
Hg. 4.
Spatial distribution of N0i + NO; (~g N/R.)(June 1978)
o'":.,
51'30
51"20
51'10

232
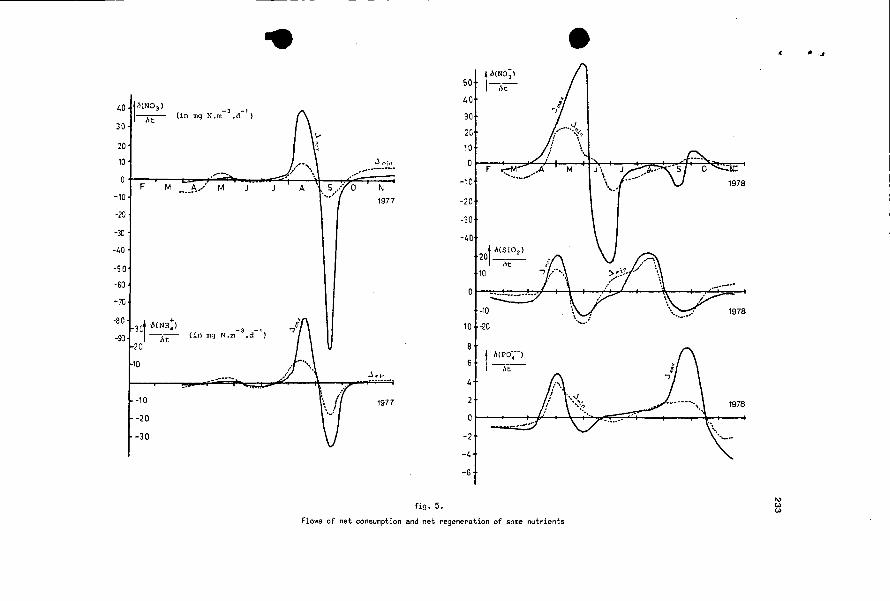
2.4.- Flows of net consumption and net regeneration implied by the concentration variations observed
The figure 5 obtained by calculating the first derived function of the
concentration curves show that the net consumption and regeneration of ni
trogen observed outside the springtime period largely exceed the minimal
primary productions they imply (especially in 1977).
On the other hand, the flows of consumption of N, P and Si obser
ved in the spring period of 1978 imply perfectly normal primary productions
and are in the N: P : Si proportions typical of living matter.
Ouring the important nitrogen peaks, one observes nothing in the water ~
column (turbidity, abnormal bacterial activity, chlorophyll) which could
cast light on this problem.
Moreover, there is no question of the Scheldt being such an important
source of nitrogen at certain times of the year, if only because of the
major dilution brought about by the mixture with North Sea waters.
2.5.- Conclusion
One could conclude this paragraph by bringing to mind certain re
comnendations (this list is by no means exhaustive) :
- fran the analytic point of view, it would be useful if current methods
were to have more specificity
- it would also be interesting to cross-check the results measured using
other methods in the dissolved and particulate phases. This is
particularly true for nitrogen (methods currently developed) •
- from the point of view of sampling strategy, there should be a way of
reducing the analysis time so as to be able to adapt the sampling
frequencies whenever a special phenomenon is observed.
References
DROOP, N.R•• 1973. Some thoughts on nutrient limitation in algae, J. PhyaoZ.,9, 264-272.
EPPLEY, R.W., COATSWORTH, J.L. and SOLORZANO, L., 1969. Studies of nitratereduction in marine phytoplankton, LimnoZ. and Ooeanogr., 14, 184-195.
•:u:1978
50th(NO;1
ht
40
30
20
10
F J "\
-10 \ ...... '
-20
-30
-40
1h(SiO,)20 ___ht
10
-10
10 -'20
I h(PO~'-)
.It
4
1977
-2
o N
1977
-3 -1(inmgN.m .d )
(in mg N.m-3 .d" )
M ••_t-...: M
-10
F
-20
-30
10
20
10
-10
-20
-50
-60
-7C
-6
fig. 5.
Flows cf net consumption and net regeneration cf some nutrients

234
•
•
FALKOWSKI, p.G. and STONE, D.P., 1975. Nitrate uptake in marine phytoplankton : energy sources and the interaction with carbon fixation, MarineBioZogy, 32, 77-84.
FOGG, G.E., 1971. Extra-ceZZuZar products of aZgae in freshwater, Ergebnisseder LimnoZogie, v, Elster & Ohle (Ed.), Schweizerbart, Stuttgart.
HARRISON, P.J. and DAVIS, C.O., 1977. Use of the perturbation technique tomeasure nutrient uptake rates of natural phytoplankton populations,Deepsea Research, 24, 247-255.
MOMMAERTS, J.p., 1978. Systeembenadering van een gesZoten marien miZieu, metde nadPuk op de POZ van het fytopZankton, Thesis, V.U.B., Brussels.
NIHOUL, J.C.J. and POLK, P., 1977. Chatnes tPOphiques et cycZes des nutrients,Rapport final du Projet Mer, vol. 8, Programmation de la Politique ~
Scientifique, Bruxelles. ...,
,