Embed Size (px)
Citation preview
Synthesis of Practices for Mitigating the Impact of Work Zones on Traffic
Final ReportJune 2007
Sponsored bythe Smart Work Zone Deployment Initiativea Federal Highway Administration pooled fund studyand the Midwest Transportation Consortiumthe USDOT University Transportation Center for Federal Region 7
Iowa State Universityrsquos Center for Transportation Research and Education is the umbrella organization for the following centers and programs Bridge Engineering Center bull Center for Weather Impacts on Mobility
and Safety bull Construction Management amp Technology bull Iowa Local Technical Assistance Program bull Iowa Statewide Urban Design and Specifications bull Iowa Traffic Safety Data Service bull Midwest Transportation
Consortium bull National Concrete Pavement Technology Center bull Partnership for Geotechnical Advancement bull Roadway Infrastructure Management and Operations Systems bull Traffic Safety and Operations
About the MTC
The mission of the University Transportation Centers (UTC) program is to advance US technology and expertise in the many disciplines comprising transportation through the mechanisms of education research and technology transfer at university-based centers of excellence The Midwest Transportation Consortium (MTC) is the UTC program regional center for Iowa Kansas Missouri and Nebraska Iowa State University through its Center for Transportation Research and Education (CTRE) is the MTCrsquos lead institution
Disclaimer Notice
The contents of this report reflect the views of the authors who are responsible for the facts and the accuracy of the information presented herein The opinions findings and conclusions expressed in this publication are those of the authors and not necessarily those of the sponsors
The sponsors assume no liability for the contents or use of the information contained in this document This report does not constitute a standard specification or regulation
The sponsors do not endorse products or manufacturers Trademarks or manufacturersrsquo names appear in this report only because they are considered essential to the objective of the document
Non-discrimination Statement
Iowa State University does not discriminate on the basis of race color age religion national origin sexual orientation gender identity sex marital status disability or status as a US veteran Inquiries can be directed to the Director of Equal Opportunity and Diversity at Iowa State University (515) 294-7612
Technical Report Documentation Page
1 Report No 2 Government Accession No 3 Recipientrsquos Catalog No
4 Title and Subtitle Synthesis of Practices for Mitigating the Impact of Work Zones on Traffic
5 Report Date June 2007 6 Performing Organization Code
7 Author(s) TH Maze and Jonathan Wiegand
8 Performing Organization Report No
9 Performing Organization Name and Address Center for Transportation Research and Education 2711 South Loop Drive Suite 4700 Ames IA 50010-8664
10 Work Unit No (TRAIS)
11 Contract or Grant No
12 Sponsoring Organization Name and Address US Department of Transportation Midwest Transportation Consortium Federal Highway Administration 2711 South Loop Drive Suite 4700 400 7th Street SW Ames IA 50010-8664 Washington DC 20590
13 Type of Report and Period Covered Final Report 14 Sponsoring Agency Code
15 Supplementary Notes Visit wwwctreiastateedu for color PDF files of this and other research reports 16 Abstract
Mobility and safety through work zones has become a prominent issue in work zone planning because motorists commonly expect minimal disruption to their normal driving habits However work zones can create unacceptable delays and queues if not adequately addressed
State transportation agencies (STAs) are currently working towards meeting the requirements of the Federal Highway Administrationrsquos Work Zone Safety and Mobility Rule 23 CFR Part 630 This rule requires STAs to systematically manage the impacts of work zones on federal-aid highways and other projects that have significant impact on road users STAs therefore use various congestion mitigation strategies in their transportation management plans
This synthesis identifies and discusses many frequently used strategies and many strategies that are relatively new to several agencies When developing transportation management plans a well-rounded and comprehensive group of strategies can be made to work together to mitigate work zone congestion to levels that are acceptable to motorists This synthesis thus provides a tool for STAs to use in the work zone planning stages of a project
17 Key Words congestion mitigation strategiesmdashwork zone mobilitymdashwork zone safety
18 Distribution Statement No restrictions
19 Security Classification (of this report) Unclassified
20 Security Classification (of this page) Unclassified
21 No of Pages
62
22 Price
NA
Form DOT F 17007 (8-72) Reproduction of completed page authorized
SYNTHESIS OF PRACTICES FOR MITIGATING THE IMPACT OF WORK ZONES ON TRAFFIC
Final Report June 2007
Principal Investigator TH Maze
Professor Department of Civil Construction and Environmental Engineering Iowa State University
Research Assistant Jonathan Wiegand
Authors TH Maze and Jonathan Wiegand
Sponsored by the Smart Work Zone Deployment Initiative
a Federal Highway Administration pooled fund study and the Midwest Transportation Consortium
the US DOT University Transportation Center for Federal Region 7
A report fromCenter for Transportation Research and Education
2711 South Loop Drive Suite 4700 Ames IA 50010-8664 Phone 515-294-8103 Fax 515-294-0467
wwwctreiastateedu
TABLE OF CONTENTS
ACKNOWLEDGMENTS IX
1 INTRODUCTION 1
2 METHODOLOGY 2
3 WORK ZONE CONGESTION MITIGATION STRATEGIES 3 31 Traffic Management Strategies3 32 Demand Management Strategies 19 33 Alternative Project Scheduling and Phasing Strategies26 34 Design Alternatives to Minimize Life-Cycle Congestion Cost Strategies 33 35 Project Delivery Methods and Contracting Methods 40
4 CONCLUSIONS47
REFERENCES 48
v
LIST OF FIGURES
Figure 1 Tasks required for an incident (Balke and Ullman 1992) 4 Figure 2 Portable sign gantries in the Netherlands (Steinke et al 2000) 9 Figure 3 Examples of delay and travel time estimation system displays (FHWA 2001b) 10 Figure 4 Three-phase message on I-55 Lake Springfield Bridge (FHWA 2004c) 11 Figure 5 Navigator the Georgia DOTrsquos trip time estimation system (Georgia DOT 2006)11 Figure 6 Des Moines Metro Area travel information and camera locations
(Iowa DOT 2007)13 Figure 7 Example of deterministic queuing theory (Maze Burchett and Hochstein 2005) 15 Figure 8 Maximum queue length thresholds for work zones with lane closures Ohio
(FHWA 2003b) 18 Figure 9 Ohio DOT permitted lane closure calculation spreadsheet (Ohio DOT 2006) 19 Figure 10 DelDOT illustration showing that one full bus will remove 45 cars
from the road (FHWA 2001b) 20 Figure 11 Screenshot from avoidtherushorg21 Figure 12 Blanchette Bridge during reconstruction25 Figure 13 TransOptions for the Denver Metro Area (TransOptions 2006)26 Figure 14 Glare of winter lighting (from Bryden 2004) 28 Figure 15 Prefabricated panels used at the Tappan Zee Toll Plaza in New York 37 Figure 16 Placement of a prefabricated steel truss on Church Street Bridge 38 Figure 17 Barges floating a prefabricated segment to installation location 39
vii
ACKNOWLEDGMENTS
This report was generated for a project funded by the Smart Work Zone Deployment Initiative and the Midwest Transportation Consortium The authors are grateful to have had the opportunity to work on this project and to get a sense of what state transportations agencies (STAs) are doing around the United States We hope that this research will offer direction for STAs trying new strategies and provide STAs with information regarding strategies tried by their peer agencies
We are also grateful to several individuals These include Tom Notbohm of the Wisconsin Department of Transportation Jerry Roche of the Iowa Division of the Federal Highway Administration Mark Bortle of the Iowa Department of Transportation Daniel E Sprengeler of the Iowa Department of Transportation Tracy Scriba of the Headquarter Office of the Federal Highway Administration and Jim Brachtel a retiree from the Iowa Division of the Federal Highway Administration We would also like to thank those who participated in our survey The list of individuals is too long to print here
ix
1 INTRODUCTION
Mobility and safety through work zones has become a very prominent issue in work zone planning because motorists commonly expect minimal or no disruption to their normal driving habits The congestion created or amplified by lane closures in work zones can create unacceptable delays and queue lengths if not adequately addressed In order to manage or minimize these potentially congested conditions state transportation agencies (STAs) utilize various congestion mitigation strategies in their transportation management plans (TMPs)
To address traffic congestion STAs are currently working towards meeting the requirements of the Federal Highway Administrationrsquos (FHWA) Work Zone Safety and Mobility Rule 23 CFR Part 630 (FHWA 2004a) This rule requires STAs to systematically manage the impacts of work zones on federal-aid highways and other projects that have significant impact on road users One of the objectives of the rule is to help STAs develop TMPs for projects that can maintain acceptable levels of mobility and safety through a work zone by using transportation management strategies Potential strategies that may be included in TMPs are those that an STA feels would benefit the project Many of these strategies are included in this synthesis
1
2 METHODOLOGY
This synthesis of strategies includes a review of the literature regarding each strategyrsquos beneficial attributes in terms of reducing work zone congestion on freeway facilities For each strategy the key components and applicable benefits and costs are summarized To further illustrate the role each strategy plays in mitigating work zone congestion case studies are summarized to show the beneficial utilization of the strategy on projects throughout the United States and Europe
2
3 WORK ZONE CONGESTION MITIGATION STRATEGIES
This chapter identifies strategies that one or more STAs have used to mitigate work zone congestion The strategies can generally be grouped into five different categories
1 Traffic management strategies 2 Demand management strategies 3 Alternative project scheduling and phasing strategies 4 Design alternatives to minimize life-cycle congestion costs strategies 5 Alternative contracting and project delivery strategies to accelerate project completion
Each of these categories will be discussed below
31 Traffic Management Strategies
The objective of traffic management strategies is to manage the impacts imposed on motorists by work zones This is done by providing an acceptable level of mobility through or around a work zone while maintaining adequate levels of safety for motorists and workers This section summarizes the use of five traffic management strategies
1 Increased incident management and removal capabilities during construction 2 Increased enforcement during construction 3 Use of intelligent transportation systems (ITS) technologies to divert traffic or defer trips
to less congested times 4 Work zone traffic simulation 5 Lane closure policies and guidelines
The strategy ldquolane closure policies and guidelinesrdquo is not necessarily a traffic management strategy but rather a planning strategy used in the project development process However it has been included in this section because of the beneficial planning aspect it provides for better managing the impacts of work zones on traffic
311 Increased Incident Management and Removal Capabilities during Construction
Background
The definition of traffic incident management is ldquothe systematic planned and coordinated use of human institutional mechanical and technical resources to reduce the duration and impact of incidents and improve the safety of motorists crash victims and incident respondersrdquo(FHWA 2003a) Figure 1 shows the typical phases of incident management from incident occurrence detection and response to incident clearance Because a work zone involving lane closures or restrictions already represents a traffic bottleneck an incident within a work zone can considerably exacerbate an already congested condition Further because of reduced horizontal clearances due to barriers separating the traffic lanes from the construction work clearing an
3
incident may be more difficult than under normal conditions where response teams have shoulders and medians that can be used to position equipment and clear disabled or wrecked vehicles Strategies that can be employed to reduce the time required for each of the phases of incident management helps reduce delay improves traffic flow increases safety and reduces the overall duration of the project
Generally delay is thought to increase geometrically with increasing time until clearance (Robinson 1989) In other words if 30 minutes rather than 15 minutes is required to clear an incident the doubling in time until clearance results in a delay that is not twice as long but four times as long This geometric increase in delay with time until clearance highlights the need for swift and effective management of incidents
Figure 1 Tasks required for an incident (Balke and Ullman 1992)
To support the special incident management requirements of work zones particularly on high-volume roadways state and local transportation agencies have created work zone incident management strategies that range from developing per-set plans for local incident responders to organizing and equipping special incident management teams Below are some examples of strategies used by STAs to management incidents in the work zones of highway reconstruction projects
Hofener (2003) performed a survey of transportation agencies to identify the state of the practice of work zone incident management Each of the survey respondents identified one area that illustrated the most effective practice among their incident management strategies The California Department of Transportation (Caltrans) Division of Maintenance identified early intervention by law enforcement and utilization of dynamic message signs (DMSs) The District 11 Transportation Management Center in Caltrans dispatches traffic management teams and highway patrols to establish command at the incident These teams then determine whether there is a need for other personnel equipment detours etc The Maryland State Highway
4
Administration uses well-defined roles and responsibilities along with efficient lines of communication through the sharing of communication frequencies by all agencies required for incident response The Ohio Department of Transportation (ODOT) uses pre-specified alternate routes a priority contact list and incident management debriefing meetings
Implementation Examples
The FHWArsquos Work Zone Operations Best Practices Guidebook lists a set of best practices for incident management from various state DOTs and FHWA offices (FHWA 2000) The best practices can be broken into four topics towing services service patrols emergency response coordination and contractor relations and responsibilities While other STAs may be using these best practices the Guidebook provides the following examples of the four techniques
Towing Services bull California uses a designated towing service responsible for keeping a work zone free of
disabled vehicles bull Pennsylvania uses a tow truck through motorist services on long-term freeway work
zones
Service Patrols bull Illinois and Indiana report using an emergency traffic patrol to assist motorists with
vehicle problems such as flat tires running out of gas overheating etc and to facilitate incident clearance
bull Indiana also advises motorists of crash-related congestion through highway advisory radio (HAR) variable message signs (VMS) and pagers from the scene of the incident through its Hoosier Helper
Emergency Response Coordination bull North Carolina and Pennsylvania require meetings between representatives from
emergency response agencies or between agencies and DOTs prior to or during a project bull Utah uses a cooperative effort involving all emergency response agencies private sector
companies such as trucking associations involved in the design and evaluation of the traffic control plan and the media
Contractor Relations and Responsibilities bull Iowa requires the contractor to traverse the work zones and provide assistance bull Mississippi writes special provisions within the contract to encourage the contractor to be
more active in the incident management process bull Utah has the contractor provide the service with courtesy vehicles to implement proper
measures to clear the lane
I-25 and I-225 T-REX Project Denver Colorado During the Transportation Reconstruction and Expansion (T-REX) Project on I-25 and I-225 in the Denver metro area in June 2001 four Action Groups consisting of 35 to 70 agency representatives developed an incident management plan specific to the project (Noyes 2002) The Command and Communications Action Group wanted to improve communications between agencies acting in a command
5
capacity and the response units while enhancing the current agency procedures developed prior to the T-REX project The incident response procedures were changed to meet the needs of a quick and efficient response and training was conducted to inform all pertinent agencies The group also stressed the promotion of the Colorado state statute that requires motorists to move their vehicles off the travel way if there are no injuries or alcohol involved in the incident The group also recommended an incident information management system that could provide necessary information to response agencies when incidents were detected and monitored in the project area The Alternate Routes Action Group developed alternate routes to be used during a complete closure or a lane closure for more than two hours A list of the response agencies that would be affected around the project of area was also compiled The Technology and Resources Action Group recommended locations for ITS devices such as closed circuit televisions DMSs and a HAR to support incident detection and response and the implementation of alternate routes or other motorist information The Public Information and Media Action Group recommended public education campaigns media packets mass faxes a project website and telephone information lines The final product of this effort was the T-REX Incident Response Manual that was distributed to all response agencies in the corridor followed by agency training to ensure manual familiarity
Marquette Interchange Milwaukee Wisconsin Cyra (2002) a consultant to the Wisconsin Department of Transportation (WisDOT) described the process the Marquette Interchange Traffic Operations Task Force used in developing operation concepts for the Marquette Interchange reconstruction project which involved I-94 I-43 and I-794 The operations were planned through four scenario exercises in which various agencies defined their roles and responsibilities and in which particular response and operational issues were identified The four scenarios included everyday operation a major incident within the interchange a major incident near the interchange and operations under major special event traffic conditions From the scenarios the task force identified a list of anticipated operational impacts and needs Through the scenario process the task force also identified strategies for which further refinement of the response would be considered if the scenario were to occur
Woodrow Wilson Bridge Washington DC The goals of the incident management plan proposed to support the Woodrow Wilson Bridge in the Washington DC area were to keep traffic moving while maintaining public safety maintain pre-construction incident management times reduce the potential for secondary incidents and reduce the potential for motorist injuries (Arch 2002) To facilitate driver detection and verification extensive signing that informed motorists to use the 77 number to report incidents and special post markers of less than one-mile increments to improve location information were both suggested The work zone also had state police and DOT officials present 24 hours per day 7 days per week A compatible cellular phone communication plan was established and the Maryland and Virginia incident management teams were given compatible two-way radio communications systems Digital cameras were suggested for police officers investigating crashes to help expedite the clearance of the incident A full-time person was to be responsible for incident management and construction management activities Another goal was maintaining a full shoulder for as long as possible on the beltway along with temporary emergency pull-off areas thus allowing disabled vehicles and vehicles being cited by law officers the opportunity to pull out of the travel lanes
6
I-40 and I-25 Big I Interchange Albuquerque New Mexico The reconstruction of the Big I interchange between I-40 and I-25 in Albuquerque New Mexico was performed by the New Mexico State Highway and Transportation Department now the New Mexico Department of Transportation (NMDOT) During the project a case study was done on the incident management system used (FHWA 2004b) A system was installed for incident detection and verification and as a method for disseminating information to motorists about possible delays The system consisted of eight cameras eight modular DMSs four dynamic arrow signs four portable DMS trailers four portable traffic management systems used to integrate the cameras and DMSs four highway advisory radio units and a website to inform motorists who were not on the roadway NMDOT staff monitored traffic conditions through the cameras detected incidents initiated appropriate incident response and distributed traffic information through the DMSs personal traveler information and media outlets NMDOT also purchased two Highway Emergency Lender Patrol Program trucks that the contractor operated from 500 am to 800 pm Monday through Friday which helped stranded vehicles and directed traffic to use other lanes with an arrow board These vehicles helped over 10000 vehicles during the project duration decreasing the time minor incidents occupied travel lanes This incident management system reduced response and clearance time to 25 minutes compared to the 45-minute historical durations
312 Increased Enforcement during Construction
Background
The Center for Transportation Research and Education (CTRE) has conducted studies on the use of added law enforcement in work zones and found that added enforcement always ranks as the most effective strategy for reducing speeds through work zones and controlling errant reckless and aggressive driving behavior (Kamyab et al 2003) The Work Zone Safety Toolbox produced by the Maryland State Highway Administration provides the primary reasons for using police in work zones police presence encourages speed control the presence of the police alone increases motoristsrsquo compliance with work zone signage and discourages aggressive or careless driving and officers can quickly respond to incidents in the work zone and direct traffic in an efficient manner (Maryland SHA 2005) The presence of a uniformed officer can also encourage greater motorist alertness to hisher surroundings which leads to a better compliance with the traffic control signs The Toolbox also states that speeds are decreased upstream and at the location of the officer while the speeds often increase again downstream In addition the percentage of traffic merging in advance of the lane closure is increased
Although many professionals believe that work zone enforcement has a positive impact on safety little hard data are available to quantify the impacts of added enforcement Since most STAs contract with the state or local police for added enforcement with funding typically from either project funds or a special STA account for this purpose it sometimes becomes difficult without solid benefit information to justify the added cost See the synthesis of STA practices in Maze Burchett and Hochstein (2005)
Three common forms of police presence are often used in work zones The first is a stationary police vehicle which may be using its lights andor its radar The second form is a police traffic
7
controller where a uniformed officer stands at the side of the road near a speed limit sign motioning for traffic to slow down This may be one of the least effective methods as there is no indication that there is a chance of a motorist being caught disregarding the speed limit or a lane merge location A third form is the use of a cruising vehicle This however only encourages compliance in the area of the vehicle and the vehicle is not always near the location where compliance is most desired (Maryland SHA 2005)
313 Use of ITS Systems to Divert Traffic or Defer Trips to Less Congested Times
Background
The objectives of ITS are to improve transportation safety and productivity through computers electronics and communications One the key components of ITS is traveler information In this case the ITS infrastructure would inform travelers that a highway on their planned route has a work zone lane closure or restriction and could even warn the traveler of delays through the work zone encouraging the traveler to choose a different route or to travel at a different time Traveler information can be provided either to travelers pre-trip or en-route Pre-trip information may be delivered by television the Internet email pagers telephone (eg 511) or through other devices and en-route information may be provided by many of the same devices and other devices generally considered part of freeway management such as HAR and DMS
These systems are not always successful at diverting traffic but they often reduce driver frustration by allowing drivers to know the amount of delay they should expect A survey was conducted for the North Carolina Department of Transportation (NCDOT) that involved 333 drivers who passed through a work zone with a DMS that predicted work zone delay on I-95 (Bushman and Berhelot 2005) While only about 60 of travelers who drove through the work zone infrequently would use the information sometimes or more often to assist in route selection over 93 of infrequent travelers supported the use of such systems As the survey results show even though drivers may not use to the information to make trip decisions they appreciate the information
Dynamic Message Signs
DMSs display real-time traffic conditions and other motorist information The messages display traffic conditions that the motorist will encounter or suggest the use of alternative routes or identify a specific alternate route The messages may be changed as needed to reflect variable traffic conditions and changes within the work zone The signs are commonly linked wirelessly to a variety of possible locations such as a traffic management center computers used on the site or other agencies that dictate the messages used Signs that display a more static message one that will not change often during a project can be programmed on-site through the signrsquos keypad if available In the United States most DMSs are located on trailers on the side of the road or on permanent overhead fixtures Other countries (eg the Netherlands) are known to uses portable sign gantries A drawing of a portable overhead sign is shown in Figure 2 The signs are on trailers with an attached attenuator and are set up on the side of the road or shoulder and the gantry is swung into place over the lanes The sign sits about 5 m above the roadway The benefit of these portable signs is that they are easy to install in about 15 minutes traffic does
8
not need to be shifted or stopped during installation and the signs are visible at a distance of 800 to 1000 m (Steinke et al 2000)
Figure 2 Portable sign gantries in the Netherlands (Steinke et al 2000)
I-40 Eastern Arkansas The Arkansas State Highway and Transportation Department (AHTD) used an automated traffic management system during an I-40 reconstruction project The system was utilized to help reduce the work zone impact on neighboring Memphis Tennessee The system provided information to motorists at locations where the motorists could decide to take alternate routes The AHTD could also use the detected traffic conditions to better understand when peak travel periods would occur to avoid having the road closures during those times (FHWA 2001a)
I-95 Fayetteville North Carolina In 2002 NCDOT deployed its first smart work zone on I-95 north of Fayetteville The system consisted of sensors that collected traffic data and estimated delay When a pre-set delay threshold was surpassed the system displayed alternate route information on the DMS units Cameras were also used by NCDOT for verification Prior deploying this system queues were experienced ahead of the work zone for several miles sometimes for more than five miles After implementation the longest queues were reduced to two miles or less (Scriba 2004)
Travel Time and Delay Estimation Systems
Various methods of informing drivers planning a trip or motorists approaching the work zone are available one of which is a travel time or delay estimation system A travel time estimation system uses real-time traffic data and computer software to predict the current travel time on a section of roadway The information from this system can be disseminated to motorists through DMSs over the Internet or via a pager cell phone or PDA Informing motorists of relevant
9
estimated travel times allows the drivers to make an informed decision as to which routes to take
The systems used by the Maryland State Highway Administration either use microwave traffic sensors to collect traffic data along the section of roadway being monitored or video image recognition (Maryland SHA 2005) The microwave sensor data is sent to a computer that calculates the current travel times based on the speed and volume data The video image system tracks individual vehicles between two points which can lead to a more accurate travel time estimation because the time recorded is the actual travel time of a vehicle DMSs can be placed every few miles as necessary to provide continuous updated information through the work zone The Maryland State Highway Administration also suggests that one of the messages on the DMS shows the current time to let motorists know that the data is current
A DMS may display the estimated duration of the delay shown on the left in Figure 3 andor the estimated travel time shown on the right in Figure 3 along with a relevant warning message The delay estimation displays the time that a vehicle would be expected to wait to be able to traverse the work zone This method lets the motorist decide whether the delay is tolerable or an alternate route should be used Through a European scanning tour sponsored by the FHWA it was found that Scotland and France use DMSs to display the duration of the delay (Steinke et al 2000) Similarly a travel time estimation system provides the estimated time it would take a motorist to travel through the work zone providing pertinent information for the motorists to decide whether an alternate route is desired
Figure 3 Examples of delay and travel time estimation system displays (FHWA 2001b)
I-55 Lake Springfield Bridge Springfield Illinois In the reconstruction of the I-55 Lake Springfield Bridge in Illinois a real-time traffic control system was used to help reduce congestion The system consisted of DMSs portable traffic sensors and portable closed-circuit television cameras linked to a central work station The sensors collected information on a traffic queue if present and the system server calculated the traffic volume and traffic speeds The information was then placed within preset threshold limits and the necessary messages were displayed on the DMSs An example is shown Figure 4 The system was primarily automated and human intervention was rarely needed The Illinois Department of Transportation reported
10
no significant traffic backups for the duration of the project This may have been due to the 17 DMSs placed upstream up to 40 miles from the bridge in both directions (FHWA 2004c)
Figure 4 Three-phase message on I-55 Lake Springfield Bridge (FHWA 2004c)
Navigator Georgia Department of Transportation An example of an Internet-based travel time estimation system the Navigator system from the Georgia Department of Transportation (GDOT) is shown in Figure 5 (GDOT 2006) Travelers pick two points and the system gives the distance estimated travel time and travel speed Because the travel times are based on monitored traffic conditions the estimated travel times adequately reflect experienced conditions and can account work zone congestion If travel times are deemed unacceptable to a motorist heshe may choose an alternate route which also reduces the demand on the congested route The public can also look on the agencyrsquos website to find a historical database of typical travel times during certain times of the day
Figure 5 Navigator GDOTrsquos trip time estimation system (GDOT 2006)
11
Advanced Speed Information System
Another method of informing motorists upstream of the traffic conditions near and through the work zone is an advanced speed information system An advanced speed information system uses microwave traffic sensors to detect vehicle speeds as the vehicles pass the sensor The downstream speed information is then sent to and displayed on an upstream DMS and it can also be displayed on the Internet or sent to pagers cell phones and PDAs The objective of displaying the downstream speed condition is to alert motorists of possible reduced speeds which can potentially help reduce vehicle speed differentials and the probability of rear-end collisions Motorists can also change their trip route based on speed information thus reducing demand at the congested location Multiple DMSs can be placed throughout and upstream of the work zone The Maryland State Highway Administration provides the following examples of messages displayed on the DMSs for varying downstream speeds (Maryland SHA 2005)
bull Free-flow speed ldquoSpeed Limit 65 mphrdquo bull Congested conditions with speeds ranging from 30 to 50 mph ldquoReduce Speedrdquo and
ldquoSpeed Ahead XX MPHrdquo bull Heavy congestion with speeds ranging from 0 to 30 mph ldquoTraffic Backup Aheadrdquo and
ldquoStay Alertrdquo
In another example of an advanced speed information system Horowitz and Notbohm (2003) from the University of Wisconsin Milwaukee and from WisDOT respectively evaluated Intellizone on US 41 in Green Bay Intellizone gives advanced warning to drivers of slowing traffic entering work zones by using microwave sensors to measure traffic speeds and DMSs to disseminate the information to the drivers all of which systems are linked by wireless communication The study consisted of providing drivers with questionnaires when they stopped downstream at gas stations after passing through the work zone It was concluded that the drivers felt satisfied with the accuracy of the messages displaying the speeds
Traffic Conditions on the Internet
The data collected by traffic surveillance technologies can be used to provide real-time traffic conditions on a project web page or agency web site A person can go online and view traffic conditions for pre-trip preparation Project web pages can also identify alternate routes on an online map or help plan a trip from one location to another to avoid the congested work zone Many STAs have real-time updates of road conditions showing incidents work zones traffic conditions and road conditions For example the Iowa Department of Transportationrsquos (Iowa DOTrsquos) traveler information website for Des Moines Iowa is shown in Figure 6 (Iowa DOT 2007) The left screenshot is the Iowa DOTrsquos 511 traveler information website featuring the Des Moines metro area Each icon will display embedded information on the type of alert when the mouse is passed over it The right screenshot is of the traffic cameras that allow people to view facility conditions By utilizing the current technology in place a motorist is able to view the current work zones and traffic conditions in and around the work zone to better plan a trip
12
Figure 6 Des Moines Metro Area travel information and camera locations (Iowa DOT 2007)
314 Work Zone Traffic Simulation
Background
Through traffic simulation modeling project planners and designers can forecast the impacts of work zones on traffic congestion and traffic flow Through the simulation the designer and planner identify a desirable plan in a simulated environment minimizing road user costs (delay and possibly crash costs) and construction and traffic control costs Therefore by conducting modeling project planners and designers should be able to make better decisions regarding work zone design and the strategies necessary to mitigate work zone impacts However in reality very few work zones require the use of sophisticated simulation models because the projects can be handled using typical or standard work zone designs Because they are seldom needed particularly in rural states it is difficult to justify the development of in-house staff expertise to conduct modeling and only very large projects can absorb the large fixed cost associated with hiring a consultant to conduct simulation modeling to measure work zone impacts
It is commonly accepted that modeling will result in at least the ability to examine more possible solutions than would be possible without modeling The ability to examine more solutions is likely to result in better solutions The question then becomes one concerning the trade-off between the resources needed to conduct modeling and these resourcesrsquo value if used elsewhere
Simulation modeling methodologies used to measure the impacts of work zones can be categorized by three dimensions (The following text is taken from a prior report by Maze Burchet and Hochstein 2005) The first dimension is the queuing model used most simple procedures use deterministic queuing models The second is whether the model treats vehicles in the model as individual entities sometimes called microscopic simulation models or traffic is treated as a continuous flow known as macroscopic models Lastly some models have network capabilities in which vehicles can flow through the model along multiple paths The most sophisticated network models used to examine work zones have the capability to distribute trips
13
along paths within the network based on internal algorithms while simpler models require that the modeler distribute trips by hand Each of these variations of simulation modeling is explained in the following subsections
Macroscopic Methods Deterministic Queuing
Three macroscopic methods apply to modeling queues These are steady state queuing models and a shock wave queuing model which uses deterministic queuing In this section we will discuss only the deterministic queuing model A reader looking for a comparison of all three should see Maze Schrock and VanDerHorst (1999) and Dixon and Hummer (1995)
Because of its simplicity and elegance deterministic queuing is most commonly used for model work zone queuing A deterministic model of queuing is used by the Transportation Research Boardrsquos Highway Capacity Manual to determine delay due to lane closures Memmott and Dudek (1982) applied deterministic queuing to work zones in 1982 and their method has been incorporated into the computer model QUEWZ which is used by several STAs to determine expected delays at work zone lane closures queue lengths and user costs
The underlying assumption of this model is that when the number of vehicles arriving exceeds the capacity the difference between the arrival rate and the capacity is the number of vehicles stored in the queue An example of deterministic queuing is shown in Figure 7 Figure 7 assumes that the bottleneck has a capacity of 1400 vehicles per hour (VPH) Starting at time zero there is no queue but a queue begins to build because the arrival rate (2000 VPH) exceeds the discharge rate (1400 VPH) At the end of one hour there are 600 vehicles queued upstream of the bottleneck Figure 7 then shows the arrival rate dropping to 800 VPH after one hour at point B The discharge rate now exceeds the arrival rate and the queue begins to dissipate At the end of two hours the queue has subsided The number of vehicle-hours of delay the bottleneck imposes is the area of the triangle formed by points A B and C Knowing the number of vehicles in the queue the length of the queue can be determined by equation (1)
Dt = LtNl
(1)
where Dt = The length of the queue at time t L t = The number of queued vehicles at time t l = The average length occupied by a vehicle N = The number of lanes upstream from the lane closure
14
1 2
Veh
icle
s C
umul
ativ
e ov
er T
ime
200
0 2
800
2000 vph arrival rate
1400 vph queue discharge rate
B 1
000
600 vehicles
800 vph arrival rate C
A
Time (hours)
Figure 7 Example of deterministic queuing theory (Maze Burchett and Hochstein 2005)
Dixon Hummer and Rouphail (1998) point out that the difficulty with the deterministic approach is that it estimates the queue at a single point In other words the model treats the vehicles stored in the queue as if they were stacked vertically rather than distributed across a length of road upstream from the lane closure Therefore the behavior of the queued traffic upstream of the lane closure is not influenced by the lane closure
Methods from the Transportation Research Boardrsquos Highway Capacity Manual QUEWZ and its derivative models including QUEWZ3 QUEWZ-85 QUEWZ-92 and QuickZone all use a deterministic queuing model to estimate queue length and delay Other agency-specific models have been built based on a similar methodology with inputs and outputs customized for the agency For example ODOT uses an agency-developed spreadsheet-based model for estimating work zone impacts (Schnell and Aktan 2001) All versions of QUEWZ assume a closed network meaning that all vehicles entering the simulation can only be discharged by going through the deterministic queuing model QuickZone is a more sophisticated model that allows the user to create a network but the principle model used to estimate delays and queue length is the deterministic queuing model However because QuickZone is a network model it can estimate delay for an entire corridor and the model can run network-level scenarios where traffic is diverted to parallel routes (detours) The user specifies the propensity for drivers to divert to a detour Since manual input is required to estimate the network impacts of a lane restriction (a lane closure) the size of the network and the estimation of the impacts within the network may be limited to the mainline where work is being constructed and a few parallel diversion routes This makes QuickZone applicable to many urban applications and almost all rural applications but not to major closures in dense networks For example in the MinneapolisSt Paul metropolitan area the Mississippi River bisects both core cities In 2004 the Minnesota
15
Department of Transportation (MnDOT) had construction andor maintenance work scheduled for the bridges on all three of the interstate and interstate-like roadways crossing the river on the St Paul side of the metropolitan area The result was simultaneous lane closures for a few weeks on all three structures Lengthy backups were experienced Estimating such significant and complex network effects in the MinneapolisSt Paul Metropolitan highway system is significantly beyond the capabilities of QuickZone
Microscopic Simulation without Network Trip Distribution Capabilities
Microscopic simulation generates vehicles as individual entities operating within the simulated environment Each vehicleentity is assigned properties and moves through the traffic stream following predefined rules The interaction between vehicles is defined by car-following and lane-change algorithms Very popular microscopic simulation packages include the FHWArsquos CORSIM software package (available from McTrans 2007) and SimTraffic (available from Trafficware Ltd 2007) part of the Synchro software package (Other software packages with trip distribution capabilities will be discussed later) Both of these software packages have no capabilities to distribute trips through the network independently of the operatorrsquos input As a result the operator must input traffic patterns including turning movements at intersections In other words to understand the network impacts (diversions of traffic to alternative routes) the modeler must input changes to the traffic patterns to estimate the network impacts of work zone-caused lane restrictions Because these software systems do not have dynamic trip assignment capabilities it is difficult (or impossible) to model dynamic traffic impacts in complex networks
To overcome these difficulties Anderson and Souleyrette (1998) integrated CORSIM with Tranplan (a regional travel demand model) Tranplan includes a macroscopic model that distributes trips through the network based on link travel times The process begins with the initial travel patterns the travel times experienced by traffic are estimated using CORSIM and the travel times are then fed back into Tranplan where the trips are redistributed to the network based on the travel time provided by CORSIM The new trip distribution is fed into CORSIM and the link travel times are re-estimated The two models interact with each other until the flow on links in the network converges to a constant volume This is a convoluted method for getting around the weakness of CORSIM
Schnell Mohror and Aktan (2002) using an Ohio-based scenario compared CORSIM and SimTrafficrsquos simulation results for traffic delay and work zone queue length to the actual performance measured in the field They found that CORSIM and SimTrafficrsquos estimates of queue length were less precise than more simple models like QUEWZ This is partially because the car-following algorithms and lane-change algorithms used in CORSIM were not developed for the work zone environment However in a later paper Chitturi and Benekohal (2005) compared QUEWZ FRESIM (the freeway simulator in CORSIM) and Quickzone and found that none of these programs offer accurate estimates of queue length during work zone restrictions
16
Microscopic Simulation with Network Trip Distribution Capabilities
Advanced microscopic traffic simulators are available that have dynamic trip assignment capabilities Several microscopic simulation software packages have dynamic trip assignment capabilities that make them an ideal environment for measuring the network impacts of work zone-related lane closures No literature was found that identifies a comprehensive list of microscopic simulation applications that have dynamic assignment capabilities for analyzing work zones in complex highway networks One of the first known large-scale applications was used to study the traffic impacts of the reconstruction of I-15 through Salt Lake City Utah in the late 1990s The Salt Lake City study used a simulation software package with dynamic trip assignment named INTEGRATION (Rakha et al 1999) After the 1999 death of the developer of INTEGRATION Michel Van Aerde other software packages have evolved that provide much better graphical output and more user-friendly interfaces
Other microscopic simulation packages were identified in SMARTEST a European commission project that was completed in 1997 At the time the researchers identified 56 microscopic traffic simulation packages and evaluated 32 of these packages (Algers et al 1997) Since then more simulation packages have been created According to Ken Fox a simulation expert (Fox 2007) the ones that seem to be gaining the most commercial success are AIMSUN (by TSS Barcelona) DRACULA (by University of LeedsWS Atkins) HUTSIM (by Helsinki University of Technology) Paramics (by SIAS amp Quadstone Edinburgh) and VISSIM (by PTV Karlsruhe) All of these packages have dynamic trip assignment capabilities These systems have much more robust capabilities than SimTraffic or CORSIM but they also require more user inputs are more labor-intensive to set up and require more expertise to use
Another advanced microscopic simulation package MITSIM is being used by the Iowa DOT and the Des Moines Metropolitan Planning Organization (MPO) to model the traffic impacts of I-235 reconstruction in Des Moines Iowa (Anderson Kane and Jha 2003) MITSIM is a product of the Massachusetts Institute of Technologyrsquos MITSIMlab The MITSIMlab is a laboratory that evaluates the impacts of alternative traffic management system designs at the operational level and assists in subsequent refinement The model was implemented by a consultant to the Iowa DOT Jacobs Civil Inc and is operated by the Iowa DOT and Des Moines MPO To date no evaluation has been performed of the MITSIM application in Des Moines
315 Lane Closure Policies and Guidelines
Background
To help minimize traffic congestion highway agencies may require certain policies and specifications concerning lane closures on highway construction projects Some of these policies specify the time of day a lane may be closed the length of time it may be closed the length of the lane closure and the number of lanes allowed to be closed at one time The policies are set for different functional classes of highways based on average daily traffic (ADT) counts The objective is to maintain a sufficient number of lanes to minimize delay and congestion upstream and through the work zone
17
The Work Zone Operations Best Practices Guidebook (FHWA 2000) identifies several policies that DOTs use to manage lane closure characteristics
bull The Florida Department of Transportation (FDOT) tries to maintain the existing number of through travel lanes in the work area with a minimum of two through lanes in each direction This policy applies to specific phases within the project and the traffic volumes dictate when and where the lane closures can be applied and their duration
bull Massachusetts applies a 12-minute delay rule in which an analysis is performed during the design phase based on existing traffic volumes and the projected capacity reductions due to lane closure When the calculated delay approaches 12 minutes alternative measures are considered
bull In North Carolina lane closure lengths are limited to one to two miles based on traffic volumes percent grade and directional travel demand
bull The Pennsylvania Turnpike Commission specifies that traffic control measures that require lanes to close need to be removed when the contractor is not working This rule is usually applied to milling and paving projects and it encourages the contractor to work multiple shifts to avoid having to remove barrels or barriers from the roadway
bull In California a disincentive specification is in place for contractors failing to remove lane closures by the prescribed time each day A fee is assessed for each 10-minute increment past the specified time when the lane closure was to be removed
bull Mississippi restricts the length of active work zones to one mile on interstate highways and two miles on primary routes Similarly if multiple lane closures are needed they must be within the allowed active work zone length The objective of this policy is to eliminate unnecessary lane closures and regain capacity by not allowing the contractor to open up or work on the entire section of the project with little or no progress being made
bull ODOT has developed a Permitted Lane Closure Map (FHWA 2003b) which displays times for permitted lane closures that will not cause long queues throughout the week on interstates and freeways Figure 8 shows the maximum queue length thresholds for work zones with lane closures allowed by ODOT According to ODOT queues less than 34 mile are acceptable queues between 34 and 1 12 miles are acceptable for two hours or less and queues greater than 1 12 miles are not acceptable
Figure 8 Maximum queue length thresholds for work zones with lane closures Ohio (FHWA 2003b)
18
bull Ohio also limits lane and ramp closures to certain times of day based on traffic volumes throughout the state (ODOT 2006) Figure 9 is the spreadsheet used by ODOT to determine when lane closures are permitted
Figure 9 ODOT permitted lane closure calculation spreadsheet (ODOT 2006)
32 Demand Management Strategies
This section identifies demand management strategies that are used to reduce traffic volumes throughout the facility with a work zone This is done through various strategies whether by altering motoristsrsquo typical trip characteristics or by removing vehicles from the facility and surrounding network The strategies identified in this section are as follows
1 Improved transit on transit lines parallel to the work zone 2 Improved traveler information regarding work zone traffic to induce travelers to better
manage trips and reduce congestion 3 Demand-side traffic management strategies
19
321 Improved Transit on Transit Lines Parallel to the Work Zone
Background
One method for reducing the volume of vehicles on a road being reconstructed is to encourage motorists to travel on parallel transit lines or to reduce demand through car and van pools However improvements may be needed in order to handle an increase in transit ridership These improvements may be made by establishing transportation management associations that develop new transit services Needed infrastructure improvements may include larger park-and-ride lots passenger terminals bus stop enclosures and new or expanded commuter rail lines Other considerations include more direct routes with fewer stops into downtown areas an increase in bus or train arrival frequency reduced transit fares and reduced fares for parking at the transit stations (Anderson and Ullman 2000)
Implementation Examples
I-95 Wilmington Delaware During the I-95 reconstruction project in Wilmington Delaware the Delaware Administration for Regional Transit and the Transportation Management Association (TMA) of Delaware provided alternate methods of travel for the duration of the project The goal was to remove as many vehicles from the road as possible In the project outreach the Delaware Department of Transportation (DelDOT) advertised that filling one bus with commuters is equivalent to removing about 45 cars from the road illustrated in Figure 10 Two new bus routes called ldquoExpressordquo routes were added that acted as express routes from the perimeter of the project into the downtown area with only two stops along the route Ridership was 1648 commuters per month on average The opening of a commuter rail station along the Amtrak northeast corridor was also coordinated with the beginning of the project Ridership was encouraged on the commuter rail line by eliminating parking fees (FHWA 2004d)
Figure 10 DelDOT illustration showing that one full bus will remove 45 cars from the road (FHWA 2001b)
Marquette Interchange Milwaukee Wisconsin During the rebuilding of the Marquette Interchange I-94 I-43 and I-794 in Milwaukee Wisconsin the Marquette Interchange Traffic Operations Task Force listed considerations for multimodal management The task force encouraged coordination among all modes of transit including bus commuter rail and Amtrak Another possibility included bus pre-emption and a downtown shuttle system to help reduce the need for vehicles when people were traveling downtown (Cyra 2002)
20
I-235 Des Moines Iowa In preparation for the reconstruction of I-235 the main urban freeway corridor through Des Moines Iowa a TMA was created (TMA 2006) A partnership of the Iowa DOT the Des Moines Downtown Community Alliance the Des Moines Area Metropolitan Planning Organization and Metropolitan Transit Authority provided support A private not-for-profit organization Avoidtherush was created to work with employers to reduce the traffic demand from single occupancy vehicles traveling into the Des Moines central business district The organization also works with the local community and individuals to reduce the impact of the I-235 reconstruction project by promoting car and van pooling programs working with employers to reduce peak-hour demands and promote car and van pools providing general information on roadway restrictions in the Des Moines metropolitan area providing assistance with a commuter tax benefit program information and developing other programs to reduce congestion Figure 11 shows the graphic from the Avoidtherush web site
Figure 11 Screenshot from avoidtherushorg
322 Improved Traveler Information Regarding Work Zone Traffic to Induce Travelers to Better Manage Trip Making and Reduce Congestion
Providing public information before implementing road work is a proactive measure that increases project awareness in order to reduce traffic volumes through the work zone This information can be in the form of direct mailings door-to-door flyers Internet information project information booths at events or such high-traffic locations as malls meetings at businesses personal telephone calls radio and newspaper ads media coverage and e-mails The information may include general project details such as a timeline what is going on why it is being done and alternate routes or modes of transportation Another way to create project awareness and to include public input is through neighborhood or town meetings During the project updates can be provided via the same pre-project awareness techniques as deemed necessary The underlying assumption is that if a motorist is informed prior to the project the person may plan ahead and make any necessary changes
Saag (1999) while synthesizing methodologies for reconstructing urban access-controlled facilities found evidence that supports the importance of information and the resilience of the public in their capacity to change their travel patterns when faced with a major work zone
21
closure and when they understand the closurersquos impact Saag (1999) found that ldquo[e]ven when lane closures during construction are required experience has shown that many predictions of dire adverse traffic conditions resulting from the closures did not materializerdquo Saag (1999) also emphasized the need for public information and communication Saag (1999) recommended that the need to involve the public cuts across all study phases from early planning through construction
Impact studies have been conducted for transportation system disruptions that have resulted from constructions projects natural disasters and other events that caused the total closure of a roadway For example there are many such studies of landslides that have closed roads in New Zealand earthquakes that have collapsed freeways in California and transit strikes in large urban core areas (Dalzeill and Nicholson 2001) However the most comprehensive controversial and widely cited study is one by Cairns Hass-Klau and Goodwin (1998) conducted for Transport for London and the Department of the Environment Transportation and the Regions The main questions this study set out to answer were (1) ldquoWhat really happens to traffic conditions when road capacity is reduced or relocatedrdquo and (2) ldquoWhat are the underlying changes in travel choices and behavior that cause these effectsrdquo
Cairns Hass-Klau and Goodwin (1998) collected over 150 sources of information regarding 100 locations and included over 60 case studies Capacity reductions examined included road maintenance activities bridge collapses natural disasters labor strikes etc In their case studies the authors found that the unweighted average number of trips was reduced in the treated area or in the surrounding area by 41 On average less than half of this traffic then reappears on alternative roads at the same or different times of day This suggests that quite a few trips simply dissipate naturally
Cairns Hass-Klau and Goodwin (1998) also examined different kinds of conditions during which roads are reduced in capacity or closed The authors determined that the response (reduction in traffic) is a result of the number alternative routes the duration of the capacity reduction and the alternative modes of travel available However in studying even short-term closures due to railroad worker strikes the authors found that users seemed to be able to accommodate capacity reduction very quickly This was in part due to information available regarding the capacity reduction that allowed the public to adjust their trip making behavior The authors found that in some cases even on the first day of the disruption there was no substantial traffic chaos and the lack of chaos is often greeted with the bemusement of the press and transportation professionals They also found that the extent of publicity and information before the change might itself influence expectations and outcomes
From the work by Cairns Hass-Klau and Goodwin (1998) we can see that travelers are amazingly resilient in working their way through a closure or a capacity reduction It is expected that the response to a closure or capacity reduction is likely to be related to several variables including the information available to the traveler about the closure traffic conditions at and around the work zone the types of trip (recreational or work) alternatives and knowledge of alternatives and the duration of the lane occupancy by a work zone The good news that Cairns Hass-Klau and Goodwin (1998) discovered is that given enough information travelers will adjust and are amazingly resilient and resourceful when faced with a capacity reduction
22
Implementation Examples
I-84 Portland Oregon In the Portland Oregon I-84 reconstruction project which used weekend closures the public information campaign began months ahead of the first construction date The public information campaign included personal telephone calls and direct mail to homes and businesses within the corridor including taxi companies tourism bureaus and travel agents For updates prior to and during the project radio ads a project website a telephone information line media alerts and event information an informational kiosk at a large local shopping mall and countertop informational displays at local businesses were utilized (FHWA 2004e)
I-95 Wilmington Delaware For the I-95 rehabilitation project in Wilmington Delaware the public outreach began two years prior to project implementation DelDOT increased awareness of the project by placing advertisements in local newspapers holding outreach events and public informational meetings and creating a ldquosurvival guiderdquo that explained the project when the project would occur and how a motorist should plan ahead Additionally a character was created named ldquoCreeprdquo who made public appearances People could also go online to play a game where they could try to ldquobeat the creeprdquo by taking alternate ramps or routes allowing for extra travel time and using carpool or transit options DelDOT also purchased a radio station prior to the project that was used to relate traffic and travel information on a 24-hour basis for this and future projects (FHWA 2004d)
M-10 Lodge Freeway Detroit Michigan The rehabilitation project of the M-10 Lodge Freeway in Detroit Michigan was part of the Fix Detroit 6 program that coordinated six high-profile projects in the Detroit area that took place during the 2002 and 2003 construction seasons The public information campaign on the Fix Detroit 6 program included distribution of fliers television and radio ads and coverage in local newspaper traffic columns A project website also gave information on project plan updates progress and closures (FHWA 2004f)
State Route 68 Arizona During the reconstruction of 135 miles of Arizona State Route 68 from 2000 to 2002 the Arizona Department of Transportation (ADOT) made extensive public information outreach efforts ADOT hired a public relations firm to provide public information and raise awareness through public service announcements cable television announcements radio media alerts an informational telephone number and a project website Newsletters were mailed out three to four times per year and contained project status updates and answers to frequently asked questions Faxes were also sent to 144 businesses and individuals The informational telephone number connected to a live person on MondayndashFriday from 800 am to 500 pm and during other times the caller was connected to a recording where the public relations firm could reply during working hours to any questions or concerns (FHWA 2004g)
23
323 Demand-Side Traffic Management Strategies
Background
There are a variety of travel demand management strategies that can be applied to reduce peaking traffic volumes while a major urban facility is being reconstructed As was discovered by Cairns Hass-Klau and Goodwin (1998) travelers are resilient and will find options if given information on the impact of a facility closure or a capacity reduction Demand-side strategies are designed by blending together actions that may result in efficient travel choices Individuals and organizations make these travel choices which collectively impact the efficiency and performance of the entire transportation system but which especially impact travel through the part of the urban network affected by highway construction Elements of choices include both day-to-day choices about travel mode departure-time and travel route as well as trip reduction choices (ie telecommuting) and even business and residence location choices (FHWA 2004h) An illustrative (not comprehensive) list of strategies that may be applied to reduce travel demand during highway reconstruction may include the following
bull Incentives for changing time of travel o Encourage employers to permit flextime o Coordinate work zone activities with shift changes o Reduced parking prices for particular times of day or preferred locations
bull Modal strategies o Guaranteed ride home when work demands make it impossible to leave work to
meet transit service schedule o Reduced cost transit pass programs o Financing for shared vehicles (van pools) o Parking price and location incentives for vehicles shared by employees
bull Trip reduction strategies o Employersrsquo adoption of telecommuting programs and policies o Compressed work week programs
Each situation is unique and the organizations that are available to assist in implementing demand management strategies vary by urban area However strategies are most commonly implemented through work with a TMA or transportation management organization (TMO) For example before a TMA was established in Des Moines the Iowa DOT and its regional government partners created a TMA initially to help with travel demand management during I-235 construction
TMAs are non-profit associations that look at ways to reduce congestion and increase traveler mobility throughout all modes in a transportation network TMAs partner with employers developers political entities chambers of commerce state highway departments planning commissions and other transportation-related agencies to reduce congestion and increase mobility Because of its private status and because TMAs are a recognized organization for
24
seeking solutions with private and public partners TMAs are uniquely qualified to institute demand reduction strategies to reduce the traffic congestion impacts of work zones
Implementation Examples
I-70 Blanchette Bridge St Louis Missouri The Blanchette Bridge on I-70 crosses the Missouri River to the northwest of St Louis (Figure 12) In 1997 the Blanchette Bridge was schedule for rehabilitation (Miller nd) The bridge is the most heavily trafficked section of interstate in Missouri carrying more than 200000 vehicles per day The Missouri Department of Transportation (MoDOT) decided that it would try to impact travel demand through its own outreach program to major employers in the region (Ford General Motors Boeing and many others) private associations (the Missouri Motor Carriers Association and the TMA) impacted governments (the regional transit operator and local governments) and individuals by increasing traveler information (eg paid radio advertisements on the project and lane closures) Construction on the bridge was intended to last only three months allowing employers and employees to implement temporary changes that they might otherwise not be willing to implement permanently
MoDOT met with employers and encouraged them to consider work schedule adjustments flextime and compressed work weeks MoDOT also encouraged employers to promote carpools vanpools and the use of public transit Although MoDOT did not quantify the impact of their outreach campaign the heightened levels of congestion that were expected never appeared In the headlines of the St Louis Post-Dispatch newspaper MoDOT even received positive comments on its handling of the project In retrospect the project management team noted that travel choice modifications made during construction were largely transitory and only the car pooling program sustained itself after construction was completed
Figure 12 Blanchette Bridge during reconstruction
25
I-25 and I-225 Denver Colorado The reconstruction of the interchange between I-25 and I-225 the addition of lanes for each interstate in the Denver area and the construction of 19 miles of light rail line 13 light rail stations and new light rail maintenance facilities were all part of one large-scale project known as T-REX (FHWA 2004i) This project had a significant mobility impact over its six-year life and it was completed in the fall of 2006 two years ahead of schedule In anticipation of the projectrsquos impacts and to mitigate these impacts the Colorado Department of Transportation and the Regional Transportation District created the TransOptions program (Figure 13) TransOptions largely promotes travel options for single-operator vehicle commuting The program worked with and built on the programs created by the existing TMAs and TMOs in the region GoTransOptionscom shown in Figure 16 lists commuting options in the Denver metro area and lists the 10 partner agencies
Figure 13 TransOptions for the Denver Metro Area (TransOptions 2006)
In an evaluation of the TranOptions Program UrbanTrans Consultants found that the program reduced the amount of vehicle miles traveled (VMT) by 74800 miles daily The reduction in VMT was largely a result of employer-purchased transit passes subsidized vanpools and individual commuters buying low-cost transit passes
33 Alternative Project Scheduling and Phasing Strategies
Several road user cost reduction benefits are possible with the use of alternative project scheduling and phasing strategies Examples of these benefits include a reduction of total project duration reduction of lane occupancy time throughout the project or during specific phases and the avoidance of peak traffic volume periods This section explains the following strategies
1 Nighttime construction to alleviate congestion 2 Full road closure to reduce total construction time 3 Detour routes 4 Flexible project start-up dates and a focus on schedules to reduce project duration 5 Rolling roadblocks
26
331 Nighttime Construction to Alleviate Congestion
Background
Generally there are two main reasons for conducting nighttime construction and maintenance operations (1) to allow work over a longer period of light traffic than is possible during the off-peak daylight hours and (2) to decrease or eliminate the excessive traffic delays and congestion associated with lane closures during daylight hours (Shepard and Cottrell 1986) However nighttime work has some disadvantages compared to daytime work The quality of the work may suffer and the safety of workers and drivers may decrease due to poor lighting and reduced worker and driver attentiveness Construction costs are generally higher due to labor overtime and night-premium pay lighting expense added traffic control costs and increased materials costs The glare and shadows created by work zone lighting (Figure 14) drowsiness or lack of attentiveness of drivers at night and a greater likelihood that drivers may use drugs or alcohol at night may create a more dangerous work zone environment than under daytime conditions For example Sullivan (1989) studied several urban work zones in California and found that crash rates increased by 87 compared to daytime work zone crash rates
The advantages of nighttime construction include lower traffic volumes a longer period of uninterrupted work than allowed during the daytime and the possibility of closing more lanes Some states if the operations last only a few days will allow traffic to become congested due to a reconstruction-related lane closure to avoid nighttime work (Shepard and Cottrell 1986) However a lane closure causing increased congestion for more than a few days leads to adverse public reactions as well an increase in user delay costs According to Shepard and Cottrell (1986) the allowed impact on traffic is related to the motoring publicrsquos tolerance of what is and is not acceptable in terms of delay and queue lengths
During nighttime work there should be a balance between a high level of safety minimum congestion and access to the work area comparable to daylight-hour traffic control strategies (Bryden and Mace 2002) Therefore to consider a nighttime work zone there needs to be a benefit of reduced traffic volumes and easy setup and removal of traffic control on a nightly basis The traffic control and operations need to be completed and restored to normal operating conditions before the beginning of the morning peak to avoid delay and long queues due to a lane closure
27
Figure 14 Glare of winter lighting (Bryden 2004)
When Maze et al (2005) interviewed 30 STAs most reported that they are increasingly conducting reconstruction work at night to avoid daytime road closures Some STAs in states that are largely urban reported that all or the majority of reconstruction work in large urban areas is conducted at night For example an interviewed staff member from the Maryland State Highway Administration estimated that 85 of the administrationrsquos reconstruction work is conducted at night
Since every work site is unique night work needs to be compared to other traffic management options to determine the most desirable method for managing traffic safely While night work has its benefits when compared to other possible traffic management plans night work also has road user and project costs National Cooperative Highway Research Program Report 475 includes a very specific four-task methodology for assessing the appropriateness of night work in comparison to or in coordination with other strategies (Bryden and Mace 2002) The tasks include the following
1 Gather information (traffic demand diversion routes potential for traffic control operations including demand-side options )
2 Develop traffic control options (identify and define feasible options for traffic control) 3 Evaluate volumecapacity (from the list developed in task two determine the strategy or
combination of strategies that will result in acceptable levels of congestion and delay) 4 Cost-effectiveness analysis (compare the effectiveness of each strategy including that of
nighttime work)
28
332 Full Closures to Reduce Total Construction Time
Background
A full road closure involves rerouting all traffic and giving the contractor full access to the roadway with the expectation that construction time will be dramatically reduced (Battles 2004) While motorists are inconvenienced the inconvenience will last for fewer days than if individual lanes were closed Trucks delivering material will be unimpeded by traffic within the work zone and equipment will not be restricted by open lanes of traffic These increased available workspaces can improve productivity There is also the potential for reducing the number of joints and seams in the paving resulting in a smoother roadway All operations can run continuously with 24-hourday work which eliminates inefficiencies resulting from stopping and starting work Full road closures are commonly used over three time durations (1) weekend closures in which work can be completed over a weekend (2) nighttime closures typically maintenance work work that can be completed in one nighttime or reconstruction work that can be staged so the roadway can be reopened during the day and (3) full-time closures in which work continues through the week and weekend Utilizing full closures at night and on weekends has the advantage of avoiding peak weekday traffic Full road closures can greatly reduce the duration of project causing greater disruption to normal travel patterns for short periods of time and reducing overall traffic exposure to work zones
Implementation Examples
I-65 Louisville Kentucky The Kentucky Transportation Cabinet used a full closure on a section of I-65 near Louisville The project was estimated to take 90 days with a conventional partial closure of I-65 during construction activities but the project only took 104 hours over two weekends when the contractor was allowed full closures over the weekends (FHWA 2003c)
M-10 Lodge Freeway Detroit Michigan In the Detroit Michigan area during the M-10 rehabilitation project the Michigan Department of Transportation (MDOT) used a bidirectional full closure to ensure the project would be completed in one season This project was part of the Fix Detroit 6 program discussed in section 321 of this report The traffic in the direction of the closure was detoured off of the freeway Without the full closure it was estimated that the project duration would have been six months However the contract was written for 65 days of full closure with incentives and the project was completed in 53 days (FHWA 2004f)
I-75 Detroit Michigan Another project within the Fix Detroit 6 program in Detroit Michigan was the rehabilitation of I-75 This highway carries a significant number of commercial vehicles to and from Detroit in international commerce across the Canadian border Because of this it was determined that commercial vehicle traffic needed to use this facility during construction Therefore MDOT used a limited capacity closure in which a lane was left open in each direction on one side of the highway The lanes on the other side were completely closed for rehabilitation The two lanes of traffic were specifically left open for commercial vehicles and served as an express route because intermediate entry and exit ramps on the route were closed This method reduced congestion on alternate routes by allowing commercial traffic on I-75 and
29
the speed and quality of work was improved because the contractor had exclusive use of one side of the highway (FHWA 2003d)
I-84 Banfield Freeway Portland Oregon The I-84 Banfield Freeway rehabilitation project near Portland Oregon utilized a full road closure to expedite construction time The Oregon Department of Transportation used directional road closures over two consecutive weekends instead of using the traditional part-width night construction Detours were used to divert traffic traveling in the direction of the full closure The project was completed in 112 hours which can be compared to the estimated 320 hours (32 nights) for nighttime work (FHWA 2004e)
333 Detour Routes
Background
Detour routes are needed during a full road closure to get motorists to their destinations when the original road is closed Because a full closure often results in a significant reduction in project duration designing a detour that results in acceptable delays (either through increased travel distances or congestion) is essential to a successful full closure Effective detour designs require that the detour should run parallel to or near the closed road to avoid creating unreasonable travel distances and delays and the alternative route must have reserve capacity to be able to handle the increased traffic without creating significant delays Improvements to the alternative route may need to be considered such as temporary removal of curb-side parking addition of lanes traffic signal improvements removal of geometric bottle necks etc Detour information is usually distributed through public outreach campaigns posted on the project websites displayed on the roadways affected by the closure through ITS technology trailblazing and other signs and markings distributed via routing maps through the media and displayed through the use of enforcement personnel to help direct traffic
Implementation Examples
M-10 Lodge Freeway Detroit Michigan The M-10 Lodge Freeway rehabilitation project in the Detroit area used detours during weekend full road closure times Before determining the detour route MDOT personnel collected samples of actual travel times on alternate routes during peak hours and all alternative routes experienced acceptable delays on the weekends before the weekend closures of the Lodge Freeway During the full closures the detour routes experienced minimal increased travel delays except for an exit ramp where motorists attempted to avoid the prescribed detour A final assessment of the project indicated that even though MDOT recommended alternate routes on state roads motorists would still divert to local roads and alternatives within the dense urban roadway network Even though motorists seemed quite able to navigate to their destinations on surface streets it was deemed important to identify and provide specific alternate routes to accommodate diverted traffic volumes (FHWA 2004f)
I-84 Banfield Freeway Portland Oregon During directional weekend closures used in the I-84 rehabilitation in Portland Oregon the alternate routes experienced minimal impacts to
30
mobility A traffic model was used to estimate the impact of new traffic volumes on the detours and the actual traffic volumes were less than expected (FHWA 2004e)
I-95 Wilmington Delaware For the I-95 rehabilitation project with directional closures in Wilmington Delaware a primary alternate route was used I-495 I-495 is a six-lane highway with existing traffic volumes only equaling 25 of its capacity and operating at a level of service (LOS) of A or B so I-495 had sufficient reserve capacity to absorb traffic diverted from I-95 During the project the LOS on I-495 only dropped to C and the majority of the delay occurred at interchanges (FHWA 2004d)
European Scanning Tour During a European scanning tour (Steinke et al 2000) it was discovered that a couple of European countries use permanent signs that indicate permanent alternate routes that can be used when needed For example Germany uses permanent orange trailblazers that indicate alternative routes that motorists can take to avoid work zones Belgium added the numbers ldquo1rdquo or ldquo2rdquo to all major road signs leading to the ring road around Antwerp When there are work zones or incidents on the ring road DMSs radio announcements and road advisories on the Internet direct motorists to follow one of the numbered alternate routes
334 Flexible Project Start-up Date and Focusing on Schedules to Reduce Project Duration
Background
One way to allow for more efficient project phasing is through flexible starting dates The STA can allow a time window of around 100 days within which the contractor can begin the project after the Notice to Proceed (FDOT 1997 AASHTO 1998) The contractor may choose to delay the project because of material availability worker availability and the desire to avoid special events or other causes of unusually high traffic By allowing the contractor to select a start time that is most advantageous for the contractor and that avoids seasonal high-traffic periods the overall duration of the project should be shortened FDOT as an example uses flexible starting dates for two reasons (FHWA 2000) First flexible dates reduce unnecessary work zones and lane closure durations or public exposure to adverse construction conditions that may result when the contractor is waiting on workers materials or the completion of other tasks Second there is an increased probability of completing construction within the authorized contract time The Oklahoma Department of Transportation has found that when flexible start dates were used with A+B bidding the maximum allowable contract times specified in the bid documents were reduced by 25 (FHWA 2000) The Washington State Department of Transportation (WSDOT) uses a final date specification when the project can start to ensure completion within the scheduled construction season due to a more efficient use of workforce equipment and subcontractors (WSDOT 2007a) However WSDOT only considers a flexible start date if a delayed project start would not adversely impact the traveling public
Another method of improving project phasing is to schedule as many tasks as possible at once Instead of working on one task at a time completing it and moving on to the next even though some tasks are not sequential the contractor can schedule multiple tasks at one time This method is sometimes referred to as a ldquomaintenance gangrdquo Working on multiple tasks helps
31
reduce the project duration or the possibility of closing lane(s) multiple times to perform each task (Anderson and Ullman 2000)
Proper scheduling of tasks can ensure that certain tasks do not need to be completed multiple times This involves good communication with subcontractors and utility agencies to identify what needs to be done in a logical efficient order This will help eliminate the need to reconstruct something that needed to be removed in order to perform another task It is important to communicate with utility agencies and find out any plans the utility has in order to avoid completing a road reconstruction only to have certain sections removed to lay utilities which would require that the road sections be replaced Similar to the justification of flexible starting dates project scheduling should account for material and worker availability (Anderson and Ullman 2000)
335 Rolling Roadblocks
Background
A rolling roadblock is a form of intermittent road closure in which traffic is not detoured but slowed to allow for an adequate gap in traffic for work to be completed on a roadway section A rolling roadblock starts upstream from the work zone (eg 10 miles upstream) with control vehicles blocking the through lanes and pacing the vehicles behind the control vehicles at slower-than-normal speeds (The minimum speed is usually 20 mph) All entrance ramps upstream from the work zone and downstream of the roadblockrsquos beginning point are closed and opened as the rolling roadblock passes This creates a gap between the traffic traveling before and after the rolling roadblock The gap provides the construction workers full access to the roadway for a short period of time An acceptable gap for activities varies by agency and is usually between 5 and 30 minutes (FHWA 2003d) The roadblock is most often initiated by police vehicles (due to laws regarding authority to close a roadway) but agency vehicles with flashing lights or contractor vehicles with flashing lights may be use to form the roadblock Signs should also be placed warning motorists of the situation
The benefits of a rolling roadblock are that the roadblock is a short-term temporary closure of all travel it slows traffic to safe speeds through the work zone and it allows traffic to remain in motion which leads to quicker traffic flow recoveries compared to traffic brought to a complete stop Rolling roadblocks can be initiated when the work is ready to be performed so there is not an unnecessarily long closure or detour One of the disadvantages is that this method may create significant traffic congestion (Maryland SHA 2005) FDOT uses a rolling roadblock method for the following types of activities (not an all-inclusive list) placing bridge beams establishing overhead sign structures and performing other construction where materials are being placed overhead of the lane (FHWA 2000)
A rolling roadblock can also be used to create a longer full road closure Before the full road closure a rolling roadblock is used to divert the traffic behind the roadblock to the alternate routes to ensure no vehicles are in the lanes ready to be closed As the roadblock passes appropriate signs are placed or uncovered to indicate the full road closure and alternate routes
32
Additionally the Ohio Turnpike uses rolling roadblocks to perform structural steel setting utility crossing work or to shift traffic into a new configuration Police officers control each lane of traffic and on-ramps and maintenance staff serve as the last vehicle through The window of work is 10ndash12 minutes and the roadblocks begin 10 miles prior to the work zone It takes about 10 minutes to clear the roadway and the entire closure usually lasts 20ndash25 minutes (FHWA 2003d)
34 Design Alternatives to Minimize Life-Cycle Congestion Costs Strategies
This section identifies design alternatives that are used to minimize life-cycle congestion costs The life-cycle congestion costs are realized in multiple ways such as maintaining the same number of lanes through a work zone or preparing for future mobility issues by designing alternatives that minimize lane occupancy The strategies identified and explained in this section include the following
1 Corridor planning approach 2 Use of alternative materials and methods 3 Prefabrication of project segments 4 Use of temporary pavement and structures 5 Value engineering
341 Corridor Planning Approach
Background
One method for minimizing lane or road closures in a corridor year after year is a corridor planning approach For this approach it is important to understand the role a facility plays in the system-wide transportation plan for the region Considerations for all modes of transportation will also help planners identify the facilities that will need capacity expanding reconstruction and the ways the reconstruction will affect the corridor This method takes into account all projects that may need to be performed within the corridor in the next few years and schedules them simultaneously This scheduling includes performing all maintenance and rehabilitation on roads and bridges (Anderson and Ullman 2000) Studying an entire corridor also encourages state and local agencies to work together to either combine or schedule simultaneous projects within the corridor at the same time By working together the corridor construction is not limited to freeways but encompasses the lower class facilities that connect to the freeway Similarly state and local agencies can consider working with utility companies to encourage necessary line installations or repairs to avoid future utility work The ldquoGet In Get Out Stay Outrdquo approach applies to this method as the transportation agency gets into the corridor performs necessary rehabilitation or reconstruction and then gets out of the corridor for many years
For example MDOT has been utilizing a corridor planning approach on reconstruction and rehabilitation projects especially on high-volume urban freeway projects in the Detroit metro area Within the Fix Detroit 6 corridor projects (including I-75 I-94 I-96 I-696 M-10 and M-39) in or near Detroit all projects were examined using a corridor planning approach Examples of typical work being performed for these six projects include rehabilitating or reconstructing
33
many or all of the crossroad bridges through all six corridors along with rehabilitation or reconstruction of the six freeways (MDOT 2006)
In another example NMDOT utilizes a corridor improvement technique with four components (1) obtain adequate and creative funding (2) develop innovative contractual documents (3) involve the public fully and completely throughout the process and (4) organize and state the work so that there is an identifiable reduction in ldquoorange barrelsrdquo during construction and into the future It is believed that a corridor management approach will better address a more complete strategy and process throughout the corridor (Ferragut 2003)
342 Use of Alternative Materials and Methods
Background
Various alternative materials and methods compared to traditional materials are available for road construction The objective of using an alternative material is to expedite the construction time in order to reduce lane closure and occupancy times reduce the frequency of future maintenance and extend pavement life Although the use of alternative materials and methods may create higher initial costs extending the useful life of the facility and reducing maintenance will most likely decrease the overall life-cycle cost of the facility (Anderson and Ullman 2000)
Different choices are available regarding the type and durability of paving materials Various mixes of asphalt and concrete are available depending on the objective of the rehabilitation or reconstruction One common objective is to reduce the frequency of future highway maintenance and rehabilitation For example Caltrans uses a Long-Life Pavement Rehabilitation Program for Urban Freeways This program is a set of project proposals for multi-year funding through the 4R work on the state system The design life of the rehabilitated pavements is designed to be 30 to 40 years (FHWA 2000)
In another example representatives from the Indiana Department of Transportationrsquos Accelerated Construction Technology Team Workshop have stated that one of the goals of the workshop project was to ldquostay outrdquo after completing I-465 in Indianapolis The workshop created a long-life pavements team to identify possible pavements that could achieve a 60-year useful life (Ferragut 2003) The workshop found that when specifying a project to the designer and contractor the pavement performance goals and objectives should be clearly identified and communicated Doing so allows maximum freedom for determining the design and construction methodology that is best suited for the project The pavement types and designs that were suggested in the workshop included a 60-year portland cement concrete and diamond grinding preventive maintenance 60-year asphalt cement concrete and mill-and-fill preventive maintenance or a composite 60-year portland cement concrete with a stone mastic asphalt layer for mill-and-fill preventive maintenance For pavement below the frost line the design should incorporate underdrains and positive surface drainage across the pavement
In another alternative method engineering fabrics may be used to facilitate subgrade preparation thus reducing project duration The fabric serves the combined purpose of reinforcing the
34
subgrade and separating the aggregate base from the earth material When poor soils are encountered the fabric can be used instead of reworking wet soils or improving soil conditions if they are not acceptable to support the pavement The North Dakota Department of Transportation states that using an engineering fabric reduces the construction time for subgrade preparation by about 50 (Bergeron 2004)
Additionally Cole and Voigt (1996) have listed suggestions to shorten concrete pavement construction time For concrete materials a transportation agency try different cement types use helpful admixtures and use a uniform aggregate grading For jointing and sealing Cole and Voigt (1996) suggested allowing early sawing with ultra-light saws using dry sawing blades using step-cut blades for single-pass joint sawing and using a sealant that is unaffected by moisture or reservoir cleanliness To expedite curing time and understand the temperature relationship the specifications may stipulate that blanket curing be used to aid strength gain when beneficial the concrete should be monitored and the effects of ambient subgrade and mix temperature on strength gain should be understood and the concrete temperature should be elevated before placement
Anderson and Ullman (2000) performed a survey of materials that may help reduce lane occupancy The materials were rated using the following levels of impact medium impact denotes stabilizing soil with lime and cement and using water to cool asphalt pavements on resurfacing projects high to medium impact denotes using flowable or lean-mix concrete for backfill and using hot asphalt with recycling and high impact denotes movable barriers and precast components Anderson and Ullman (2000) also identified the construction methods and equipment used by highway agencies Some agencies specify the equipment to be used on the project with the goal of expediting the construction Contractors also use such types of equipment and methods to reduce project time in order to take advantage of the incentives in the contract Conveyor belts may be specified for transporting excavated materials to provide a constant flow of materials out of the project area and to avoid work area congestion and delay caused by trucks hauling the material Other suggested equipment and methods included mechanized dowel bar insertion wider paving machines and mobile and portable recycling plants to reduce long truck hauling activities
Implementation Examples
I-10 Pomona California On a 15-mile segment of the I-10 Freeway in Pomona Caltrans used fast setting hydraulic cement concrete An innovative method for removing the existing concrete was used that included cutting the pavement into four- by four-foot slabs and lifting and hauling it off the site This method left the subgrade relatively undisturbed and required minimal preparation The concrete achieved 400 psi within four hours and the entire length was completed within the 55-hour weekend closure (Anderson and Ullman 2000)
I-710 Long Beach Harbor California The first project to which Caltrans applied long-life asphalt was on I-710 north of Long Beach Harbor California The asphalt used has a life expectancy of 30 to 35 years which increases the time between rehabilitation projects The project was constructed in eight 55-hour weekend closures in which one direction of travel was
35
closed at a time Traffic was shifted over to the opposite-direction lanes using moveable barriers providing two lanes of travel in each direction (FHWA 2007 Stahl and Gutierrez 2004)
County Route 1 Cabell County West Virginia The Howellrsquos Mill Bridge on County Route 1 in Cabell County West Virginia required hydraulic considerations because it is usually submerged during flood events The bridge needed to be designed to withstand a 100-year storm event The West Virginia Department of Transportation (WVDOT) decided to use a fiber-reinforced polymer bridge deck This allowed for a longer service life for the bridge reducing the frequency of replacement and allowing the bridge to withstand a 100-year storm event (FHWA 2007)
West Virginia Turnpike For a 10-mile reconstruction project on a West Virginia turnpike that links Charleston and I-81 WVDOT used full-depth hot mix asphalt for a rubblization and reconstruction technique WVDOT decided that extensive breaking or rubblizing of the concrete pavement before the asphalt overlay would help reduce the reflective cracking A multiple head breaker capable of 12ndashfoot-wide sections was used The agency was able to complete the project at a rate of one mile per day (Anderson and Ullman 2000)
US 395 Kennewick Washington WSDOT used high early strength concrete on three intersections on US 395 in Kennewick Washington Each intersection was closed Thursday evening at 700 pm and required to reopen by 600 am on Monday The high early strength concrete mix allowed for traffic to be reopened within 12 hours of pouring and all intersections were opened by the Sunday evenings throughout the project (Sorenson 2001)
343 Prefabrication of Project Segments
Background
Prefabricated elements can be constructed on- or off-site under controlled conditions brought to the construction location and then installed (Figure 15) Prefabricated elements minimize construction-related traffic disruptions and improve the constructability of for example bridge designs by controlling the manufacturing environments The fabrication environment can thus facilitate the controlled use of high-performance materials Fabrication off-site can also facilitate modular construction in which repetitive structural units are used to create the completed structure This has been very beneficial in situations where multiple project locations have similar dimensions and the same or similar prefabricated design can be used repeatedly thus reducing costs and expediting construction When working on large projects or many similar projects with the possibility of multiple prefabricated structures such as bridges the bridge designs can be standardized This will help expedite construction time as workers and designers are familiar with the structures and materials On smaller structures such as box culverts and manholescatch basins prefabrication can dramatically reduce construction time On larger structures prefabrication is applicable to both substructures and superstructures Prefabrication may also involve complete-span units that can lifted into position when completed Prefabricated deck panels may be partial-depth and full-depth panels Both provide quicker construction are more durable than a cast-in-place deck and are easily removed and replaced when needed The
36
actual closure times are also reduced since the only process that needs to be accomplished to achieve a drivable roadway is the installation of the panels Moreover the overall benefits of a total prefabricated bridge system as stated by the FHWA include improved constructability lowered life-cycle costs and increased quality through controlled fabrication conditions (FHWA 2004j)
Figure 15 Prefabricated panels used at the Tappan Zee Toll Plaza in New York
Implementation Examples
Dalton Highway Alaska In 1992 the Alaska Department of Transportation and Public Facilities replaced 18 timber bridge decks on the Dalton Highway between Fairbanks and Deadhorse with precast concrete slabs (FHWA 2007) The ADT was only 250 vehicles per day but this road was the only road out of Deadhorse and the North Slope oil fields Concrete slabs were chosen over timber which needed replacement every eight years to save in replacement costs and reduce the recurring impacts to the traveling public It was decided that the road would be closed for 12 hours each day The project was completed in seven months with minimal impact to truck traffic
Church Street Bridge New Haven Connecticut The Connecticut Department of Transportation (ConnDOT) specified a portion of the Church Street Bridge in New Haven Connecticut be completed in one night over a weekend (FHWA 2007) This nighttime process was chosen to minimize the disruption of train service on the lower section of the bridge A 975-meter truss was built off-site along the rail lines and lifted by crane into place as shown in Figure 16 The truss was the main segment of the 390-meter bridge ConnDOT estimates that this method saved one year on the overall contract time
37
Figure 16 Placement of a prefabricated steel truss on Church Street Bridge
Lake St Louis Bridge over I-70 St Charles County Missouri The Lake St Louis Bridge over I-70 in St Charles County was reconstructed in 2003 to accommodate additional lanes (FHWA 2007) The old bridge consisted of two lanes over four spans The new bridge consists of six lanes and only two spans utilizing mechanically stabilized early wall abutments The new bridge was to have precast deck beam sections which allowed for demolition of the old bridge and construction of the new bridge in less than four months
Route 1 Freeway Trenton New Jersey The New Jersey Department of Transportation (NJDOT) installed three bridge decks and superstructure beams on the Route 1 Freeway in Trenton New Jersey in three weekends (FHWA 2007) The bridge decks were prefabricated off-site and installed by the contractor and workday motorists experienced minimal inconvenience NJDOT had expected the project to take nearly two years to complete using traditional methods In another project in New Jersey NJDOT selected a segmental precast construction method for both the superstructure and substructure of the Victory Bridge on Route 35 Using this method NJDOT estimated that the duration of construction would be reduced by at least one year
George P Coleman Bridge Yorktown Virginia In the widening of the George P Coleman Bridge in Yorktown Virginia the Virginia Department of Transportation used an innovative method to construct new trusses and a new bridge deck (FHWA 2007) The truss spans and lightweight concrete bridge deck were constructed on the York River 30 miles downstream of the bridge The finished product was then floated to the bridge on barges as shown in Figure 17 The time to replace the trusses was reduced by 36 days or 60 The contract documents had allowed two 12-day periods to exchange the old truss spans with the new ones but the exchange and restoration to full use took only nine days
38
Figure 17 Barges floating a prefabricated segment to installation location
NE 8th Street Bridge over I-405 Bellevue Washington In 2003 WSDOT completed the NE 8th Street Bridge over I-405 in Bellevue Half of the bridge was constructed at a temporary location and rolled into the permanent position WSDOT had estimated that the bridge would have been closed for up to a year or reduced to half capacity for over a year However the phases included only night and select weekend closures while the prefabricated bridge was slid into place in 12 hours (FHWA 2007)
Aberdeen South Dakota In 2000 the South Dakota Department of Transportation began a bridge construction project in Aberdeen in which a 318-foot steel truss was to be placed on an embankment next to a rail yard (Bergeron 2004) In order to minimize the train traffic disruption the truss was fabricated next to the installation location and then launched on rolling platforms into place with a delay to train traffic of 16 hours It was estimated that using a conventional two-span structure would have caused a disruption to rail service that would have lasted several months and would have required the relocation of several tracks
344 Use of Temporary Pavements and Structures
Background
Temporary pavements or structures through a work zone allow traffic to remain on the same route which can replace a detour route for traffic Temporary pavements can also be used to maintain the same number of lanes while removing traffic from the mainline allowing the contractor to have exclusive use of the work area or they can be used to widen shoulders or add additional lanes adjacent to the existing surface to shift traffic over allowing the contractor to close adjacent lanes While using temporary pavements can help reduce congestion constructing the pavements is expensive and time consuming additional right-of-way may need to be purchased and temporary pavements can be an inefficient use of materials since the pavement will be removed when work is completed If available shoulders may be used as traffic lanes during construction which is a cheap alternative to using temporary pavement However utilizing a shoulder limits the area to which vehicles can remove themselves out of the travel lane when involved in an incident which reduces capacity In addition shoulders may not be
39
constructed to handle truck traffic and may need to be rebuilt after the other lanes are open (ODOT 2000)
Temporary structures may be needed during bridge reconstruction applications In order to maintain traffic in the construction location while using a full road closure a temporary structure may be built over a necessary crossing such as a river This strategy is often an expensive and inefficient use of materials it requires additional time for design and construction and it may require additional right-of-way However prefabricated components can dramatically reduce construction time and many agencies have standard designs for temporary structures (ODOT 2000) For example ODOT widens bridges and adds temporary pavements prior to construction to maintain at least two lanes open in each direction during construction
345 Value Engineering
Background
Value engineering is the process of reviewing and analyzing project components to identify and recommend alternative solutions that will add value to the project by reducing costs including user costs Several areas addressed in value engineering analysis include project phasing and staging changes methods and material changes design changes propriety products and revisions of detour and traffic control strategies (Anderson and Ullman 2000) This review of the project can lead to suggestions that may help reduce work zone congestion through alternative staging modifications to traffic control and modified project schedules The review may also help minimize life-cycle costs by recommending alternative materials and designs to extend the useful life of the roadway section
Ceran and Newman (1992) list the specific steps of the structured value engineering process First a project must be selected for analysis Many states require value engineering on projects over a certain cost and some agencies also perform this process on low-cost projects Second information needs to be collected about the project to determine the costs and objectives of the project This information is used to help determine other methods or materials that can perform a similar task and the information may inform an evaluation of the alternatives to determine whether there will be a cost savings and the alternatives are feasible After the evaluation of alternatives the selection of the most promising alternatives and determination of the total and life-cycle costs is performed Finally the advantages and disadvantages of each alternative are presented for approval followed by implementation and review
35 Alternative Contracting and Project Delivery Strategies
By shortening a projectrsquos duration the impacts on motorists are reduced This section identifies and describes alternative contracting methods and project delivery methods used to accelerate project completion Five contracting and project delivery methods are discussed
40
1 Design-build construction 2 Lane rental 3 A+B and A+B+C contracting 4 Incentives and disincentives to reduce construction duration and impacts 5 Interim liquidated damages and completion dates
Project delivery methods are often confused with contracting methods For example design-build is a project delivery method Design-build generally (though not always) allows contractordesigner teams to propose projects following preliminary engineering thereby allowing the builder and designer to work together through the final design and construction stages In contrast contract incentives are an example of a contracting methodology Contracting methods generally have the agency or the agencyrsquos design consultant finish the design and prepare a complete set of detailed plans and specifications The contractor then prepares a bid for the project based on the plans and specifications and any special contacting methods eg incentivesdisincentives
351 Design-Build Construction
Background
In design-build contracting one contract is let to a construction and design team and the team performs both the final design and building for the project A project is generally turned over to the design-build team when about 30 of the design is completed However design-build projects have been awarded to the design-build team at various times from just after conceptual design to after 90 completion of design The design-build team can then design the project to the best of its construction capabilities The most beneficial aspect of this technique is the time savings it has for the total project duration These time savings can be realized in various aspects of the project By allowing the design-build firm to utilize its resources to an optimal level activities can be designed and performed based on what the firm is capable of doing (Rohlf 1994) Additionally certain activities within the construction process can begin while others are still being designed Instead of having to wait for the completion of an activity that does not need to precede a subsequent activity the crew can work on another independent activity The use of lump sum payments in design-build contracting may also eliminate change orders and time extension requests that result from design errors or from project phasing differences between a separate design firm and traditional contracting techniques (Strong 2005) Design-build also allows for fast track construction and efficient phasing which can reduce construction time Having both the design and construction teams within the same agency allows for a streamlined path of communication between the office and the field
For example Caltrans utilizes a slightly modified design-build concept to suit its unique institutional constraints Caltrans has chosen to conduct most of its highway design in-house and to enjoy the benefits of design-build without involving a design consultant the agency created a method known as design sequencing Design sequencing selects a contractor for a project when the design is 30 completed and the agency design engineers continue to work with the selected contractor until the completion of construction Design sequencing results in shorter durations because and design and construction can be conducted simultaneously
41
Implementation Examples
SR51 Phoenix Arizona On a high-occupancy vehicle lane addition project on SR51 in Phoenix Arizona ADOT used a design-build contract with A+B bidding (A+B bidding will be discussed below) The corridor itself was confined in space that promoted innovation and creativity in design and construction Full road closures were also utilized during weekends The project was constructed in 330 days instead of the anticipated 480 days with minimal traffic disruption (FHWA 2007)
US Hwy 52 Rochester Minnesota US Highway 52 through Rochester Minnesota is an urban freeway with complete access control In the 1990s MnDOT completed the environmental documents for reconstructing Highway 52 and started the preliminary engineering and construction phasing concepts Intending to reconstruct the roadway through a series of individual contracts the initial plan was to reconstruct the roadway over 11 years The Rochester business community voiced its opinion that this schedule was problematic and MnDOT developed a second plan that reduced the construction period to six years Again the business community asked MnDOT if the agency could develop a less disruptive plan Having successfully experimented with design-build contracting with smaller projects (an interchange and several miles of a rural highway) MnDOT officials decided to employ design-build on Highway 52 which became known as the Roc 52 project After selecting a design-build team in 2002 the roadway was reconstructed and fully open for use in 2005 after three years of construction In 2006 the landscaping for the project was completed and all project activities were complete Instead of 11 years of disruption the project was delivered after only 3 years of disruption
352 Lane Rental
Background
Lane rental is a contracting technique in which the contractor is charged a fee to occupy lanes or shoulders during construction operations The objective of this technique is to encourage the contractor through a monetary incentive to minimize the time that travel lanes and shoulders are closed and thus impeding traffic flow To minimize the lane occupancy frequency and duration the contractor is encouraged to use innovative construction techniques and project phasing (Strong 2005) The technique can also reduce the number of detours for the traveling public
The fee is based on the estimated cost of delay or inconvenience imposed on the motorists derived from road user costs added to the costs incurred by the agency Fees can be assessed based on work schedule (eg weekdays or weekends) work duration (eg hourly periods during the day) and lane location (eg left lane of center lane) Fees can also vary by time period such as hourly or daily An obstruction that lasts more than 15 minutes is typically considered for fee assessment (Strong 2005) With the combination of different possibilities lane rental fees can vary depending on the time of day location and extent in order to encourage lane closures during off-peak hours by charging a less expensive fee during this time (Anderson and Ullman 2000)
42
If used lane rental should be taken into account during the bid and as the contract progresses In the A+B contracting technique (discussed below) lane rental can be applied through A+BLRC where A is the cost of the project B is the total number of days subject to lane closures that are required to complete the contract work and LRC is the lane rental cost (WSDOT 2007b) During the bidding process the contractor determines the number of lane closures needed which is included in the bid proposal
353 A+B and A+B+C Contracting
Background
A+B bidding is cost plus time bidding The bid package incorporates the dollar amount of the work to be performed (A) and the time amount (B) usually in calendar days that will be required to complete the project The time portion of the bid can be multiplied by the calculated daily road user cost (RUC) The RUC term is applied to an individual location or segment and signifies how much the road is worth to the drivers (Strong 2005) The winning bid has the lowest combined project cost and project time cost The primary benefit of this technique is the potential time savings Since part of the bid is based on the project duration which impacts traffic the contractor wants to minimize the time spent to reduce the total bid amount This type of bidding is intended to encourage contractors to more actively manage their work schedule and to adopt innovative and aggressive scheduling and construction management processes in order to shorten the project duration and reduce public user costs
Another form of cost plus time bidding is created by adding a third component (C) that accounts for future rehabilitation reconstruction and user delay costs forming A+B+C contracting (Cervarich 2002) This method estimates the frequency and earliest time the road will need maintenance or rehabilitation based on materials and methods used in the project Building a product that will need more frequent maintenance or quicker rehabilitation will increase the life-cycle costs and life-cycle user costs
Implementation Examples
I-10 Louisiana In 2001 the Louisiana Department of Transportation and Development (LA DOTD) initiated its first A+B+C contract The project was on I-10 from US 51 to the Reserve Relieve Canal a project approximately four miles long To help distinguish the material to be used it was determined to use a C term in the bid Of the five bids received four were hot-mix asphalt and one was PCC The winning bid used hot mix asphalt and the life-cycle cost of the asphalt over a 30-year life was approximately $46 million LA DOTD also included an incentivedisincentive clause in the contract The contractor completed the project four days ahead of the maximum time before the contracted completion date for which the incentive could be awarded (Cervarich 2002)
M-10 Lodge Freeway Detroit Michigan For the M-10 Lodge Freeway rehabilitation project in Detroit Michigan MDOT used a competitive A+B bidding process (FHWA 2004f) The project was estimated to take five to six months to complete but through the bid process the
43
contract was written for 65 days of full road closure Because the Howard Street Bridge on the freeway contained many utilities the contract contained an addendum for the deck replacement because of the potentially unpredictable delay from the extensive utility work The project was completed in 53 days and the contractor received an incentive award for finishing early
354 Incentives and Disincentives to Reduce Construction Duration and Impacts
Background
For a combination of different contractual bidding techniques incentives and disincentives may be added to the contract to help reduce project duration and traffic impacts An incentivedisincentive clause encourages timely completion for which the contractor can receive a monetary incentive for completing the project on time without sacrificing quality and safety The contractor may also have to pay money if the project is completed after the deadline The incentive for early completion helps defray accelerated construction costs imposed on the contractor
One form of the incentive clause is a no-excuse incentive This gives the contractor a final date for completing a phase or the entire project The contractor receives a bonus if the project is completed by this date and no award for completion after this date The no-excuse terms vary between agencies such as inclement weather change orders overruns of quantities utility delays or other delays that are invalid reasons for late completion
Implementation Examples
I-65 Bridge of I-20 I-59 and I-65 Interchange Birmingham Alabama During the 2002 reconstruction of southbound I-65 bridge a part of the I-20 I-59 and I-65 interchange in Birmingham Alabama the contract allowed for 90 days until completion and an incentivedisincentive provision of $25000 per day (FHWA 2007) The bridge had been closed after a gasoline tanker fire caused structural damage in which the girders sagged up to three meters The estimated road user cost was estimated at $90000 per day The contractor completed the new bridge in 37 days earning a $1225000 incentive The project cost plus incentive paid was still less than the cost proposed by the second bidder Overall the bridge was removed redesigned and constructed within 53 days
Route 4 and Route 17 Interchange New Jersey In 1998 a $120 million project to reconstruct the Route 4 and Route 17 interchange in New Jersey used incentives to expedite construction (Civil Engineering ASCE 1999) The entire project was estimated to take 30 months but was reduced to 13 a schedule that was encouraged by $7 million in time incentives The original incentive included a $35 million incentive for completing the project by November 25 2000 The project was considerably ahead of schedule after six months and the incentives were renegotiated such that if the interchange was completed (except for the final flyover) by the 1999 Christmas holiday season another $35 million bonus would be awarded This was accepted and awarded to the contractor According to NJDOT the contractor was working 80 to 100 people
44
12 hours per day six or seven days a week and thus some of the incentive award was used for overtime hours
I-25 and I-40 Interchange Albuquerque New Mexico For the Big I interchange project between I-25 and I-40 in Albuquerque New Mexico NMDOT had little money available for cash incentives The agency instead offered innovative incentives such as access to the excess right-of-way For the project NMDOT purchased 21 acres 4 acres of required right-of-way for the project The excess right-of-way was used as a staging area during construction Because the contractor finished ahead of schedule the contractor received the deed for the excess 17 acres along the project and several other tracts of land that were determined as excess to future highway needs from NMDOT (FHWA 2007)
I-95 Wilmington Delaware For the I-95 rehabilitation project in Wilmington Delaware 244 lane miles of roadway were reconstructed DelDOT estimated that the user delay cost was approximately $88000 per day for maintaining the traffic plan the agency was using The project was divided into four phases lasting about 30 to 50 days each Each phase contained a $25000 per day bonus or penalty for up to 10 days of early or late completion Thus for the entire project the contractor had the possibility of earning a $1 million bonus or penalty depending on completion dates (OrsquoNeill 2001)
State Route 68 Arizona For the reconstruction of Arizona State Route 68 in northern Arizona ADOT used a traffic management contract incentive to help limit delays through the work zone (FHWA 2004g) In order to measure the travel times of vehicles through the work zone an ITS travel time system was utilized The system included two monitoring stations and a central processor The monitoring stations utilized an inductive loop in the roadway to activate a digital camera that took a picture of a vehiclersquos license plate when it entered the work zone and another picture when the vehicle left the work zone From these pictures the travel times were computed for vehicles traveling through the work zone The system read approximately 60 of all vehicles moving through the work zone and matched approximately 11 of the plates which was deemed adequate by ADOT The data were compiled into 30-minute averages and sent each month to ADOT The average travel time prior to construction was 17 minutes The contract specified that the average travel time could not exceed 27 minutes which accounted for the reduced speed limit through the work zone To reduce the amount of delay the contractor limited the number of flagging stations in the work zone and the duration of directional closings to two to three minutes The contractor also worked with ADOT and ADOTrsquos pubic relations firm to schedule work periods during non-peak traffic hours The contractor was charged $2150 for each minute of delay incurred per travel lane for each 30 minute interval The potential travel time bonus was set at $400000 and the contractor was charged $14857 The contractor thus received 96 of the bonus
45
355 Interim Completion Dates and Liquidated Damages
Background
Certain functional elements that must be taken out of service for a project such as a ramp bridge or intersection can be specified for completion within a shorter period of time than the time required for the overall contract and these elements can be put into service sooner than other elements Using interim completion dates thus addresses the concerns that local agencies businesses and motorists have regarding the duration of certain segments of the project This method also provides the contractor with incentives or disincentives for expediting a specific portion of the contract within a realistic timeframe However some of the drawbacks of this method include possible increased costs and increased overall contract duration
To restore traffic on critical segments projects for which the damages incurred from closing functional elements clearly outweigh the costs of longer project duration should be considered for interim completion dates Segments that have been identified as places where this technique has successfully been applied include the following segments critical to commuters segments to be completed by the beginning of a school year and segments to be completed before peak shopping periods (WSDOT 2007c)
46
4 CONCLUSIONS
The list of strategies provided in this synthesis is by no means a comprehensive list of all strategies being used by STAs However this synthesis is relatively exhaustive in that it identifies many of the frequently used strategies and many that are relatively new to several agencies Each strategy description has included the components of the strategy applications for implementation and documented case studies that provide examples of successful application When developing transportation management plans a well-rounded and comprehensive group of strategies can be made to work together to mitigate work zone congestion to levels that are acceptable to motorists This synthesis thus provides a tool for STAs to use in the work zone planning stages of a project
47
REFERENCES
AASHTO 1998 Primer on Contracting 2000 Washington DC Highway Subcommittee on Construction American Association of State Highway and Traffic Officials
Algers S E Bernauer M Boero L Breheret C Di Taranto M Dougherty K Fox and J-F Gabard 1997 Review of Micro-simulation Models SMARTEST Project Deliverable No 3 Brussels Belgium European Commission DGVII
Anderson S T Kane and M Jha 2003 Use of Advanced Microscopic Traffic Simulation for Transportation Planning in Des Moines Area Paper presented at the 2003 Mid-Continent Transportation Research Symposium Ames IA httpwwwctreiastateedupubsmidcon2003andersonsimulationpdf
Anderson MD and RR Souleyrette 1998 Simulating Traffic for Incident Management and ITS Investment Decisions Proceedings of Crossroads 2000 7ndash11
Anderson SD and GL Ullman 2000 Reducing and Mitigating Impacts of Lane Occupancy during Construction and Maintenance A Synthesis of Highway Practice NCHRP Synthesis 293 Washington DC Transportation Research Board National Research Council
Arch JP 2002 Incident Management Advances for the Woodrow Wilson Bridge Project Paper presented at Todayrsquos Transportation Challenge Meeting Our Customerrsquos Expectations Palm Harbor FL
Balke KN and GL Ullman 1992 Method for Selecting Among Alternative Incident Detection Strategies FHWATX-921232-12 College Station TX Texas Transportation Institute
Battles SL 2004 Reducing Work Zone-Related Congestion Constructor 86(8) 18ndash20 Bergeron K 2004 The Future is Now Public Roads 67 (6) Bryden JE 2004 Working Safely at Night Paper presented at the 2004 Work Zone Meeting of
the American Road and Transportation Builders Association Baltimore MD Bryden JE and DJ Mace 2002 A Procedure for Assessing and Planning Nighttime Highway
Construction and Maintenance NCHRP Report 475 Washington DC Transportation Research Board and National Research Council
Bushman R and C Berhelot 2005 Response of North Carolina Drivers to a Smart Work Zone System Paper presented at the Annual Meeting of the Transportation Research Board Washington DC CD-ROM
Cairns S C Hass-Klau and P Goodwin 1998 Traffic Impact of Highway Capacity Reductions Assessment of the Evidence London England Transport for London and the Department of the Environment Transportation and the Regions
Ceran T and RB Newman 1992 Maintenance Considerations in Highway Design NCHRP Report 349 Washington DC Transportation Research Board National Research Council
Cervarich MB 2002 Timing Delays Like Relays State DOTs Study New Ways to Speed Construction in Consideration of Cost to Commuters Roads and Bridges 40(1)
Chitturi MV and R Benekohal 2005 Comparison of Queue Length Estimates from QUEWZ FRESIM and QuickZone with Field Data Paper presented at the Institute of Transportation Engineers 2005 Technical Conference and Exhibit Las Vegas NV
Civil Engineering ASCE 1999 Incentives Accelerate Interchange Work in New Jersey Civil Engineering 69(11) 14ndash15
Cole LW and GF Voigt 1996 Roadway Rehabilitation with Fast-Track Concrete Paving Civil Engineering News 8(3) 29ndash40
48
Cyra SJ 2002 Traffic Incident Management Rebuilding the Marquette Interchange Paper presented at Todayrsquos Transportation Challenge Meeting Our Customerrsquos Expectations Palm Harbor FL
Dalzeill E and A Nicholson 2001 Risk and Impact of Natural Hazards on a Road Network Journal of Transportation Engineering 127(2) 159ndash165
Dixon KK and JE Hummer 1995 Capacity and Delay in Major Freeway Construction Report 23241-94-8 Raleigh NC Center for Transportation Engineering Studies North Carolina State University
Dixon KK JE Hummer and NM Rouphail 1998 Comparison of Rural Freeway Work Zones Queue Length Estimation Techniques A Case Study Paper presented at the Annual Meeting of the Transportation Research Board Washington DC
FDOT 1997 Alternate Contracting Userrsquos Guide Tallahassee FL Florida Department of Transportation
Ferragut T 2003 Accelerated Highway Construction Workshop Series Summary Report No E-C059 Transportation Research E-Circular Washington DC Transportation Research Board
FHWA 2000 Work Zone Operations Best Practices Guidebook FHWA-OP-00-010 Washington DC Federal Highway Administration American Association of State Highway and Transportation Officials 2000 httpwwwopsfhwadotgovwzpracticesbestDefaulthtm
FHWA 2001a Informed Motorists Fewer Crashes Using Intelligent Transportation Systems in Work Zones Washington DC US Department of Transportation ITS Joint Program Office and FHWA Work Zone Team
FHWA 2001b Fact Sheet 5 Innovation During Bridge Rehabilitation Improves Mobility WinterSpring 2001 Washington DC Federal Highway Administration Illinois Department of Transportation httpopsfhwadotgovwzpracticesfactsheetsfactsheet5htm
FHWA 2003a Freeway Management Operations Handbook Washington DC Federal Highway Administration
FHWA 2003b Fact Sheet 8 Ohio Keeps Motorists and Road Rehabilitation Moving Forward Summer 2003 Columbus OH Federal Highway Administration Ohio Department of Transportation httpopsfhwadotgovwzpracticesfactsheets factsheet8htmfigure1
FHWA 2003c Shorter Duration Safer Work Zones More Satisfied Travelers Successful Applications of Full Road Closure in Work Zones FHWA-OP-03-086 Washington DC Federal Highway Administration
FHWA 2003d Full Road Closure for Work Zone Operations A Cross Cutting Study Reducing Congestion and Crashes through Full Road Closure for Maintenance and Construction Washington DC Federal Highway Administration
FHWA 2004a Work Zone Safety and Mobility Federal Register Vol 69 No 174 23 CFR Part 630
FHWA 2004b Intelligent Transportation Systems in Work Zones A Case Study Keeping Traffic Moving During Reconstruction of the Big I A Major Interstate-Interstate Interchange in Albuquerque FHWA-OP-04-072 Washington DC Federal Highway Administration
FHWA 2004c Intelligent Transportation Systems in Work Zones A Case Study Using an Automated Traffic Information System to Reduce Congestion and Improve Safety During Reconstruction of the I-55 Lake Springfield Bridge in Illinois FHWA-HOP-04-018 Washington DC Federal Highway Administration
49
FHWA 2004d Full Road Closure for Work Zone Operations A Case Study Reducing the Impact of Construction During the Rehabilitation of a Major Interstate Highway- Interstate 95 in Wilmington Delaware FHWA-HOP-05-012 Washington DC Federal Highway Administration
FHWA 2004e Full Road Closure for Work Zone Operations A Case Study Using Weekend Closures to Expedite Road Rehabilitation and Minimize the Impacts on Motorists and Road Builders I-84 Banfield Freeway in Portland Oregon FHWA-HOP-05-014 Washington DC Federal Highway Administration
FHWA 2004f Full Road Closure for Work Zone Operations A Case Study Accelerating Construction and Reducing Crashes During the Rehabilitation of a Major Downtown Route M-10 Lodge Freeway in Detroit Michigan FHWA-HOP-05-013 Washington DC Federal Highway Administration
FHWA 2004g Intelligent Transportation Systems in Work Zones A Case Study Reducing Congestion with the Use of a Traffic Management Contract Incentive during the Reconstruction of Arizona State Route 68 FHWA-HOP-04-032 Washington DC Federal Highway Administration
FHWA 2004h Mitigating Traffic Congestion The Role of Demand-Side Strategies Washington DC Association for Commuter Transportation UrbanTrans Consultants Inc and Parson Brinkerhoff and ESTC httpopsfhwadotgovpublicationsmitig_traf_cong
FHWA 2004i I-25 and I-225 Reconstruction Denver CO Washington DC UrbanTrans Consultants Inc Parson Brinkerhoff and ESTC httpopsfhwadotgovpublicationsmitig_traf_congdenver_casehtm
FHWA 2004j FHWA Research and Technology Prefabricated Bridge Elements and Systems Washington DC Federal Highway Administration wwwfhwadotgovrnt4utiprefab_bridge
FHWA 2007 Success Stories Highways for Life Federal Highway Administration 2006 httpwwwfhwadotgovhflsuccesscfm
Fox K 2007 Micro-Simulation Halcrow Group httpwwwmicrosimulationdrfoxorguk GDOT 2006 Navigator The Georgia Department of Transporationrsquos Intelligent
Transportation System Georgia Department of Transportation httpwwwgeorgia-navigatorcom
Hofener MS 2003 A Check List for Work Zone Incident Management Plans Compendium Papers on Advanced Surface Transportation Systems College Station TX Texas Transportation Institute
Horowitz A and T Notbohm 2003 Evaluation of Intellizone A System for Providing Speed Advisories to Drivers Entering Work Zones Milwaukee WI University of Wisconsin at Milwaukee Wisconsin Department of Transportation and Midwest Smart Work Zone Deployment Initiative
Iowa DOT 2007 511 Travel Information Des Moines Metro 2006 Ames IA Iowa Department of Transportation httpwww511iaorgDM_Metroaspdisplay=allamparea =IA_DesMoinesampdate=amptextOnly=False
Kamyab A T MacDonald B Storm and M Anderson-Wilk 2003 Effectiveness of Extra Law Enforcement in Construction and Maintenance Zones Ames IA Center for Transportation Research and Education Iowa State University
Maryland SHA 2005 Work Zone Safety Toolbox Baltimore MD Maryland State Highway Administration Office of Traffic and Safety
50
Maze TH GD Burchett and J Hochstein 2005 Synthesis of Procedures to Forecast and Monitor Work Zone Safety and Mobility Ames IA Center for Transportation Research and Education Iowa State University
Maze TH SD Schrock and KS VanDerHorst 1999 Traffic Management Strategies for Merge Areas in Rural Interstate Work Zones Ames IA Center for Transportation Research and Education Iowa State University
McTrans 2007 CORSIM McTrans University of Florida httpmctransceufleduindexhtm Memmott JL and CL Dudek 1982 A Model to Calculate the Road User Cost at Work Zones
FHWATX-8320+292-1 College Station TX Texas Transportation Institute MDOT 2006 Fix Detroit Six Lansing MI Michigan Department of Transportation
httpwwwmichigangovmdot016077-151-9621_11008_28818---00html Miller T (nd) Missouri Department of Transportation (MoDOT) Blanchette Bridge
Reconstruction Project Jefferson City MO Missouri Department of Transportation httpwwwplaningdotgovDocumentsPublicInvolvementblanchettehtm
Noyes PB 2002 Mainstreaming Incident Management in Design-Build The T-Rex Experience Paper presented at the ITE 2002 Annual Meeting and Exhibit Philadelphia PA
ODOT 2000 Traffic Management in Work Zones Interstate and Other Freeways Policy No 516-003(P) Columbus OH Office of Traffic Engineering Ohio Department of Transportation
ODOT 2006 Permitted Lane Closures Columbus OH Office of Traffic Engineering Ohio Department of Transportation httpplcmdotstateohusplcm plcm_webjsp
OrsquoNeill D 2001 I-95 Reconstruction and the Five Elements of Mobility Wilmington DE Delaware Department of Transportation
Rakha H M Van Aerde L Bloomberg and X Huang 1999 Construction and Calibration of a Large-scale Micro-Simulation Model of the Salt Lake Area Paper presented at the Annual Meeting of the Transportation Research Board Washington DC
Robinson J 1989 Whatrsquos New in Freeway Incident Detection Response Paper presented at the ITE International Conference Dallas TX
Rohlf JG 1994 Innovative Contracting Practices TR News 175 Saag JB 1999 Project Development Methodologies for Reconstruction of Urban Freeways and
Expressways Synthesis of Highway Practice 273 Washington DC National Cooperative Highway Research Program
Schnell T and F Aktan 2001 On the Accuracy of Commercially Available Macroscopic and Microscopic Traffic Simulation Tools for Predication of Workzone Traffic FHWAHWA-200108 Columbus OH Ohio Department of Transportation
Schnell T JS Mohror and F Aktan 2002 Evaluation of Traffic Flow Analysis Tools Applied to Work Zones based on Flow Data Collected in the Field Paper presented at the Annual Meeting of the Transportation Research Board Washington DC
Scriba T 2004 Striving for Better Work-Zone Management and Communications through ITS Transportation Management and Engineering 9 (1)
Shepard FD and BH Cottrell Jr 1986 Benefits and Safety Impact of Night Work-Zone Activities Transportation Research Record 1086
Sorenson J 2001 Acceleration Creates Rapid Rewards Faster Construction Practices Improve Work-Zone Safety and Are Preferred By Motorists Roads and Bridges Vol 39 Issue 9 18
Stahl KR and MA Gutierrez 2004 Get In Get Out Stay Out Caltrans Proves Effectiveness of Pavement Renewal Approach TR News 232 3ndash13
51
Steinke DP L Sanderson JF Byrnes Jr J Conrad R Forrestel K Harrington-Hughes KF Kobetsky S Lanford K Snyder-Petty D Testa and JD Wilkerson 2000 Methods and Procedures to Reduce Motorist Delays in European Work Zones Washington DC American Trade Initiatives and Federal Highway Administration
Strong K 2005 Performance Effectiveness of Design-Build Lane Rental and A+B Contracting Techniques Ames IA Center for Transportation Research and Education Iowa State University
Sullivan EC 1989 Accident Rates During Nighttime Construction UCB-ITS-RR-89-11 Berkeley CA Institute of Transportation Studies University of California Berkeley
TMA 2006 avoidtherushorg Transportation Management Association Des Moines Metro Area httpwwwavoidtherushorg
Trafficware Ltd 2007 Products Sim Traffic 7 httpwwwtrafficwarecomproductshtml TransOptions 2006 Denver Metro Area wwwgotransoptionscom WSDOT 2007a Flexible Start Date Washington State Department of Transportation
httpwwwwsdotwagovProjectsdeliveryalternativeFlexibleStarthtm WSDOT 2007b Lane Rental Washington State Department of Transportation
httpwwwwsdotwagovProjectsdeliveryalternativeLaneRentalhtm WSDOT 2007c Interim Completion Dates Washington State Department of Transportation
httpwwwwsdotwagovProjectsdeliveryalternativeInterimCompletion
52
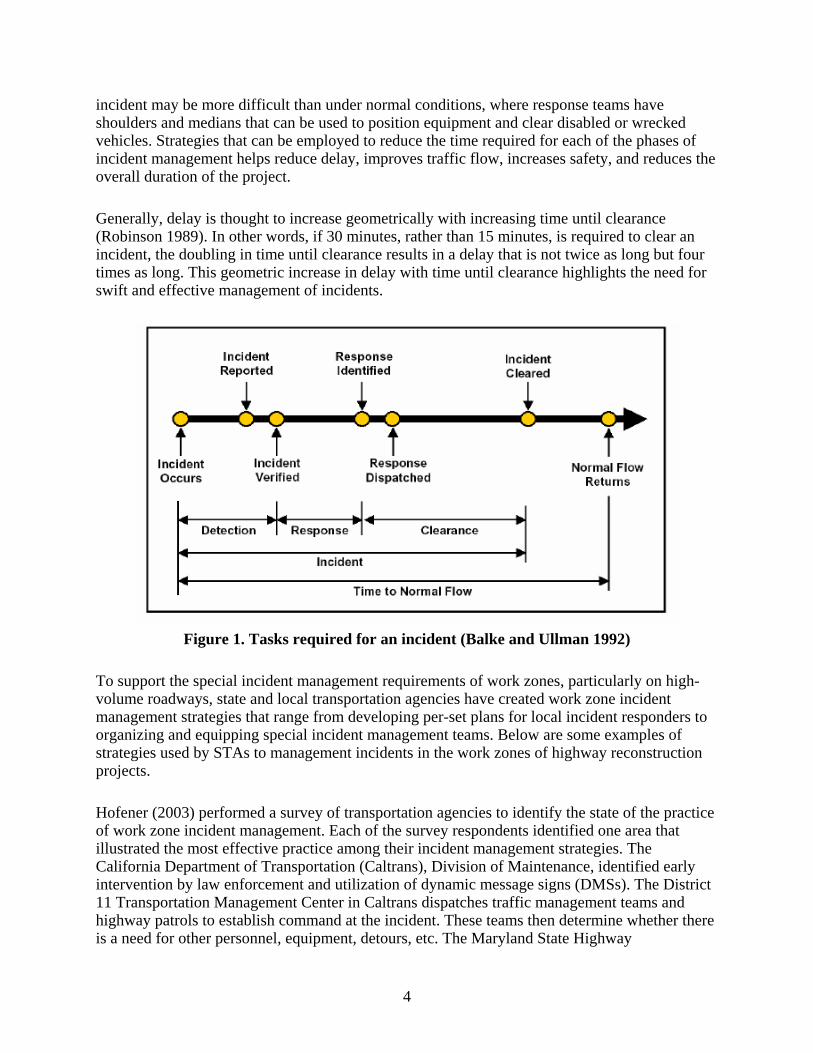
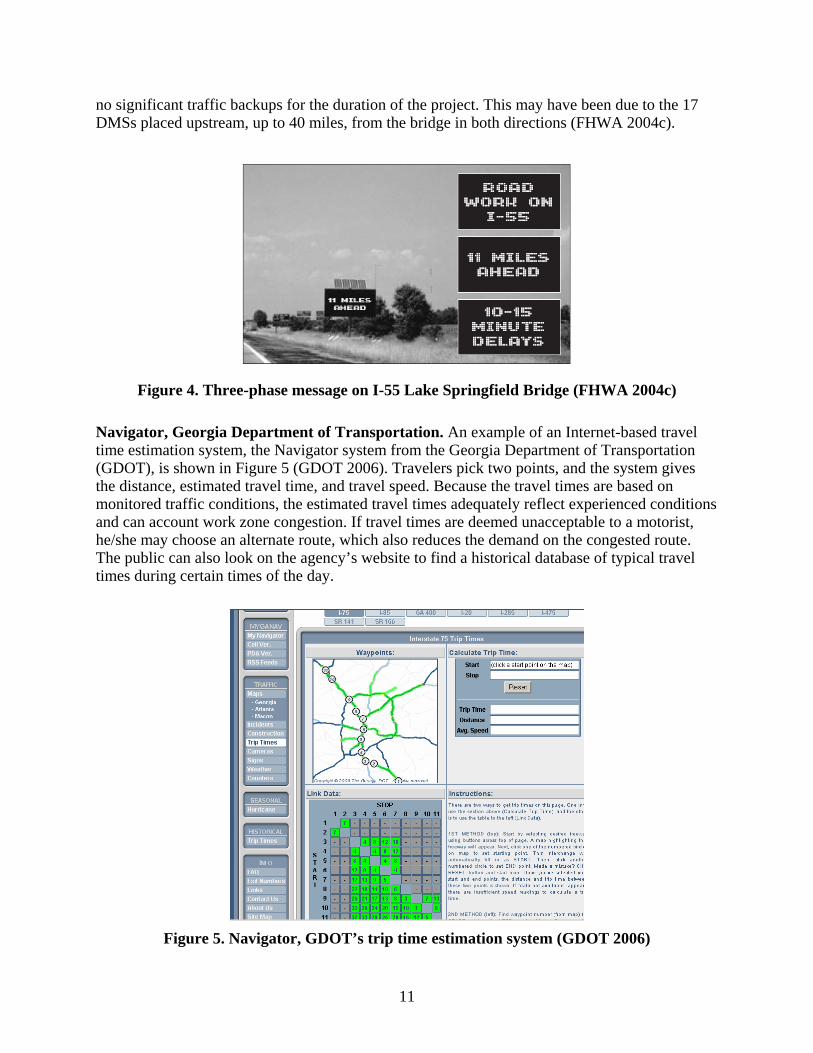
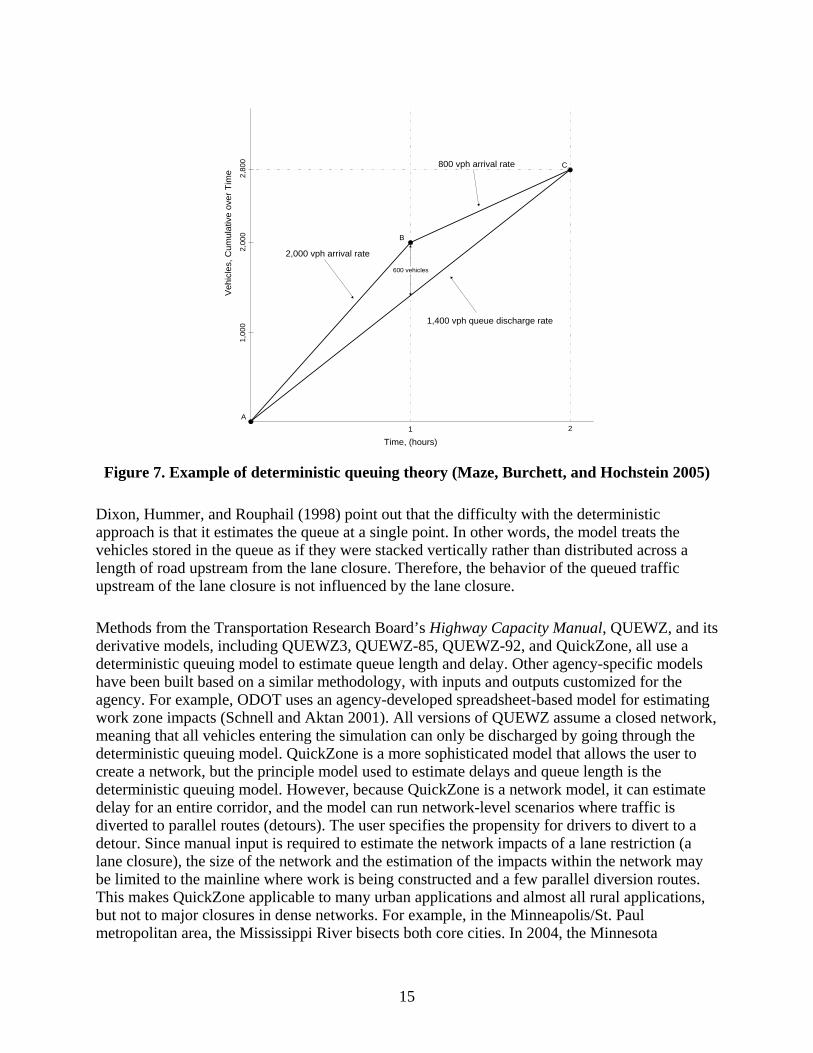
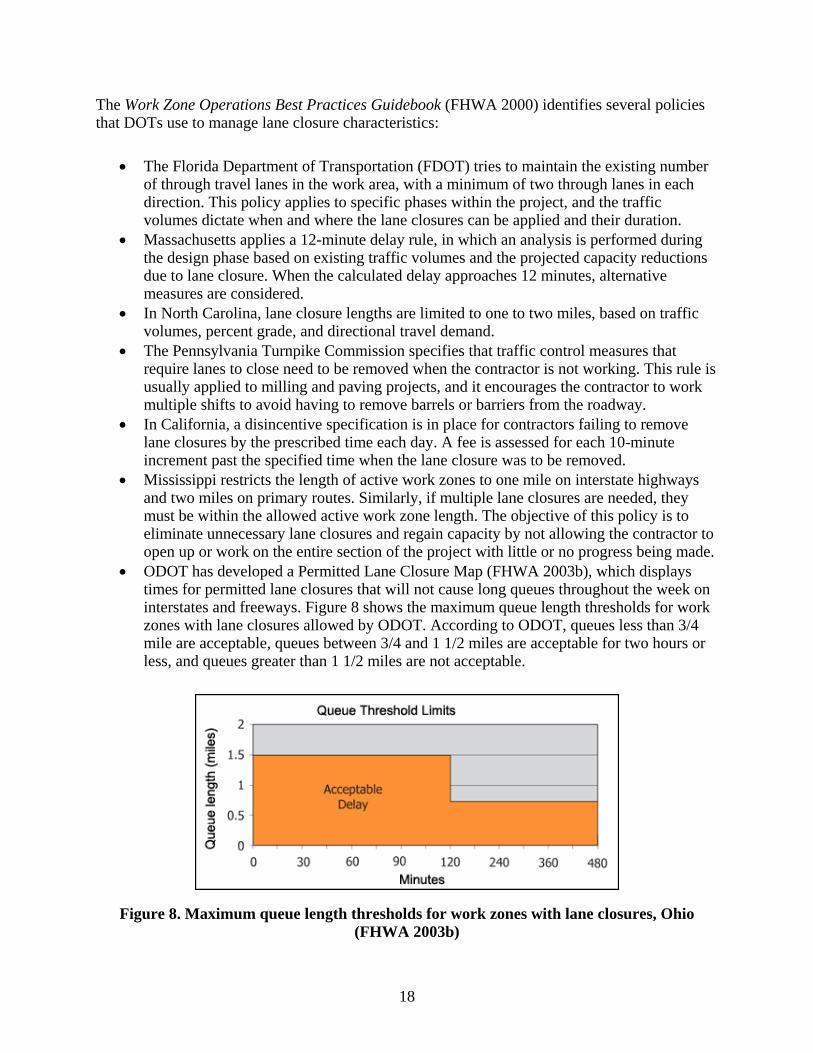
Implementation Examples
I-84 Portland Oregon In the Portland Oregon I-84 reconstruction project which used weekend closures the public information campaign began months ahead of the first construction date The public information campaign included personal telephone calls and direct mail to homes and businesses within the corridor including taxi companies tourism bureaus and travel agents For updates prior to and during the project radio ads a project website a telephone information line media alerts and event information an informational kiosk at a large local shopping mall and countertop informational displays at local businesses were utilized (FHWA 2004e)
I-95 Wilmington Delaware For the I-95 rehabilitation project in Wilmington Delaware the public outreach began two years prior to project implementation DelDOT increased awareness of the project by placing advertisements in local newspapers holding outreach events and public informational meetings and creating a ldquosurvival guiderdquo that explained the project when the project would occur and how a motorist should plan ahead Additionally a character was created named ldquoCreeprdquo who made public appearances People could also go online to play a game where they could try to ldquobeat the creeprdquo by taking alternate ramps or routes allowing for extra travel time and using carpool or transit options DelDOT also purchased a radio station prior to the project that was used to relate traffic and travel information on a 24-hour basis for this and future projects (FHWA 2004d)
M-10 Lodge Freeway Detroit Michigan The rehabilitation project of the M-10 Lodge Freeway in Detroit Michigan was part of the Fix Detroit 6 program that coordinated six high-profile projects in the Detroit area that took place during the 2002 and 2003 construction seasons The public information campaign on the Fix Detroit 6 program included distribution of fliers television and radio ads and coverage in local newspaper traffic columns A project website also gave information on project plan updates progress and closures (FHWA 2004f)
State Route 68 Arizona During the reconstruction of 135 miles of Arizona State Route 68 from 2000 to 2002 the Arizona Department of Transportation (ADOT) made extensive public information outreach efforts ADOT hired a public relations firm to provide public information and raise awareness through public service announcements cable television announcements radio media alerts an informational telephone number and a project website Newsletters were mailed out three to four times per year and contained project status updates and answers to frequently asked questions Faxes were also sent to 144 businesses and individuals The informational telephone number connected to a live person on MondayndashFriday from 800 am to 500 pm and during other times the caller was connected to a recording where the public relations firm could reply during working hours to any questions or concerns (FHWA 2004g)
23
323 Demand-Side Traffic Management Strategies
Background
There are a variety of travel demand management strategies that can be applied to reduce peaking traffic volumes while a major urban facility is being reconstructed As was discovered by Cairns Hass-Klau and Goodwin (1998) travelers are resilient and will find options if given information on the impact of a facility closure or a capacity reduction Demand-side strategies are designed by blending together actions that may result in efficient travel choices Individuals and organizations make these travel choices which collectively impact the efficiency and performance of the entire transportation system but which especially impact travel through the part of the urban network affected by highway construction Elements of choices include both day-to-day choices about travel mode departure-time and travel route as well as trip reduction choices (ie telecommuting) and even business and residence location choices (FHWA 2004h) An illustrative (not comprehensive) list of strategies that may be applied to reduce travel demand during highway reconstruction may include the following
bull Incentives for changing time of travel o Encourage employers to permit flextime o Coordinate work zone activities with shift changes o Reduced parking prices for particular times of day or preferred locations
bull Modal strategies o Guaranteed ride home when work demands make it impossible to leave work to
meet transit service schedule o Reduced cost transit pass programs o Financing for shared vehicles (van pools) o Parking price and location incentives for vehicles shared by employees
bull Trip reduction strategies o Employersrsquo adoption of telecommuting programs and policies o Compressed work week programs
Each situation is unique and the organizations that are available to assist in implementing demand management strategies vary by urban area However strategies are most commonly implemented through work with a TMA or transportation management organization (TMO) For example before a TMA was established in Des Moines the Iowa DOT and its regional government partners created a TMA initially to help with travel demand management during I-235 construction
TMAs are non-profit associations that look at ways to reduce congestion and increase traveler mobility throughout all modes in a transportation network TMAs partner with employers developers political entities chambers of commerce state highway departments planning commissions and other transportation-related agencies to reduce congestion and increase mobility Because of its private status and because TMAs are a recognized organization for
24
seeking solutions with private and public partners TMAs are uniquely qualified to institute demand reduction strategies to reduce the traffic congestion impacts of work zones
Implementation Examples
I-70 Blanchette Bridge St Louis Missouri The Blanchette Bridge on I-70 crosses the Missouri River to the northwest of St Louis (Figure 12) In 1997 the Blanchette Bridge was schedule for rehabilitation (Miller nd) The bridge is the most heavily trafficked section of interstate in Missouri carrying more than 200000 vehicles per day The Missouri Department of Transportation (MoDOT) decided that it would try to impact travel demand through its own outreach program to major employers in the region (Ford General Motors Boeing and many others) private associations (the Missouri Motor Carriers Association and the TMA) impacted governments (the regional transit operator and local governments) and individuals by increasing traveler information (eg paid radio advertisements on the project and lane closures) Construction on the bridge was intended to last only three months allowing employers and employees to implement temporary changes that they might otherwise not be willing to implement permanently
MoDOT met with employers and encouraged them to consider work schedule adjustments flextime and compressed work weeks MoDOT also encouraged employers to promote carpools vanpools and the use of public transit Although MoDOT did not quantify the impact of their outreach campaign the heightened levels of congestion that were expected never appeared In the headlines of the St Louis Post-Dispatch newspaper MoDOT even received positive comments on its handling of the project In retrospect the project management team noted that travel choice modifications made during construction were largely transitory and only the car pooling program sustained itself after construction was completed
Figure 12 Blanchette Bridge during reconstruction
25
I-25 and I-225 Denver Colorado The reconstruction of the interchange between I-25 and I-225 the addition of lanes for each interstate in the Denver area and the construction of 19 miles of light rail line 13 light rail stations and new light rail maintenance facilities were all part of one large-scale project known as T-REX (FHWA 2004i) This project had a significant mobility impact over its six-year life and it was completed in the fall of 2006 two years ahead of schedule In anticipation of the projectrsquos impacts and to mitigate these impacts the Colorado Department of Transportation and the Regional Transportation District created the TransOptions program (Figure 13) TransOptions largely promotes travel options for single-operator vehicle commuting The program worked with and built on the programs created by the existing TMAs and TMOs in the region GoTransOptionscom shown in Figure 16 lists commuting options in the Denver metro area and lists the 10 partner agencies
Figure 13 TransOptions for the Denver Metro Area (TransOptions 2006)
In an evaluation of the TranOptions Program UrbanTrans Consultants found that the program reduced the amount of vehicle miles traveled (VMT) by 74800 miles daily The reduction in VMT was largely a result of employer-purchased transit passes subsidized vanpools and individual commuters buying low-cost transit passes
33 Alternative Project Scheduling and Phasing Strategies
Several road user cost reduction benefits are possible with the use of alternative project scheduling and phasing strategies Examples of these benefits include a reduction of total project duration reduction of lane occupancy time throughout the project or during specific phases and the avoidance of peak traffic volume periods This section explains the following strategies
1 Nighttime construction to alleviate congestion 2 Full road closure to reduce total construction time 3 Detour routes 4 Flexible project start-up dates and a focus on schedules to reduce project duration 5 Rolling roadblocks
26
331 Nighttime Construction to Alleviate Congestion
Background
Generally there are two main reasons for conducting nighttime construction and maintenance operations (1) to allow work over a longer period of light traffic than is possible during the off-peak daylight hours and (2) to decrease or eliminate the excessive traffic delays and congestion associated with lane closures during daylight hours (Shepard and Cottrell 1986) However nighttime work has some disadvantages compared to daytime work The quality of the work may suffer and the safety of workers and drivers may decrease due to poor lighting and reduced worker and driver attentiveness Construction costs are generally higher due to labor overtime and night-premium pay lighting expense added traffic control costs and increased materials costs The glare and shadows created by work zone lighting (Figure 14) drowsiness or lack of attentiveness of drivers at night and a greater likelihood that drivers may use drugs or alcohol at night may create a more dangerous work zone environment than under daytime conditions For example Sullivan (1989) studied several urban work zones in California and found that crash rates increased by 87 compared to daytime work zone crash rates
The advantages of nighttime construction include lower traffic volumes a longer period of uninterrupted work than allowed during the daytime and the possibility of closing more lanes Some states if the operations last only a few days will allow traffic to become congested due to a reconstruction-related lane closure to avoid nighttime work (Shepard and Cottrell 1986) However a lane closure causing increased congestion for more than a few days leads to adverse public reactions as well an increase in user delay costs According to Shepard and Cottrell (1986) the allowed impact on traffic is related to the motoring publicrsquos tolerance of what is and is not acceptable in terms of delay and queue lengths
During nighttime work there should be a balance between a high level of safety minimum congestion and access to the work area comparable to daylight-hour traffic control strategies (Bryden and Mace 2002) Therefore to consider a nighttime work zone there needs to be a benefit of reduced traffic volumes and easy setup and removal of traffic control on a nightly basis The traffic control and operations need to be completed and restored to normal operating conditions before the beginning of the morning peak to avoid delay and long queues due to a lane closure
27
Figure 14 Glare of winter lighting (Bryden 2004)
When Maze et al (2005) interviewed 30 STAs most reported that they are increasingly conducting reconstruction work at night to avoid daytime road closures Some STAs in states that are largely urban reported that all or the majority of reconstruction work in large urban areas is conducted at night For example an interviewed staff member from the Maryland State Highway Administration estimated that 85 of the administrationrsquos reconstruction work is conducted at night
Since every work site is unique night work needs to be compared to other traffic management options to determine the most desirable method for managing traffic safely While night work has its benefits when compared to other possible traffic management plans night work also has road user and project costs National Cooperative Highway Research Program Report 475 includes a very specific four-task methodology for assessing the appropriateness of night work in comparison to or in coordination with other strategies (Bryden and Mace 2002) The tasks include the following
1 Gather information (traffic demand diversion routes potential for traffic control operations including demand-side options )
2 Develop traffic control options (identify and define feasible options for traffic control) 3 Evaluate volumecapacity (from the list developed in task two determine the strategy or
combination of strategies that will result in acceptable levels of congestion and delay) 4 Cost-effectiveness analysis (compare the effectiveness of each strategy including that of
nighttime work)
28
332 Full Closures to Reduce Total Construction Time
Background
A full road closure involves rerouting all traffic and giving the contractor full access to the roadway with the expectation that construction time will be dramatically reduced (Battles 2004) While motorists are inconvenienced the inconvenience will last for fewer days than if individual lanes were closed Trucks delivering material will be unimpeded by traffic within the work zone and equipment will not be restricted by open lanes of traffic These increased available workspaces can improve productivity There is also the potential for reducing the number of joints and seams in the paving resulting in a smoother roadway All operations can run continuously with 24-hourday work which eliminates inefficiencies resulting from stopping and starting work Full road closures are commonly used over three time durations (1) weekend closures in which work can be completed over a weekend (2) nighttime closures typically maintenance work work that can be completed in one nighttime or reconstruction work that can be staged so the roadway can be reopened during the day and (3) full-time closures in which work continues through the week and weekend Utilizing full closures at night and on weekends has the advantage of avoiding peak weekday traffic Full road closures can greatly reduce the duration of project causing greater disruption to normal travel patterns for short periods of time and reducing overall traffic exposure to work zones
Implementation Examples
I-65 Louisville Kentucky The Kentucky Transportation Cabinet used a full closure on a section of I-65 near Louisville The project was estimated to take 90 days with a conventional partial closure of I-65 during construction activities but the project only took 104 hours over two weekends when the contractor was allowed full closures over the weekends (FHWA 2003c)
M-10 Lodge Freeway Detroit Michigan In the Detroit Michigan area during the M-10 rehabilitation project the Michigan Department of Transportation (MDOT) used a bidirectional full closure to ensure the project would be completed in one season This project was part of the Fix Detroit 6 program discussed in section 321 of this report The traffic in the direction of the closure was detoured off of the freeway Without the full closure it was estimated that the project duration would have been six months However the contract was written for 65 days of full closure with incentives and the project was completed in 53 days (FHWA 2004f)
I-75 Detroit Michigan Another project within the Fix Detroit 6 program in Detroit Michigan was the rehabilitation of I-75 This highway carries a significant number of commercial vehicles to and from Detroit in international commerce across the Canadian border Because of this it was determined that commercial vehicle traffic needed to use this facility during construction Therefore MDOT used a limited capacity closure in which a lane was left open in each direction on one side of the highway The lanes on the other side were completely closed for rehabilitation The two lanes of traffic were specifically left open for commercial vehicles and served as an express route because intermediate entry and exit ramps on the route were closed This method reduced congestion on alternate routes by allowing commercial traffic on I-75 and
29
the speed and quality of work was improved because the contractor had exclusive use of one side of the highway (FHWA 2003d)
I-84 Banfield Freeway Portland Oregon The I-84 Banfield Freeway rehabilitation project near Portland Oregon utilized a full road closure to expedite construction time The Oregon Department of Transportation used directional road closures over two consecutive weekends instead of using the traditional part-width night construction Detours were used to divert traffic traveling in the direction of the full closure The project was completed in 112 hours which can be compared to the estimated 320 hours (32 nights) for nighttime work (FHWA 2004e)
333 Detour Routes
Background
Detour routes are needed during a full road closure to get motorists to their destinations when the original road is closed Because a full closure often results in a significant reduction in project duration designing a detour that results in acceptable delays (either through increased travel distances or congestion) is essential to a successful full closure Effective detour designs require that the detour should run parallel to or near the closed road to avoid creating unreasonable travel distances and delays and the alternative route must have reserve capacity to be able to handle the increased traffic without creating significant delays Improvements to the alternative route may need to be considered such as temporary removal of curb-side parking addition of lanes traffic signal improvements removal of geometric bottle necks etc Detour information is usually distributed through public outreach campaigns posted on the project websites displayed on the roadways affected by the closure through ITS technology trailblazing and other signs and markings distributed via routing maps through the media and displayed through the use of enforcement personnel to help direct traffic
Implementation Examples
M-10 Lodge Freeway Detroit Michigan The M-10 Lodge Freeway rehabilitation project in the Detroit area used detours during weekend full road closure times Before determining the detour route MDOT personnel collected samples of actual travel times on alternate routes during peak hours and all alternative routes experienced acceptable delays on the weekends before the weekend closures of the Lodge Freeway During the full closures the detour routes experienced minimal increased travel delays except for an exit ramp where motorists attempted to avoid the prescribed detour A final assessment of the project indicated that even though MDOT recommended alternate routes on state roads motorists would still divert to local roads and alternatives within the dense urban roadway network Even though motorists seemed quite able to navigate to their destinations on surface streets it was deemed important to identify and provide specific alternate routes to accommodate diverted traffic volumes (FHWA 2004f)
I-84 Banfield Freeway Portland Oregon During directional weekend closures used in the I-84 rehabilitation in Portland Oregon the alternate routes experienced minimal impacts to
30
mobility A traffic model was used to estimate the impact of new traffic volumes on the detours and the actual traffic volumes were less than expected (FHWA 2004e)
I-95 Wilmington Delaware For the I-95 rehabilitation project with directional closures in Wilmington Delaware a primary alternate route was used I-495 I-495 is a six-lane highway with existing traffic volumes only equaling 25 of its capacity and operating at a level of service (LOS) of A or B so I-495 had sufficient reserve capacity to absorb traffic diverted from I-95 During the project the LOS on I-495 only dropped to C and the majority of the delay occurred at interchanges (FHWA 2004d)
European Scanning Tour During a European scanning tour (Steinke et al 2000) it was discovered that a couple of European countries use permanent signs that indicate permanent alternate routes that can be used when needed For example Germany uses permanent orange trailblazers that indicate alternative routes that motorists can take to avoid work zones Belgium added the numbers ldquo1rdquo or ldquo2rdquo to all major road signs leading to the ring road around Antwerp When there are work zones or incidents on the ring road DMSs radio announcements and road advisories on the Internet direct motorists to follow one of the numbered alternate routes
334 Flexible Project Start-up Date and Focusing on Schedules to Reduce Project Duration
Background
One way to allow for more efficient project phasing is through flexible starting dates The STA can allow a time window of around 100 days within which the contractor can begin the project after the Notice to Proceed (FDOT 1997 AASHTO 1998) The contractor may choose to delay the project because of material availability worker availability and the desire to avoid special events or other causes of unusually high traffic By allowing the contractor to select a start time that is most advantageous for the contractor and that avoids seasonal high-traffic periods the overall duration of the project should be shortened FDOT as an example uses flexible starting dates for two reasons (FHWA 2000) First flexible dates reduce unnecessary work zones and lane closure durations or public exposure to adverse construction conditions that may result when the contractor is waiting on workers materials or the completion of other tasks Second there is an increased probability of completing construction within the authorized contract time The Oklahoma Department of Transportation has found that when flexible start dates were used with A+B bidding the maximum allowable contract times specified in the bid documents were reduced by 25 (FHWA 2000) The Washington State Department of Transportation (WSDOT) uses a final date specification when the project can start to ensure completion within the scheduled construction season due to a more efficient use of workforce equipment and subcontractors (WSDOT 2007a) However WSDOT only considers a flexible start date if a delayed project start would not adversely impact the traveling public
Another method of improving project phasing is to schedule as many tasks as possible at once Instead of working on one task at a time completing it and moving on to the next even though some tasks are not sequential the contractor can schedule multiple tasks at one time This method is sometimes referred to as a ldquomaintenance gangrdquo Working on multiple tasks helps
31
reduce the project duration or the possibility of closing lane(s) multiple times to perform each task (Anderson and Ullman 2000)
Proper scheduling of tasks can ensure that certain tasks do not need to be completed multiple times This involves good communication with subcontractors and utility agencies to identify what needs to be done in a logical efficient order This will help eliminate the need to reconstruct something that needed to be removed in order to perform another task It is important to communicate with utility agencies and find out any plans the utility has in order to avoid completing a road reconstruction only to have certain sections removed to lay utilities which would require that the road sections be replaced Similar to the justification of flexible starting dates project scheduling should account for material and worker availability (Anderson and Ullman 2000)
335 Rolling Roadblocks
Background
A rolling roadblock is a form of intermittent road closure in which traffic is not detoured but slowed to allow for an adequate gap in traffic for work to be completed on a roadway section A rolling roadblock starts upstream from the work zone (eg 10 miles upstream) with control vehicles blocking the through lanes and pacing the vehicles behind the control vehicles at slower-than-normal speeds (The minimum speed is usually 20 mph) All entrance ramps upstream from the work zone and downstream of the roadblockrsquos beginning point are closed and opened as the rolling roadblock passes This creates a gap between the traffic traveling before and after the rolling roadblock The gap provides the construction workers full access to the roadway for a short period of time An acceptable gap for activities varies by agency and is usually between 5 and 30 minutes (FHWA 2003d) The roadblock is most often initiated by police vehicles (due to laws regarding authority to close a roadway) but agency vehicles with flashing lights or contractor vehicles with flashing lights may be use to form the roadblock Signs should also be placed warning motorists of the situation
The benefits of a rolling roadblock are that the roadblock is a short-term temporary closure of all travel it slows traffic to safe speeds through the work zone and it allows traffic to remain in motion which leads to quicker traffic flow recoveries compared to traffic brought to a complete stop Rolling roadblocks can be initiated when the work is ready to be performed so there is not an unnecessarily long closure or detour One of the disadvantages is that this method may create significant traffic congestion (Maryland SHA 2005) FDOT uses a rolling roadblock method for the following types of activities (not an all-inclusive list) placing bridge beams establishing overhead sign structures and performing other construction where materials are being placed overhead of the lane (FHWA 2000)
A rolling roadblock can also be used to create a longer full road closure Before the full road closure a rolling roadblock is used to divert the traffic behind the roadblock to the alternate routes to ensure no vehicles are in the lanes ready to be closed As the roadblock passes appropriate signs are placed or uncovered to indicate the full road closure and alternate routes
32
Additionally the Ohio Turnpike uses rolling roadblocks to perform structural steel setting utility crossing work or to shift traffic into a new configuration Police officers control each lane of traffic and on-ramps and maintenance staff serve as the last vehicle through The window of work is 10ndash12 minutes and the roadblocks begin 10 miles prior to the work zone It takes about 10 minutes to clear the roadway and the entire closure usually lasts 20ndash25 minutes (FHWA 2003d)
34 Design Alternatives to Minimize Life-Cycle Congestion Costs Strategies
This section identifies design alternatives that are used to minimize life-cycle congestion costs The life-cycle congestion costs are realized in multiple ways such as maintaining the same number of lanes through a work zone or preparing for future mobility issues by designing alternatives that minimize lane occupancy The strategies identified and explained in this section include the following
1 Corridor planning approach 2 Use of alternative materials and methods 3 Prefabrication of project segments 4 Use of temporary pavement and structures 5 Value engineering
341 Corridor Planning Approach
Background
One method for minimizing lane or road closures in a corridor year after year is a corridor planning approach For this approach it is important to understand the role a facility plays in the system-wide transportation plan for the region Considerations for all modes of transportation will also help planners identify the facilities that will need capacity expanding reconstruction and the ways the reconstruction will affect the corridor This method takes into account all projects that may need to be performed within the corridor in the next few years and schedules them simultaneously This scheduling includes performing all maintenance and rehabilitation on roads and bridges (Anderson and Ullman 2000) Studying an entire corridor also encourages state and local agencies to work together to either combine or schedule simultaneous projects within the corridor at the same time By working together the corridor construction is not limited to freeways but encompasses the lower class facilities that connect to the freeway Similarly state and local agencies can consider working with utility companies to encourage necessary line installations or repairs to avoid future utility work The ldquoGet In Get Out Stay Outrdquo approach applies to this method as the transportation agency gets into the corridor performs necessary rehabilitation or reconstruction and then gets out of the corridor for many years
For example MDOT has been utilizing a corridor planning approach on reconstruction and rehabilitation projects especially on high-volume urban freeway projects in the Detroit metro area Within the Fix Detroit 6 corridor projects (including I-75 I-94 I-96 I-696 M-10 and M-39) in or near Detroit all projects were examined using a corridor planning approach Examples of typical work being performed for these six projects include rehabilitating or reconstructing
33
many or all of the crossroad bridges through all six corridors along with rehabilitation or reconstruction of the six freeways (MDOT 2006)
In another example NMDOT utilizes a corridor improvement technique with four components (1) obtain adequate and creative funding (2) develop innovative contractual documents (3) involve the public fully and completely throughout the process and (4) organize and state the work so that there is an identifiable reduction in ldquoorange barrelsrdquo during construction and into the future It is believed that a corridor management approach will better address a more complete strategy and process throughout the corridor (Ferragut 2003)
342 Use of Alternative Materials and Methods
Background
Various alternative materials and methods compared to traditional materials are available for road construction The objective of using an alternative material is to expedite the construction time in order to reduce lane closure and occupancy times reduce the frequency of future maintenance and extend pavement life Although the use of alternative materials and methods may create higher initial costs extending the useful life of the facility and reducing maintenance will most likely decrease the overall life-cycle cost of the facility (Anderson and Ullman 2000)
Different choices are available regarding the type and durability of paving materials Various mixes of asphalt and concrete are available depending on the objective of the rehabilitation or reconstruction One common objective is to reduce the frequency of future highway maintenance and rehabilitation For example Caltrans uses a Long-Life Pavement Rehabilitation Program for Urban Freeways This program is a set of project proposals for multi-year funding through the 4R work on the state system The design life of the rehabilitated pavements is designed to be 30 to 40 years (FHWA 2000)
In another example representatives from the Indiana Department of Transportationrsquos Accelerated Construction Technology Team Workshop have stated that one of the goals of the workshop project was to ldquostay outrdquo after completing I-465 in Indianapolis The workshop created a long-life pavements team to identify possible pavements that could achieve a 60-year useful life (Ferragut 2003) The workshop found that when specifying a project to the designer and contractor the pavement performance goals and objectives should be clearly identified and communicated Doing so allows maximum freedom for determining the design and construction methodology that is best suited for the project The pavement types and designs that were suggested in the workshop included a 60-year portland cement concrete and diamond grinding preventive maintenance 60-year asphalt cement concrete and mill-and-fill preventive maintenance or a composite 60-year portland cement concrete with a stone mastic asphalt layer for mill-and-fill preventive maintenance For pavement below the frost line the design should incorporate underdrains and positive surface drainage across the pavement
In another alternative method engineering fabrics may be used to facilitate subgrade preparation thus reducing project duration The fabric serves the combined purpose of reinforcing the
34
subgrade and separating the aggregate base from the earth material When poor soils are encountered the fabric can be used instead of reworking wet soils or improving soil conditions if they are not acceptable to support the pavement The North Dakota Department of Transportation states that using an engineering fabric reduces the construction time for subgrade preparation by about 50 (Bergeron 2004)
Additionally Cole and Voigt (1996) have listed suggestions to shorten concrete pavement construction time For concrete materials a transportation agency try different cement types use helpful admixtures and use a uniform aggregate grading For jointing and sealing Cole and Voigt (1996) suggested allowing early sawing with ultra-light saws using dry sawing blades using step-cut blades for single-pass joint sawing and using a sealant that is unaffected by moisture or reservoir cleanliness To expedite curing time and understand the temperature relationship the specifications may stipulate that blanket curing be used to aid strength gain when beneficial the concrete should be monitored and the effects of ambient subgrade and mix temperature on strength gain should be understood and the concrete temperature should be elevated before placement
Anderson and Ullman (2000) performed a survey of materials that may help reduce lane occupancy The materials were rated using the following levels of impact medium impact denotes stabilizing soil with lime and cement and using water to cool asphalt pavements on resurfacing projects high to medium impact denotes using flowable or lean-mix concrete for backfill and using hot asphalt with recycling and high impact denotes movable barriers and precast components Anderson and Ullman (2000) also identified the construction methods and equipment used by highway agencies Some agencies specify the equipment to be used on the project with the goal of expediting the construction Contractors also use such types of equipment and methods to reduce project time in order to take advantage of the incentives in the contract Conveyor belts may be specified for transporting excavated materials to provide a constant flow of materials out of the project area and to avoid work area congestion and delay caused by trucks hauling the material Other suggested equipment and methods included mechanized dowel bar insertion wider paving machines and mobile and portable recycling plants to reduce long truck hauling activities
Implementation Examples
I-10 Pomona California On a 15-mile segment of the I-10 Freeway in Pomona Caltrans used fast setting hydraulic cement concrete An innovative method for removing the existing concrete was used that included cutting the pavement into four- by four-foot slabs and lifting and hauling it off the site This method left the subgrade relatively undisturbed and required minimal preparation The concrete achieved 400 psi within four hours and the entire length was completed within the 55-hour weekend closure (Anderson and Ullman 2000)
I-710 Long Beach Harbor California The first project to which Caltrans applied long-life asphalt was on I-710 north of Long Beach Harbor California The asphalt used has a life expectancy of 30 to 35 years which increases the time between rehabilitation projects The project was constructed in eight 55-hour weekend closures in which one direction of travel was
35
closed at a time Traffic was shifted over to the opposite-direction lanes using moveable barriers providing two lanes of travel in each direction (FHWA 2007 Stahl and Gutierrez 2004)
County Route 1 Cabell County West Virginia The Howellrsquos Mill Bridge on County Route 1 in Cabell County West Virginia required hydraulic considerations because it is usually submerged during flood events The bridge needed to be designed to withstand a 100-year storm event The West Virginia Department of Transportation (WVDOT) decided to use a fiber-reinforced polymer bridge deck This allowed for a longer service life for the bridge reducing the frequency of replacement and allowing the bridge to withstand a 100-year storm event (FHWA 2007)
West Virginia Turnpike For a 10-mile reconstruction project on a West Virginia turnpike that links Charleston and I-81 WVDOT used full-depth hot mix asphalt for a rubblization and reconstruction technique WVDOT decided that extensive breaking or rubblizing of the concrete pavement before the asphalt overlay would help reduce the reflective cracking A multiple head breaker capable of 12ndashfoot-wide sections was used The agency was able to complete the project at a rate of one mile per day (Anderson and Ullman 2000)
US 395 Kennewick Washington WSDOT used high early strength concrete on three intersections on US 395 in Kennewick Washington Each intersection was closed Thursday evening at 700 pm and required to reopen by 600 am on Monday The high early strength concrete mix allowed for traffic to be reopened within 12 hours of pouring and all intersections were opened by the Sunday evenings throughout the project (Sorenson 2001)
343 Prefabrication of Project Segments
Background
Prefabricated elements can be constructed on- or off-site under controlled conditions brought to the construction location and then installed (Figure 15) Prefabricated elements minimize construction-related traffic disruptions and improve the constructability of for example bridge designs by controlling the manufacturing environments The fabrication environment can thus facilitate the controlled use of high-performance materials Fabrication off-site can also facilitate modular construction in which repetitive structural units are used to create the completed structure This has been very beneficial in situations where multiple project locations have similar dimensions and the same or similar prefabricated design can be used repeatedly thus reducing costs and expediting construction When working on large projects or many similar projects with the possibility of multiple prefabricated structures such as bridges the bridge designs can be standardized This will help expedite construction time as workers and designers are familiar with the structures and materials On smaller structures such as box culverts and manholescatch basins prefabrication can dramatically reduce construction time On larger structures prefabrication is applicable to both substructures and superstructures Prefabrication may also involve complete-span units that can lifted into position when completed Prefabricated deck panels may be partial-depth and full-depth panels Both provide quicker construction are more durable than a cast-in-place deck and are easily removed and replaced when needed The
36
actual closure times are also reduced since the only process that needs to be accomplished to achieve a drivable roadway is the installation of the panels Moreover the overall benefits of a total prefabricated bridge system as stated by the FHWA include improved constructability lowered life-cycle costs and increased quality through controlled fabrication conditions (FHWA 2004j)
Figure 15 Prefabricated panels used at the Tappan Zee Toll Plaza in New York
Implementation Examples
Dalton Highway Alaska In 1992 the Alaska Department of Transportation and Public Facilities replaced 18 timber bridge decks on the Dalton Highway between Fairbanks and Deadhorse with precast concrete slabs (FHWA 2007) The ADT was only 250 vehicles per day but this road was the only road out of Deadhorse and the North Slope oil fields Concrete slabs were chosen over timber which needed replacement every eight years to save in replacement costs and reduce the recurring impacts to the traveling public It was decided that the road would be closed for 12 hours each day The project was completed in seven months with minimal impact to truck traffic
Church Street Bridge New Haven Connecticut The Connecticut Department of Transportation (ConnDOT) specified a portion of the Church Street Bridge in New Haven Connecticut be completed in one night over a weekend (FHWA 2007) This nighttime process was chosen to minimize the disruption of train service on the lower section of the bridge A 975-meter truss was built off-site along the rail lines and lifted by crane into place as shown in Figure 16 The truss was the main segment of the 390-meter bridge ConnDOT estimates that this method saved one year on the overall contract time
37
Figure 16 Placement of a prefabricated steel truss on Church Street Bridge
Lake St Louis Bridge over I-70 St Charles County Missouri The Lake St Louis Bridge over I-70 in St Charles County was reconstructed in 2003 to accommodate additional lanes (FHWA 2007) The old bridge consisted of two lanes over four spans The new bridge consists of six lanes and only two spans utilizing mechanically stabilized early wall abutments The new bridge was to have precast deck beam sections which allowed for demolition of the old bridge and construction of the new bridge in less than four months
Route 1 Freeway Trenton New Jersey The New Jersey Department of Transportation (NJDOT) installed three bridge decks and superstructure beams on the Route 1 Freeway in Trenton New Jersey in three weekends (FHWA 2007) The bridge decks were prefabricated off-site and installed by the contractor and workday motorists experienced minimal inconvenience NJDOT had expected the project to take nearly two years to complete using traditional methods In another project in New Jersey NJDOT selected a segmental precast construction method for both the superstructure and substructure of the Victory Bridge on Route 35 Using this method NJDOT estimated that the duration of construction would be reduced by at least one year
George P Coleman Bridge Yorktown Virginia In the widening of the George P Coleman Bridge in Yorktown Virginia the Virginia Department of Transportation used an innovative method to construct new trusses and a new bridge deck (FHWA 2007) The truss spans and lightweight concrete bridge deck were constructed on the York River 30 miles downstream of the bridge The finished product was then floated to the bridge on barges as shown in Figure 17 The time to replace the trusses was reduced by 36 days or 60 The contract documents had allowed two 12-day periods to exchange the old truss spans with the new ones but the exchange and restoration to full use took only nine days
38
Figure 17 Barges floating a prefabricated segment to installation location
NE 8th Street Bridge over I-405 Bellevue Washington In 2003 WSDOT completed the NE 8th Street Bridge over I-405 in Bellevue Half of the bridge was constructed at a temporary location and rolled into the permanent position WSDOT had estimated that the bridge would have been closed for up to a year or reduced to half capacity for over a year However the phases included only night and select weekend closures while the prefabricated bridge was slid into place in 12 hours (FHWA 2007)
Aberdeen South Dakota In 2000 the South Dakota Department of Transportation began a bridge construction project in Aberdeen in which a 318-foot steel truss was to be placed on an embankment next to a rail yard (Bergeron 2004) In order to minimize the train traffic disruption the truss was fabricated next to the installation location and then launched on rolling platforms into place with a delay to train traffic of 16 hours It was estimated that using a conventional two-span structure would have caused a disruption to rail service that would have lasted several months and would have required the relocation of several tracks
344 Use of Temporary Pavements and Structures
Background
Temporary pavements or structures through a work zone allow traffic to remain on the same route which can replace a detour route for traffic Temporary pavements can also be used to maintain the same number of lanes while removing traffic from the mainline allowing the contractor to have exclusive use of the work area or they can be used to widen shoulders or add additional lanes adjacent to the existing surface to shift traffic over allowing the contractor to close adjacent lanes While using temporary pavements can help reduce congestion constructing the pavements is expensive and time consuming additional right-of-way may need to be purchased and temporary pavements can be an inefficient use of materials since the pavement will be removed when work is completed If available shoulders may be used as traffic lanes during construction which is a cheap alternative to using temporary pavement However utilizing a shoulder limits the area to which vehicles can remove themselves out of the travel lane when involved in an incident which reduces capacity In addition shoulders may not be
39
constructed to handle truck traffic and may need to be rebuilt after the other lanes are open (ODOT 2000)
Temporary structures may be needed during bridge reconstruction applications In order to maintain traffic in the construction location while using a full road closure a temporary structure may be built over a necessary crossing such as a river This strategy is often an expensive and inefficient use of materials it requires additional time for design and construction and it may require additional right-of-way However prefabricated components can dramatically reduce construction time and many agencies have standard designs for temporary structures (ODOT 2000) For example ODOT widens bridges and adds temporary pavements prior to construction to maintain at least two lanes open in each direction during construction
345 Value Engineering
Background
Value engineering is the process of reviewing and analyzing project components to identify and recommend alternative solutions that will add value to the project by reducing costs including user costs Several areas addressed in value engineering analysis include project phasing and staging changes methods and material changes design changes propriety products and revisions of detour and traffic control strategies (Anderson and Ullman 2000) This review of the project can lead to suggestions that may help reduce work zone congestion through alternative staging modifications to traffic control and modified project schedules The review may also help minimize life-cycle costs by recommending alternative materials and designs to extend the useful life of the roadway section
Ceran and Newman (1992) list the specific steps of the structured value engineering process First a project must be selected for analysis Many states require value engineering on projects over a certain cost and some agencies also perform this process on low-cost projects Second information needs to be collected about the project to determine the costs and objectives of the project This information is used to help determine other methods or materials that can perform a similar task and the information may inform an evaluation of the alternatives to determine whether there will be a cost savings and the alternatives are feasible After the evaluation of alternatives the selection of the most promising alternatives and determination of the total and life-cycle costs is performed Finally the advantages and disadvantages of each alternative are presented for approval followed by implementation and review
35 Alternative Contracting and Project Delivery Strategies
By shortening a projectrsquos duration the impacts on motorists are reduced This section identifies and describes alternative contracting methods and project delivery methods used to accelerate project completion Five contracting and project delivery methods are discussed
40
1 Design-build construction 2 Lane rental 3 A+B and A+B+C contracting 4 Incentives and disincentives to reduce construction duration and impacts 5 Interim liquidated damages and completion dates
Project delivery methods are often confused with contracting methods For example design-build is a project delivery method Design-build generally (though not always) allows contractordesigner teams to propose projects following preliminary engineering thereby allowing the builder and designer to work together through the final design and construction stages In contrast contract incentives are an example of a contracting methodology Contracting methods generally have the agency or the agencyrsquos design consultant finish the design and prepare a complete set of detailed plans and specifications The contractor then prepares a bid for the project based on the plans and specifications and any special contacting methods eg incentivesdisincentives
351 Design-Build Construction
Background
In design-build contracting one contract is let to a construction and design team and the team performs both the final design and building for the project A project is generally turned over to the design-build team when about 30 of the design is completed However design-build projects have been awarded to the design-build team at various times from just after conceptual design to after 90 completion of design The design-build team can then design the project to the best of its construction capabilities The most beneficial aspect of this technique is the time savings it has for the total project duration These time savings can be realized in various aspects of the project By allowing the design-build firm to utilize its resources to an optimal level activities can be designed and performed based on what the firm is capable of doing (Rohlf 1994) Additionally certain activities within the construction process can begin while others are still being designed Instead of having to wait for the completion of an activity that does not need to precede a subsequent activity the crew can work on another independent activity The use of lump sum payments in design-build contracting may also eliminate change orders and time extension requests that result from design errors or from project phasing differences between a separate design firm and traditional contracting techniques (Strong 2005) Design-build also allows for fast track construction and efficient phasing which can reduce construction time Having both the design and construction teams within the same agency allows for a streamlined path of communication between the office and the field
For example Caltrans utilizes a slightly modified design-build concept to suit its unique institutional constraints Caltrans has chosen to conduct most of its highway design in-house and to enjoy the benefits of design-build without involving a design consultant the agency created a method known as design sequencing Design sequencing selects a contractor for a project when the design is 30 completed and the agency design engineers continue to work with the selected contractor until the completion of construction Design sequencing results in shorter durations because and design and construction can be conducted simultaneously
41
Implementation Examples
SR51 Phoenix Arizona On a high-occupancy vehicle lane addition project on SR51 in Phoenix Arizona ADOT used a design-build contract with A+B bidding (A+B bidding will be discussed below) The corridor itself was confined in space that promoted innovation and creativity in design and construction Full road closures were also utilized during weekends The project was constructed in 330 days instead of the anticipated 480 days with minimal traffic disruption (FHWA 2007)
US Hwy 52 Rochester Minnesota US Highway 52 through Rochester Minnesota is an urban freeway with complete access control In the 1990s MnDOT completed the environmental documents for reconstructing Highway 52 and started the preliminary engineering and construction phasing concepts Intending to reconstruct the roadway through a series of individual contracts the initial plan was to reconstruct the roadway over 11 years The Rochester business community voiced its opinion that this schedule was problematic and MnDOT developed a second plan that reduced the construction period to six years Again the business community asked MnDOT if the agency could develop a less disruptive plan Having successfully experimented with design-build contracting with smaller projects (an interchange and several miles of a rural highway) MnDOT officials decided to employ design-build on Highway 52 which became known as the Roc 52 project After selecting a design-build team in 2002 the roadway was reconstructed and fully open for use in 2005 after three years of construction In 2006 the landscaping for the project was completed and all project activities were complete Instead of 11 years of disruption the project was delivered after only 3 years of disruption
352 Lane Rental
Background
Lane rental is a contracting technique in which the contractor is charged a fee to occupy lanes or shoulders during construction operations The objective of this technique is to encourage the contractor through a monetary incentive to minimize the time that travel lanes and shoulders are closed and thus impeding traffic flow To minimize the lane occupancy frequency and duration the contractor is encouraged to use innovative construction techniques and project phasing (Strong 2005) The technique can also reduce the number of detours for the traveling public
The fee is based on the estimated cost of delay or inconvenience imposed on the motorists derived from road user costs added to the costs incurred by the agency Fees can be assessed based on work schedule (eg weekdays or weekends) work duration (eg hourly periods during the day) and lane location (eg left lane of center lane) Fees can also vary by time period such as hourly or daily An obstruction that lasts more than 15 minutes is typically considered for fee assessment (Strong 2005) With the combination of different possibilities lane rental fees can vary depending on the time of day location and extent in order to encourage lane closures during off-peak hours by charging a less expensive fee during this time (Anderson and Ullman 2000)
42
If used lane rental should be taken into account during the bid and as the contract progresses In the A+B contracting technique (discussed below) lane rental can be applied through A+BLRC where A is the cost of the project B is the total number of days subject to lane closures that are required to complete the contract work and LRC is the lane rental cost (WSDOT 2007b) During the bidding process the contractor determines the number of lane closures needed which is included in the bid proposal
353 A+B and A+B+C Contracting
Background
A+B bidding is cost plus time bidding The bid package incorporates the dollar amount of the work to be performed (A) and the time amount (B) usually in calendar days that will be required to complete the project The time portion of the bid can be multiplied by the calculated daily road user cost (RUC) The RUC term is applied to an individual location or segment and signifies how much the road is worth to the drivers (Strong 2005) The winning bid has the lowest combined project cost and project time cost The primary benefit of this technique is the potential time savings Since part of the bid is based on the project duration which impacts traffic the contractor wants to minimize the time spent to reduce the total bid amount This type of bidding is intended to encourage contractors to more actively manage their work schedule and to adopt innovative and aggressive scheduling and construction management processes in order to shorten the project duration and reduce public user costs
Another form of cost plus time bidding is created by adding a third component (C) that accounts for future rehabilitation reconstruction and user delay costs forming A+B+C contracting (Cervarich 2002) This method estimates the frequency and earliest time the road will need maintenance or rehabilitation based on materials and methods used in the project Building a product that will need more frequent maintenance or quicker rehabilitation will increase the life-cycle costs and life-cycle user costs
Implementation Examples
I-10 Louisiana In 2001 the Louisiana Department of Transportation and Development (LA DOTD) initiated its first A+B+C contract The project was on I-10 from US 51 to the Reserve Relieve Canal a project approximately four miles long To help distinguish the material to be used it was determined to use a C term in the bid Of the five bids received four were hot-mix asphalt and one was PCC The winning bid used hot mix asphalt and the life-cycle cost of the asphalt over a 30-year life was approximately $46 million LA DOTD also included an incentivedisincentive clause in the contract The contractor completed the project four days ahead of the maximum time before the contracted completion date for which the incentive could be awarded (Cervarich 2002)
M-10 Lodge Freeway Detroit Michigan For the M-10 Lodge Freeway rehabilitation project in Detroit Michigan MDOT used a competitive A+B bidding process (FHWA 2004f) The project was estimated to take five to six months to complete but through the bid process the
43
contract was written for 65 days of full road closure Because the Howard Street Bridge on the freeway contained many utilities the contract contained an addendum for the deck replacement because of the potentially unpredictable delay from the extensive utility work The project was completed in 53 days and the contractor received an incentive award for finishing early
354 Incentives and Disincentives to Reduce Construction Duration and Impacts
Background
For a combination of different contractual bidding techniques incentives and disincentives may be added to the contract to help reduce project duration and traffic impacts An incentivedisincentive clause encourages timely completion for which the contractor can receive a monetary incentive for completing the project on time without sacrificing quality and safety The contractor may also have to pay money if the project is completed after the deadline The incentive for early completion helps defray accelerated construction costs imposed on the contractor
One form of the incentive clause is a no-excuse incentive This gives the contractor a final date for completing a phase or the entire project The contractor receives a bonus if the project is completed by this date and no award for completion after this date The no-excuse terms vary between agencies such as inclement weather change orders overruns of quantities utility delays or other delays that are invalid reasons for late completion
Implementation Examples
I-65 Bridge of I-20 I-59 and I-65 Interchange Birmingham Alabama During the 2002 reconstruction of southbound I-65 bridge a part of the I-20 I-59 and I-65 interchange in Birmingham Alabama the contract allowed for 90 days until completion and an incentivedisincentive provision of $25000 per day (FHWA 2007) The bridge had been closed after a gasoline tanker fire caused structural damage in which the girders sagged up to three meters The estimated road user cost was estimated at $90000 per day The contractor completed the new bridge in 37 days earning a $1225000 incentive The project cost plus incentive paid was still less than the cost proposed by the second bidder Overall the bridge was removed redesigned and constructed within 53 days
Route 4 and Route 17 Interchange New Jersey In 1998 a $120 million project to reconstruct the Route 4 and Route 17 interchange in New Jersey used incentives to expedite construction (Civil Engineering ASCE 1999) The entire project was estimated to take 30 months but was reduced to 13 a schedule that was encouraged by $7 million in time incentives The original incentive included a $35 million incentive for completing the project by November 25 2000 The project was considerably ahead of schedule after six months and the incentives were renegotiated such that if the interchange was completed (except for the final flyover) by the 1999 Christmas holiday season another $35 million bonus would be awarded This was accepted and awarded to the contractor According to NJDOT the contractor was working 80 to 100 people
44
12 hours per day six or seven days a week and thus some of the incentive award was used for overtime hours
I-25 and I-40 Interchange Albuquerque New Mexico For the Big I interchange project between I-25 and I-40 in Albuquerque New Mexico NMDOT had little money available for cash incentives The agency instead offered innovative incentives such as access to the excess right-of-way For the project NMDOT purchased 21 acres 4 acres of required right-of-way for the project The excess right-of-way was used as a staging area during construction Because the contractor finished ahead of schedule the contractor received the deed for the excess 17 acres along the project and several other tracts of land that were determined as excess to future highway needs from NMDOT (FHWA 2007)
I-95 Wilmington Delaware For the I-95 rehabilitation project in Wilmington Delaware 244 lane miles of roadway were reconstructed DelDOT estimated that the user delay cost was approximately $88000 per day for maintaining the traffic plan the agency was using The project was divided into four phases lasting about 30 to 50 days each Each phase contained a $25000 per day bonus or penalty for up to 10 days of early or late completion Thus for the entire project the contractor had the possibility of earning a $1 million bonus or penalty depending on completion dates (OrsquoNeill 2001)
State Route 68 Arizona For the reconstruction of Arizona State Route 68 in northern Arizona ADOT used a traffic management contract incentive to help limit delays through the work zone (FHWA 2004g) In order to measure the travel times of vehicles through the work zone an ITS travel time system was utilized The system included two monitoring stations and a central processor The monitoring stations utilized an inductive loop in the roadway to activate a digital camera that took a picture of a vehiclersquos license plate when it entered the work zone and another picture when the vehicle left the work zone From these pictures the travel times were computed for vehicles traveling through the work zone The system read approximately 60 of all vehicles moving through the work zone and matched approximately 11 of the plates which was deemed adequate by ADOT The data were compiled into 30-minute averages and sent each month to ADOT The average travel time prior to construction was 17 minutes The contract specified that the average travel time could not exceed 27 minutes which accounted for the reduced speed limit through the work zone To reduce the amount of delay the contractor limited the number of flagging stations in the work zone and the duration of directional closings to two to three minutes The contractor also worked with ADOT and ADOTrsquos pubic relations firm to schedule work periods during non-peak traffic hours The contractor was charged $2150 for each minute of delay incurred per travel lane for each 30 minute interval The potential travel time bonus was set at $400000 and the contractor was charged $14857 The contractor thus received 96 of the bonus
45
355 Interim Completion Dates and Liquidated Damages
Background
Certain functional elements that must be taken out of service for a project such as a ramp bridge or intersection can be specified for completion within a shorter period of time than the time required for the overall contract and these elements can be put into service sooner than other elements Using interim completion dates thus addresses the concerns that local agencies businesses and motorists have regarding the duration of certain segments of the project This method also provides the contractor with incentives or disincentives for expediting a specific portion of the contract within a realistic timeframe However some of the drawbacks of this method include possible increased costs and increased overall contract duration
To restore traffic on critical segments projects for which the damages incurred from closing functional elements clearly outweigh the costs of longer project duration should be considered for interim completion dates Segments that have been identified as places where this technique has successfully been applied include the following segments critical to commuters segments to be completed by the beginning of a school year and segments to be completed before peak shopping periods (WSDOT 2007c)
46
4 CONCLUSIONS
The list of strategies provided in this synthesis is by no means a comprehensive list of all strategies being used by STAs However this synthesis is relatively exhaustive in that it identifies many of the frequently used strategies and many that are relatively new to several agencies Each strategy description has included the components of the strategy applications for implementation and documented case studies that provide examples of successful application When developing transportation management plans a well-rounded and comprehensive group of strategies can be made to work together to mitigate work zone congestion to levels that are acceptable to motorists This synthesis thus provides a tool for STAs to use in the work zone planning stages of a project
47
REFERENCES
AASHTO 1998 Primer on Contracting 2000 Washington DC Highway Subcommittee on Construction American Association of State Highway and Traffic Officials
Algers S E Bernauer M Boero L Breheret C Di Taranto M Dougherty K Fox and J-F Gabard 1997 Review of Micro-simulation Models SMARTEST Project Deliverable No 3 Brussels Belgium European Commission DGVII
Anderson S T Kane and M Jha 2003 Use of Advanced Microscopic Traffic Simulation for Transportation Planning in Des Moines Area Paper presented at the 2003 Mid-Continent Transportation Research Symposium Ames IA httpwwwctreiastateedupubsmidcon2003andersonsimulationpdf
Anderson MD and RR Souleyrette 1998 Simulating Traffic for Incident Management and ITS Investment Decisions Proceedings of Crossroads 2000 7ndash11
Anderson SD and GL Ullman 2000 Reducing and Mitigating Impacts of Lane Occupancy during Construction and Maintenance A Synthesis of Highway Practice NCHRP Synthesis 293 Washington DC Transportation Research Board National Research Council
Arch JP 2002 Incident Management Advances for the Woodrow Wilson Bridge Project Paper presented at Todayrsquos Transportation Challenge Meeting Our Customerrsquos Expectations Palm Harbor FL
Balke KN and GL Ullman 1992 Method for Selecting Among Alternative Incident Detection Strategies FHWATX-921232-12 College Station TX Texas Transportation Institute
Battles SL 2004 Reducing Work Zone-Related Congestion Constructor 86(8) 18ndash20 Bergeron K 2004 The Future is Now Public Roads 67 (6) Bryden JE 2004 Working Safely at Night Paper presented at the 2004 Work Zone Meeting of
the American Road and Transportation Builders Association Baltimore MD Bryden JE and DJ Mace 2002 A Procedure for Assessing and Planning Nighttime Highway
Construction and Maintenance NCHRP Report 475 Washington DC Transportation Research Board and National Research Council
Bushman R and C Berhelot 2005 Response of North Carolina Drivers to a Smart Work Zone System Paper presented at the Annual Meeting of the Transportation Research Board Washington DC CD-ROM
Cairns S C Hass-Klau and P Goodwin 1998 Traffic Impact of Highway Capacity Reductions Assessment of the Evidence London England Transport for London and the Department of the Environment Transportation and the Regions
Ceran T and RB Newman 1992 Maintenance Considerations in Highway Design NCHRP Report 349 Washington DC Transportation Research Board National Research Council
Cervarich MB 2002 Timing Delays Like Relays State DOTs Study New Ways to Speed Construction in Consideration of Cost to Commuters Roads and Bridges 40(1)
Chitturi MV and R Benekohal 2005 Comparison of Queue Length Estimates from QUEWZ FRESIM and QuickZone with Field Data Paper presented at the Institute of Transportation Engineers 2005 Technical Conference and Exhibit Las Vegas NV
Civil Engineering ASCE 1999 Incentives Accelerate Interchange Work in New Jersey Civil Engineering 69(11) 14ndash15
Cole LW and GF Voigt 1996 Roadway Rehabilitation with Fast-Track Concrete Paving Civil Engineering News 8(3) 29ndash40
48
Cyra SJ 2002 Traffic Incident Management Rebuilding the Marquette Interchange Paper presented at Todayrsquos Transportation Challenge Meeting Our Customerrsquos Expectations Palm Harbor FL
Dalzeill E and A Nicholson 2001 Risk and Impact of Natural Hazards on a Road Network Journal of Transportation Engineering 127(2) 159ndash165
Dixon KK and JE Hummer 1995 Capacity and Delay in Major Freeway Construction Report 23241-94-8 Raleigh NC Center for Transportation Engineering Studies North Carolina State University
Dixon KK JE Hummer and NM Rouphail 1998 Comparison of Rural Freeway Work Zones Queue Length Estimation Techniques A Case Study Paper presented at the Annual Meeting of the Transportation Research Board Washington DC
FDOT 1997 Alternate Contracting Userrsquos Guide Tallahassee FL Florida Department of Transportation
Ferragut T 2003 Accelerated Highway Construction Workshop Series Summary Report No E-C059 Transportation Research E-Circular Washington DC Transportation Research Board
FHWA 2000 Work Zone Operations Best Practices Guidebook FHWA-OP-00-010 Washington DC Federal Highway Administration American Association of State Highway and Transportation Officials 2000 httpwwwopsfhwadotgovwzpracticesbestDefaulthtm
FHWA 2001a Informed Motorists Fewer Crashes Using Intelligent Transportation Systems in Work Zones Washington DC US Department of Transportation ITS Joint Program Office and FHWA Work Zone Team
FHWA 2001b Fact Sheet 5 Innovation During Bridge Rehabilitation Improves Mobility WinterSpring 2001 Washington DC Federal Highway Administration Illinois Department of Transportation httpopsfhwadotgovwzpracticesfactsheetsfactsheet5htm
FHWA 2003a Freeway Management Operations Handbook Washington DC Federal Highway Administration
FHWA 2003b Fact Sheet 8 Ohio Keeps Motorists and Road Rehabilitation Moving Forward Summer 2003 Columbus OH Federal Highway Administration Ohio Department of Transportation httpopsfhwadotgovwzpracticesfactsheets factsheet8htmfigure1
FHWA 2003c Shorter Duration Safer Work Zones More Satisfied Travelers Successful Applications of Full Road Closure in Work Zones FHWA-OP-03-086 Washington DC Federal Highway Administration
FHWA 2003d Full Road Closure for Work Zone Operations A Cross Cutting Study Reducing Congestion and Crashes through Full Road Closure for Maintenance and Construction Washington DC Federal Highway Administration
FHWA 2004a Work Zone Safety and Mobility Federal Register Vol 69 No 174 23 CFR Part 630
FHWA 2004b Intelligent Transportation Systems in Work Zones A Case Study Keeping Traffic Moving During Reconstruction of the Big I A Major Interstate-Interstate Interchange in Albuquerque FHWA-OP-04-072 Washington DC Federal Highway Administration
FHWA 2004c Intelligent Transportation Systems in Work Zones A Case Study Using an Automated Traffic Information System to Reduce Congestion and Improve Safety During Reconstruction of the I-55 Lake Springfield Bridge in Illinois FHWA-HOP-04-018 Washington DC Federal Highway Administration
49
FHWA 2004d Full Road Closure for Work Zone Operations A Case Study Reducing the Impact of Construction During the Rehabilitation of a Major Interstate Highway- Interstate 95 in Wilmington Delaware FHWA-HOP-05-012 Washington DC Federal Highway Administration
FHWA 2004e Full Road Closure for Work Zone Operations A Case Study Using Weekend Closures to Expedite Road Rehabilitation and Minimize the Impacts on Motorists and Road Builders I-84 Banfield Freeway in Portland Oregon FHWA-HOP-05-014 Washington DC Federal Highway Administration
FHWA 2004f Full Road Closure for Work Zone Operations A Case Study Accelerating Construction and Reducing Crashes During the Rehabilitation of a Major Downtown Route M-10 Lodge Freeway in Detroit Michigan FHWA-HOP-05-013 Washington DC Federal Highway Administration
FHWA 2004g Intelligent Transportation Systems in Work Zones A Case Study Reducing Congestion with the Use of a Traffic Management Contract Incentive during the Reconstruction of Arizona State Route 68 FHWA-HOP-04-032 Washington DC Federal Highway Administration
FHWA 2004h Mitigating Traffic Congestion The Role of Demand-Side Strategies Washington DC Association for Commuter Transportation UrbanTrans Consultants Inc and Parson Brinkerhoff and ESTC httpopsfhwadotgovpublicationsmitig_traf_cong
FHWA 2004i I-25 and I-225 Reconstruction Denver CO Washington DC UrbanTrans Consultants Inc Parson Brinkerhoff and ESTC httpopsfhwadotgovpublicationsmitig_traf_congdenver_casehtm
FHWA 2004j FHWA Research and Technology Prefabricated Bridge Elements and Systems Washington DC Federal Highway Administration wwwfhwadotgovrnt4utiprefab_bridge
FHWA 2007 Success Stories Highways for Life Federal Highway Administration 2006 httpwwwfhwadotgovhflsuccesscfm
Fox K 2007 Micro-Simulation Halcrow Group httpwwwmicrosimulationdrfoxorguk GDOT 2006 Navigator The Georgia Department of Transporationrsquos Intelligent
Transportation System Georgia Department of Transportation httpwwwgeorgia-navigatorcom
Hofener MS 2003 A Check List for Work Zone Incident Management Plans Compendium Papers on Advanced Surface Transportation Systems College Station TX Texas Transportation Institute
Horowitz A and T Notbohm 2003 Evaluation of Intellizone A System for Providing Speed Advisories to Drivers Entering Work Zones Milwaukee WI University of Wisconsin at Milwaukee Wisconsin Department of Transportation and Midwest Smart Work Zone Deployment Initiative
Iowa DOT 2007 511 Travel Information Des Moines Metro 2006 Ames IA Iowa Department of Transportation httpwww511iaorgDM_Metroaspdisplay=allamparea =IA_DesMoinesampdate=amptextOnly=False
Kamyab A T MacDonald B Storm and M Anderson-Wilk 2003 Effectiveness of Extra Law Enforcement in Construction and Maintenance Zones Ames IA Center for Transportation Research and Education Iowa State University
Maryland SHA 2005 Work Zone Safety Toolbox Baltimore MD Maryland State Highway Administration Office of Traffic and Safety
50
Maze TH GD Burchett and J Hochstein 2005 Synthesis of Procedures to Forecast and Monitor Work Zone Safety and Mobility Ames IA Center for Transportation Research and Education Iowa State University
Maze TH SD Schrock and KS VanDerHorst 1999 Traffic Management Strategies for Merge Areas in Rural Interstate Work Zones Ames IA Center for Transportation Research and Education Iowa State University
McTrans 2007 CORSIM McTrans University of Florida httpmctransceufleduindexhtm Memmott JL and CL Dudek 1982 A Model to Calculate the Road User Cost at Work Zones
FHWATX-8320+292-1 College Station TX Texas Transportation Institute MDOT 2006 Fix Detroit Six Lansing MI Michigan Department of Transportation
httpwwwmichigangovmdot016077-151-9621_11008_28818---00html Miller T (nd) Missouri Department of Transportation (MoDOT) Blanchette Bridge
Reconstruction Project Jefferson City MO Missouri Department of Transportation httpwwwplaningdotgovDocumentsPublicInvolvementblanchettehtm
Noyes PB 2002 Mainstreaming Incident Management in Design-Build The T-Rex Experience Paper presented at the ITE 2002 Annual Meeting and Exhibit Philadelphia PA
ODOT 2000 Traffic Management in Work Zones Interstate and Other Freeways Policy No 516-003(P) Columbus OH Office of Traffic Engineering Ohio Department of Transportation
ODOT 2006 Permitted Lane Closures Columbus OH Office of Traffic Engineering Ohio Department of Transportation httpplcmdotstateohusplcm plcm_webjsp
OrsquoNeill D 2001 I-95 Reconstruction and the Five Elements of Mobility Wilmington DE Delaware Department of Transportation
Rakha H M Van Aerde L Bloomberg and X Huang 1999 Construction and Calibration of a Large-scale Micro-Simulation Model of the Salt Lake Area Paper presented at the Annual Meeting of the Transportation Research Board Washington DC
Robinson J 1989 Whatrsquos New in Freeway Incident Detection Response Paper presented at the ITE International Conference Dallas TX
Rohlf JG 1994 Innovative Contracting Practices TR News 175 Saag JB 1999 Project Development Methodologies for Reconstruction of Urban Freeways and
Expressways Synthesis of Highway Practice 273 Washington DC National Cooperative Highway Research Program
Schnell T and F Aktan 2001 On the Accuracy of Commercially Available Macroscopic and Microscopic Traffic Simulation Tools for Predication of Workzone Traffic FHWAHWA-200108 Columbus OH Ohio Department of Transportation
Schnell T JS Mohror and F Aktan 2002 Evaluation of Traffic Flow Analysis Tools Applied to Work Zones based on Flow Data Collected in the Field Paper presented at the Annual Meeting of the Transportation Research Board Washington DC
Scriba T 2004 Striving for Better Work-Zone Management and Communications through ITS Transportation Management and Engineering 9 (1)
Shepard FD and BH Cottrell Jr 1986 Benefits and Safety Impact of Night Work-Zone Activities Transportation Research Record 1086
Sorenson J 2001 Acceleration Creates Rapid Rewards Faster Construction Practices Improve Work-Zone Safety and Are Preferred By Motorists Roads and Bridges Vol 39 Issue 9 18
Stahl KR and MA Gutierrez 2004 Get In Get Out Stay Out Caltrans Proves Effectiveness of Pavement Renewal Approach TR News 232 3ndash13
51
Steinke DP L Sanderson JF Byrnes Jr J Conrad R Forrestel K Harrington-Hughes KF Kobetsky S Lanford K Snyder-Petty D Testa and JD Wilkerson 2000 Methods and Procedures to Reduce Motorist Delays in European Work Zones Washington DC American Trade Initiatives and Federal Highway Administration
Strong K 2005 Performance Effectiveness of Design-Build Lane Rental and A+B Contracting Techniques Ames IA Center for Transportation Research and Education Iowa State University
Sullivan EC 1989 Accident Rates During Nighttime Construction UCB-ITS-RR-89-11 Berkeley CA Institute of Transportation Studies University of California Berkeley
TMA 2006 avoidtherushorg Transportation Management Association Des Moines Metro Area httpwwwavoidtherushorg
Trafficware Ltd 2007 Products Sim Traffic 7 httpwwwtrafficwarecomproductshtml TransOptions 2006 Denver Metro Area wwwgotransoptionscom WSDOT 2007a Flexible Start Date Washington State Department of Transportation
httpwwwwsdotwagovProjectsdeliveryalternativeFlexibleStarthtm WSDOT 2007b Lane Rental Washington State Department of Transportation
httpwwwwsdotwagovProjectsdeliveryalternativeLaneRentalhtm WSDOT 2007c Interim Completion Dates Washington State Department of Transportation
httpwwwwsdotwagovProjectsdeliveryalternativeInterimCompletion
52
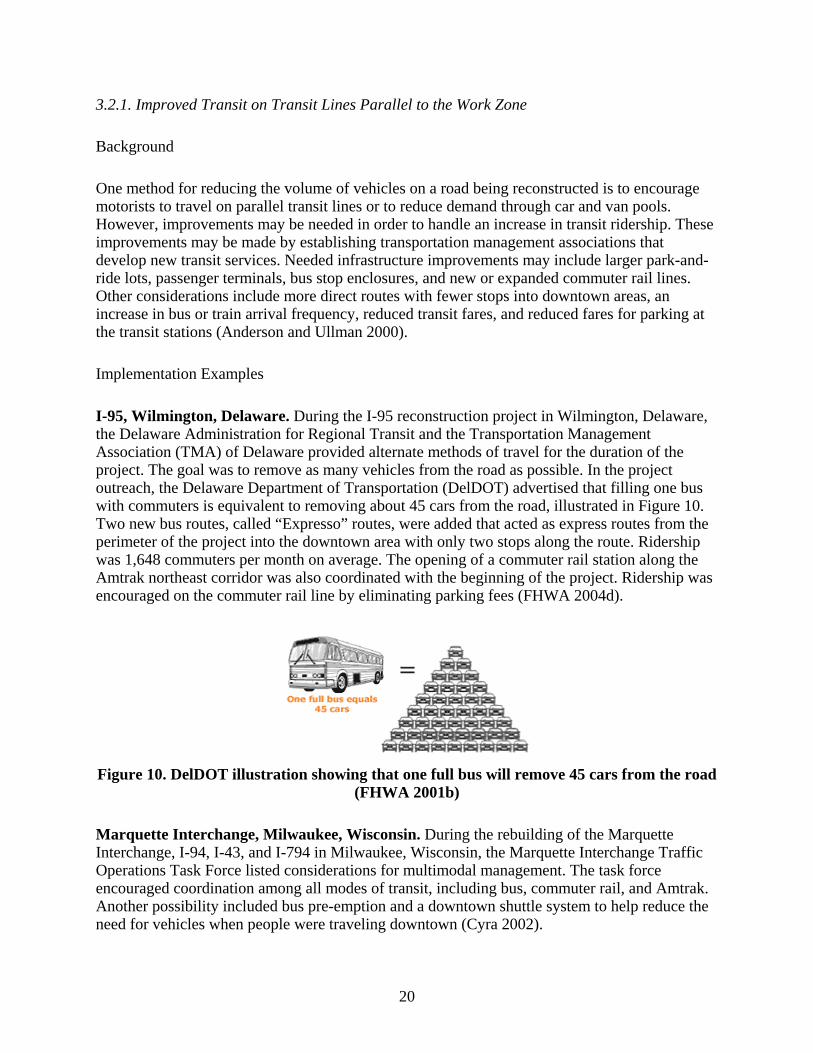
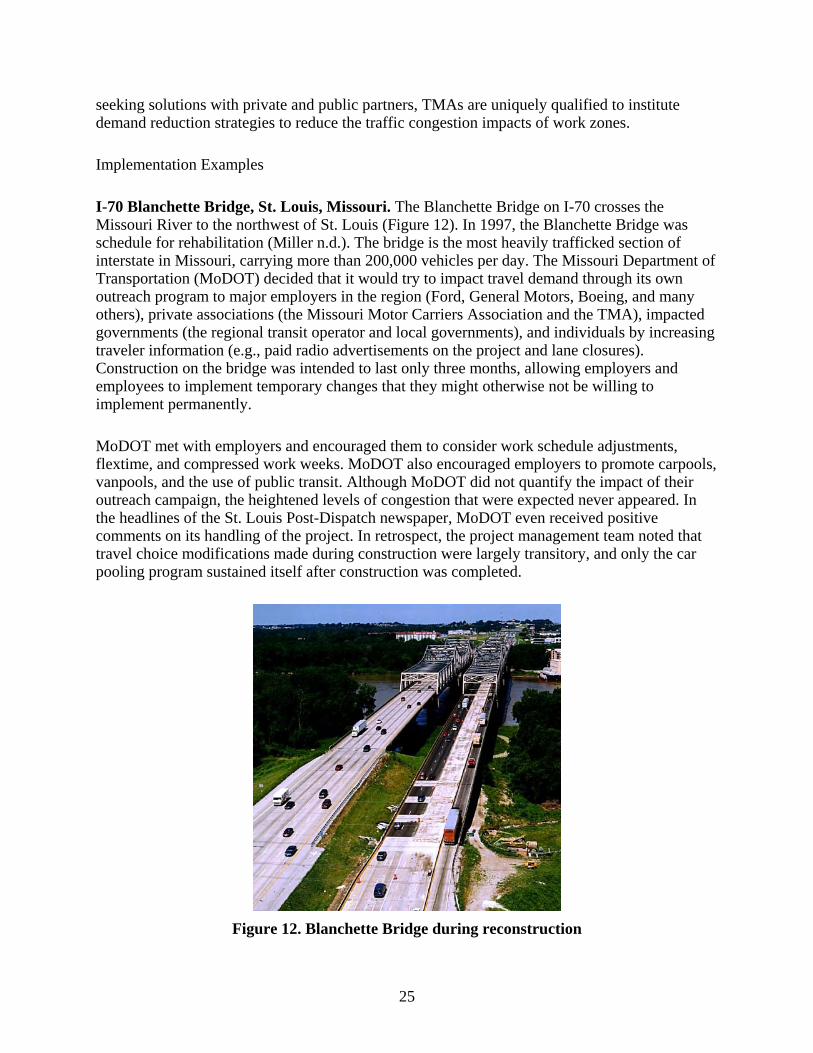
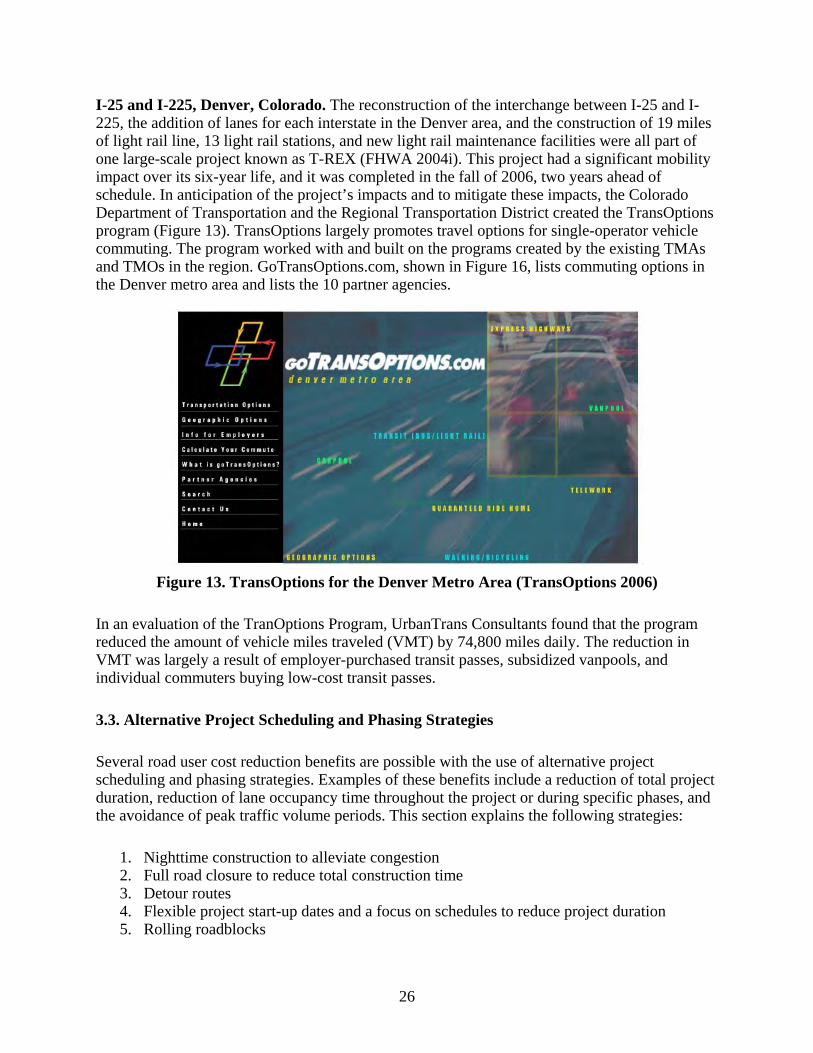
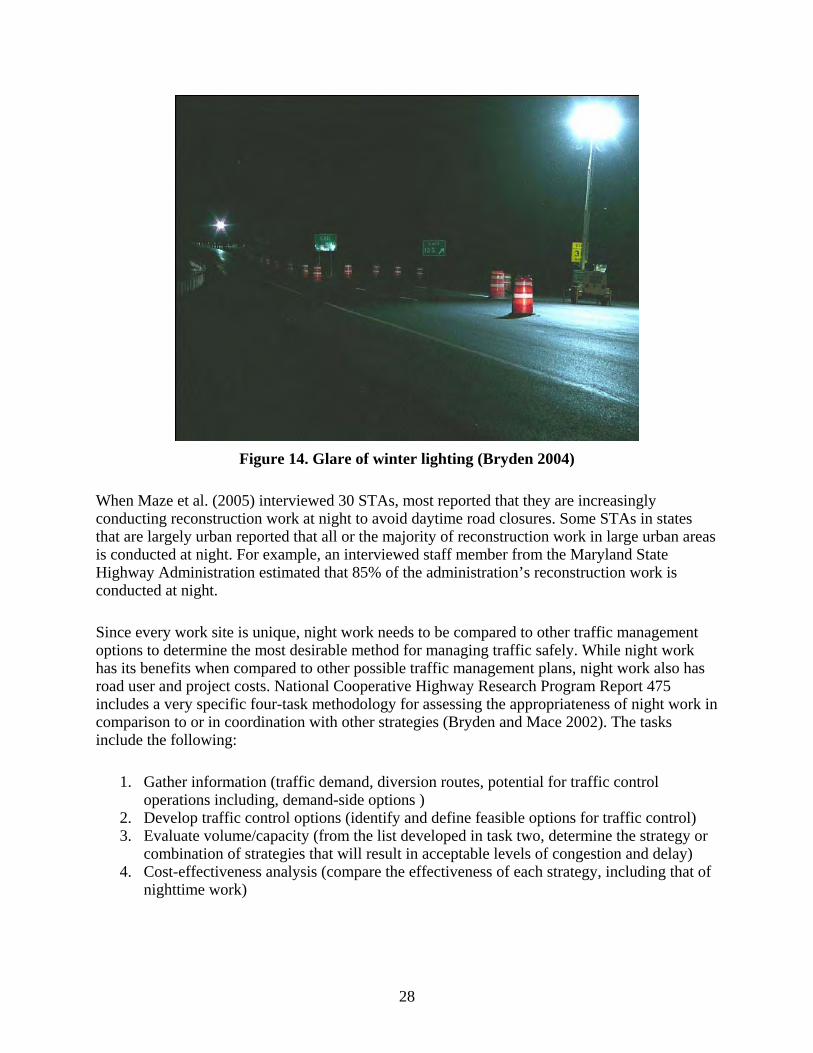

Implementation Examples
SR51 Phoenix Arizona On a high-occupancy vehicle lane addition project on SR51 in Phoenix Arizona ADOT used a design-build contract with A+B bidding (A+B bidding will be discussed below) The corridor itself was confined in space that promoted innovation and creativity in design and construction Full road closures were also utilized during weekends The project was constructed in 330 days instead of the anticipated 480 days with minimal traffic disruption (FHWA 2007)
US Hwy 52 Rochester Minnesota US Highway 52 through Rochester Minnesota is an urban freeway with complete access control In the 1990s MnDOT completed the environmental documents for reconstructing Highway 52 and started the preliminary engineering and construction phasing concepts Intending to reconstruct the roadway through a series of individual contracts the initial plan was to reconstruct the roadway over 11 years The Rochester business community voiced its opinion that this schedule was problematic and MnDOT developed a second plan that reduced the construction period to six years Again the business community asked MnDOT if the agency could develop a less disruptive plan Having successfully experimented with design-build contracting with smaller projects (an interchange and several miles of a rural highway) MnDOT officials decided to employ design-build on Highway 52 which became known as the Roc 52 project After selecting a design-build team in 2002 the roadway was reconstructed and fully open for use in 2005 after three years of construction In 2006 the landscaping for the project was completed and all project activities were complete Instead of 11 years of disruption the project was delivered after only 3 years of disruption
352 Lane Rental
Background
Lane rental is a contracting technique in which the contractor is charged a fee to occupy lanes or shoulders during construction operations The objective of this technique is to encourage the contractor through a monetary incentive to minimize the time that travel lanes and shoulders are closed and thus impeding traffic flow To minimize the lane occupancy frequency and duration the contractor is encouraged to use innovative construction techniques and project phasing (Strong 2005) The technique can also reduce the number of detours for the traveling public
The fee is based on the estimated cost of delay or inconvenience imposed on the motorists derived from road user costs added to the costs incurred by the agency Fees can be assessed based on work schedule (eg weekdays or weekends) work duration (eg hourly periods during the day) and lane location (eg left lane of center lane) Fees can also vary by time period such as hourly or daily An obstruction that lasts more than 15 minutes is typically considered for fee assessment (Strong 2005) With the combination of different possibilities lane rental fees can vary depending on the time of day location and extent in order to encourage lane closures during off-peak hours by charging a less expensive fee during this time (Anderson and Ullman 2000)
42
If used lane rental should be taken into account during the bid and as the contract progresses In the A+B contracting technique (discussed below) lane rental can be applied through A+BLRC where A is the cost of the project B is the total number of days subject to lane closures that are required to complete the contract work and LRC is the lane rental cost (WSDOT 2007b) During the bidding process the contractor determines the number of lane closures needed which is included in the bid proposal
353 A+B and A+B+C Contracting
Background
A+B bidding is cost plus time bidding The bid package incorporates the dollar amount of the work to be performed (A) and the time amount (B) usually in calendar days that will be required to complete the project The time portion of the bid can be multiplied by the calculated daily road user cost (RUC) The RUC term is applied to an individual location or segment and signifies how much the road is worth to the drivers (Strong 2005) The winning bid has the lowest combined project cost and project time cost The primary benefit of this technique is the potential time savings Since part of the bid is based on the project duration which impacts traffic the contractor wants to minimize the time spent to reduce the total bid amount This type of bidding is intended to encourage contractors to more actively manage their work schedule and to adopt innovative and aggressive scheduling and construction management processes in order to shorten the project duration and reduce public user costs
Another form of cost plus time bidding is created by adding a third component (C) that accounts for future rehabilitation reconstruction and user delay costs forming A+B+C contracting (Cervarich 2002) This method estimates the frequency and earliest time the road will need maintenance or rehabilitation based on materials and methods used in the project Building a product that will need more frequent maintenance or quicker rehabilitation will increase the life-cycle costs and life-cycle user costs
Implementation Examples
I-10 Louisiana In 2001 the Louisiana Department of Transportation and Development (LA DOTD) initiated its first A+B+C contract The project was on I-10 from US 51 to the Reserve Relieve Canal a project approximately four miles long To help distinguish the material to be used it was determined to use a C term in the bid Of the five bids received four were hot-mix asphalt and one was PCC The winning bid used hot mix asphalt and the life-cycle cost of the asphalt over a 30-year life was approximately $46 million LA DOTD also included an incentivedisincentive clause in the contract The contractor completed the project four days ahead of the maximum time before the contracted completion date for which the incentive could be awarded (Cervarich 2002)
M-10 Lodge Freeway Detroit Michigan For the M-10 Lodge Freeway rehabilitation project in Detroit Michigan MDOT used a competitive A+B bidding process (FHWA 2004f) The project was estimated to take five to six months to complete but through the bid process the
43
contract was written for 65 days of full road closure Because the Howard Street Bridge on the freeway contained many utilities the contract contained an addendum for the deck replacement because of the potentially unpredictable delay from the extensive utility work The project was completed in 53 days and the contractor received an incentive award for finishing early
354 Incentives and Disincentives to Reduce Construction Duration and Impacts
Background
For a combination of different contractual bidding techniques incentives and disincentives may be added to the contract to help reduce project duration and traffic impacts An incentivedisincentive clause encourages timely completion for which the contractor can receive a monetary incentive for completing the project on time without sacrificing quality and safety The contractor may also have to pay money if the project is completed after the deadline The incentive for early completion helps defray accelerated construction costs imposed on the contractor
One form of the incentive clause is a no-excuse incentive This gives the contractor a final date for completing a phase or the entire project The contractor receives a bonus if the project is completed by this date and no award for completion after this date The no-excuse terms vary between agencies such as inclement weather change orders overruns of quantities utility delays or other delays that are invalid reasons for late completion
Implementation Examples
I-65 Bridge of I-20 I-59 and I-65 Interchange Birmingham Alabama During the 2002 reconstruction of southbound I-65 bridge a part of the I-20 I-59 and I-65 interchange in Birmingham Alabama the contract allowed for 90 days until completion and an incentivedisincentive provision of $25000 per day (FHWA 2007) The bridge had been closed after a gasoline tanker fire caused structural damage in which the girders sagged up to three meters The estimated road user cost was estimated at $90000 per day The contractor completed the new bridge in 37 days earning a $1225000 incentive The project cost plus incentive paid was still less than the cost proposed by the second bidder Overall the bridge was removed redesigned and constructed within 53 days
Route 4 and Route 17 Interchange New Jersey In 1998 a $120 million project to reconstruct the Route 4 and Route 17 interchange in New Jersey used incentives to expedite construction (Civil Engineering ASCE 1999) The entire project was estimated to take 30 months but was reduced to 13 a schedule that was encouraged by $7 million in time incentives The original incentive included a $35 million incentive for completing the project by November 25 2000 The project was considerably ahead of schedule after six months and the incentives were renegotiated such that if the interchange was completed (except for the final flyover) by the 1999 Christmas holiday season another $35 million bonus would be awarded This was accepted and awarded to the contractor According to NJDOT the contractor was working 80 to 100 people
44
12 hours per day six or seven days a week and thus some of the incentive award was used for overtime hours
I-25 and I-40 Interchange Albuquerque New Mexico For the Big I interchange project between I-25 and I-40 in Albuquerque New Mexico NMDOT had little money available for cash incentives The agency instead offered innovative incentives such as access to the excess right-of-way For the project NMDOT purchased 21 acres 4 acres of required right-of-way for the project The excess right-of-way was used as a staging area during construction Because the contractor finished ahead of schedule the contractor received the deed for the excess 17 acres along the project and several other tracts of land that were determined as excess to future highway needs from NMDOT (FHWA 2007)
I-95 Wilmington Delaware For the I-95 rehabilitation project in Wilmington Delaware 244 lane miles of roadway were reconstructed DelDOT estimated that the user delay cost was approximately $88000 per day for maintaining the traffic plan the agency was using The project was divided into four phases lasting about 30 to 50 days each Each phase contained a $25000 per day bonus or penalty for up to 10 days of early or late completion Thus for the entire project the contractor had the possibility of earning a $1 million bonus or penalty depending on completion dates (OrsquoNeill 2001)
State Route 68 Arizona For the reconstruction of Arizona State Route 68 in northern Arizona ADOT used a traffic management contract incentive to help limit delays through the work zone (FHWA 2004g) In order to measure the travel times of vehicles through the work zone an ITS travel time system was utilized The system included two monitoring stations and a central processor The monitoring stations utilized an inductive loop in the roadway to activate a digital camera that took a picture of a vehiclersquos license plate when it entered the work zone and another picture when the vehicle left the work zone From these pictures the travel times were computed for vehicles traveling through the work zone The system read approximately 60 of all vehicles moving through the work zone and matched approximately 11 of the plates which was deemed adequate by ADOT The data were compiled into 30-minute averages and sent each month to ADOT The average travel time prior to construction was 17 minutes The contract specified that the average travel time could not exceed 27 minutes which accounted for the reduced speed limit through the work zone To reduce the amount of delay the contractor limited the number of flagging stations in the work zone and the duration of directional closings to two to three minutes The contractor also worked with ADOT and ADOTrsquos pubic relations firm to schedule work periods during non-peak traffic hours The contractor was charged $2150 for each minute of delay incurred per travel lane for each 30 minute interval The potential travel time bonus was set at $400000 and the contractor was charged $14857 The contractor thus received 96 of the bonus
45
355 Interim Completion Dates and Liquidated Damages
Background
Certain functional elements that must be taken out of service for a project such as a ramp bridge or intersection can be specified for completion within a shorter period of time than the time required for the overall contract and these elements can be put into service sooner than other elements Using interim completion dates thus addresses the concerns that local agencies businesses and motorists have regarding the duration of certain segments of the project This method also provides the contractor with incentives or disincentives for expediting a specific portion of the contract within a realistic timeframe However some of the drawbacks of this method include possible increased costs and increased overall contract duration
To restore traffic on critical segments projects for which the damages incurred from closing functional elements clearly outweigh the costs of longer project duration should be considered for interim completion dates Segments that have been identified as places where this technique has successfully been applied include the following segments critical to commuters segments to be completed by the beginning of a school year and segments to be completed before peak shopping periods (WSDOT 2007c)
46
4 CONCLUSIONS
The list of strategies provided in this synthesis is by no means a comprehensive list of all strategies being used by STAs However this synthesis is relatively exhaustive in that it identifies many of the frequently used strategies and many that are relatively new to several agencies Each strategy description has included the components of the strategy applications for implementation and documented case studies that provide examples of successful application When developing transportation management plans a well-rounded and comprehensive group of strategies can be made to work together to mitigate work zone congestion to levels that are acceptable to motorists This synthesis thus provides a tool for STAs to use in the work zone planning stages of a project
47
REFERENCES
AASHTO 1998 Primer on Contracting 2000 Washington DC Highway Subcommittee on Construction American Association of State Highway and Traffic Officials
Algers S E Bernauer M Boero L Breheret C Di Taranto M Dougherty K Fox and J-F Gabard 1997 Review of Micro-simulation Models SMARTEST Project Deliverable No 3 Brussels Belgium European Commission DGVII
Anderson S T Kane and M Jha 2003 Use of Advanced Microscopic Traffic Simulation for Transportation Planning in Des Moines Area Paper presented at the 2003 Mid-Continent Transportation Research Symposium Ames IA httpwwwctreiastateedupubsmidcon2003andersonsimulationpdf
Anderson MD and RR Souleyrette 1998 Simulating Traffic for Incident Management and ITS Investment Decisions Proceedings of Crossroads 2000 7ndash11
Anderson SD and GL Ullman 2000 Reducing and Mitigating Impacts of Lane Occupancy during Construction and Maintenance A Synthesis of Highway Practice NCHRP Synthesis 293 Washington DC Transportation Research Board National Research Council
Arch JP 2002 Incident Management Advances for the Woodrow Wilson Bridge Project Paper presented at Todayrsquos Transportation Challenge Meeting Our Customerrsquos Expectations Palm Harbor FL
Balke KN and GL Ullman 1992 Method for Selecting Among Alternative Incident Detection Strategies FHWATX-921232-12 College Station TX Texas Transportation Institute
Battles SL 2004 Reducing Work Zone-Related Congestion Constructor 86(8) 18ndash20 Bergeron K 2004 The Future is Now Public Roads 67 (6) Bryden JE 2004 Working Safely at Night Paper presented at the 2004 Work Zone Meeting of
the American Road and Transportation Builders Association Baltimore MD Bryden JE and DJ Mace 2002 A Procedure for Assessing and Planning Nighttime Highway
Construction and Maintenance NCHRP Report 475 Washington DC Transportation Research Board and National Research Council
Bushman R and C Berhelot 2005 Response of North Carolina Drivers to a Smart Work Zone System Paper presented at the Annual Meeting of the Transportation Research Board Washington DC CD-ROM
Cairns S C Hass-Klau and P Goodwin 1998 Traffic Impact of Highway Capacity Reductions Assessment of the Evidence London England Transport for London and the Department of the Environment Transportation and the Regions
Ceran T and RB Newman 1992 Maintenance Considerations in Highway Design NCHRP Report 349 Washington DC Transportation Research Board National Research Council
Cervarich MB 2002 Timing Delays Like Relays State DOTs Study New Ways to Speed Construction in Consideration of Cost to Commuters Roads and Bridges 40(1)
Chitturi MV and R Benekohal 2005 Comparison of Queue Length Estimates from QUEWZ FRESIM and QuickZone with Field Data Paper presented at the Institute of Transportation Engineers 2005 Technical Conference and Exhibit Las Vegas NV
Civil Engineering ASCE 1999 Incentives Accelerate Interchange Work in New Jersey Civil Engineering 69(11) 14ndash15
Cole LW and GF Voigt 1996 Roadway Rehabilitation with Fast-Track Concrete Paving Civil Engineering News 8(3) 29ndash40
48
Cyra SJ 2002 Traffic Incident Management Rebuilding the Marquette Interchange Paper presented at Todayrsquos Transportation Challenge Meeting Our Customerrsquos Expectations Palm Harbor FL
Dalzeill E and A Nicholson 2001 Risk and Impact of Natural Hazards on a Road Network Journal of Transportation Engineering 127(2) 159ndash165
Dixon KK and JE Hummer 1995 Capacity and Delay in Major Freeway Construction Report 23241-94-8 Raleigh NC Center for Transportation Engineering Studies North Carolina State University
Dixon KK JE Hummer and NM Rouphail 1998 Comparison of Rural Freeway Work Zones Queue Length Estimation Techniques A Case Study Paper presented at the Annual Meeting of the Transportation Research Board Washington DC
FDOT 1997 Alternate Contracting Userrsquos Guide Tallahassee FL Florida Department of Transportation
Ferragut T 2003 Accelerated Highway Construction Workshop Series Summary Report No E-C059 Transportation Research E-Circular Washington DC Transportation Research Board
FHWA 2000 Work Zone Operations Best Practices Guidebook FHWA-OP-00-010 Washington DC Federal Highway Administration American Association of State Highway and Transportation Officials 2000 httpwwwopsfhwadotgovwzpracticesbestDefaulthtm
FHWA 2001a Informed Motorists Fewer Crashes Using Intelligent Transportation Systems in Work Zones Washington DC US Department of Transportation ITS Joint Program Office and FHWA Work Zone Team
FHWA 2001b Fact Sheet 5 Innovation During Bridge Rehabilitation Improves Mobility WinterSpring 2001 Washington DC Federal Highway Administration Illinois Department of Transportation httpopsfhwadotgovwzpracticesfactsheetsfactsheet5htm
FHWA 2003a Freeway Management Operations Handbook Washington DC Federal Highway Administration
FHWA 2003b Fact Sheet 8 Ohio Keeps Motorists and Road Rehabilitation Moving Forward Summer 2003 Columbus OH Federal Highway Administration Ohio Department of Transportation httpopsfhwadotgovwzpracticesfactsheets factsheet8htmfigure1
FHWA 2003c Shorter Duration Safer Work Zones More Satisfied Travelers Successful Applications of Full Road Closure in Work Zones FHWA-OP-03-086 Washington DC Federal Highway Administration
FHWA 2003d Full Road Closure for Work Zone Operations A Cross Cutting Study Reducing Congestion and Crashes through Full Road Closure for Maintenance and Construction Washington DC Federal Highway Administration
FHWA 2004a Work Zone Safety and Mobility Federal Register Vol 69 No 174 23 CFR Part 630
FHWA 2004b Intelligent Transportation Systems in Work Zones A Case Study Keeping Traffic Moving During Reconstruction of the Big I A Major Interstate-Interstate Interchange in Albuquerque FHWA-OP-04-072 Washington DC Federal Highway Administration
FHWA 2004c Intelligent Transportation Systems in Work Zones A Case Study Using an Automated Traffic Information System to Reduce Congestion and Improve Safety During Reconstruction of the I-55 Lake Springfield Bridge in Illinois FHWA-HOP-04-018 Washington DC Federal Highway Administration
49
FHWA 2004d Full Road Closure for Work Zone Operations A Case Study Reducing the Impact of Construction During the Rehabilitation of a Major Interstate Highway- Interstate 95 in Wilmington Delaware FHWA-HOP-05-012 Washington DC Federal Highway Administration
FHWA 2004e Full Road Closure for Work Zone Operations A Case Study Using Weekend Closures to Expedite Road Rehabilitation and Minimize the Impacts on Motorists and Road Builders I-84 Banfield Freeway in Portland Oregon FHWA-HOP-05-014 Washington DC Federal Highway Administration
FHWA 2004f Full Road Closure for Work Zone Operations A Case Study Accelerating Construction and Reducing Crashes During the Rehabilitation of a Major Downtown Route M-10 Lodge Freeway in Detroit Michigan FHWA-HOP-05-013 Washington DC Federal Highway Administration
FHWA 2004g Intelligent Transportation Systems in Work Zones A Case Study Reducing Congestion with the Use of a Traffic Management Contract Incentive during the Reconstruction of Arizona State Route 68 FHWA-HOP-04-032 Washington DC Federal Highway Administration
FHWA 2004h Mitigating Traffic Congestion The Role of Demand-Side Strategies Washington DC Association for Commuter Transportation UrbanTrans Consultants Inc and Parson Brinkerhoff and ESTC httpopsfhwadotgovpublicationsmitig_traf_cong
FHWA 2004i I-25 and I-225 Reconstruction Denver CO Washington DC UrbanTrans Consultants Inc Parson Brinkerhoff and ESTC httpopsfhwadotgovpublicationsmitig_traf_congdenver_casehtm
FHWA 2004j FHWA Research and Technology Prefabricated Bridge Elements and Systems Washington DC Federal Highway Administration wwwfhwadotgovrnt4utiprefab_bridge
FHWA 2007 Success Stories Highways for Life Federal Highway Administration 2006 httpwwwfhwadotgovhflsuccesscfm
Fox K 2007 Micro-Simulation Halcrow Group httpwwwmicrosimulationdrfoxorguk GDOT 2006 Navigator The Georgia Department of Transporationrsquos Intelligent
Transportation System Georgia Department of Transportation httpwwwgeorgia-navigatorcom
Hofener MS 2003 A Check List for Work Zone Incident Management Plans Compendium Papers on Advanced Surface Transportation Systems College Station TX Texas Transportation Institute
Horowitz A and T Notbohm 2003 Evaluation of Intellizone A System for Providing Speed Advisories to Drivers Entering Work Zones Milwaukee WI University of Wisconsin at Milwaukee Wisconsin Department of Transportation and Midwest Smart Work Zone Deployment Initiative
Iowa DOT 2007 511 Travel Information Des Moines Metro 2006 Ames IA Iowa Department of Transportation httpwww511iaorgDM_Metroaspdisplay=allamparea =IA_DesMoinesampdate=amptextOnly=False
Kamyab A T MacDonald B Storm and M Anderson-Wilk 2003 Effectiveness of Extra Law Enforcement in Construction and Maintenance Zones Ames IA Center for Transportation Research and Education Iowa State University
Maryland SHA 2005 Work Zone Safety Toolbox Baltimore MD Maryland State Highway Administration Office of Traffic and Safety
50
Maze TH GD Burchett and J Hochstein 2005 Synthesis of Procedures to Forecast and Monitor Work Zone Safety and Mobility Ames IA Center for Transportation Research and Education Iowa State University
Maze TH SD Schrock and KS VanDerHorst 1999 Traffic Management Strategies for Merge Areas in Rural Interstate Work Zones Ames IA Center for Transportation Research and Education Iowa State University
McTrans 2007 CORSIM McTrans University of Florida httpmctransceufleduindexhtm Memmott JL and CL Dudek 1982 A Model to Calculate the Road User Cost at Work Zones
FHWATX-8320+292-1 College Station TX Texas Transportation Institute MDOT 2006 Fix Detroit Six Lansing MI Michigan Department of Transportation
httpwwwmichigangovmdot016077-151-9621_11008_28818---00html Miller T (nd) Missouri Department of Transportation (MoDOT) Blanchette Bridge
Reconstruction Project Jefferson City MO Missouri Department of Transportation httpwwwplaningdotgovDocumentsPublicInvolvementblanchettehtm
Noyes PB 2002 Mainstreaming Incident Management in Design-Build The T-Rex Experience Paper presented at the ITE 2002 Annual Meeting and Exhibit Philadelphia PA
ODOT 2000 Traffic Management in Work Zones Interstate and Other Freeways Policy No 516-003(P) Columbus OH Office of Traffic Engineering Ohio Department of Transportation
ODOT 2006 Permitted Lane Closures Columbus OH Office of Traffic Engineering Ohio Department of Transportation httpplcmdotstateohusplcm plcm_webjsp
OrsquoNeill D 2001 I-95 Reconstruction and the Five Elements of Mobility Wilmington DE Delaware Department of Transportation
Rakha H M Van Aerde L Bloomberg and X Huang 1999 Construction and Calibration of a Large-scale Micro-Simulation Model of the Salt Lake Area Paper presented at the Annual Meeting of the Transportation Research Board Washington DC
Robinson J 1989 Whatrsquos New in Freeway Incident Detection Response Paper presented at the ITE International Conference Dallas TX
Rohlf JG 1994 Innovative Contracting Practices TR News 175 Saag JB 1999 Project Development Methodologies for Reconstruction of Urban Freeways and
Expressways Synthesis of Highway Practice 273 Washington DC National Cooperative Highway Research Program
Schnell T and F Aktan 2001 On the Accuracy of Commercially Available Macroscopic and Microscopic Traffic Simulation Tools for Predication of Workzone Traffic FHWAHWA-200108 Columbus OH Ohio Department of Transportation
Schnell T JS Mohror and F Aktan 2002 Evaluation of Traffic Flow Analysis Tools Applied to Work Zones based on Flow Data Collected in the Field Paper presented at the Annual Meeting of the Transportation Research Board Washington DC
Scriba T 2004 Striving for Better Work-Zone Management and Communications through ITS Transportation Management and Engineering 9 (1)
Shepard FD and BH Cottrell Jr 1986 Benefits and Safety Impact of Night Work-Zone Activities Transportation Research Record 1086
Sorenson J 2001 Acceleration Creates Rapid Rewards Faster Construction Practices Improve Work-Zone Safety and Are Preferred By Motorists Roads and Bridges Vol 39 Issue 9 18
Stahl KR and MA Gutierrez 2004 Get In Get Out Stay Out Caltrans Proves Effectiveness of Pavement Renewal Approach TR News 232 3ndash13
51
Steinke DP L Sanderson JF Byrnes Jr J Conrad R Forrestel K Harrington-Hughes KF Kobetsky S Lanford K Snyder-Petty D Testa and JD Wilkerson 2000 Methods and Procedures to Reduce Motorist Delays in European Work Zones Washington DC American Trade Initiatives and Federal Highway Administration
Strong K 2005 Performance Effectiveness of Design-Build Lane Rental and A+B Contracting Techniques Ames IA Center for Transportation Research and Education Iowa State University
Sullivan EC 1989 Accident Rates During Nighttime Construction UCB-ITS-RR-89-11 Berkeley CA Institute of Transportation Studies University of California Berkeley
TMA 2006 avoidtherushorg Transportation Management Association Des Moines Metro Area httpwwwavoidtherushorg
Trafficware Ltd 2007 Products Sim Traffic 7 httpwwwtrafficwarecomproductshtml TransOptions 2006 Denver Metro Area wwwgotransoptionscom WSDOT 2007a Flexible Start Date Washington State Department of Transportation
httpwwwwsdotwagovProjectsdeliveryalternativeFlexibleStarthtm WSDOT 2007b Lane Rental Washington State Department of Transportation
httpwwwwsdotwagovProjectsdeliveryalternativeLaneRentalhtm WSDOT 2007c Interim Completion Dates Washington State Department of Transportation
httpwwwwsdotwagovProjectsdeliveryalternativeInterimCompletion
52