Embed Size (px)
Citation preview

Microporous and Mesoporous Materials 118 (2009) 1–10
Contents lists available at ScienceDirect
Microporous and Mesoporous Materials
journal homepage: www.elsevier .com/locate /micromeso
Synthesis of MCM-22 zeolites of different Si/Al ratio and their structural,morphological and textural characterisation
C. Delitala a, M.D. Alba b, A.I. Becerro b, D. Delpiano c, D. Meloni c, E. Musu d, I. Ferino c,*
a Saras Ricerche e Tecnologie SpA, V strada, trav. C, Z.I. Macchiareddu, 09032 Assemini, Italyb Instituto de Ciencia de Materiales de Sevilla – Departamento de Química Inorgánica (CSIC-US), Avda. Américo Vespucio 49, 41092 Sevilla, Spainc Università di Cagliari, Dipartimento di Scienze Chimiche, Complesso Universitario di Monserrato, s.s. 554 bivio sestu, 09042 Monserrato, Cagliari, Italyd Università di Cagliari, Dipartimento di Scienze della Terra, via Trentino 51, 09124 Cagliari, Italy
a r t i c l e i n f o
Article history:Received 3 July 2008Received in revised form 18 July 2008Accepted 21 July 2008Available online 26 August 2008
Keywords:MCM-22XRDNMRStructureTexture
1387-1811/$ - see front matter � 2008 Elsevier Inc. Adoi:10.1016/j.micromeso.2008.07.047
* Corresponding author. Tel.: +39 070 6754383; faxE-mail address: [email protected] (I. Ferino).
a b s t r a c t
MCM-22 zeolites with Si/Al in the 9–46 range were synthesised in rotating autoclave and characterisedby X-ray diffraction, 1H, 29Si and 27Al magic angle spinning nuclear magnetic resonance, scanning elec-tron microscopy and nitrogen physisorption. For the Si/Al = 21, 30 and 46 samples both X-ray diffractionand scanning electron microscopy revealed the crystallisation of pure MCM-22. Besides the latter, crys-tals of ferrierite also formed during the synthesis of the Si/Al = 9 sample. Based on the 1H MAS NMR spec-tra of dehydrated samples, the different proton species present on the MCM-22 samples were determinedand quantified. Information about the incorporation of Al ions into the zeolite framework, as well as onthe preferential crystallographic sites occupied in dependence on the Si/Al ratio of the sample, wasobtained by 27Al MAS NMR spectroscopy. From 29Si MAS NMR spectra, differences in the degree of crys-tallinity of the samples were assessed, the results being in agreement with the diffraction data. Nitrogenphysisorption runs revealed the microporous nature of the adsorbents, with a supermicropore to ultra-micropore volume ratio in good agreement, for the best crystallised samples, with the porous structurewith supercages and sinusoidal channels of the ideal MCM-22 crystal.
� 2008 Elsevier Inc. All rights reserved.
1. Introduction
MCM-22 zeolite (IZA code: MWW), firstly synthesised by Mobil[1], has a framework in which 10-membered ring (MR) openingsgive access to two independent pore systems [2]. One of them istridimensional, being formed by large cylindrical supercages(0.71 � 0.71 � 1.84 nm) interconnected by straight and oblique(0.40 � 0.55 nm) channels (six apertures per supercage); thesupercages stack one above the other through double 6-memberedring openings, through which molecules cannot practically diffuse.The other pore system is bidimensional, being formed by intercon-nected sinusoidal channels (0.40 � 0.50 nm) surrounding the dou-ble 6-member ring connecting the supercages. Furthermore, asmall cage (0.64 � 0.69 nm) is located along each sinusoidal chan-nel. A material with such a peculiar structure has attracted atten-tion for catalytic purposes and the hydrogen form of MCM-22zeolite has actually been used as catalyst for hydrocarbon conver-sion reactions [3–5]. MCM-22 is also worthy of investigation as anadsorbent for separation processes and indeed several reports onits adsorption features have appeared [6–13]. In a previous paperfrom this laboratory [14], the behaviour of the hydrogen form of
ll rights reserved.
: +39 070 6754388.
MCM-22 zeolite in the liquid-phase adsorption at room tempera-ture and atmospheric pressure of thiophene and toluene from theiriso-octane mixtures was investigated, and compared with acti-vated carbon, i.e., a popular, ill-defined adsorbent. Both the cata-lytic and adsorption features of MCM-22 are expected to changewith the Si/Al ratio. Any investigation dealing with the behaviourof MCM-22 samples of different Si/Al obviously requires that theirpreparation be carried out by a reliable preparation route. Accord-ing to the literature, the synthesis of pure MCM-22 samples with agood crystallisation extent occurs from hydrogels with Si/Al in therange 10–30, most frequently 20 [15,16]. With synthesis tempera-tures above 423 K, the formation of ZSM-5, ferrierite and/or mord-enite has been observed, particularly when the Al content is low(30 < Si/Al < 70) [17]. Under rotating synthesis conditions and tem-peratures lower than 423 K, the MCM-22 phase is reported to formin negligible amounts and the formation of other phases is en-hanced as the Si/Al ratio decreases [17]. Other authors [15] foundthat contamination of MCM-22 by other phases can be avoidedby carrying out the synthesis in the 408–423 K temperature range.It has also been reported that rotating synthesis can lead to goodquality MCM-22 crystals whereas static synthesis results eitherin the negligible formation of the desired phase [17] or in ferrie-rite-contaminated MCM-22 (or even pure ferrierite) formation[15]. A thorough investigation of the MCM-22 synthesis under

5
FF
Si/Al=46
Si/Al=30
Si/Al=21
Inte
nsity
(a.
u.)
2 theta
Si/Al=9
F*
*
*
*
353025201510
Fig. 1. XRD patterns of the calcined products resulting from the MCM-22 synthesisprocedure. Asterisk indicates the peak used for the calculation of the extent ofcrystallisation. F indicates Ferrierite.
2 C. Delitala et al. / Microporous and Mesoporous Materials 118 (2009) 1–10
rotating and static conditions [18] showed that the Al content ofthe synthesis mixture affected the nucleation process and that for-mation of ferrierite and mordenite phases besides MCM-22 can oc-cur. It is claimed in [19] that the presence of aluminium is criticalfor the formation of MCM-22 for samples with Si/Al P 30. How-ever, a more difficult formation of MCM-22 with increasing Alcontent in gels having Si/Al ratios of 20, 15 and 10 has beenreported in [20]. It stems from the above that when preparingMCM-22 samples differing as to the Si/Al ratio it is not safe to a pri-ori assume that the MCM-22 phase has actually been formed inany case. A thorough structural and chemical characterisation ofeach sample is essential, in order to assess the presence of contam-inant phases, the degree of crystallinity, the incorporation of Alions into the zeolite framework and the preferential occupationof the crystallographic sites, as well as the different proton speciespresent. Morphological and textural characterisation is also of keyimportance.
The present paper deals with the synthesis, in rotating auto-clave, of MCM-22 samples with Si/Al ratio ranging between 9and 46 and their characterisation by X-ray diffraction (XRD) and1H, 29Si and 27Al magic angle spinning nuclear magnetic resonance(MAS NMR). Scanning electron microscopy (SEM) and nitrogenphysical adsorption–desorption were also used for assessing theirmorphology and texture, respectively.
2. Experimental
2.1. MCM-22 synthesis and characterisation
Hydrothermal synthesis of MCM-22 samples with Si/Al = 9, 21,30 and 46 was carried out by using hexamethyleneimine (HMI,99%, Aldrich) as organic template, SiO2 (Aerosil 200, Degussa),NaAlO2 (56% Al2O3, 37% Na2O, Carlo Erba), NaOH (98%, Prolabo)and deionised water. Rotating autoclaves were used for the synthe-sis. Details on the procedure can be found elsewhere [21]. Thehydrogen forms of the MCM-22 samples were obtained byexchanging the sodium forms resulting from the synthesis with1 M NH4NO3 (Carlo Erba pro-analisi) solution (1 h stirring at353 K) followed by calcination in static air (overnight at 773 K).
XRD analysis was carried out on a Siemens D-501 diffractome-ter, with Ni-filtered Cu Ka radiation, steps of 0.05� and countingtime of 3 s.
MAS NMR analysis was carried out on a Bruker DRX400 spec-trometer. The samples were packed in a zirconia rotor and spunat 10 kHz. The acquisition of 1H spectra was carried out on bothas synthesised and dehydrated samples. Samples were dehydratedat 450 �C overnight using a 3 �C min�1 ramp and packed in a driedatmosphere. Single pulse 1H (400.0 MHz) spectra were recordedusing a 4.5 ls (h = p/2) pulse with a repetition time of 5 s. A singlepulse sequence was also used for the acquisition of 27Al(130.3 MHz) spectra, with a 1.1 ls (h = p/20) pulse and a repetitiontime of 0.1 s. Finally, for 29Si (79.4 MHz), both single pulse withhigh power decoupling (hpdec) and single-contact cross-polarisa-tion (cp) pulse programmes were used. The hpedec spectra wereacquired with a pulse length of 2.7 ls and a repetition time of6 s. The Hartman–Hahn condition for 1H ? 29Si CP was establishedand optimised on kaolinite, obtaining a contact time of 4 ms.
Textural analysis was carried out on a Sorptomatic 1990 System(Fisons Instruments), by determining the nitrogen adsorption/desorption isotherm at 77 K. Before analysis, the samples wereheated overnight under vacuum up to 473 K (heating rate =1 K min�1).
Scanning electron microscopy (SEM) images of powder samplesmounted on an aluminium holder and coated with Au film in anevaporator were obtained on a FEI Quanta 200 microscope oper-ated at 30 kV.
3. Results and discussion
3.1. XRD and SEM analysis
The XRD patterns of the calcined products resulting from theMCM-22 synthesis procedure are shown in Fig. 1. By comparing(Table 1) the line positions and intensities of the XRD patterns withthose reported in [1], the materials with Si/Al ratio = 21, 30 and 46can be identified as crystalline MCM-22 samples. According to [22],the extent of crystallisation was assessed by using as a referencethe intensity of the peak at 2h = 25.9� (marked with asterisk). Thecalculated values were 100%, 94% and 58% for the samples withSi/Al = 21, 30 and 46, respectively. Concerning the product withSi/Al = 9, the presence in its XRD pattern of an intense peak at2h = 9.45�, as well as of other peaks at 22.4� and 25.7�, suggeststhat, besides MCM-22, another phase is formed during crystallisa-tion. It is known [20] that the formation of MCM-22 becomes moredifficult as the Si/Al ratio in the gel decreases. Formation of ferrie-rite and mordenite phases besides MCM-22 has been reported[15,18]. It has also been pointed out [18] that static synthesis con-ditions fail to produce MCM-22. To check this point an additionalsynthesis was carried out in static autoclave starting from the samegel composition as that which lead, in rotating autoclave, to the Si/Al = 9 sample of Fig. 1. The resulting material was identified as fer-rierite, based on its XRD pattern (Fig. 2). By comparing Fig. 1 withFig. 2 patterns, it can be concluded that the sample with Si/Al = 9 inFig. 1 is composed by a mixture of MCM-22 and ferrierite. It seems

Table 1Comparison of the line position and intensities of the XRD patterns of the samplessynthesised in this work with literature data for MCM-22 [1]
MCM-22 [1] MCM-22Si/Al = 9
MCM-22Si/Al = 21
MCM-22Si/Al = 30
MCM-22Si/Al = 46
d (Å) I/Imax
(%)d (Å) I/Imax
(%)d (Å) I/Imax
(%)d (Å) I/Imax
(%)d (Å) I/Imax
(%)
12.36 ± 0.2 20–100 12.44 72 12.35 100 12.35 100 12.44 9611.03 ± 0.2 20–60 11.04 27 11.04 49 11.04 50 11.04 35
9.45 1008.83 ± 0.14 20–100 8.83 42 8.84 59 8.79 64 8.79 1006.86 ± 0.14 0–40 6.91 32 6.86 15 6.85 13 6.86 11
6.58 186.18 ± 0.12 20–100 6.19 36 6.19 51 6.21 45 6.23 556.00 ± 0.10 0–40 5.75 115.54 ± 0.10 0–40 5.55 19 5.55 19 5.53 23 5.53 174.92 ± 0.09 0–20 5.00 144.64 ± 0.08 0–20 4.65 9 4.64 114.41 ± 0.08 0–40 4.39 15 4.38 19 4.38 19 4.38 194.25 ± 0.08 0–20 4.22 20 4.26 234.10 ± 0.07 0–60 4.16 254.06 ± 0.07 0–60 4.06 22 4.05 26 4.05 25 4.05 21
3.97 39 3.94 273.91 ± 0.07 20–100 3.91 42 3.91 39 3.91 40 3.91 293.75 ± 0.06 0–40 3.76 34 3.74 27 3.74 27 3.74 25
3.65 203.56 ± 0.06 0–40 3.53 34 3.56 23 3.56 21 3.57 243.42 ± 0.06 60–100 3.46 50 3.42 73 3.42 79 3.41 67
3.42 51 3.38 763.30 ± 0.05 0–40 3.30 22 3.30 21 3.29 23 3.34 963.20 ± 0.05 0–40 3.21 26 3.19 22 3.19 27 3.19 333.14 ± 0.05 0–40 3.12 27 3.11 16 3.11 18 3.10 183.07 ± 0.05 0–20 3.04 142.99 ± 0.05 0–202.82 ± 0.05 0–20 2.83 82.78 ± 0.05 0–202.68 ± 0.05 0–20 2.68 11 2.67 112.59 ± 0.05 0–20 2.59 8 2.59 9 2.60 9
10
inte
nsity
(a.
u.)
2 theta
10
inte
nsity
(a.
u.)
2 theta403020
403020
Fig. 2. XRD patterns for the calcined product resulting from MCM-22 synthesisprocedure under static conditions (top) and ferrierite (bottom, from Database ofzeolite structure, http://www.iza-structure.org/databases/).
C. Delitala et al. / Microporous and Mesoporous Materials 118 (2009) 1–10 3
that for such a low Si/Al ratio the control of the synthesis parame-ters is critical; probably, uncontrolled perturbations of the rotatingspeed of the autoclave are responsible for the crystallisation of fer-rierite besides MCM-22.
The results of the morphological investigation are shown inFig. 3. For the Si/Al = 21, 30 and 46 samples the SEM images con-firm the crystallisation of pure MCM-22, which appears in the formof very thin, interpenetrating platelets forming relatively smalllamellar particles. Besides the latter, crystals of ferrierite (indicatedby the arrows) are clearly visible in the SEM image of the Si/Al = 9sample. (A SEM image of the ferrierite sample obtained in staticautoclave is also shown in the same Fig. 3 for comparison.)
3.2. MAS NMR analysis
Fig. 4a shows the 1H MAS NMR spectrum of ferrierite and theMCM-22 samples with different Si/Al ratios, before (dashed line)and after (solid line) dehydration. All the spectra, before dehydra-tion, show a high intensity signal accompanied by a very low inten-sity one, with maxima at around 4.5–4.8 ppm and 1.3 ppm,respectively. The low-frequency signal is attributed to weaklyacidic terminal SiOH groups formed in crystal defects and at theouter surface of the molecular sieve, as well as to AlOH groups innon-framework aluminous species [23,24]. The high intensity bandat ca. 4.5–4.8 ppm is due to protons in different environments,mainly, in free H2O and in Si(OH)Al hydroxyl groups [25]. Dehydra-tion of the samples was carried out in order to see the resonancesother than H2O, contributing to the high intensity signal. The spec-tra of the dehydrated samples can be more easily examined inFig. 4b, where the deconvolution of each spectrum is shown to-gether with the experimental curves. The spectrum of ferrierite is
composed of two resonances, whereas a reasonable fitting of thespectra of all the dehydrated MCM-22 samples needs up to sevendifferent resonances, as seen in Fig. 4b. Table 2 shows the chemicalshift values and the area under the curves for each resonance.
These 1H MAS NMR signals observed in the spectra of the dehy-drated samples can be grouped as in the following. (a) The signals inthe 1.8–2.3 ppm region are caused by silanol OH groups [26]. Hun-ger et al. [27] have also observed, in this region of the spectrum, twoSiOH components that they assigned to terminal OH groups at theexternal surface and to internal silanol groups at open Si–O–Si link-ages, the latter located at a higher frequency than the former. (b)The signals in the 2.6–3.6 ppm region are generally assigned inthe literature to hydroxyl groups associated with non-frameworkaluminium [26,28,29]. However, the corresponding signal in theMCM-22 sample with a Si/Al ratio of 46 cannot be assigned to thisenvironment given the absence of extraframework Al in this sam-ple, as will be seen later. Consequently, it is likely that the signalsin this ppm region correspond to two different environments, i.e.,OH groups associated with non-framework aluminium as well asOH groups associated with framework Al in a low condensationstate – q3(3OSi,1OH) and q2(2OSi,2OH) – the latter being the uniqueenvironments contributing to the signal in the MCM-22 sample

Fig. 3. SEM images of MCM-22 samples with Si/Al = 9, 21, 30 and 46 (top) and ferrierite obtained in static autoclave (bottom).
4 C. Delitala et al. / Microporous and Mesoporous Materials 118 (2009) 1–10
with Si/Al ratio = 46. (c) There are two signals in the 3.8–5.9 ppmregion which are generally ascribed to acidic OH groups. The low-frequency signal is due to bridging type Si(OH)Al [26,28]; the highfrequency signal is also ascribed to acidic OH groups of the Si(OH)Albridging type but modified through steric effects, which are ob-served, for example, for OH groups in the small cavities [26]. (d)The signal at ca. 9.0 ppm is due to residual ammonium ions [26]coming from the treatment with NH4NO3 to obtain the hydrogenforms of the MCM-22 samples (see Section 2). (e) A broad band atnegative chemical shifts can be observed in all the fittings. Mastik-hin et al. [29] observed two major surface hydroxyl signals in the 1H
MAS NMR spectrum of Al2O3, at�0.6 ppm and 3.0 ppm, which theyassigned to OH groups attached to Al, those of which responsible forthe signal at �0.6 ppm having a basic character. In line with thisstudy, the band at negative shift observed in the present investiga-tion can be assigned to basic superficial OH groups attached toextraframework Al, which is in agreement with the absence ofextraframework Al in the MCM-22 sample with Si/Al ratio = 46, gi-ven the very low area under the curve of the 1H signal in this com-position (1.9% of the total area).
The analysis of the intensity of the signals (see Table 2) in thedifferent 1H MAS NMR spectra of the pure MCM-22 samples (Si/

21 18 15 12 9 6 3 0 -3 -6 -9 -12-15
ppm/TMS
Si/Al=46
Si/Al=30
Si/Al=21
Si/Al=9
FER
inte
nsit
y (a
.u.)
21 18 15 12 9 6 3 0 -3 -6 -9 -12-15
ppm/TMS
Si/Al=46
Si/Al=30
Si/Al=21
Si/Al=9
FER
a b
Fig. 4. (a): 1H MAS NMR spectra of MCM-22 samples with different Si/Al ratios, before (dashed) and after (solid line) dehydration. The spectrum of ferrierite is also shownwith comparative purposes. (b): Deconvolution of the 1H MAS NMR spectra of the dehydrated ferrierite and MCM-22 samples.
C. Delitala et al. / Microporous and Mesoporous Materials 118 (2009) 1–10 5
Al ratios = 21, 30 and 46) indicate that: (i) there is a linear correla-tion between the area under the curve corresponding to protons inOH groups attached to extraframework aluminium and the Al/Al + Si ratio; (ii) the intensity of the signal at ca. 1 ppm, assignedto terminal Si–OH groups at the external surface, increases withlowering aluminium content; (iii) no correlation between boththe intensity and position of the signals corresponding to Si(OH)Alenvironments and the aluminium content can be established giventhat the position and intensity of these signals are influenced bythe humidity of the sample so that, only when the sample is com-pletely hydrated, can these signals be used as an indication of theacidic strength of the sample [28,30]. However, as seen in Fig. 4a,
isolation of the Si(OH)Al signal is not possible in the hydrated sam-ples due to overlap with the molecular water signal.
Fig. 5 shows the 27Al MAS NMR spectra of the MCM-22 sampleswith different Si/Al ratios. The spectrum of ferrierite is also shownwith comparative purposes. The spectra of all the MCM-22 sam-ples, except that of MCM-22 with Si/Al = 46, show clearly two setsof signals: a low-frequency signal, at ca. 0 ppm, absent in the Si/Al = 46 sample, which is attributed to octahedral Al in extraframe-work species and a broader band with a maximum at 54–56 ppmdue to 4-coordinated framework Al, which looks like an unresolvedasymmetric triplet. The absence of the peak at 0 ppm in the spec-trum of MCM-22 with Si/Al = 46 indicates that all Al atoms have

Table 21H chemical shift, area under the curve and assignation of each curve obtained fromthe deconvolution of the experimental 1H MAS NMR spectra of the dehydrated MCM-22 samples
Si/Al d (ppm) % Assignation
9 �4.38 13.32 Basic AlNFOH (e)1.23 17.69 SiOH (a)1.77 2.16 SiOH (a)3.58 13.69 AlNFOH + AlF in q2 and q3 (b)4.97 32.01 Si(OH)Al (c)5.82 21.05 Si(OH)Al (c)9.03 0.09 NHþ4 (d)
21 �3.61 24.82 Basic AlNFOH (e)1.06 13.04 SiOH (a)1.74 3.07 SiOH (a)3.43 13.08 AlNFOH + AlF in q2 and q3 (b)4.90 17.82 Si(OH)Al (c)5.65 28.06 Si(OH)Al (c)9.03 0.12 NHþ4 (d)
30 �4.68 19.15 Basic AlNFOH (e)0.83 17.12 SiOH (a)1.72 2.34 SiOH (a)3.23 12.62 AlNFOH + AlF in q2 and q3 (b)4.56 14.07 Si(OH)Al (c)5.74 34.23 Si(OH)Al (c)9.03 0.11 NHþ4 (d)
46 �7.95 1.9 Basic AlNFOH (e)0.3 31.16 SiOH (a)1.77 1.00 SiOH (a)3.36 14.89 AlNFOH + AlF in q2 and q3 (b)5.33 33.77 Si(OH)Al (c)5.75 16.46 Si(OH)Al (c)9.17 0.81 NHþ4 (d)
AlNF, non-framework aluminium; AlF, framework aluminium; q2, q2(2OSi,2OH)aluminium environments; q3, q3(3OSi,1OH) aluminium environments. Letterswithin brackets refer to the code used in the text.
8027Al/ppm
Al VI
Al IV
T1,3,4,5,8
Si/Al=46
Si/Al=30
Si/Al=21
FER
Si/Al=9
T6,7
-2002060 40
Fig. 5. Single pulse 27Al MAS NMR spectra of MCM-22 with different Si/Al ratios.The spectrum of ferrierite is also shown with comparative purposes.
a1 a2
c
Fig. 6. Structure of MCM-22 (space group P6/mmm).
6 C. Delitala et al. / Microporous and Mesoporous Materials 118 (2009) 1–10
been incorporated into the framework in this low-content Al sam-ple [25]. Finally, a very broad peak at ca. 30 ppm is observed in thespectra of the samples with Si/Al = 21 and 9, which is attributed todistorted tetrahedral or pentacoordinated aluminium [31,32]; thedistinction between these environments would only be possiblethrough 27Al multiple quantum MAS NMR spectroscopy [32],which is not available at the present authors’ laboratory.
Regarding the band at ca. 54–56 ppm, Kolodziejski et al. [33]registered both single pulse and 1H ? 27Al cross-polarisation spec-tra on a MCM-22 sample with Si/Al ratio = 15, and observed a dif-ferent shape of that signal, implying that it may be composed ofresonances from inequivalent framework Al tetrahedral sites. Theyused then quadrupole nutation spectroscopy to resolve the peaksand concluded that there are two sets of 4-coordinated Al siteswith similar quadrupolar coupling constants and, consequently,similar environmental symmetry. Finally, these authors noted thatthe apparent triplet from 4-coordinated Al consists of two peaks, soat least one of them is evidently asymmetric, which is intrinsic ofits quadrupolar shape. Double rotation (DOR) NMR experimentscarried out later by Lawton et al. [34,35] revealed that the irregularshape of the Al signal do not originate from quadrupolar effects butfrom distinct tetrahedral Al species. They assigned the lower-fre-quency resonances to T6 and T7 sites and the higher frequency onesto T1, T3, T4, T5 and T8 Al sites. Comparing the intensity change ofboth aluminium signals in the single pulse and the cross-polarisa-tion spectra shown by Kolodziejski et al. [33], it can be deducedthat the polarisation transfer is considerably less effective in theT6 and T7 sites. This is in good agreement with the theoretical stud-ies carried out by Wang et al. [36], who found that the preferentiallocation of the H atoms are those implying T1–T4 sites. The T6 andT7 crystallographic sites are shown in blue in Fig. 6, which is adrawn of the MCM-22 structure using the crystallographic param-
eters given by Leonowicz et al. [2]. The spectra in Fig. 5 shows asthat the presence of Al in T6 and T7 sites increases with increasingAl content.
The Al(IV)/Al(VI) ratios have been calculated for all composi-tions; it has to be pointed out that for the integration the signalat 30 ppm has been considered as part of the framework alumin-

Table 4Chemical shift of the different T sites calculated using the equation proposed in [36]
d (ppm) T sites Population
�120.2 T1, T4, T5 1�115.6 T6 1�114.6 T3 1�111.2 T7, T8 2�106.3 T2 1
C. Delitala et al. / Microporous and Mesoporous Materials 118 (2009) 1–10 7
ium. The results are shown in Table 3. It is observed, as already seenin Fig. 5, that the lower the amount of total Al, the higher theamount of Al incorporated into the framework. However, there isno correlation between the proportion of extraframework alumin-ium and the aluminium content in the gel composition, as alreadyobserved by Kolodziejski et al. [33], possibly as a consequence ofthe surfactant removal.
Fig. 7 shows the hpdec 29Si MAS NMR spectra of the MCM-22samples with different Si/Al ratios. The spectrum of ferrierite is alsoshown with comparative purposes. All the MCM-22 spectra showfive signals in the Q4 region and an additional one inside the Q3 re-gion, the latter being due to silanol groups [25]. There is some con-troversy in the literature about the assignations of the five signalscorresponding to the Q4 environments [19,20,33,37]. Based on thestructural model for MCM-22 proposed by Leonowicz et al. [2],the chemical shift of the different T sites have been calculated byusing the equation proposed by Engelhardt and Radeglia [38]:
d ¼ �0:6192a� 18:68 ð1Þ
Table 4 summarises the calculated chemical shifts and the Tsites assignations and populations, although the contribution fromSi(1Al) sites could also be involved. As expected, the spectrum ofMCM-22 with Si/Al = 46 matches almost perfectly in number oflines and relative intensities the theoretical values included inTable 4. With increasing the Al content, the position of the peaks
Table 3AlIV/AlVI and Si/AlIV ratios in MCM22 samples
Si/Ala AlIV/AlVI Si/AlIV
9 2.80 10.8621 3.18 27.6030 3.30 39.0946 14.88 49.09
a Determined by ICP/AA analysis.
Fig. 7. Proton decoupling 29Si MAS NMR spectra of MCM22 samples with differentSi/Al ratios. The spectrum of ferrierite is shown with comparative purposes.
does not change appreciably for any composition. However, peaksat ca. �113 ppm and �115 ppm resolve slightly as a consequenceof the higher crystallinity of the higher Al content samples, inagreement with the X-ray diffraction results. This is not the caseof the sample with Si/Al = 9, where these observations are not pos-sible due to the concomitant formation of ferrierite, whose spec-trum shows a 29Si signal in the same chemical shift range asMCM-22, as seen in Fig. 7. The better crystallinity of the high-Alcontent sample is in agreement with Cheng et al. [19] who claimedthat the presence of aluminium is critical for the formation ofMCM-22, although they only synthesised samples with Si/Al P 30. However, it seems that very high-Al contents lead to theformation of additional phases, like the case of sample with Si/Al = 9 in this work, which shows impurities of ferrierite. This resultagrees with that of Vuono et al. [20], who found a more difficultformation of MCM-22 with increasing Al content in gels havingSi/Al ratios of 20, 15 and 10. There is, therefore, a limit in the Alcontent for the formation of pure MCM-22, which, according tothe present results, could be between Si/Al = 9 and 21.
According to the proposed structure for MCM-22 [2], there areeight sites in the hexagonal model, which indicates that there areseveral crystallographic sites with overlapping resonances. Thisassessment reinforces itself if an orthorrombic model is consid-ered, as proposed also by Leonowicz et al. [2], in which 13 Si sitesare present in the unit cell. No discussion about which symmetryrepresents better the true will be presented here, as it would makeno difference regarding the basic topology of the framework andthe present NMR data can support both models equally well. Sim-ply, the 29Si hpdec spectra of each composition will be deconvo-luted by using, exclusively, well-resolved peaks, i.e., thosemarked with lines in Fig. 7, for the reasons given below. Deconvo-lution of the 29Si NMR spectra of MCM22 into individual compo-nents is not trivial. Kolodziejski et al. [33] proposed two differentmethods in order to get reasonable fittings; one of them usesnon-Gaussian lines (i.e., partially Lorentzian) and the other em-ploys purely Gaussian lines with a broad signal simulating thebackground. They concluded that the deconvolution using Gauss-ian lines is more appropriate; this method has been used here.Fig. 8 represents the fitting of one of the spectra, as an example.The area under the curve of each individual component and theassignation of them, based on Table 4, are shown in Fig. 9 (solidsquares) for MCM-22 samples with Si/Al = 21, 30 and 46. The pres-ence of ferrierite in the sample with Si/Al = 9 hinders the analysisof the corresponding spectrum.
Fig. 10 shows the comparison between the cross-polarisation(cp) and the single pulse (hpdec) 29Si MAS NMR spectra of theMCM-22 sample with Si/Al = 21. The main changes observed inthe cp spectrum compared to the hpdec spectrum are the increasein the intensity of the peaks located at ca. �98 ppm and �105 ppm,as well as the decrease in the intensity of signals at �111 ppmand 115 ppm and the appearance of a new signal in the cp spectraat ca. �92 ppm. The polarisation is transferred from the hydroxylprotons, so CP strongly and selectively enhances the peaks fromhydroxylated sites and other silicons in their proximity. Thus, thepeaks at ca. �98 ppm and �92 ppm must come from Si(OSi)3OHsites and Si(OSi)2(OH)2 sites, respectively. The peak at �105 ppm

-120 -115 -110 -105 -100 -95 -900
5
10
15
20
25
30
35
40
45
T2
HPDEC CP
area
und
er th
e cu
rve
ppm from TMS
Si/Al=46
T1,4,5T6
T3
T7,8
Q3
Q3
Q2
-120 -115 -110 -105 -100 -95 -900
5
10
15
20
25
30
35
40
45
Q3
T2
HPDEC CP
area
und
er th
e cu
rve
ppm from TMS
Si/Al=30
T1,4,5 T6
T3
T7,8
Q3
Q3
Q2
-120 -115 -110 -105 -100 -95 -900
5
10
15
20
25
30
35
40
45
HPDEC CP
area
und
er th
e cu
rve
ppm from TMS
Si/Al=21
T1,4,5T6
T3
T7,8
T2
Q3Q3
Q2
Fig. 9. Area under the curve of the individual components obtained from thedeconvolution of the hpdec (circles) and cp (squares) 29Si MAS NMR spectra of theMCM-22 with Si/Al = 21, 30 and 46.
-80 -90 -100 -110 -120 -130 -14029Si/ppm
Fig. 8. 29Si MAS NMR spectrum of MCM22-21 sample. Cross: raw spectrum, solidline: fit, dashed line: individual components.
8 C. Delitala et al. / Microporous and Mesoporous Materials 118 (2009) 1–10
must have some contribution from Si(OSi)4 sites in the vicinity ofsilanol groups. On the contrary, the peak at �119.5 ppm decreasesafter applying CP. The rest of compositions show very similar behav-iour, as observed in Fig. 9, which shows the area under the curve ofeach individual component (open squares) for the MCM-22 sampleswith Si/Al = 21, 30 and 46. The spectrum of the latter does not show,however, the increase of intensity of the peak at ca. �105 ppm, ob-served in those for the Si/Al = 21 and 46 samples. The drastic de-crease of the signals at ca. �111 ppm and �115 ppm agrees wellwith the assignation of those signals (Table 4) to T7,8 and T6 sites,which are not preferential locations of the protonic H atoms [36].
Fig. 11 shows the area under the curve of the individual compo-nents at ca. �98 ppm and �92 ppm, obtained after the deconvolu-tion of the CP 29Si MAS NMR spectra of the MCM-22 samples withSi/Al = 21, 30 and 46 versus the Al/(Si + Al) ratio. A significant de-crease in the number of Q3 environments is observed with increas-ing the Al/(Si + Al) ratio, while the area under the curve assigned toQ2 environments does not change significantly. This result is ingood agreement with the observed increase in the intensity ofthe 1H signal at ca. 1 ppm, assigned to terminal Si–OH groups atthe external surface, which takes place with lowering the alumin-ium content.
3.3. Textural analysis
The nitrogen adsorption/desorption isotherms for the MCM-22samples are shown in Fig. 12. All the isotherms exhibit a ‘‘rectan-gular” trend, i.e., a sudden increase of the adsorbed amount occur-ring at very low p/po, followed by a long, virtually horizontalplateau extending up to the high p/po values. This is typical ofmicroporous solids [39], which is in agreement with the zeoliticnature of these materials. A very narrow, vertical hysteresis loopconfined in the region at p/po very close to unity is observed forthe Si/Al = 21 sample. It can be taken as an indication [39] of thepresence of some slit-shaped, wide mesopores (or narrow macrop-ores), most probably originated by the aggregation of the lamellarparticles visible in the SEM images (Fig. 3).
The Dubinin–Raduskevitch (DR) method was chosen as appro-priate for the analysis of the nitrogen adsorption isotherms, due
to the by far predominant microporous character of the samples.The micropore volume, vDR, and micropore surface area, SDR, werecalculated for all the samples from the intercept and slope valuesof the linear DR-plot (not shown). Further information about themicropore structure was obtained by the aS method [39]. By usingthe Harkins–Jura equation, the corresponding aS-plot (not shown)was obtained for each sample, from which the volume of the ultra-

Fig. 10. hpdec (solid line) and CP (dashed line) 29Si MAS NMR spectra of the MCM-22 sample with Si/Al = 21.
0,020 0,025 0,030 0,035 0,040 0,0450
5
10
15
20
25
30
35
40
45
area
und
er th
e cu
rve
Al/(Si+Al)
Fig. 11. Area under the curve of the Q3 (circle) and Q2 (square) obtained from thedeconvolution of the hpdec (open) and cp (solid) 29Si MAS NMR spectra of theMCM-22 samples with Si/Al = 21, 30 and 46.
C. Delitala et al. / Microporous and Mesoporous Materials 118 (2009) 1–10 9
micropores, vu, and the total micropore volume, vt, were deter-mined. The supermicropore volume, vs, was then calculated asthe difference vt–vu. The textural analysis results are summarisedin Table 5. For the pure MCM-22 samples the surface area andthe micropore volume decrease as the Si/Al ratio increases, inagreement with their crystallisation extent, which is 100%, 94%
Fig. 12. Nitrogen adsorption–desorption
and 58% for the samples with Si/Al = 21, 30 and 46, respectively.It is known [39] that primary micropore filling occurs in pores ofwidth <2d and secondary micropore filling in pores of up to ca.5d (where d is the nitrogen molecular diameter, i.e., 0.36 nm). It
isotherms for the MCM-22 samples.
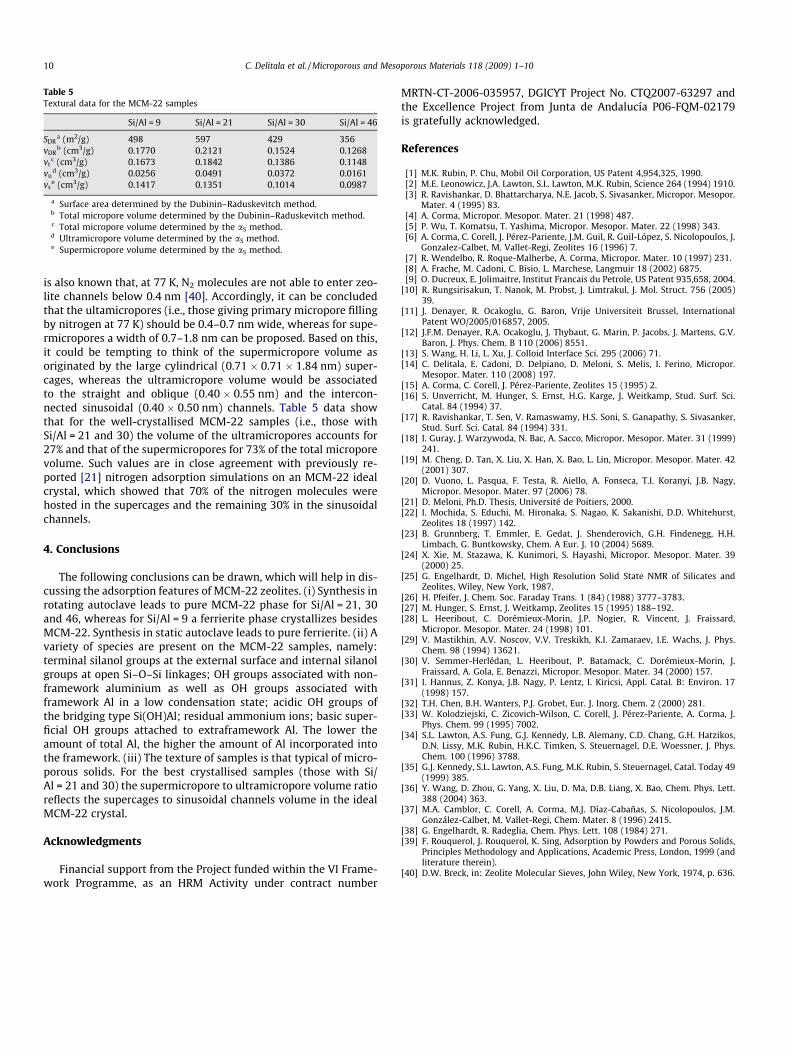
Table 5Textural data for the MCM-22 samples
Si/Al = 9 Si/Al = 21 Si/Al = 30 Si/Al = 46
SDRa (m2/g) 498 597 429 356
vDRb (cm3/g) 0.1770 0.2121 0.1524 0.1268
vtc (cm3/g) 0.1673 0.1842 0.1386 0.1148
vud (cm3/g) 0.0256 0.0491 0.0372 0.0161
vse (cm3/g) 0.1417 0.1351 0.1014 0.0987
a Surface area determined by the Dubinin–Raduskevitch method.b Total micropore volume determined by the Dubinin–Raduskevitch method.c Total micropore volume determined by the aS method.d Ultramicropore volume determined by the aS method.e Supermicropore volume determined by the aS method.
10 C. Delitala et al. / Microporous and Mesoporous Materials 118 (2009) 1–10
is also known that, at 77 K, N2 molecules are not able to enter zeo-lite channels below 0.4 nm [40]. Accordingly, it can be concludedthat the ultamicropores (i.e., those giving primary micropore fillingby nitrogen at 77 K) should be 0.4–0.7 nm wide, whereas for supe-rmicropores a width of 0.7–1.8 nm can be proposed. Based on this,it could be tempting to think of the supermicropore volume asoriginated by the large cylindrical (0.71 � 0.71 � 1.84 nm) super-cages, whereas the ultramicropore volume would be associatedto the straight and oblique (0.40 � 0.55 nm) and the intercon-nected sinusoidal (0.40 � 0.50 nm) channels. Table 5 data showthat for the well-crystallised MCM-22 samples (i.e., those withSi/Al = 21 and 30) the volume of the ultramicropores accounts for27% and that of the supermicropores for 73% of the total microporevolume. Such values are in close agreement with previously re-ported [21] nitrogen adsorption simulations on an MCM-22 idealcrystal, which showed that 70% of the nitrogen molecules werehosted in the supercages and the remaining 30% in the sinusoidalchannels.
4. Conclusions
The following conclusions can be drawn, which will help in dis-cussing the adsorption features of MCM-22 zeolites. (i) Synthesis inrotating autoclave leads to pure MCM-22 phase for Si/Al = 21, 30and 46, whereas for Si/Al = 9 a ferrierite phase crystallizes besidesMCM-22. Synthesis in static autoclave leads to pure ferrierite. (ii) Avariety of species are present on the MCM-22 samples, namely:terminal silanol groups at the external surface and internal silanolgroups at open Si–O–Si linkages; OH groups associated with non-framework aluminium as well as OH groups associated withframework Al in a low condensation state; acidic OH groups ofthe bridging type Si(OH)Al; residual ammonium ions; basic super-ficial OH groups attached to extraframework Al. The lower theamount of total Al, the higher the amount of Al incorporated intothe framework. (iii) The texture of samples is that typical of micro-porous solids. For the best crystallised samples (those with Si/Al = 21 and 30) the supermicropore to ultramicropore volume ratioreflects the supercages to sinusoidal channels volume in the idealMCM-22 crystal.
Acknowledgments
Financial support from the Project funded within the VI Frame-work Programme, as an HRM Activity under contract number
MRTN-CT-2006-035957, DGICYT Project No. CTQ2007-63297 andthe Excellence Project from Junta de Andalucía P06-FQM-02179is gratefully acknowledged.
References
[1] M.K. Rubin, P. Chu, Mobil Oil Corporation, US Patent 4,954,325, 1990.[2] M.E. Leonowicz, J.A. Lawton, S.L. Lawton, M.K. Rubin, Science 264 (1994) 1910.[3] R. Ravishankar, D. Bhattarcharya, N.E. Jacob, S. Sivasanker, Micropor. Mesopor.
Mater. 4 (1995) 83.[4] A. Corma, Micropor. Mesopor. Mater. 21 (1998) 487.[5] P. Wu, T. Komatsu, T. Yashima, Micropor. Mesopor. Mater. 22 (1998) 343.[6] A. Corma, C. Corell, J. Pérez-Pariente, J.M. Guil, R. Guil-López, S. Nicolopoulos, J.
Gonzalez-Calbet, M. Vallet-Regi, Zeolites 16 (1996) 7.[7] R. Wendelbo, R. Roque-Malherbe, A. Corma, Micropor. Mater. 10 (1997) 231.[8] A. Frache, M. Cadoni, C. Bisio, L. Marchese, Langmuir 18 (2002) 6875.[9] O. Ducreux, E. Jolimaitre, Institut Francais du Petrole, US Patent 935,658, 2004.
[10] R. Rungsirisakun, T. Nanok, M. Probst, J. Limtrakul, J. Mol. Struct. 756 (2005)39.
[11] J. Denayer, R. Ocakoglu, G. Baron, Vrije Universiteit Brussel, InternationalPatent WO/2005/016857, 2005.
[12] J.F.M. Denayer, R.A. Ocakoglu, J. Thybaut, G. Marin, P. Jacobs, J. Martens, G.V.Baron, J. Phys. Chem. B 110 (2006) 8551.
[13] S. Wang, H. Li, L. Xu, J. Colloid Interface Sci. 295 (2006) 71.[14] C. Delitala, E. Cadoni, D. Delpiano, D. Meloni, S. Melis, I. Ferino, Micropor.
Mesopor. Mater. 110 (2008) 197.[15] A. Corma, C. Corell, J. Pérez-Pariente, Zeolites 15 (1995) 2.[16] S. Unverricht, M. Hunger, S. Ernst, H.G. Karge, J. Weitkamp, Stud. Surf. Sci.
Catal. 84 (1994) 37.[17] R. Ravishankar, T. Sen, V. Ramaswamy, H.S. Soni, S. Ganapathy, S. Sivasanker,
Stud. Surf. Sci. Catal. 84 (1994) 331.[18] I. Guray, J. Warzywoda, N. Bac, A. Sacco, Micropor. Mesopor. Mater. 31 (1999)
241.[19] M. Cheng, D. Tan, X. Liu, X. Han, X. Bao, L. Lin, Micropor. Mesopor. Mater. 42
(2001) 307.[20] D. Vuono, L. Pasqua, F. Testa, R. Aiello, A. Fonseca, T.I. Koranyi, J.B. Nagy,
Micropor. Mesopor. Mater. 97 (2006) 78.[21] D. Meloni, Ph.D. Thesis, Université de Poitiers, 2000.[22] I. Mochida, S. Educhi, M. Hironaka, S. Nagao, K. Sakanishi, D.D. Whitehurst,
Zeolites 18 (1997) 142.[23] B. Grunnberg, T. Emmler, E. Gedat, J. Shenderovich, G.H. Findenegg, H.H.
Limbach, G. Buntkowsky, Chem. A Eur. J. 10 (2004) 5689.[24] X. Xie, M. Stazawa, K. Kunimori, S. Hayashi, Micropor. Mesopor. Mater. 39
(2000) 25.[25] G. Engelhardt, D. Michel, High Resolution Solid State NMR of Silicates and
Zeolites, Wiley, New York, 1987.[26] H. Pfeifer, J. Chem. Soc. Faraday Trans. 1 (84) (1988) 3777–3783.[27] M. Hunger, S. Ernst, J. Weitkamp, Zeolites 15 (1995) 188–192.[28] L. Heeribout, C. Dorémieux-Morin, J.P. Nogier, R. Vincent, J. Fraissard,
Micropor. Mesopor. Mater. 24 (1998) 101.[29] V. Mastikhin, A.V. Noscov, V.V. Treskikh, K.I. Zamaraev, I.E. Wachs, J. Phys.
Chem. 98 (1994) 13621.[30] V. Semmer-Herlédan, L. Heeribout, P. Batamack, C. Dorémieux-Morin, J.
Fraissard, A. Gola, E. Benazzi, Micropor. Mesopor. Mater. 34 (2000) 157.[31] I. Hannus, Z. Konya, J.B. Nagy, P. Lentz, I. Kiricsi, Appl. Catal. B: Environ. 17
(1998) 157.[32] T.H. Chen, B.H. Wanters, P.J. Grobet, Eur. J. Inorg. Chem. 2 (2000) 281.[33] W. Kolodziejski, C. Zicovich-Wilson, C. Corell, J. Pérez-Pariente, A. Corma, J.
Phys. Chem. 99 (1995) 7002.[34] S.L. Lawton, A.S. Fung, G.J. Kennedy, L.B. Alemany, C.D. Chang, G.H. Hatzikos,
D.N. Lissy, M.K. Rubin, H.K.C. Timken, S. Steuernagel, D.E. Woessner, J. Phys.Chem. 100 (1996) 3788.
[35] G.J. Kennedy, S.L. Lawton, A.S. Fung, M.K. Rubin, S. Steuernagel, Catal. Today 49(1999) 385.
[36] Y. Wang, D. Zhou, G. Yang, X. Liu, D. Ma, D.B. Liang, X. Bao, Chem. Phys. Lett.388 (2004) 363.
[37] M.A. Camblor, C. Corell, A. Corma, M.J. Díaz-Cabañas, S. Nicolopoulos, J.M.González-Calbet, M. Vallet-Regi, Chem. Mater. 8 (1996) 2415.
[38] G. Engelhardt, R. Radeglia, Chem. Phys. Lett. 108 (1984) 271.[39] F. Rouquerol, J. Rouquerol, K. Sing, Adsorption by Powders and Porous Solids,
Principles Methodology and Applications, Academic Press, London, 1999 (andliterature therein).
[40] D.W. Breck, in: Zeolite Molecular Sieves, John Wiley, New York, 1974, p. 636.


![Nucleation and growth of zeolites and inorganic mesoporous ...ceweb/faculty/bradc/pdfs/06-171epp-cur-op.pdfMesoporous oxides, such as MCM-41 [1], have much larger pore dimensions (ca](https://img.dokumen.tips/doc/110x75/5f0a60987e708231d42b5727/nucleation-and-growth-of-zeolites-and-inorganic-mesoporous-cewebfacultybradcpdfs06-171epp-cur-oppdf.jpg)