Embed Size (px)
Citation preview

SYNTHESIS AND OPTOELECTRONIC APPLICATIONS OF BENZOTRIAZOLE
AND DIBENZOSILOLE BASED ALTERNATING COPOLYMERS
A THESIS SUBMITTED TO
THE GRADUATE SCHOOL OF NATURAL AND APPLIED SCIENCES
OF
MIDDLE EAST TECHNICAL UNIVERSITY
BY
OZAN ERLİK
IN PARTIAL FULFILLMENT OF THE REQUIREMENTS
FOR
THE DEGREE OF MASTER OF SCIENCE
IN
CHEMISTRY
OCTOBER 2014


Approval of the thesis:
SYNTHESIS AND OPTOELECTRONIC APPLICATIONS OF
BENZOTRIAZOLE AND DIBENZOSILOLE BASED ALTERNATING
COPOLYMERS
submitted by OZAN ERLİK in partial fulfillment of the requirements for the degree of
Master of Science in Chemistry Department, Middle East Technical University by,
Prof. Dr. Gülbin Dural Ünver _____________
Dean, Graduate School of Natural and Applied Sciences
Prof. Dr. İlker Özkan _____________
Head of Department, Department of Chemistry
Assoc. Prof. Dr. Ali Çırpan _____________
Supervisor, Department of Chemistry, METU
Examining Committee Members:
Prof. Dr. Levent Toppare _____________
Chemistry Dept., METU
Assoc.Prof. Dr. Ali Çırpan _____________
Chemistry Dept., METU
Assoc. Prof. Dr. Emren Esentürk _____________
Chemistry Dept., METU
Assoc. Prof. Dr. Yasemin Arslan Udum ______________
Adv Tech., Gazi University
Asisst. Prof. Dr. İrem Erel Göktepe ______________
Chem. Dept., METU
Date: 27/10/2014

iv
I hereby declare that all information in this document has been obtained and
presented in accordance with academic rules and ethical conduct. I also declare
that, as required by these rules and conduct, I have fully cited and referenced
all material and results that are not original to this work.
Name, Last name: Ozan Erlik
Signature

v
ABSTRACT
SYNTHESIS AND OPTOELECTRONIC APPLICATIONS OF
BENZOTRIAZOLE AND DIBENZOSILOLE BASED ALTERNATING
COPOLYMERS
Erlik, Ozan
M.S., Department of Chemistry
Supervisor: Assoc. Prof. Dr. Ali Çırpan
October 2014, 109 pages
Dibenzosilole synonym of silafluorene based polymers have been extensively used
as the donor moiety in D-A approach for several years for optoelectronic
applications like electrochromic (EC) devices, organic light emitting diodes
(OLEDs), organic field effect transistors (OFETs) and most widely organic
photovoltaics (OPVs). Moreover, chalcogenophenes such as thiophene and
selenophene are used as an energy bridge between the donor and acceptor units to
adjust the electronic and optical properties of the conjugated polymers (CPs). In this
study, benzotriazole moieties functionalized by different alkyl chains were used as
the acceptor unit. Thiophene and selenophene groups were used as π-bridge
molecules with their donor character. A silafluorene derivative was used as the
donor molecule in the polymer backbone. In this manner, four different p-type
conjugated polymers were synthesized via Suzuki coupling reaction. The
electrochromic and photovoltaic studies of these polymers were performed. The
thermal characterizations of these polymers were conducted using TGA (Thermal
Gravimetric Analysis) and DSC (Differential Scanning Calorimetry) techniques.
The redox behaviors of the polymers were investigated by CV (cyclic voltammetry)
and optical properties were determined by UV-Vis spectrophotometer. In the device

vi
fabrication, all components were integrated into ITO coated glass substrate in a
moisture free glove box container. In this manner, power conversion efficiencies
(PCE) of the polymer:PC71BM active layers were measured under standard AM 1.5
Global illumination (100mW/cm2). The highest PCE value was found as 2.57 % for
PBTBTSif in the illumination of the photovoltaic studies.
Keywords: Benzotriazole, silafluorene, conjugated polymers, selenophene, organic
solar cell, electrochemistry

vii
ÖZ
BENZOTRİAZOL VE DİBENZOSİLOL TABANLI ALTERNATİF
KOPOLİMERLERİN SENTEZİ VE OPTOELEKTRONİK
UYGULAMALARI
Erlik, Ozan
Yüksek Lisans, Kimya Bölümü
Tez Yöneticisi: Doç. Dr. Ali Çırpan
Ekim 2014, 109 sayfa
Dibenzosilol, diğer bir deyişle, silafloren tabanlı polimerler optoelektronik
uygulamalardan elektrokromik (EC) cihazlarda, organik ışık yayan diyotlarda
(OLEDs), organik alan etkili transistörlerde (OFETs) ve daha çok organik
fotovoltaiklerde (OPV) son yıllarda artan bir ilgiyle, D-A yaklaşımında donör
olarak kullanılıyorlar. Ayrıca, konjüge polimelerin (CP) elektronik ve optik
özelliklerini ayarlamak adına, tiyofen ve selenofen gibi kalkojenofenler donör ve
akseptör üniteleri arasında bir enerji köprüsü olarak kullanılmaktadırlar. Bu
çalışmada, çeşitli alkil zincirleri ile fonksyonlandırılmış benzotriazol üniteleri
akseptör ünitesi olarak kullanıldı. Donör karaktere sahip tiyofen ve selenofen
grupları π-köprüsü molekülleri olarak ayrı ayrı kullanıldılar. Bir silafloren türevi
polimer omurgasında donör molekül olarak kullanıldı. Bu hususta dört farklı
konjüge polimer Suzuki kenetleme reaksiyonu kullanılarak sentezlendi.
Polimerlerin elektrokromik ve fotovoltaik çalışmaları yapıldı. Sentezlenen
polimerlerin termal davranışları TGA (Termogravimetric Analiz) ve DSC
(Diferansiyel Taramalı Kalorimetre) teknikleri kullanılarak gerçekleştirildi.
Polimerlerin redoks davranışları dönüşümlü voltametri (CV) cihazı kullanılarak
yapılırken optic özellikleri UV-Vis spektrofotometri yöntemiyle belirlendi.

viii
Fotovoltaik cihaz yapımında kullanılan bütün malzemeler ITO kaplı cam yüzeye
nemsiz ortam sağlayan eldivenli kabin içerisinde entegre edildi. Bu hususta
birbirine harmanlanmış olan polimer PC71BM karışımının güç çevirim verimleri
(PCE) bir standart olarak AM 1,5 G aydınlatma ile hesaplandı (100mW/cm2).
Yapılan fotovoltaik çalışmalar ışığında en yüksek verim 2.57 % olarak PBTBTSif
polimeri adına elde edildi
Anahtar Kelimeler: Benzotriazol, silafloren, konjüge polimerler, selenofen,
organik güneş pili, elektrokimya

ix
To my precious family

x
ACKNOWLEDGEMENTS
I am grateful to my supervisor Assoc. Prof. Dr. Ali Çırpan for his guidance, support,
patience and endless care. I would like to thank Prof. Dr. Levent Toppare for his
guidance and support.
I would like to thank TUBİTAK (113Z269) (Turkish Scientific and Technical
Research Council) for the financial support.
I owe special thanks to Naime Akbaşoğlu Ünlü for her endless helps in every
respect and also I want to thank Halil İbrahim Ünlü for his friendship.
Words are intimately meaningless to express my feelings, pleasure and gratefulness
to their friendship, Seza Göker, Özde Ceren Hızal and Öykü Akçay. I owe them for
their support.
I would like thank Şerife Özdemir Hacıoğlu and Seda Çömez for their help in the
electrochemical characterizations. I would like thank Gönül Hızalan for her help in
the photovoltaic applications.
Many thanks to my childhood friends, Ömür Görgülü, Aliekber Yapar, Ethem
Yapar, Turgay Topdal, Akın Bodrumlu, Onur Özden and Onurcan Ayhan for their
priceless friendship.
Thanks go to all Cirpan and Toppare Research Group members for their
cooperation.
Special thanks to Hande Ünay, Emre Ataoğlu, Ahmet Özgür Saf, Şevki Can Cevher
and Cansel Temiz for their friendship.
Endless thanks Nilay Aytaş for her patience, understanding, help and love.
Finally, for their patience, support and favor, I would like thank my family.

xi
TABLE OF CONTENTS
ABSTRACT................................................................................................................v
ÖZ ............................................................................................................................. vii
TABLE OF CONTENTS .......................................................................................... xi
LIST OF TABLES .................................................................................................... xv
LIST OF FIGURES ................................................................................................. xvi
LIST OF SCHEMES ................................................................................................ xx
LIST OF ABBREVATIONS ................................................................................... xxi
CHAPTERS ................................................................................................................ 1
MOTIVATION ........................................................................................................... 1
INTRODUCTION ...................................................................................................... 3
1.1. Introduction to Optoelectronic Systems .............................................................. 3
1.1.1. Electrochromism and Related Applications ..................................................... 3
1.1.2. Light Emitting Diodes ...................................................................................... 5
1.1.3. Field Effect Transistors .................................................................................... 8
1.1.4. Photovoltaic Devices ........................................................................................ 9
1.1.4.1. Inorganic Solar Cells ................................................................................... 10
1.1.4.2. Organic Solar Cells ...................................................................................... 10
1.1.4.3. Hybrid Solar Cells ....................................................................................... 11
1.2. Organic Solar Cells ............................................................................................ 12
1.2.1. Organic Semiconducting Materials ................................................................ 12
1.2.2. Band Theory ................................................................................................... 13
1.2.2.1. Band Gap Engineering ................................................................................. 14
1.2.2.1.1. Bond Length Alternation .......................................................................... 15
1.2.2.1.2. Aromaticity ............................................................................................... 16
1.2.2.1.3. Planarity .................................................................................................... 16
1.2.2.1.4. Substituent Effects .................................................................................... 17
1.2.2.1.5. Intermolecular Influence ........................................................................... 17
1.2.3. Donor Acceptor Approach .............................................................................. 17
xii
1.2.4. Doping Mechanism .........................................................................................18
1.2.5. Working Principles of an OPV .......................................................................21
1.2.5.2. Exciton Diffusion and Generation of Free Charge Carriers .........................21
1.2.5.3. Charge Mobility and Collection at Electrodes .............................................22
1.2.6. Device Architectures .......................................................................................23
1.2.6.1. Single Layer OPV ........................................................................................23
1.2.6.2. Bilayer OPV .................................................................................................24
1.2.6.3. Bulk Heterojunction (BHJ) OPV .................................................................25
1.2.6.4. Inverted Bulk Heterojunction OPV ..............................................................26
1.2.7. Characterization of an OPV ............................................................................27
1.2.8. Fundamental Parameter Affecting the OPV Efficiency ..................................28
1.2.8.1. Short Circuit Current Density (Jsc) ..............................................................28
1.2.8.2. Open Circuit Voltage ...................................................................................29
1.2.8.3. Fill Factor .....................................................................................................29
1.2.9. Palladium Mediated Cross Coupling Reactions ..............................................30
1.2.10.1. Benzotriazole Moiety .................................................................................32
1.2.10.2. π-Bridge Groups: Thiophene and Selenophene .........................................32
1.2.10.3. Dibenzosilole based Polymers ...................................................................33
1.2.11. Aim of the Study ...........................................................................................34
EXPERIMENTAL ....................................................................................................37
2.1. An Overview to Experimental Procedures and Techniques ..............................37
2.2. Syntheses of the Monomers ...............................................................................38
2.2.1. Synthesis of 2-dodecylbenzotriazole (1) .........................................................39
2.2.2. Synthesis of 4,7-dibromo-2-dodecyl-2H-benzo[d][1,2,3]triazole (2) .............39
2.2.3. Synthesis of 2-(2-octyldodecyl)-2H-benzo[d][1,2,3]triazole (3) ....................40
2.2.4. Synthesis of 4,7-dibromo-2-(2-octyldodecyl)-2H-benzo[d][1,2,3]triazole (4)
...................................................................................................................................41
2.2.5. Synthesis of tributyl(thiophen-2-yl)stannane (5) ............................................42
2.2.6. Synthesis of tributyl(selenophen-2-yl)stannane (6) ........................................43
2.2.7. Synthesis of 2-dodecyl-4,7-di(thiophen-2-yl)-2H-benzo[d][1,2,3]triazole (7)
...................................................................................................................................44

xiii
2.2.8. Synthesis of 2-dodecyl-4,7-di(selenophen-2-yl)-2H-benzo[d][1,2,3]triazole
(8) .............................................................................................................................. 45
2.2.9. Synthesis of 2-(2-octyldodecyl)-4,7-di(thiophen-2-yl)-2H-
benzo[d][1,2,3]triazole (9) ........................................................................................ 46
2.2.10. Synthesis of 2-(2-octyldodecyl)-4,7-di(selenophen-2-yl)-2H-
benzo[d][1,2,3]triazole (10) ...................................................................................... 47
2.2.11. Synthesis of 4,7-bis(5-bromothiophen-2-yl)-2-dodecyl-2H-
benzo[d][1,2,3]triazole (11) ...................................................................................... 48
2.2.12. Synthesis of 4,7-bis(5-bromoselenophen-2-yl)-2-dodecyl-2H-
benzo[d][1,2,3]triazole (12) ...................................................................................... 49
2.2.13. Synthesis of 4,7-bis(5-bromothiophen-2-yl)-2-(2-octyldodecyl)-2H-
benzo[d][1,2,3]triazole (13) ...................................................................................... 50
2.2.14. Synthesis of 4,7-bis(5-bromoselenophen-2-yl)-2-(2-octyldodecyl)-2H-
benzo[d][1,2,3]triazole (14) ...................................................................................... 51
2.3. Synthesis of Polymers ....................................................................................... 52
2.3.1. Synthesis of PTBTSif ..................................................................................... 52
2.3.2. Synthesis of PSBSSif ...................................................................................... 53
2.3.3. Synthesis of PBTBTSif .................................................................................. 53
2.3.4. Synthesis of PBSBSSif ................................................................................... 54
2.4. Electrochemical Studies .................................................................................... 54
2.5. Spectroelectrochemical Studies ......................................................................... 55
2.6. Kinetic Studies ................................................................................................... 55
2.7. Thermal Analyses .............................................................................................. 56
2.8. Solar Cell Applications ...................................................................................... 56
RESULTS AND DISCUSSION ............................................................................... 59
3.1. Electrochemical Studies .................................................................................... 59
3.2. Spectroelectrochemical Studies ......................................................................... 64
3.3. Kinetic Studies ................................................................................................... 69
3.4. Thermal Analyses .............................................................................................. 72
3.5. Photovoltaic Studies .......................................................................................... 73
CONCLUSION ........................................................................................................ 81
REFERENCES ......................................................................................................... 83

xiv
APPENDIX A ...........................................................................................................89
NMR DATA..............................................................................................................89
THERMAL ANALYSIS RESULTS ......................................................................107

xv
LIST OF TABLES
TABLES
Table 1. Summary of the electrochemical studies .................................................... 62
Table 2. Summary of the spectroelectochemical studies ......................................... 69
Table 3. Summary of the Chronoamperometric Studies .......................................... 72
Table 4. Summary of the photovoltaic studies ......................................................... 79

xvi
LIST OF FIGURES
FIGURES
Figure 1. Energy consumption trend from 1980 to 2030 ............................................2
Figure 2. Literature examples of some organic electrochromic semiconductors ........4
Figure 3. OLED structures ..........................................................................................6
Figure 4. OLED structures ..........................................................................................6
Figure 5. Working principle of an OLED ...................................................................8
Figure 6. OFET device architecture ............................................................................9
Figure 7. Band gap energy models for materials: a) metals; b) semiconductors; c)
insulators ...................................................................................................................14
Figure 8. Band gap tunning model ............................................................................15
Figure 9. Band gap tunning model ............................................................................16
Figure 10. Hybridization of energy levels.................................................................18
Figure 11. Band model for trans-polyacetylene bearing to degenerate ground state 20
Figure 12. Proposed structures of polypyrrole ..........................................................21
Figure 13. Förster and Dexter energy transfers .........................................................22
Figure 14. Working principle of an OPV 1) Excitation of donor upon absorption of
light leading to exciton formation. 2) Exciton diffusion. 3) Charge separation 4)
Migration of charges. 5) Collection of holes and electrons at anode and cathode
electrons respectively ................................................................................................23
Figure 15. p-type Schottky device ............................................................................24
Figure 16. Bilayer OPV structure ..............................................................................25
Figure 17. BHJ solar cell device structure. (The ordered structure is theoretical
demanded arrangement of donor and acceptor molecules) .......................................26
Figure 18. Air Mass 1.5 Global standardization .......................................................28
Figure 19. Current-Voltage characteristics ...............................................................30
Figure 20. An example of dibenzosilole based polymer ...........................................34
Figure 21. Synthesized Polymers ..............................................................................35
Figure 22. Synthesis of 2-dodecylbenzotriazole .......................................................39

xvii
Figure 23. Synthesis of 4,7-dibromo-2-dodecyl-2H-benzo[d][1,2,3]triazole .......... 39
Figure 24. Synthesis of 2-(2-octyldodecyl)-2H-benzo[d][1,2,3]triazole .................. 40
Figure 25. Synthesis of 4,7-dibromo-2-(2-octyldodecyl)-2H-benzo[d][1,2,3]triazole
.................................................................................................................................. 41
Figure 26. Synthesis of tributyl(thiophen-2-yl)stannane .......................................... 42
Figure 27. Synthesis of tributyl(selenophen-2-yl)stannane ...................................... 43
Figure 28. Synthesis of 2-dodecyl-4,7-di(thiophen-2-yl)-2H-benzo[d][1,2,3]triazole
.................................................................................................................................. 44
Figure 29. Synthesis of 2-dodecyl-4,7-di(selenophen-2-yl)-2H-
benzo[d][1,2,3]triazole ............................................................................................. 45
Figure 30. Synthesis of 2-(2-octyldodecyl)-4,7-di(thiophen-2-yl)-2H-
benzo[d][1,2,3]triazole ............................................................................................. 46
Figure 31. Synthesis of 2-(2-octyldodecyl)-4,7-di(selenophen-2-yl)-2H-
benzo[d][1,2,3]triazole ............................................................................................. 47
Figure 32. Synthesis of 4,7-bis(5-bromothiophen-2-yl)-2-dodecyl-2H-
benzo[d][1,2,3]triazole ............................................................................................. 48
Figure 33. Synthesis of 4,7-bis(5-bromoselenophen-2-yl)-2-dodecyl-2H-
benzo[d][1,2,3]triazole ............................................................................................. 49
Figure 34. Synthesis of 4,7-bis(5-bromothiophen-2-yl)-2-(2-octyldodecyl)-2H-
benzo[d][1,2,3]triazole ............................................................................................. 50
Figure 35. Synthesis of 4,7-bis(5-bromoselenophen-2-yl)-2-(2-octyldodecyl)-2H-
benzo[d][1,2,3]triazole ............................................................................................. 51
Figure 36. Cyclic yoltammograms of the polymers ................................................. 60
Figure 37. Scan rate study of PTBTSif ..................................................................... 63
Figure 38. Scan rate study of PSBSSif ..................................................................... 63
Figure 39. Scan rate study of PBTBTSif .................................................................. 64
Figure 40. Scan rate study of PBSBSSif .................................................................. 64
Figure 41. Electronic absorption spectra of the PTBTSif in UV-Vis-NIR regions .. 67
Figure 42. Electronic absorption spectra of the PSBSSif in UV-Vis-NIR regions .. 67
Figure 43. Electronic absorption spectra of the PBTBTSif in UV-Vis-NIR regions 68
Figure 44. Electronic absorption spectra of the PBSBSSif in UV-Vis-NIR regions 68
Figure 45. Change in the percent transmittance for PTBTSif .................................. 70

xviii
Figure 46. Change in the percent transmittance for PSBSSif ...................................70
Figure 47. Change in the percent transmittance for PBTBTSif ................................71
Figure 48. Change in the percent transmittance for PBSBSSif ................................71
Figure 49. Normalized film absorbance spectra for polymer and PCBM mixtures ..73
Figure 50. Relative thin film absorbance spectra of polymers ..................................74
Figure 51. Current-Voltage characteristics of the PTBTSif ......................................75
Figure 52. Current-Voltage characteristics of the PSBSSif ......................................76
Figure 53. Current-Voltage characteristics of the PBTBTSif ...................................76
Figure 54. Current-Voltage characteristics of the PBSBSSif ...................................77
Figure 55. IPCE values of photovoltaic devices .......................................................78
Figure 56. Logarithmic J-V curve for the polymers .................................................79
Figure 57. 1H NMR result of 4,7-dibromo-2-dodecyl-2H-benzo[d][1,2,3]triazole (2)
...................................................................................................................................89
Figure 58. 1HNMRresult of 4,7-dibromo-2-(2-octyldodecyl)-2H-
benzo[d][1,2,3]triazole (4) ........................................................................................90
Figure 59. 1H NMR result of tributyl(thiophen-2-yl)stannane (5) ...........................91
Figure 60. 1H NMR of tributyl(selenophen-2-yl)stannane (6) ..................................92
Figure 61. 1H NMR result of 2-dodecyl-4,7-di(thiophen-2-yl)-2H-
benzo[d][1,2,3]triazole (7) ........................................................................................93
Figure 62. 1H NMR result of 2-dodecyl-4,7-di(selenophen-2-yl)-2H-
benzo[d][1,2,3]triazole (8) ........................................................................................94
Figure 63. 1H NMR result of Synthesis of 2-(2-octyldodecyl)-4,7-di(thiophen-2-yl)-
2H-benzo[d][1,2,3]triazole (9) ..................................................................................95
Figure 64. 1H NMR result of the 2-(2-octyldodecyl)-4,7-di(selenophen-2-yl)-2H-
benzo[d][1,2,3]triazole (10) ......................................................................................96
Figure 65. 1H NMR result of 4,7-bis(5-bromothiophen-2-yl)-2-dodecyl-2H-
benzo[d][1,2,3]triazole (11) ......................................................................................97
Figure 66. 13
C NMR result of 4,7-bis(5-bromothiophen-2-yl)-2-dodecyl-2H-
benzo[d][1,2,3]triazole (11) ......................................................................................98
Figure 67. 1H NMR Result of 4,7-bis(5-bromoselenophen-2-yl)-2-dodecyl-2H-
benzo[d][1,2,3]triazole (12) ......................................................................................99
xix
Figure 68. 1H NMR result of 4,7-bis(5-bromothiophen-2-yl)-2-(2-octyldodecyl)-2H-
benzo[d][1,2,3]triazole (13) .................................................................................... 100
Figure 69. 13
C NMR result of 4,7-bis(5-bromothiophen-2-yl)-2-(2-octyldodecyl)-
2H-benzo[d][1,2,3]triazole (13) ............................................................................. 101
Figure 70. 1H NMR result of 4,7-bis(5-bromoselenophen-2-yl)-2-(2-octyldodecyl)-
2H-benzo[d][1,2,3]triazole (14) ............................................................................. 102
Figure 71. 1H NMR result of the PTBTSif ............................................................. 103
Figure 72. 1H NMR result of PSBSSif ................................................................... 104
Figure 73. 1H NMR result of PBTBTSif ................................................................ 105
Figure 74. 1H NMR result of PBSBSSif ................................................................. 106
Figure 75. TGA result of PTBTSif ......................................................................... 107
Figure 76. DSC result of PTBTSif ......................................................................... 108
Figure 77. TGA result of PSBSSif ......................................................................... 108
Figure 78. TGA result of PBTBTSif ...................................................................... 109
Figure 79. DSC result of PBTBTSif ....................................................................... 109

xx
LIST OF SCHEMES
SCHEMES
Scheme 1.General reaction mechanism of a cross coupling reaction ...................... 31
Scheme 2. Synthetic route of monomers .................................................................. 38
Scheme 3. General synthesis mechanism of polymers ............................................ 52

xxi
LIST OF ABBREVATIONS
EC Electrochromic
CE Coloration efficiency
LED Light emitting diode
OLED Organic light emitting diode
HOMO Highest occupied molecular orbital
LUMO Lowest unoccupied molecular orbital
OFET Organic field effect transistor
PCE Power conversion efficiency
CB Conduction band
VB Valence band
DA Donor-Acceptor
OPV Organic Photovoltaic
PET Polyethylene terephthalate
ITO Indium tin oxide
PSS Polystyrenesulfonate
PEDOT Polyethylene dioxythiophene
PCBM [6,6]-Phenyl C 71 butyric acid methyl ester
BHJ Bulk heterojunction
HIL Hole injection layer
ETL Electron transpot layer
ɳe Power conversion efficiency
Jsc Short circuit current density

xxii
Voc Open circuit voltage
FF Fill factor
Pmax Maximum power
Pin Power of the incident light
Rsh Shunt resistor
R s Series resistor
AM 1.5G Air mass 1.5 global
CV Cyclic voltammetry
THF Tetrahydrofuran
TBAPF6 Tetrabutylammonium hexafluorophosphate
ACN Acetonitrile
NHE Normal hydrogen electrode
Egop
Optic band gap
Egel Electronic band gap
TGA Thermal gravimetric analysis
DSC Differential scanning calorimetry
UV Ultraviolet
Vis Visible
NIR Near infrared
ICT Intermolecular charge transfer
IPCE Internal power conversion efficiency
EQE External quantum efficiency

1
CHAPTER 1
MOTIVATION
The world population has been growing day by day. It seems that these new
incomers have been adapted to this capitalist regime and hence sense of consumer
society is fixed gradually in this manner. As a result of this, to meet the world
energy need has become a controversial problem since natural sources have been
consumed harshly by the humans. Moreover, energy demand shows parallelism in
terms of level of development of the societies. Hereafter, International Energy
Agency (IEA) predicts that developing economies will double their producing
potential by 2020 to deal with their energy call. Furthermore, according to
International Energy Outlook, increase in the energy consumption is foreseen as
23% in 2030 (Figure 1). In this manner, human beings have to find new energy
sources other than the fossil fuels, nuclear energy and other insalubrious energy
resources. 1,2
To address the renewable energy resources, although the hydroelectric
power is the most widely used one, it is a limited source in terms of provision.
Likely, wind power seems to be not meeting energy demand on the base of some
estimates. For example, utilizable wind energy is 2-4 terawatt-years (TWyr) in total
while it is foreseen that global energy consumption will increase from 13TWyr to
30 TWyr by 2050. On the other hand, solar energy serves a huge amount of power
as 125,000 TW for the each impact to the earth surface. Thus, the rest of humanity is
harvesting this solar power. One of the possible ways to utilize the solar energy is
photovoltaic effect which converts the energy coming from sunlight into electrical
power. [3]

2
Figure 1. Energy consumption trend from 1980 to 2030

3
INTRODUCTION
1.1. Introduction to Optoelectronic Systems
1.1.1. Electrochromism and Related Applications
Electrochromism is the reversible alternation of the optical properties in the
presence of an external electric field. In other words, if the color of materials shifts
between two or more different colors via an electrochemical way, they are called as
electrochromic (EC). Change in the color can occur not only between a transparent
state and a colored state but also can happen between two colored states. When
more than two redox states are available, EC devices show various colors and called
as polyelectrochromics.4,5
EC materials can be classified with respect to their optical
properties. The first type of these materials goes back and forth between colored and
transparent state. These materials are operable in absorption/transmission type
appliances including smart windows and optical shutters. Examples are metal oxide
films, violegens and organic polymers including poly(3,4-ethylenedioxy thiophene)
(PEDOT). As to the second type of electrochromics including display technology,
the goal would be attain two different colors without a bleached state. The most
known example of this type of materials is polythiophene. The color of
polythiophene is red in neutral state and blue in its oxidized state. The third and
having most growing interest materials are conjugated macromolecules showing
more than two different colors relying on their optical bands in a redox manner.6
Furthermore, to obtain wide range color spectrum and produce flexible devices,
organic ECs are designed and used at an increasing attention. Reynolds et. al. have
reported several organic polymeric EC materials switching between different colors
with a certain potential range showed in Figure 2.7

4
Figure 2. Literature examples of some organic electrochromic semiconductors
Several parameters affecting utility of an electrochromic device are available. These
parameters are optical contrast, stability, switching time, coloration efficiency and
optical memory.6,8,9,10
Firstly, optical contrast is an answer for the percent transmittance of an
electrochromic device at various wavelengths on electromagnetic spectrum. Thus,
the question is how much of the incoming light with a specific wave length is
absorbed or reflected. In addition to this, by looking the cycles showing
transmittance change, the optical stability of the materials at different potentials and
bands on the spectrum can be observed.6
Secondly, stability is another factor affecting the electrochromic device efficiency.
It is related with the degradation of the active matrix. This deterioration can be
resulted from several reasons. One of them is an irreversible redox reaction. The
other reason is the side products caused from electron loss or gain processes upon
oxidation and reduction of the materials or contaminants. Another reason is caused
by heat dissipation.6
Thirdly, switching time actually is known as the switching speed; the time for
observing a change in the color of the materials during the oxidation and reduction
processes. Switching time is affected by several factors including surface

5
characteristics of thin films, free charge conductivity of electrolyte and permission
of ions to the surface of the thin films.
In the fourth place, coloration efficiency (CE) is an important parameter showing
how well an electrochromic device works. It gives information on the power
necessity. The transported charge per unit area (Qd) and change in optical density
(δOD) have to be known for the calculation of the CE value. Both CE and δOD are
wavelength dependent functions.
δOD(λ) = log[To(λ)/Tc(λ)]
η(λ) = δOD(λ)/Qd
η(cm2/C) is the efficiency of the CE and To and Tc are the transmittance values at
the bleached and colored states respectively.6,8,9
Lastly, optical memory known as open-circuit stability is identified as the time to
stay in the same absorption state with a certain color of the material with no external
voltage. While solid state materials show high optical memory, materials in solution
medium bleaches rapidly.10
1.1.2. Light Emitting Diodes
Lightening and display technology need too much power of electricity. In the matter
of cope with this energy demand LEDs serve for a low cost technology. By
comparison with the incandescent bulbs doing black body radiation and fluorescent
tubes which release toxic gases, LEDs are eco-friendly light sources. Indeed, this
technology has longer lifetime than other mentioned lighting sources.11
Diode is a circuit component which conducts the electrical current only in one
direction. LEDs are semiconducting devices operating on the basis of p-n junction
principle. The first known LED was made by H. J. Round in 1907 but first

6
commercial one was produced by Holonyak in 1962. This LED was based on the
Ga/As/P (Galium, Arsenic and Phosphorous) inorganic semiconductors. Initially
produced materials had been emitting only red light with long wavelength. By the
improved technology, red and blue emitting diodes can be made also. Thus, by
acquiring primary colors (RGB), white light emitting diodes can be produced and
used for solid state lighting as well as obtaining wide range color spectrum.12
Then,
to overcome high cost production, organic counterparts have designed and produced
as alternative to inorganic ones. Moreover by the invention of OLEDs (Organic
Light Emitting Diodes) and PLEDS (Polymer Light Emitting Diodes) it is possible
to manufacture flexible diodes. In OLEDs several device architectures are available
as shown in Figure 3. An OLED can be designed in different ways as regards to
differences in efficiency. The most efficient OLED structure is multilayer one due
to the elimination of attenuation in exciton recombination and interruption in charge
transport.13,14
A. Single Layer Device B. Two-Layer Device
C. Three-Layer Device D. Multilayer Device
Figure 4. OLED structures Figure 3. OLED structures

7
The working principle of an OLED is based on electroluminescence.
Electroluminescence is the result of radiative recombination of electrons and holes
in a semiconductor when subjected to an external electrical field. The emission of
light can occur via fluorescence and/or phosphorescence. Moreover, the probability
of existence of excitons on a triplet state is 75 % whereas probability on a singlet
state is 25 %. Therefore, phosphorescence is desired for obtaining high quantum
yields. These two processes illuminated in the ‘Jablonski Diagram’ was
demonstrated in Figure 4.15,16
Figure 4. Representation of Fluorescent and Phosphorescent Processes. Internal
quantum yield (n) is very low for fluorescence with respect to phosphorescence
When an OLED is exposed to an electrical field, current circulate along the circuit.
By the stimulation of electrodes on each side of the device, electrons from cathode
with a low work function and holes from anode flow into active layer of the device.
These two opposite charges re-combine at the interface of the emissive layer to form
excitons and the light is emitted. The wavelength of emitted light depends on the
band gap related with energetic position of the HOMO and LUMO energy levels of
the semiconducting organic materials on the active layer. If more bright light is

8
demanded, the power of the current would be increased. The working principle of
an OLED was illustrated in Figure 5.16
Figure 5. Working principle of an OLED
1.1.3. Field Effect Transistors
The originator and first patentee of field effect transistors is Lilienfeld.17
Inorganic
and organic transistors have manufactured until today. Inorganic ones are based on
silicon and germanium whereas in organic field effect transistors semiconducting
organic macromolecules are used. Today by the growing technology and improving
knowledge about conjugated molecules, OFETs have become to run as amorphous
silicon counterparts.17
The field effect transistors give a detailed idea about principles of the charge
carrying properties of semiconducting materials. Although, field effect transistors
can be classified into two main groups namely n-channel and p-channel in terms of
their operating principle, ambipolar transistors are in demand recently. This means
that both of the electrons and holes can be conducted.18

9
A field effect transistor includes several parts which are source, drain, dielectric
material, semiconductor, gate and substrate. Gate is stimulated by a voltage and
then by the effect of this voltage a p-channel arises between the insulator material
and organic layer. In return, by applying a negative voltage between drain and
source, positively charged particles go up to drain from source. The flowing rate of
these holes is equipotent to current rate in the opposite direction. This current
flowing continues until closing of the p-channel. By the saturation of the current on
the drain hole mobility can be determined for a p-type OFET. The general
representation of device architecture of an OFET was demonstrated in Figure 6.18,19
Figure 6. OFET device architecture
1.1.4. Photovoltaic Devices
Photovoltaics are devices converting the solar energy which is an inexhaustible
energy source which can be converted to direct current electricity. The French
scientist Alexandre Edmund Becquerel is the pioneer of the photovoltaics. In 1839,
he found that an electrical current arises upon lightening an electrochemical cell.
However, by the year of 1883 it has been realized that the solar energy can be
converted to utilizable electrical energy.20,21

10
1.1.4.1. Inorganic Solar Cells
Silicon based solar cells which meet 90% of the worldwide solar energy production
in today’s world had been introduced in 1954 with 6% efficiency of a single crystal
solar cell. Today, the highest efficiency with this type of solar cells has been
reported as 27.6% by the single crystal materials and 20.4% by the polycrystalline
devices. The key parameter in terms of efficiency is band gap. This value is 1.1 eV
for silicon and this is the reason for preferring silicon based solar cells since the
ideal bad gap should be around 1.3 eV on the behalf of obtaining utmost quantum
efficiency for single crystals. As an alternative to this single crystal silicon solar
cells, inorganic thin film photovoltaic devices which are made of Cu(InGa)Se2
(CIGS) and CdTe type compounds are present to diminish the cost of the
manufacturing. However, at the same time, via decreasing the thickness of the
semiconducting layer, efficiency would decrease unfortunately. Above all else, by
the development of technology, new multi-junction materials are designed and
produced. Solar cell efficiency has reached to 43.5% by using concentrated multi-
junction solar cells (GaInP/GaAs/GaInNAs). Because of the having high internal
quantum efficiency, inorganic photovoltaic devices have high current density and
high mobility of free charge carriers, these devices show good power conversion
efficiency (PCE). However, these materials in the crystal form cannot be integrated
onto flexible substrates. In addition to this, another problem arises from high
production costs since it requires high temperatures for the integration of
uncommon materials. Scientists seek for low-cost and high-efficiency hence, the
researchers across the globe work on organic and hybrid solar cells recently.22, 23, 24
1.1.4.2. Organic Solar Cells
To cope with high prices for the production of optoelectronic devices, organic
semiconductors including both macromolecules consisting of oligomers or polymers

11
and small molecules have been used in an increasing demand. These conjugated
molecules have conductivity features owing to π-electron delocalization on their
backbone. As a result of this π-electron delocalization electrons can be mobile
through intermolecular or intramolecular bonds. The energy-gap of the organic
conjugated molecules is within the 1.4-3.0 eV. The solar cell efficiency for organic
semiconductors has been increased gradually. In this manner the cell efficiency
which was below 10-5
% in 1970s, is up to 10-12% recently.25
In fact, by using
tandem type organic solar cells this value can be enhanced to 15%.26
Organic solar
cells have been manufactured using solution processable conjugated polymers and
thermally deposited small molecules. Solution processable small molecules have
been widely applied for organic solar cells devices in recent years because they
show strong absorption properties, and they can be easily purified and deposited
onto flexible substrates at low cost.25,26,27
1.1.4.3. Hybrid Solar Cells
Since the inorganic solar cells are not cost effective and organic counterparts are
not efficient as them, hybrid solar cells including both organic and inorganic
semiconductors are key solutions for these problems. By the integration of the
organic molecules on the inorganic surfaces, the flexible and solid devices can be
produced in line with the requirements. In the heterojunction (HJ) device
architecture, organic molecules are used for absorbers and inorganic ones are
utilized as the acceptors of the active layer. In this system, inorganic materials are
responsible for the electron transport process and organic layer provides the hole
mobility. While organic layer brings in flexibility, low-cost production and light
weight, inorganic part enables long term stability and enhanced electron mobility.
Acceptor materials are fullerene derivatives in organic photovoltaic devices whereas
in hybrid cells electron acceptors are nanocrystals. Acceptor materials can present
as quantum dots as colloidal forms in organic layers and also they could be
nanoparticles as mixed with polymers.28,29,30

12
1.2. Organic Solar Cells
1.2.1. Organic Semiconducting Materials
Organic semiconducting materials can be either small molecules or macromolecules
including oligomers and polymers. The difference between the large molecules and
the small ones results from the conjugation length and manufacturing process of
them. Polymers are preferred instead of the small molecules because they are
solution proccessable. Carbon is a tetravalent atom and its saturated molecules are
bearing sp3 hybridization. However, sp
2pz hybridization is valid for conjugated
polymers. In this system, one s and two p orbitals participate in the hybridization
and half-filled pz orbitals are responsible for the formation of the π-bonds. An
electron delocalization is present on the polymer backbone due to the alternating
arrangement of double and single bonds. As a result of this π- electron
delocalization, electron can move one bond to the other bond which enables these
polymers to gain conductivity.31,32
The history of the conductive polymers dates back to 1960s. In those years, in two
different continents, scientists had been studying on the conductive polymers.
MacDiarmid and Heeger from USA were investigating on conductivity of
polythiazyls (SN)n as metallic inorganic polymers. Electrical conductivity of this
type of polymers diminishes with increasing temperature. On the other hand, by
cooling the polymer down to approximately -263 oC, polymeric sulfur nitride
becomes a superconductor.33,34
At the same time with investigations on the
inorganic polymer conductivities, in the far east Japanese chemist Hideki Shirakawa
was found out incidentally an important mechanism about synthesizing
polyacetylene thin films. He mistakenly used too much Ziegler-Natta catalyst for
the polymerization of acetylene. Thus, he obtained polymeric thin films instead of a
polymeric powder. Because of the insoluble character of this polymer, only an IR
spectrum could be taken. Thus, it was clarified that the selectivity on the formation
of trans and cis forms of the polyacetylene rely on the temperature. As a result of
13
these studies, via altering the temperature polymer in demand with respect to
stereochemistry of polyacetylene could be obtained. The alternation in the
stereochemistry would lead to differences in resistivity to electric current.35
Later,
these three scientists came together and they started to work on polyacetylenes. The
polyacetylene films were exposed halogen vapors. Firstly, bromine vapor was used
for doping of the films. Then, chlorine and iodine were used respectively. The best
result as 38 Scm-1
was obtained by using iodine vapor. Thus, first organic polymer
which shows conductivity as comparable with the metallic conductivity was
synthesized. This work has ushered a new age on conductive polymers. Therefore,
these three scientists were awarded with Nobel Prize in chemistry ‘for the discovery
and development of the conducting polymers’35,36,37
1.2.2. Band Theory
The conductivity of materials is directly related with their band gap value. Band gap
of the materials is defined as the energy difference between HOMO (Highest
Occupied Molecular Orbital) level and LUMO (Lowest Unoccupied Molecular
Orbital) energy level. In other words, it is the energy gap between conduction band
(CB) and valence band (VB) of the materials.39
Materials are classified as conductors, insulators, or semiconductors according to
their electric conductivity. In a conductor, the valence band is partially filled, and
since there are numerous empty levels, the electrons are free to move under the
influence of an electric field; thus, in a metal the valence band is also the conduction
band. On the other hand, insulator materials have large energy gap between HOMO
and LUMO energy levels and in this type of materials, valence band is completely
filled and conduction band is completely empty so they do not have electrical
conductivity. In a semiconductor, the valence band and conduction band are
separated from each other by a small energy gap. Valence band is completely empty
and conduction band is completely filled in semiconducting materials. Electrons can

14
move to the conduction band from valence band by the enhancing the Fermi level.40
The band energy structures are shown in Figure 7.
a) Metals b) Semiconductors c) Insulator
Figure 7. Band gap energy models for materials: a) metals; b) semiconductors; c)
insulators
1.2.2.1. Band Gap Engineering
Electronic properties of semiconducting polymers can be altered by tuning the band
gap of the materials. This process also called band gap engineering depend on
several factors so that band gap of these delocalized systems can be explained as
sum of the five main parameters namely, bond length alternation (EBLA), aromaticity
(ERes), planarity (Eɵ), substituents (ESub), intermolecular interactions (Eint) (Figure
8).42

15
Figure 8. Band gap tunning model
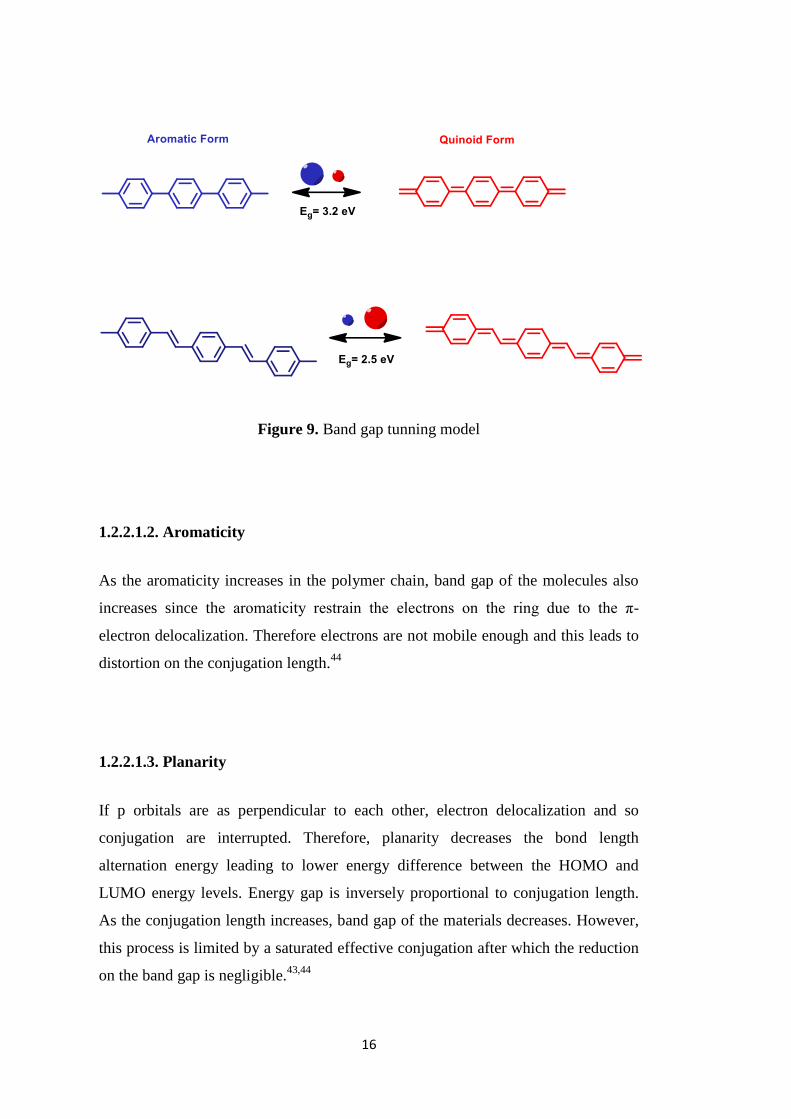
1.2.2.1.1. Bond Length Alternation
Conjugated heterocyclic polymers with non-degenerate ground states are present in
two forms having different energies. One of them is aromatic form and the other
one is quinoid form. In a molecule bearing aromatic form can be converted into
quinoid form via π-electron delocalization. Aromatic form is energetically less
stable than the quinoid form due to the increase in the stabilization energy. The
relation between these two states is stereotyped in a mathematical expression called
as bond length alternation (BLA). If a conjugated polymer is mainly subjected to
aromatic form, the energy value of the BLA increases leading to a larger band gap.
On the other hand, by increasing quinoid character on the backbone, BLA value
decreases due to the increase in the double bond nature between the two adjacent
rings. Decrease in the BLA value brings in lowering the band gap energy. For
example, in polyphenylene, benzene rings are predominantly in the aromatic
structure. However by the insertion of the double bonds between the rings quinoid
character can be increased. This relation is shown in Figure 9.43
16
Figure 9. Band gap tunning model
1.2.2.1.2. Aromaticity
As the aromaticity increases in the polymer chain, band gap of the molecules also
increases since the aromaticity restrain the electrons on the ring due to the π-
electron delocalization. Therefore electrons are not mobile enough and this leads to
distortion on the conjugation length.44
1.2.2.1.3. Planarity
If p orbitals are as perpendicular to each other, electron delocalization and so
conjugation are interrupted. Therefore, planarity decreases the bond length
alternation energy leading to lower energy difference between the HOMO and
LUMO energy levels. Energy gap is inversely proportional to conjugation length.
As the conjugation length increases, band gap of the materials decreases. However,
this process is limited by a saturated effective conjugation after which the reduction
on the band gap is negligible.43,44

17
1.2.2.1.4. Substituent Effects
Polymer substitution with different functional groups has been found to be one of
the ways to achieving suitable band gap, as the electronic structure and
correspondingly the optical property of the polymers can be adjusted. Electron
withdrawing group contributes to both an increase in electron affinity and ionization
potential. Electron donating groups reduces band gap by raising the HOMO energy
level.45,46
1.2.2.1.5. Intermolecular Influence
Molecules in the solid state reveal lower band gap than that of the materials in the
solution phase. Solid state brings about a more ordered crystalline structure leading
to an increase in the intermolecular interactions and also enhancing the π-π stacking
causing red shift on the ground state spectrum and lower the band gap.46,47
1.2.3. Donor Acceptor Approach
Donor-Acceptor (D-A) approach was offered for the first time by Hoeve and co-
workers in 1963. This modality for conjugated molecules is widely used for tuning
the HOMO and LUMO energy levels and thus the band gap of the materials. In this
approach, there are two different moieties showing distinct electronic
characteristics. While donor moiety is electron rich, the acceptor group has an
electron deficient nature.48
The main purpose of this method is lowering the band
gap that is acquired by the hybridization of the HOMO and LUMO energy levels of
the donor and acceptor molecules. Thus, new HOMO and LUMO levels arises for
the conjugated polymer showed in Figure 10.49

18
Figure 10. Hybridization of energy levels
1.2.4. Doping Mechanism
Conjugated polymers are not conductive in their ground state since electrons are not
delocalized along the polymer chains. In order to obtain electrical conductivity free
charge carriers are required. Therefore, to make the conjugated polymers gain
electrical conductivity, the strategy called as ‘doping’ is applied. Doping process
can be done by either n-doping or p-doping. If electrons are removed from the
polymer this doping process is called as p-doping since positive charges come up.
On the other hand, when electrons are injected to the polymer backbone, negatively
charged anions arise as n-doping process. After all, these negatively or positively
charged particles are neutralized by dopants. This mechanism is demonstrated in
detail in following scheme.50

19
In doping process, it is very important that the polymers sustain their original
structure with no degradation on the polymer backbone. This reversibility specify
the polymer whether it can be used for electrochromic applications or not.51
By the redox reactions, electrons are either removed or added. As a result of this,
while solitons for having degenerate ground state molecules like polyacetylene
form, for the common heterocyclic conjugated polymers with non-degenerate
ground states polarons and bipolarons arise.
Su and co-workers suggested a form on structural defects resulting from the
formation of the free radicals on the backbone during the polymerization of
polyacetylene. This proposed structure is called as soliton. Moreover, negatively
and positively charged solitons form upon reduction and oxidation processes
respectively (Figure 11).

20
Figure 11. Band model for trans-polyacetylene bearing to degenerate ground state
Unlike the polyacetylene band structures, heterocyclic compounds have non-
degenerate ground state energy. By the ionization of these polymers, radical ions
called as polarons are formed as radical anions or radical cations. However, in
theory a model with more stable forms called as bipolarons is available. This
dication and dianion structures are the main components for the electrical
conductivity. Polaron and bipolaron bands of polypyrrole (PPy) were showed as
well as neutral state in Figure 12.51,52

21
Figure 12. Proposed structures of polypyrrole
1.2.5. Working Principles of an OPV
1.2.5.1. Exciton Formation by Photogeneration Process
The efficiency of organic photovoltaic devices is directly related with the photon
absorption process of the conjugated polymers in the active layer. When the
sunlight is absorbed, electron-hole pairs called excitons are formed instead of
formation of the free charge carriers. These excitons are Frenkel excitons and
localized to the molecule, hence an extra amount of energy, termed as exciton
binding energy is needed to produce free charge carriers. The exciton binding
energy in commonly used organic materials (polymer, oligomers, small molecules)
ranges from 0.3 to 1.4 eV.53,54,55
1.2.5.2. Exciton Diffusion and Generation of Free Charge Carriers
Excitons do not dissociate to free charge carrier at ambient temperature
spontaneously due to their high binding energies and it needs an extra energy. An
acceptor molecule like fullerene is required for obtaining a junction point to bring in
electrostatic forces at the interface of donor and acceptor type polymers. Excitons
have to find an interface just before fall back to the ground state since exciton

22
diffusion length is limited to a range of 5-20 nm which restricts the thickness of the
active layer. As the thickness of the active layer increases, number of photons
harvested will also increase however there will be also an increase in the loss of
excitons due to the recombination resulted from the limited exciton diffusion
length.53,54,55
The exciton diffusion is determined in two ways as regards to singlet or triplet
states. Singlet state exciton diffuses via a mechanism called Förster resonant energy
transfer (FRET) which is a long-range energy transfer including dipole-dipole
coupling of transition states. On the other hand, Dexter energy transfer is an
electron exchange mechanism and it is allowed for only singlet-singlet and triplet-
triplet energy transfers. The latter is slower than the former process. These
mechanisms were showed in Figure 13.55,56
Figure 13. Förster and Dexter energy transfers
1.2.5.3. Charge Mobility and Collection at Electrodes
Free charges move to the opposite electrodes with different work functions to
complete the circuit. This transport mechanism is related with the ability of charge
carrier mobility. Inorganic materials have ordered crystalline structures leading to
high charge carrier mobilities in the range of 102-10
3 cm
2/Vs. On the other hand,
23
organic materials have narrower bands and amorphous non-ordered surfaces
resulting in low mobility. Moreover, formation of polarons is another factor
reducing the charge mobility due to the requiring of hopping of charges.55
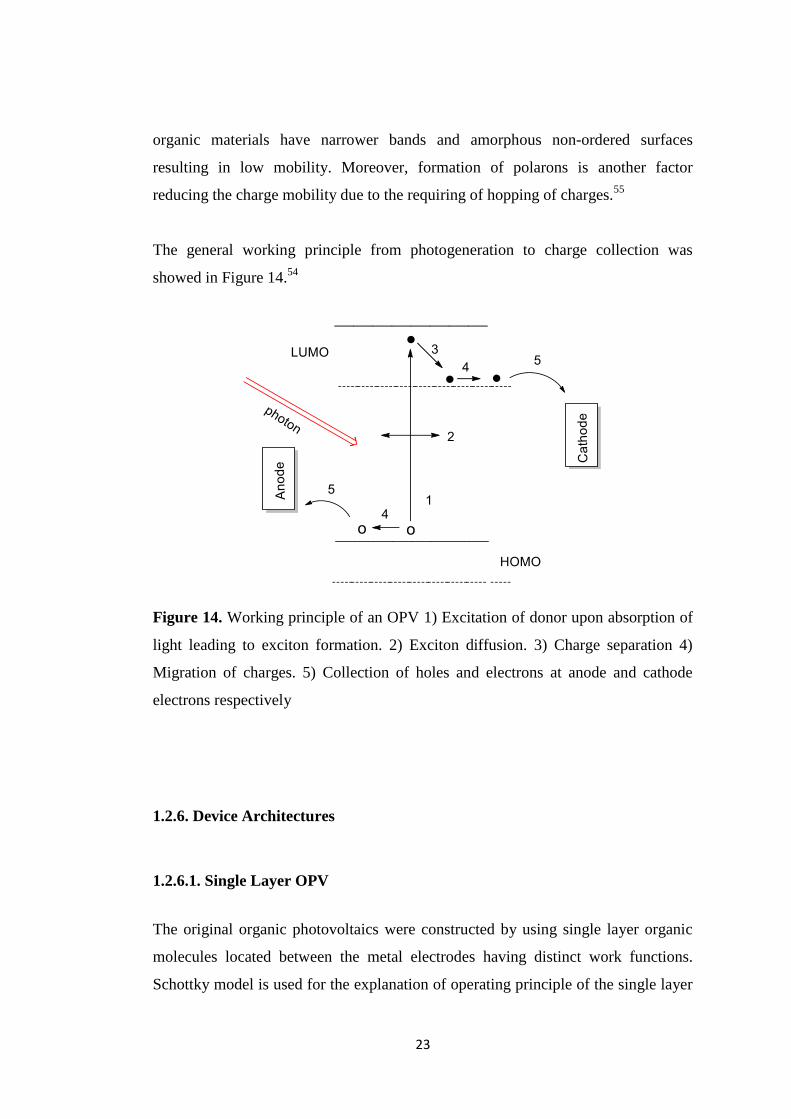
The general working principle from photogeneration to charge collection was
showed in Figure 14.54
Figure 14. Working principle of an OPV 1) Excitation of donor upon absorption of
light leading to exciton formation. 2) Exciton diffusion. 3) Charge separation 4)
Migration of charges. 5) Collection of holes and electrons at anode and cathode
electrons respectively
1.2.6. Device Architectures
1.2.6.1. Single Layer OPV
The original organic photovoltaics were constructed by using single layer organic
molecules located between the metal electrodes having distinct work functions.
Schottky model is used for the explanation of operating principle of the single layer

24
organic solar cells. In this model, a Schottky barrier arises between an organic layer
bearing an electron donor character and an electrode close to the vacuum level
energetically. As the exciton diffusion length is restricted at about 10 nm, the
charges dissociate only in these distances from the p-type semiconducting material
to the electrode contribute to the electrical conductivity. In addition to this, the only
force for dissociation of excitons into free charges arises from the electrostatic
forces between the electrodes. As this force is not sufficient for the dissociation,
efficiency of this type of solar cells is very low. A Schottky type OPV was showed
in Figure 15.57
Figure 15. p-type Schottky device
1.2.6.2. Bilayer OPV
In this type solar cell structure, separately p-type and n-type two organic layers are
superposed on each other. There is a junction point at the interface of the p- type
donor molecule and n-type acceptor molecule and excitons can be dissociated at this
donor-acceptor interface. However, because of the low exciton diffusion length,
most of the generated excitons cannot reach to the interface and recombination takes
place leading to low efficiency. Therefore, thickness of the active layer for the
effective photon absorption cannot be increased. Figure 16 demonstrates bilayer
architecture. In this structure, substrate is either a rigid glass or flexible polymer

25
such as PET. ITO is used for the transparent anode electrode. PEDOT:PSS is hole
injection layer and it is used also for smoothing the ITO surface. Polymer is donor
material and PCBM is the acceptor molecule derived from Buckminsterfullerene.
Lastly, aluminum is utilized as the cathode.58
Figure 16. Bilayer OPV structure
1.2.6.3. Bulk Heterojunction (BHJ) OPV
The bulk heterojunction concept has come as a solution to problems resulting from
low exciton diffusion distances. In this system, donor polymer and acceptor PCBM
is in active layer blend and so surface of the interface between the donor and
acceptor molecules increases leading to a decrease in the recombination of excitons.
As a principle, when the light is absorbed, the electron hole pairs called exciton
forms. Excitons migrate in a small distance and find an interface. At this junction
point, electrons and holes stay together as a boundary are separated from each other.
As the free charges, electrons go to the cathode (aluminum) through the electron
injection layer (LiF) and positively charged holes are collected on anode; indium tin
oxide (ITO). Thus, the circuit is completed and current is formed. Bulk
heterojunction solar cells are classified in two structures with respect to their active
layer order (Figure 17). 58,59

26
Figure 17. BHJ solar cell device structure. (The ordered structure is theoretical
demanded arrangement of donor and acceptor molecules)
1.2.6.4. Inverted Bulk Heterojunction OPV
The original BHJ system is in the form of Anode/HIL/Polymer blend/EIL/Cathode.
Most commonly, PEDOT:PSS is used for HIL (hole injection layer), and Ca or LiF
are used for the EIL (electron injection layer). The problem with this regular
heterojunction structure results from acidic PEDOT:PSS and metals with low work
function. PEDOT:PSS degrades the surface of the anode leading to instability for
the device. In addition to this, materials like LiF can de oxidized easily due to low
work function resulting in enhancing the series resistance and so decrease the device
efficiency. To overcome of these problems, inverted bulk heterojunction solar cells
have been designed. In this type of devices, dual character of the indium tin oxide is
taken advantage where work function value is between the band gap values of
mostly used organic molecules. It means that ITO can be used not only for hole
collector but also can be used for the electron taker. In this approach, ITO can be
modified by integrating alkali metals with low work function onto the ITO surface
leading to reducing work function of ITO. On the other hand cathode is replaced by
the high work function metal oxides coated with silver or gold.60

27
1.2.7. Characterization of an OPV
The efficiency of an organic solar cell relies on the current and voltage values of the
circuit. In the cell efficiency determination, dark current value is measured as well
as quantification of the current under light. The photovoltaic power conversion
efficiency (PCE) is identified according to the given formula;
ηe is the PCE value, Voc is open circuit voltage, Isc is short circuit current, Pin is the
incident light and FF is the fill factor. The all measurements are standardized to
AM (Air Mass) 1.5 Global.58
Air Mass
During the passage of the sunlight through the atmosphere, solar power is reduced
by scattering, reflection and absorption due to the gas clouds, dusts and water vapor.
This attenuation resulting from the atmosphere is called as air mass (AM) and
sunlight hits into the earth surface with 48.2o with respect to the zenith angle
(Figure 18).61

28
Figure 18. Air Mass 1.5 Global standardization
1.2.8. Fundamental Parameter Affecting the OPV Efficiency
1.2.8.1. Short Circuit Current Density (Jsc)
Short circuit current density (Jsc) is the generated current in the circuit when no
external potential is present. The Jsc is directly related with external quantum
efficiency (EQE) which is the ratio of the number of photons incident on a solar cell
to the number of generated charge carriers. Then, Jsc is directly depending on the
EQE parameters. (EQE = ηabs * ηdiff * ηdiss * ηtr * ηcc)62,63
ηabs is a parameter related with the light absorption efficiency. Absorption of
incoming light depends on the energy difference between the HOMO and LUMO
levels and molar extinction coefficients of the materials as well as emissive layer
density.64,65
ηdiff is defined as capability related with diffusion of the electron-hole pairs to the
donor-acceptor interface. The surface characteristics and orderliness on the active
layer are main parameters affecting the diffusion performance.66,67

29
ηdiss is illustrated with dissociation efficiency of excitons. The donor-acceptor
interface brings about a junction point creating a force to break the boundary
between the hole and electron. This force should exceed exciton binding energy
which is about 0.3 eV.63,67
ηtr is the charge transfer efficiency and it is known that the migration of charges in
the active layer is explained via hopping process influenced by defects on the active
layer and recombination of the excitons.63,68
ηcc is the efficiency related with the ability of electrodes to charge collection. This
parameter depends on the electronic characteristics of the used electrodes. For
example, the work function of cathode electrode should be larger than electron
affinity of the acceptor molecule and ionization potential energy of the donor
material should exceed the work function value of the anode electrode.63
1.2.8.2. Open Circuit Voltage
Voc is defined as the measured potential between two electrodes when the current
value is zero. There are some empirical approximations to explain this phenomenon
with tangible data. Brabec and co-workers suggested a strategy in 2001 to identify
the Voc value of the materials in which it is the energy difference between HOMO of
the donor and LUMO of the acceptor molecules. By the Scharber’s studies on this
issue, a formula identifying the experimental Voc value was obtained in 2006.69,70
Voc = (1/q) [E(HOMO)donor - E(LUMO)acceptor] – 0.3 V
1.2.8.3. Fill Factor
Fill factor is the main parameter determining the power conversion efficiency. It is
the relation between the recombination and transportation of the charge carriers. As
the recombination increases fill factor decreases. The FF is defined as the ratio of

30
the maximum power from the solar cell to the product of Voc and Jsc. Graphically,
the FF is a measure of the "squareness" of the solar cell and is also the area of the
largest rectangle which will fit in the IV curve. The FF is illustrated in Figure 19.
Fill factor depend on the diode quality so that it deviates from the theoretical ideal
value because of the physical parameters. This reduction from the ideal value is
explained by fluctuations on the series resistance (Rs) and shunt resistance (Rsh).
Series resistance should be zero for an ideal diode and if its value increases there
would be a reduction on the fill factor. On the other hand, to get the ideal fill factor
value, shunt resistance should be infinite. As the shunt resistance reduces,
alternative current paths arises that cause reduction in the current through the cell. 63
Figure 19. Current-Voltage characteristics
1.2.9. Palladium Mediated Cross Coupling Reactions
Cross coupling reactions provide wide range synthesis opportunity by using
organometallic compounds. These reactions are summarized by the given equation;
71

31
The production of conjugated polymers occurs through the formation of the new
carbon-carbon sigma bonds. In the cross coupling reactions, firstly, an oxidative
addition reaction of a transition metal (palladium) occurs into the R-X bond. Then, a
transmetalation reaction takes place between the organohalide compound and
organometallic reagent. Lastly, organo addition reaction arises. (Scheme 1) 43,72
Scheme 1.General reaction mechanism of a cross coupling reaction

32
1.2.10. Moieties in Donor-Acceptor Approach: Toward the High Efficiency
1.2.10.1. Benzotriazole Moiety
Since benzotriazole unit bears diimine moiety, it is a moderate electron deficient
unit with respect to the mostly used electron acceptor units such as benzothiadiazole
and quinoxaline. However, nitrogen atom has trivalent character and so
benzotriazole can be functionalized through this atom. By the alkyl chain
attachment on the moiety, solubility problem can be overcome and also electron
donating character of the alky chains can be modified.73,74
Since the first
benzotriazole synthesis by Tanimoto and Yamamoto75
, this unit has been used for
the optoelectronic applications. Recently, using a benzotriazole derivative as an
acceptor group, You and co-workers have obtained the power conversion efficiency
exceeding 7% in their cell design in 2011. 76
1.2.10.2. π-Bridge Groups: Thiophene and Selenophene
Sulfur and selenium are among the group 16 atoms which are called as chalcogens.
The electron donor π-bridge cyclic molecules have been widely used for the
alternating electronic and optical properties of the materials in the donor-acceptor
approach. The most widely used heterocyclic conjugated molecule as a π-bridge
unit is thiophene but selenophene also has been used for past few years.
Because the aromaticity of selenophene is less than that of the thiophene, quinoid
structure is more stable for selenophene with respect to the sulfur containing
counterpart.77,78
Owing to its high quinoid character, bond length alternation value
is low leading to lower band gap. Moreover, because of the more polarizable
structure of it, intermolecular interaction between selenium moieties is high leading
to enhanced charge transportation property. However, selenophene is more rigid
than the thiophene unit. Therefore, solubility of thiophene is higher than that of the

33
selenophene. Furthermore, due to the elevated HOMO energy level of selenophene,
Voc value of it is less than that of the thiophene. However, by the decrease in the
band energy, the amount of absorbed light and so internal quantum efficiency for
selenophene is high with respect to the thiophene unit. 79,80,81
1.2.10.3. Dibenzosilole based Polymers
Silole unit has been used extensively for a few years as the donor group. Alkyl units
attached to the silicon atom provide enhanced hyper conjugation and it stabilizes the
partially negative carbon atom. Due to the good overlapping between the σ* orbital
of the exocyclic silicon-carbon bonds and π* orbital of the butadiene moiety, low
lying LUMO can be obtained leading to reduced band gap. Moreover, silicon atom
makes the butadiene HOMO level more stable resulting enhanced ambient
stability.82,83
In 2007, Leclerc et al. published an article on silafluorene based polymers. In their
study, a silafluorene derivative was used as the electron donor group, thiophene unit
was the π-bridge material and benzothiadiazole goup was chosen as the acceptor
moiety. The power conversion efficiency was 1.6% with Voc as 0.97 V and 1.9 eV
band gap.84
In 2011, Bo and co-workers have reported a high efficient organic solar cell with
PCE 6 % based on the silafluorene unit. The only difference in the polymer
structure than that of the Leclerc’s study is that they have introduced alkoxy groups
into the acceptor moiety. The polymer backbone was showed in Figure 20.85

34
Figure 20. An example of dibenzosilole based polymer
1.2.11. Aim of the Study
Donor-acceptor approach is most widely used method to obtain low band gap
polymers and high power conversion efficiency for organic solar cell applications as
mentioned in previous sections. For that purpose, derivatives of benzotriazole were
chosen as acceptor moieties, thiophene and selenophene units was used for the π-
bridge donor groups, and lastly, a silafluorene derivative was used as the donor unit
in this approach. In this manner, four different polymers namely, PTBTSif,
PSBSSif, PBTBTSif and PBSBSSif were synthesized by Suzuki coupling. Then,
optoelectronic properties of the polymers were performed. Synthesized polymers
were demonstrated in Figure 21. The reason for choosing these units for getting
high efficient solar cells was explained in detail in the previous section.

35
Figure 21. Synthesized Polymers

36

37
CHAPTER 2
EXPERIMENTAL
2.1. An Overview to Experimental Procedures and Techniques
All of the chemicals utilized in synthesis of the polymers were purchased from
Sigma-Aldrich and used without any further purification. THF (tetrahydrofuran) and
toluene were used as freshly dried solvents by using metallic sodium and
benzophenone while other solvents were used as received without any drying
operation. 1H and
13C spectra of the polymers and monomers were recorded on a
Bruker Spectrospin Avance DPX-400 Spectrometer and the chemical shifts were
reported in the ppm with respect to tetramethylsilane (TMS) as the internal
reference. Electrochemical studies were performed by Voltalab 50 potentiostat with
three-electrode system in a cell where working electrode (WE) was ITO (indium tin
oxide), platinum was used as counter electrode (CE) and silver wire calibrated to
Fc/Fc+ redox couple was utilized as the reference electrode (RE). Electronic band
gap energy values were calculated by determining the HOMO (highest occupied
molecular orbital) and LUMO (lowest unoccupied molecular orbital) levels. In the
identification of these values, the potential energy difference of normal hydrogen
electrode (NHE) against vacuum was used. Spectroelectrochemical studies of the
polymers were investigated by Varian Carry 500 UV-Vis spectrophotometer. For
purification of the materials with column chromatography Merck Silica Gel 60 was
used for the stationary phase with several organic solvents as mobile phase.
Thermal analyses were carried out by using Perkin Elmer Pyris 1 to investigate the
thermal properties of the polymers, such as decomposition temperature (Td), glass
transition temperature (Tg) and melting point (Tm). Solar cell fabrication was carried

38
out under inert atmosphere in a glove-box system. Current-voltage characteristics of
the polymers were performed by using Keithley SMU 236.
2.2. Syntheses of the Monomers
Scheme 2. Synthetic route of monomers
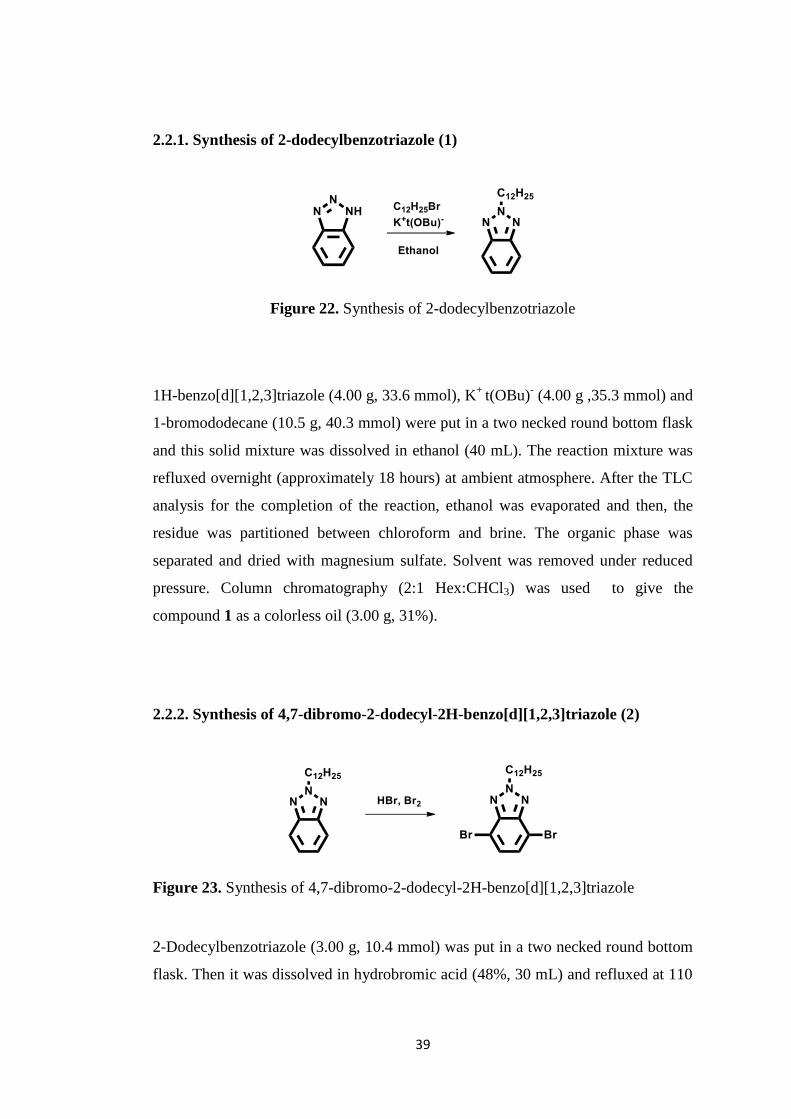
39
2.2.1. Synthesis of 2-dodecylbenzotriazole (1)
Figure 22. Synthesis of 2-dodecylbenzotriazole
1H-benzo[d][1,2,3]triazole (4.00 g, 33.6 mmol), K+
t(OBu)- (4.00 g ,35.3 mmol) and
1-bromododecane (10.5 g, 40.3 mmol) were put in a two necked round bottom flask
and this solid mixture was dissolved in ethanol (40 mL). The reaction mixture was
refluxed overnight (approximately 18 hours) at ambient atmosphere. After the TLC
analysis for the completion of the reaction, ethanol was evaporated and then, the
residue was partitioned between chloroform and brine. The organic phase was
separated and dried with magnesium sulfate. Solvent was removed under reduced
pressure. Column chromatography (2:1 Hex:CHCl3) was used to give the
compound 1 as a colorless oil (3.00 g, 31%).
2.2.2. Synthesis of 4,7-dibromo-2-dodecyl-2H-benzo[d][1,2,3]triazole (2)
Figure 23. Synthesis of 4,7-dibromo-2-dodecyl-2H-benzo[d][1,2,3]triazole
2-Dodecylbenzotriazole (3.00 g, 10.4 mmol) was put in a two necked round bottom
flask. Then it was dissolved in hydrobromic acid (48%, 30 mL) and refluxed at 110

40
°C for 1 hour. After that, bromine (4.20 g, 26.1 mmol) in hydrobromic acid (48%,
20 mL) was added drop wise to the reaction mixture. The reaction mixture was
refluxed at 130 °C and stirred overnight. The reaction mixture was cooled down to
room temperature and poured into saturated Na2CO3 solution to eliminate excess
bromine. Later on, the residue was partitioned between chloroform and distilled
water. This organic solution was dried by MgSO4 and filtered. Subsequently,
chloroform was evaporated under reduced pressure and dark brown oil was
obtained. To purify this compound, silica packed flash column chromatography
(50:1, Hex:EtOAc) was used to give titled compound as a white solid (4.07 g, yield
88%). 1H NMR (400 MHz, CDCl3) δ 7.38 (s, 2H), 4.73 – 4.68 (m, 2H), 2.07 (dd, J
= 14.6, 7.4 Hz, 2H), 1.28 (s, 3H), 1.18 (s, 15H), 0.81 (t, J = 6.8 Hz, 3H).
2.2.3. Synthesis of 2-(2-octyldodecyl)-2H-benzo[d][1,2,3]triazole (3)
Figure 24. Synthesis of 2-(2-octyldodecyl)-2H-benzo[d][1,2,3]triazole
1H-benzo[d][1,2,3]triazole (4.00 g, 33.6 mmol) was dissolved in dry DMF (15 mL)
and the reaction mixture was cooled below 0 °C. Then NaH (967 mg, 40.3 mmol)
was added to the reaction medium at this temperature. After stirring for one hour the
temperature was raised to 60 °C and 9-(bromomethyl)nonadecane (14 g, 40.3 mmol)
was added to reaction mixture. This reaction was stirred at this temperature
overnight. After the evaporation of DMF under vacuum, the residue was washed
with water and extracted by chloroform. This organic solution was dried by MgSO4

41
and filtered. Subsequently, organic solvent was evaporated under reduced pressure.
Silica packed flash column chromatography (3:1, Hex:DCM) was used to give
compound 3 as pale-yellow oil. (3.76 g, yield 28%)
2.2.4. Synthesis of 4,7-dibromo-2-(2-octyldodecyl)-2H-benzo[d][1,2,3]triazole
(4)
Figure 25. Synthesis of 4,7-dibromo-2-(2-octyldodecyl)-2H-benzo[d][1,2,3]triazole
2-(2-Octyldodecyl)-2H-benzo[d][1,2,3]triazole (3,76 g, 9.40 mmol) was dissolved
in hydrobromic acid (48%, 30 mL) in a two-necked round bottom flask. This
solution was stirred and refluxed at 110 °C for one hour and then bromine (3.75 g,
23.5 mmol) in hyrdrobromic acid (48%, 20 mL) was added drop wise to the
reaction mixture. The mixture was refluxed at 130 °C overnight. Then, the residue
was partitioned between chloroform and distilled water. Organic layer was dried
over MgSO4 and filtered. The solvent was evaporated under vacuum. Column
chromatography (1:1, Hex:CHCl3) was used to give compound 4 as a yellow oil.
(2.52 g, yield 48%)

42
2.2.5. Synthesis of tributyl(thiophen-2-yl)stannane (5)
Figure 26. Synthesis of tributyl(thiophen-2-yl)stannane
Thiophene (2.00 g, 23.8 mmole) was dissolved in the dry THF (10 mL) in a two
neck round bottom flask under argon atmosphere. The temperature was cooled
down to -78 °C and n-butyl lithium (2.5 M in hexane, 10 mL, 26 mmol) was added
drop wise to the reaction within one hour at this temperature. Subsequently, the
reaction mixture was stirred for one hour at 0 °C and for another one hour at room
temperature. Then, the temperature was cooled down to -78 °C again and tributyltin
chloride (8.5 g, 26 mmol) was drop wise added to the reaction mixture within half
an hour. This solution was stirred overnight at room temperature under argon. After
the quenching of the reaction with water, THF was evaporated under vacuum and
the residue was partitioned between distilled water and chloroform. Organic layer
was extracted and dried with MgSO4. Chloroform was evaporated under reduced
pressure. Then silica packed column was standardized by basic triethyl amine and
chromatography (9:1, Hex:Et3N) was used to give the titled compound as a pale
yellow oil. (8.80 g, yield 95%). 1H NMR (400 MHz, CDCl3), δ(ppm): 7.55 (d, 1H),
7.18 (dd, 1H), 7.10 (d, 1H), 1.50 (t, 6H), 1.26 (dd, 6H), 1.03 (m, 6H), 0.82 (t, 9H)

43
2.2.6. Synthesis of tributyl(selenophen-2-yl)stannane (6)
Figure 27. Synthesis of tributyl(selenophen-2-yl)stannane
Selenophene (1.00 g, 7.63 mmol) was dissolved in the dry THF (10 mL) in a two
neck round bottom flask under argon atmosphere. The temperature was cooled
down to -78 °C and n-butyl lithium (2.5 M in hexane, 3.40 mL, 8.40 mmol) was
added dropwise to the reaction within one hour at this temperature. Subsequently,
the reaction mixture was stirred for one hour at 0 °C and for one hour at room
temperature. Then, the temperature was cooled down to -78 0C again and tributyltin
chloride (2.73 g, 8.40 mmol) was drop wise added to the reaction mixture within
half an hour. This solution was stirred overnight at room temperature under argon.
After the quenching of the reaction, THF was evaporated under vacuum and the
residue was partitioned between distilled water and chloroform. Organic layer was
extracted and dried with MgSO4. Chloroform was evaporated under reduced
pressure. Then silica packed column was standardized by basic triethyl amine and
chromatography (9:1, Hex:Et3N) was used to give the titled compound as a pale
yellow oil. (yield 75 %). 1H NMR (400 MHz, CDCl3) δ 8.28 – 8.23 (m, 1H), 7.41
(dt, J = 5.0, 3.3 Hz, 2H), 1.54 – 1.45 (m, 7H), 1.32 – 1.21 (m, 8H), 1.05 – 1.00 (m,
6H), 0.82 (t, J = 7.3 Hz, 12H).
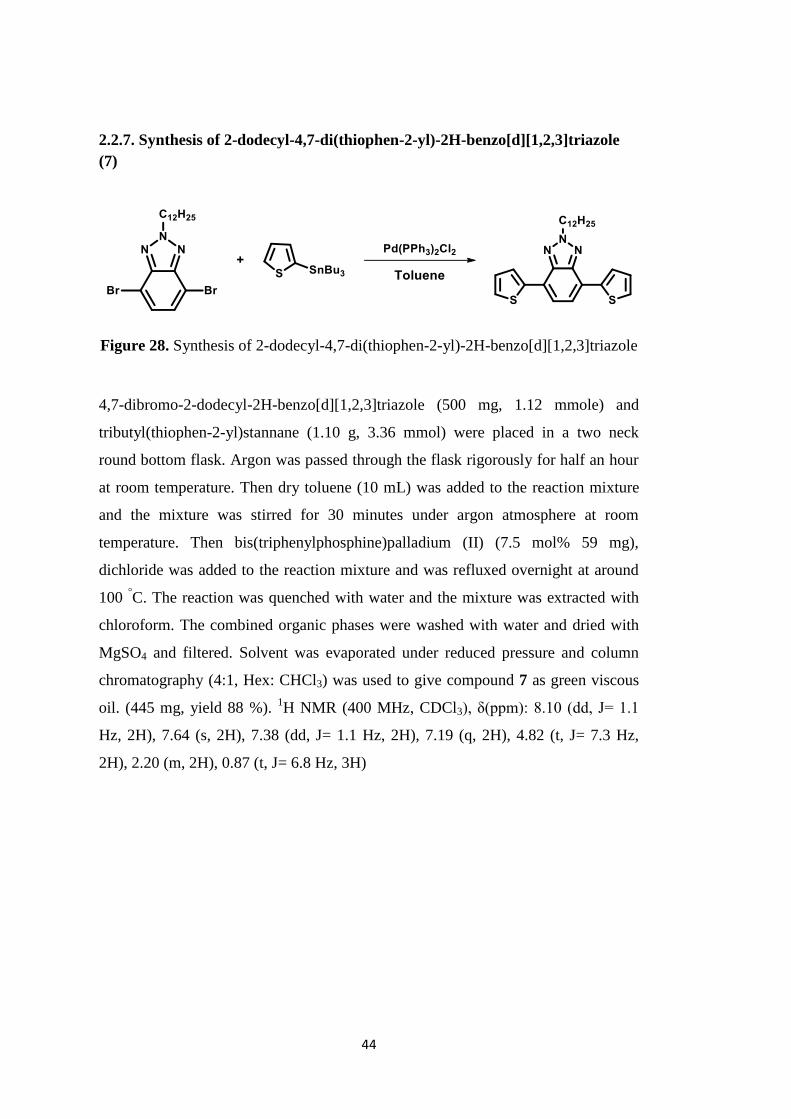
44
2.2.7. Synthesis of 2-dodecyl-4,7-di(thiophen-2-yl)-2H-benzo[d][1,2,3]triazole
(7)
Figure 28. Synthesis of 2-dodecyl-4,7-di(thiophen-2-yl)-2H-benzo[d][1,2,3]triazole
4,7-dibromo-2-dodecyl-2H-benzo[d][1,2,3]triazole (500 mg, 1.12 mmole) and
tributyl(thiophen-2-yl)stannane (1.10 g, 3.36 mmol) were placed in a two neck
round bottom flask. Argon was passed through the flask rigorously for half an hour
at room temperature. Then dry toluene (10 mL) was added to the reaction mixture
and the mixture was stirred for 30 minutes under argon atmosphere at room
temperature. Then bis(triphenylphosphine)palladium (II) (7.5 mol% 59 mg),
dichloride was added to the reaction mixture and was refluxed overnight at around
100 °C. The reaction was quenched with water and the mixture was extracted with
chloroform. The combined organic phases were washed with water and dried with
MgSO4 and filtered. Solvent was evaporated under reduced pressure and column
chromatography (4:1, Hex: CHCl3) was used to give compound 7 as green viscous
oil. (445 mg, yield 88 %). 1H NMR (400 MHz, CDCl3), δ(ppm): 8.10 (dd, J= 1.1
Hz, 2H), 7.64 (s, 2H), 7.38 (dd, J= 1.1 Hz, 2H), 7.19 (q, 2H), 4.82 (t, J= 7.3 Hz,
2H), 2.20 (m, 2H), 0.87 (t, J= 6.8 Hz, 3H)

45
2.2.8. Synthesis of 2-dodecyl-4,7-di(selenophen-2-yl)-2H-benzo[d][1,2,3]triazole
(8)
Figure 29. Synthesis of 2-dodecyl-4,7-di(selenophen-2-yl)-2H-
benzo[d][1,2,3]triazole
4,7-Dibromo-2-dodecyl-2H-benzo[d][1,2,3]triazole (500 mg, 1.12 mmole) and
tributyl(selenophen-2-yl)stannane (1.43 g, 3.40 mmole) were placed in a two neck
round bottom flask. Argon was passed through the flask intensely for half an hour at
room temperature. Then dry toluene (10 mL) was added to the reaction mixture and
the mixture was stirred for 30 minutes under argon atmosphere at room temperature.
Then bis(triphenylphosphine)palladium (II) (7.5 mol% 59 mg), dichloride was
added to the reaction mixture and was refluxed overnight at around 100 °C. The
reaction was quenched with water and the mixture was extracted with chloroform.
The combined organic phases were washed with water and dried with MgSO4 and
filtered. Solvent was evaporated under reduced pressure and column
chromatography (20:1, Hex: EtOAc) was used to give compound 8 as brownish
viscous oil. (480 mg, yield 79 %). 1H NMR (400 MHz, CDCl3), δ(ppm): 8.20 (d, J =
3.8 Hz, 2H), 8.08 (d, J = 4.8 Hz, 2H), 7.61 (s, 2H), 7.43 (dd, J = 5.6, 3.9 Hz, 2H),
4.82 (t, J = 7.2 Hz, 2H), 2.25-2.16 (m, 2H), 1.41 (s, 4H), 1.30-1.23 (m, 14 H), 0.87
(t, J = 6.8 Hz, 3H)

46
2.2.9. Synthesis of 2-(2-octyldodecyl)-4,7-di(thiophen-2-yl)-2H-
benzo[d][1,2,3]triazole (9)
Figure 30. Synthesis of 2-(2-octyldodecyl)-4,7-di(thiophen-2-yl)-2H-
benzo[d][1,2,3]triazole
4,7-Dibromo-2-(2-octyldodecyl)-2H-benzo[d][1,2,3]triazole (500 mg, 0.90 mmole)
and tributyl(thiophen-2-yl)stannane (1.00 g, 2.70 mmole) were placed in a two neck
round bottom flask. Argon was passed through the flask intensely for half an hour at
room temperature. Then dry toluene (10 mL) was added to the reaction mixture and
the mixture was stirred for 30 minutes under argon atmosphere at room temperature.
Then bis(triphenylphosphine)palladium (II) (7.5 mol% 47 mg), dichloride was
added to the reaction mixture and was refluxed overnight at around 100 °C. The
reaction was quenched with water and the mixture was extracted with chloroform.
The combined organic phases were washed with water and dried with MgSO4 and
filtered. Solvent was evaporated under reduced pressure and column
chromatography (4:1, Hex: CHCl3) was used to give compound 9 as yellow solid.
(381 mg, yield 75 %). 1H NMR (400 MHz, CDCl3), δ(ppm): 8.03 (dd, J = 3.6, 1.0
Hz, 2H), 7.56 (s, 2H), 7.30 (dd, J = 5.1, 1.0 Hz, 2H), 7.11 (dd, J = 5.1, 3.7 Hz, 2H),
4.68 (d, J = 6.6, 2H), 2.29-2.20 (m, 1H), 1.30 (dd, J = 12.4, 6.8 Hz, 7H), 1.17 (d, J=
9.13 Hz, 24H), 0.79 (dd, J = 7.0, 4.5 Hz, 6H)

47
2.2.10. Synthesis of 2-(2-octyldodecyl)-4,7-di(selenophen-2-yl)-2H-
benzo[d][1,2,3]triazole (10)
Figure 31. Synthesis of 2-(2-octyldodecyl)-4,7-di(selenophen-2-yl)-2H-
benzo[d][1,2,3]triazole
4,7-Dibromo-2-(2-octyldodecyl)-2H-benzo[d][1,2,3]triazole (500 mg, 0.90 mmole)
and tributyl(selenophen-2-yl)stannane (1.13 g, 2.70 mmole) were placed in a two
neck round bottom flask. Argon was passed through the flask intensely for half an
hour at room temperature. Then dry toluene (10 mL) was added to the reaction
mixture and the mixture was stirred for 30 minutes under argon atmosphere at room
temperature. Then bis(triphenylphosphine)palladium (II) (7.5 mol% 59 mg),
dichloride was added to the reaction mixture and was refluxed overnight at around
100 °C. The reaction was quenched with water and the mixture was extracted with
chloroform. The combined organic phases were washed with water and dried with
MgSO4 and filtered. Solvent was evaporated under reduced pressure and column
chromatography (25:1, Hex: EtOAc) was used to give compound 10 as yellowish
solid. (444 mg, yield 71 %). 1H NMR (400 MHz, CDCl3), δ(ppm): 8.19 (d, J = 3.8
Hz, 2H), 8.08 (d, J = 5.6 Hz, 2H), 7.61 (s, 2H), 7.42 (dd, J = 5.6, 3.9 Hz, 2H), 4.75
(d, J = 6.4 Hz, 2H), 2.30 (d, J = 2.3 Hz, 1H), 1.44-1.36 (m, 6H), 1.25 (d, J = 9.1 Hz,
26H), 0.87 (td, J = 6.8, 4.0 Hz, 6H)

48
2.2.11. Synthesis of 4,7-bis(5-bromothiophen-2-yl)-2-dodecyl-2H-
benzo[d][1,2,3]triazole (11)
Figure 32. Synthesis of 4,7-bis(5-bromothiophen-2-yl)-2-dodecyl-2H-
benzo[d][1,2,3]triazole
2-Dodecyl-4,7-di(thiophen-2-yl)-2H-benzo[d][1,2,3]triazole (445 mg, 1.00 mmol)
was dissolved in chloroform (40 mL) and N-bromosuccinimide, NBS, (445 mg, 2.5
mmol) was added to the reaction mixture slowly at room temperature under dark.
After completion of the addition, reaction was stirred overnight. The mixture was
partitioned between chloroform and distilled water. Organic layer was separated,
dried (MgSO4) and the solvent was evaporated under reduced pressure. The residue
was purified by using silica packed column chromatography (15:1, Hex:DCM) to
give 11 as green solid. (485 mg, 80 %). 1H NMR (400 MHz, CDCl3), δ(ppm): 7.78
(d, J = 3.9 Hz, 2H), 7.50 (s, 2H), 7.12 (d, J = 4.1 Hz, 2H), 4.79 (t, J = 7.2 Hz, 2H),
2.17 (m, 2H), 1.43-1.38 (m, 4H), 1.28-1.23 (m, 4H), 0.87 (t, J = 6.8 Hz, 6H) 13
C
NMR (400 MHz, CDCl3) δ 139.90, 139.41, 129.04, 125.11, 121.19, 120.38, 111.33,
75.47, 75.16, 74.84, 55.10, 30.06, 28.18, 27.76, 27.69, 27.58, 27.48, 27.15, 24.72,
20.83, 12.25, -0.84.

49
2.2.12. Synthesis of 4,7-bis(5-bromoselenophen-2-yl)-2-dodecyl-2H-
benzo[d][1,2,3]triazole (12)
Figure 33. Synthesis of 4,7-bis(5-bromoselenophen-2-yl)-2-dodecyl-2H-
benzo[d][1,2,3]triazole
2-Dodecyl-4,7-di(selenophen-2-yl)-2H-benzo[d][1,2,3]triazole (480 mg, 0.88
mmole) was dissolved in chloroform (40 mL) and N-bromosuccinimide, NBS, (392
mg, 2.2 mmole) was added to the reaction mixture portionwise at room temperature
under dark. After completion of the addition, reaction was stirred overnight. The
mixture was partitioned between chloroform and distilled water. Organic layer was
separated, dried (MgSO4) and the solvent was evaporated under reduced pressure.
The residue was purified by using silica packed column chromatography (3:1,
Hex:DCM) to give 12 as yellow solid (452 mg, 73 %). 1H NMR (400 MHz, CDCl3),
δ(ppm): 7.80 (d, J = 4.2 Hz, 2H), 7.53 (s, 2H), 7.33 (d, J = 4.2 Hz, 2H), 4.79 (t, J =
7.1 Hz, 2H), 2.18 (dd, J = 8.3, 5.6 Hz, 2H), 1.40 (m, 4H), 1.25 (m, 14H), 0.87 (t, J =
6.8 Hz, 3H)

50
2.2.13. Synthesis of 4,7-bis(5-bromothiophen-2-yl)-2-(2-octyldodecyl)-2H-
benzo[d][1,2,3]triazole (13)
Figure 34. Synthesis of 4,7-bis(5-bromothiophen-2-yl)-2-(2-octyldodecyl)-2H-
benzo[d][1,2,3]triazole
2-(2-Octyldodecyl)-4,7-di(thiophen-2-yl)-2H-benzo[d][1,2,3]triazole (485 mg, 0.86
mmol) was dissolved in CHCl3 (40 mL) and NBS (254 mg, 2.15 mmol) was added
to the reaction mixture slowly at room temperature under dark. After completion of
the addition, reaction was stirred overnight. The mixture was partitioned between
chloroform and distilled water. Organic layer was separated, dried (MgSO4) and the
solvent was evaporated under reduced pressure. The residue was purified by using
silica packed column chromatography (5:1, Hex:CHCl3) to give 13 as green solid
(471 mg, yield 76 %). 1H NMR (400 MHz, CDCl3), δ(ppm): 7.71 (d, J =4.0 Hz,
2H), 7.45 (s, 2H), 7.05 (d, J = 4.0 Hz, 2H), 4.66 (d, J = 6.6 Hz, 2H), 2.21 (d, J = 5.9
Hz, 1H), 1.36-1.27 (m, 6H), 1.17 (d, J = 8.2 Hz, 26H), 0.83-0.77 (m, 6H) 13
C NMR
(400 MHz, CDCl3) δ 141.59, 141.29, 130.88, 126.86, 122.97, 122.16, 113.14,
39.20, 31.94, 31.91, 31.46, 29.91, 29.68, 29.61, 29.37, 29.34, 26.27, 22.71, 14.15.

51
2.2.14. Synthesis of 4,7-bis(5-bromoselenophen-2-yl)-2-(2-octyldodecyl)-2H-
benzo[d][1,2,3]triazole (14)
Figure 35. Synthesis of 4,7-bis(5-bromoselenophen-2-yl)-2-(2-octyldodecyl)-2H-
benzo[d][1,2,3]triazole
2-(2-Octyldodecyl)-4,7-di(selenophen-2-yl)-2H-benzo[d][1,2,3]triazole (444 mg,
0.68 mmol) was dissolved in CHCl3 (40 mL) and NBS (300 mg, 1.69 mmol) was
added to the reaction mixture slowly at room temperature under dark. After
completion of the addition, reaction was stirred overnight. The mixture was
partitioned between chloroform and distilled water. Organic layer was separated,
dried (MgSO4) and the solvent was evaporated under reduced pressure. The residue
was purified by using silica packed column chromatography (50:1, Hex:EtOAc) to
give 14 as pale brown solid (383mg, yield 69 %) 1H NMR (400 MHz, CDCl3),
δ(ppm): 7.71 (d, J = 4.2 Hz, 2H), 7.47 (s, 2H), 7.26 (d, J = 4.2 Hz, 2H), 4.66 (d, J =
6.3 Hz, 2H), 2.23-2.16 (m, 1H), 1.30 (dd, 19.9, 9.2 Hz, 6H), 1.22-1.16 (m, 26H),
0.80 (td, J = 6.8, 2.9 Hz, 6H)

52
2.3. Synthesis of Polymers
Scheme 3. General synthesis mechanism of polymers
2.3.1. Synthesis of PTBTSif
In a 50 mL two-neck round bottom flask K2CO3 solution (2M, 0.5 mL) was added
and the system was purged with argon for 30 minutes. Then, freshly dried toluene
(5mL) was added to the mixture and argon purging was continued. 4,7-Bis(5-
bromothiophen-2-yl)-2-dodecyl-2H-benzo[d][1,2,3]triazole (100 mg, 0.164 mmol),
9,9-Dioctyl-9H-9-silafluorene-2,7-bis(boronic acid pinacol ester) (108 mg, 0.164
mmol) and a catalytic amount of tetrahexyl ammonium iodide was then added to the
reaction followed by argon purging for an additional 30 minutes. After that,
Tris(dibenzylideneacetone)dipalladium(0) (5.0 mol%, 7.5 mg) and tris(o-
tolyl)phosphine (10 mol%, 5.00 mg) was added to the reaction mixture. The
temperature was raised to 105 °C from room temperature. The polymerization
reaction was sustained at this temperature under argon atmosphere for 40 hours.
Bromobenzene (103 mg, 0.656 mmol) and extra catalyst (3.50 mg) were then added
and the mixture was stirred for four hours then phenyl boronic acid, (160 mg, 1.312
mmole) was added and the mixture was stirred at 105 °C overnight. The reaction
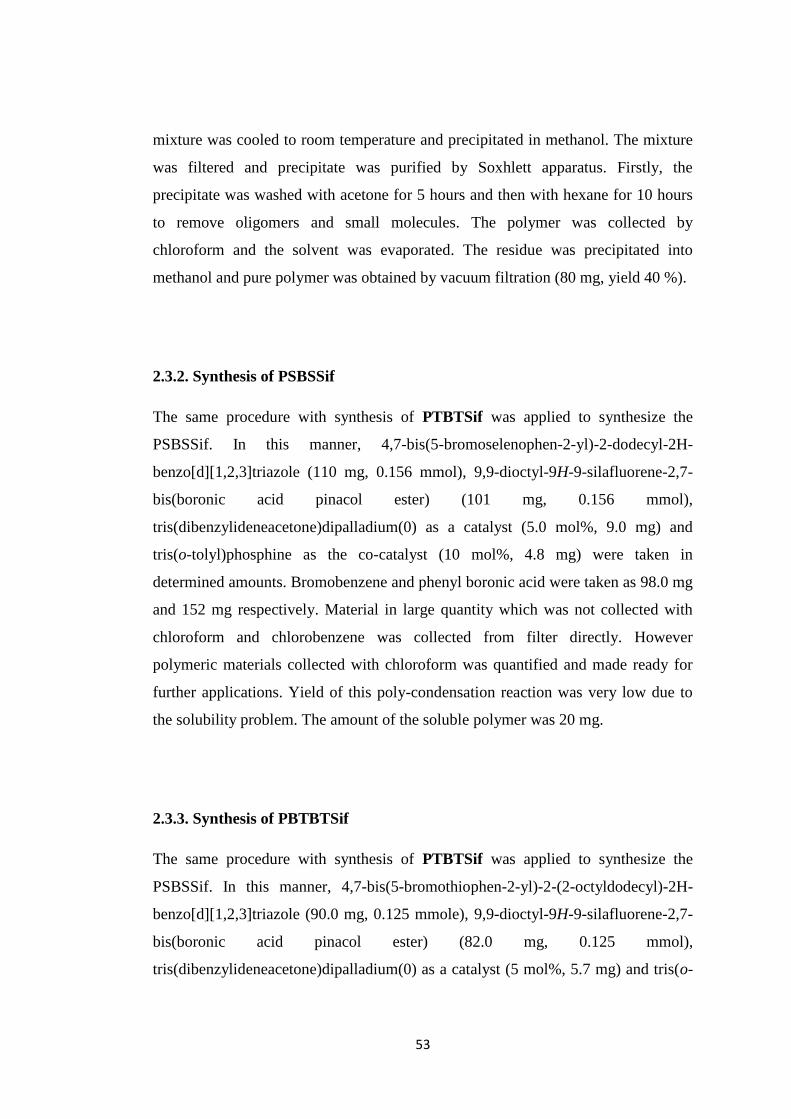
53
mixture was cooled to room temperature and precipitated in methanol. The mixture
was filtered and precipitate was purified by Soxhlett apparatus. Firstly, the
precipitate was washed with acetone for 5 hours and then with hexane for 10 hours
to remove oligomers and small molecules. The polymer was collected by
chloroform and the solvent was evaporated. The residue was precipitated into
methanol and pure polymer was obtained by vacuum filtration (80 mg, yield 40 %).
2.3.2. Synthesis of PSBSSif
The same procedure with synthesis of PTBTSif was applied to synthesize the
PSBSSif. In this manner, 4,7-bis(5-bromoselenophen-2-yl)-2-dodecyl-2H-
benzo[d][1,2,3]triazole (110 mg, 0.156 mmol), 9,9-dioctyl-9H-9-silafluorene-2,7-
bis(boronic acid pinacol ester) (101 mg, 0.156 mmol),
tris(dibenzylideneacetone)dipalladium(0) as a catalyst (5.0 mol%, 9.0 mg) and
tris(o-tolyl)phosphine as the co-catalyst (10 mol%, 4.8 mg) were taken in
determined amounts. Bromobenzene and phenyl boronic acid were taken as 98.0 mg
and 152 mg respectively. Material in large quantity which was not collected with
chloroform and chlorobenzene was collected from filter directly. However
polymeric materials collected with chloroform was quantified and made ready for
further applications. Yield of this poly-condensation reaction was very low due to
the solubility problem. The amount of the soluble polymer was 20 mg.
2.3.3. Synthesis of PBTBTSif
The same procedure with synthesis of PTBTSif was applied to synthesize the
PSBSSif. In this manner, 4,7-bis(5-bromothiophen-2-yl)-2-(2-octyldodecyl)-2H-
benzo[d][1,2,3]triazole (90.0 mg, 0.125 mmole), 9,9-dioctyl-9H-9-silafluorene-2,7-
bis(boronic acid pinacol ester) (82.0 mg, 0.125 mmol),
tris(dibenzylideneacetone)dipalladium(0) as a catalyst (5 mol%, 5.7 mg) and tris(o-

54
tolyl)phosphine as the co-catalyst (11 mol%, 4.3 mg) were taken in the determined
amounts. Bromobenzene (0.375 mmol) and phenyl boronic (0.750 mmol) acid were
taken as 60 mg and 91 mg respectively. The amount of the polymer was 60 mg
(yield 35 %)
2.3.4. Synthesis of PBSBSSif
The same procedure with synthesis of PTBTSif was applied to synthesize the
PSBSSif. 4,7-bis(5-bromoselenophen-2-yl)-2-(2-octyldodecyl)-2H-
benzo[d][1,2,3]triazole (100 mg, 0.122 mmole), 9,9-dioctyl-9H-9-silafluorene-2,7-
bis(boronic acid pinacol ester) (81.0 mg, 0.122 mmol),
tris(dibenzylideneacetone)dipalladium(0) as the catalyst (5.0 mol%, 5.6 mg) and
tris(o-tolyl)phosphine as the co-catalyst (11 mol%, 4.0 mg) were taken in the
determined amounts. Bromobenzene (0.366 mmole) and phenyl boronic (0.732
mmol) acid were taken as 57 mg and 89 mg respectively. The amount of the
polymer was 60 mg (yield 35 %). The final polymer amount was 20 mg.
2.4. Electrochemical Studies
These studies were conducted to determine the electrochemical properties of the
semi-conducting polymers. For this purpose, potentiostat was used with three-
electrode system. In potentiometric approach, counter electrode (CE) was used to
control the potential against the working electrode (WE). The difference in the
potential between the WE and reference electrode (RE) was determined.
By using the cyclic voltammetry technique, the redox behaviors of the polymers
were investigated. This oxidation and reduction tendencies of the polymers were
determined by monitoring the redox reactions between the conducting polymers and
anion of the electrolyte solution at a constant rate. As a result of this, attained
voltammogram gives a graph of current versus potential. Furthermore, by

55
determination of the oxidation and reduction onsets on the cyclic voltammogram,
HOMO and LUMO values were measured as well as electronic band gap energy
(Egel). In addition to this, by changing the potentials, color changes in the polymers
were identified for further applications. To perform this study, polymer was
dissolved in chloroform and resulting colored solution was sprayed onto ITO (WE)
coated glass substrate. Then it was submerged in the NBu4+PF6
-/ACN
(tetrabutylammonium hexafluorophosphate/acetonitrile) electrolyte-solvent couple
which is in a quartz cuvette. Platinum and silver wire submerged in that cuvette
were used as CE and RE respectively.
2.5. Spectroelectrochemical Studies
This analysis method was performed by a three electrode system same as was the
case for electrochemical studies. By using this technique, absorption spectrum of
the polymers were identified at different potentials. Hence, during these analyses,
not only neutral states of the polymers but also their polaron and bipolaron bands
were examined. Moreover, this study gives information about the optical band gap
(Egop
) which determined by the λonset of neutral state of the polymer.
2.6. Kinetic Studies
The electrochromic device (EC) and its application areas were discussed in
introduction part and the importance of optical transmittance and switching time for
an EC material was emphasized. Optical transmittance or optical contrast of the
polymers in neutral state and doped states namely polaron and bipolaron are
determined by the square wave potential as a function of time. Switching time of the
polymers was measured from these data.

56
2.7. Thermal Analyses
The degradation temperatures of the polymers are investigated by using TGA
(Thermal Gravimetric Analysis). In this technique, weight loss of the polymers with
respect to increased temperature was analyzed. 5 % weight was determined as the
point where significant decomposition started to occur. To perform these analyses
Perkin Elmer Pyris 1 TGA was utilized.
For determination of the relation between the crystalline and amorphous forms of
the polymers DSC (Differential Scanning Calorimetry) was utilized. In this method,
glass transition temperature (Tg) and melting points (Tm) of the polymers are
identified. For this purpose Perkin Elmer Differential Scanning Calorimetry was
used.
2.8. Solar Cell Applications
The BHJ type organic solar cells were fabricated with the structure of
ITO/PEDOT:PSS/Polymer:PC71BM/Ca/Al. The active layer was prepared with
different polymer:PC71BM ratios. ITO was etched and then ITO coated glass
substrate was washed using detergent and water and then with acetone and
isopropyl alcohol sequentially in an ultrasonic bath for 15 minutes. The solvent on
the surface of the ITO was evaporated by the temperature treatment performed on a
hot plate at 50 °C for 15 min. Subsequently, the last cleaning procedure was
performed in Harrick Plasma Cleaner. After the cleaning of the ITO surface filtered
PEDOT:PSS (0.45 μm PVDF membrane) was integrated on ITO surface by spin
coating with 5000 rpm for one minute. The substrate was dried for 10 min at 150 °C
on a hot plate. The mixture of polymer:PC71BM was filtered with 0.2 μm syringe
filter. This filtered active layer was coated on PEDOT:PSS layer at different rpm by
G3P-8 spin coater under nitrogen atmosphere in a glove-box system. After that,
calcium and aluminum were coated on the active layer surface with thermal
deposition technique. All current density-voltage (J-V) characteristics of the

57
devices were measured using a Keithley 2400 sourcemeter under AM 1.5G-filtered
irradiation (100 mW cm-2) from a 1 kW Atlas Material Testing Solutions solar test
1200 solar simulator. The light intensity was measured with a Newport Optical
Powermeter 1916-C radiant power meter.
The FF (fill factor) of the devices is affected mainly by charge mobility and surface
morphology of the active layer. The hole mobility of the thin films was calculated
by space charge limited current method (SCLC) technique. The modified J-V curves
were plotted by the Child’s formula,
Here, μ is the carrier mobility, V is applied voltage, L is thickness of polymer, εr is
the relative permittivity and εo is permittivity of free space.

58

59
CHAPTER 3
RESULTS AND DISCUSSION
3.1. Electrochemical Studies
Suitability of the polymers for optoelectronic applications can be tested by
performing electrochemical studies which gives information about the HOMO and
LUMO energy levels of the materials as well as their band gap energies. Cyclic
voltammetry analyses were conducted for determining these values. Thus, redox
behaviors of the materials under investigation were explored. For these studies,
polymers dissolved in chloroform (5mg/mL) were coated onto ITO surface by spray
coating technique. In the meantime, for the CV studies, three-electro system was
established in the quartz cell including an electrolyte solution which was consisted
of TBAPF6 (tetrabutylammonium hexafluorophosphate) and acetonitrile (ACN). In
three- electrode system, polymer coated ITO was used as the working electrode,
platinum (Pt) was chosen as the counter electrode and silver wire calibrated to
Fc/Fc+ redox couple (300 mV) was utilized as the pseudo reference electrode.
Oxidation and reduction potentials of the polymers were investigated at the 100
mVs-1
as the scan rate.
Cyclic voltammograms show that all polymers possess p-doping and n-doping
characters. In the p- type doping/dedoping processes for PTBTSif, polymer showed
a reversible redox couple at 1.16 V and 0.95 V. The n-type doping/dedoping redox
couple was observed at -1.72 V and -1.50 V. In the case of PSBSSif, polymer was
oxidized at 1.03 V and it was reduced at 0.78 V reversibly with p-type
doping/dedoping processes. The reversible n-type doping/dedoping peaks were
observed at -1.78 V and -1.54 V respectively. The p-type reversible oxidation and
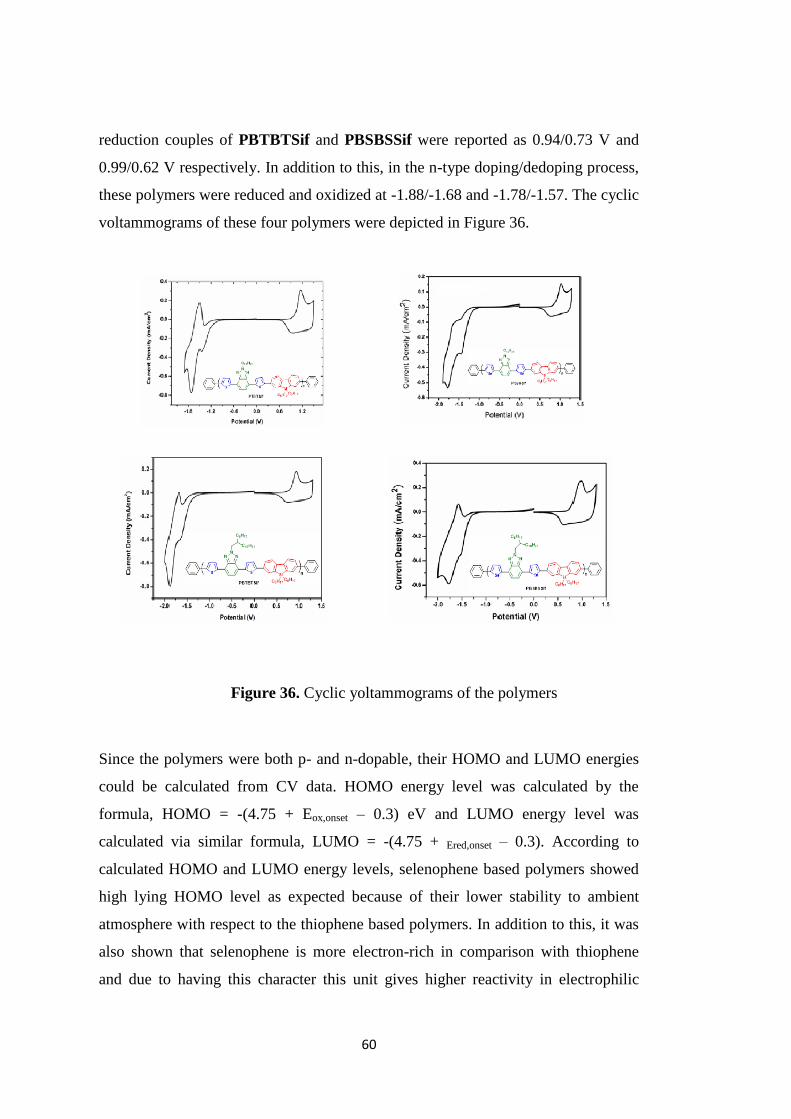
60
reduction couples of PBTBTSif and PBSBSSif were reported as 0.94/0.73 V and
0.99/0.62 V respectively. In addition to this, in the n-type doping/dedoping process,
these polymers were reduced and oxidized at -1.88/-1.68 and -1.78/-1.57. The cyclic
voltammograms of these four polymers were depicted in Figure 36.
Since the polymers were both p- and n-dopable, their HOMO and LUMO energies
could be calculated from CV data. HOMO energy level was calculated by the
formula, HOMO = -(4.75 + Eox,onset – 0.3) eV and LUMO energy level was
calculated via similar formula, LUMO = -(4.75 + Ered,onset – 0.3). According to
calculated HOMO and LUMO energy levels, selenophene based polymers showed
high lying HOMO level as expected because of their lower stability to ambient
atmosphere with respect to the thiophene based polymers. In addition to this, it was
also shown that selenophene is more electron-rich in comparison with thiophene
and due to having this character this unit gives higher reactivity in electrophilic
Figure 36. Cyclic yoltammograms of the polymers

61
substitution reactions. Although high lying HOMO cause decrease in open circuit
voltage (Voc) value, this reduces the band gap energy that leads to increase in the
amount of harvested photons. HOMO energy levels of the polymers were measured
as -5.48 eV, -5.31 eV, -5.24 eV and -5.18 eV for PTBTSif, PSBSSif, PBTBTSif
and PBSBSSif respectively and LUMO energy levels of the polymers were found as
-3.30, -3.27, -3.02 and -3.12 in the same order. LUMO energy level is important not
only for achieving low band gap molecules but also for effective intermolecular
charge transfer process between donor polymer and acceptor molecule (PC71BM).
The difference between the LUMO energy levels of donor and acceptor (-3.91 eV
LUMO energy level) should be in the range of 0.3-0.5 eV. As a result of this, the
most effective intermolecular charge transfer is expected for the PTBTSif.
Electronic band gap (Egel) values of the polymers were calculated by the formula;
Egel = EHOMO - ELUMO and these values were found to be 2.18 eV for PTBTSif, 2.04
eV for PSBSSif, 2.22 eV for PBTBTSif and 2.06 eV for PBSBSSif. π-bridge effect
on the band gap of the polymers was evident. The electronic band gap energy
difference between the thiophene based PTBTSif and selenophene based PSBSSif
was recorded as 0.14 eV and difference between the PBTBTSif bearing thiophene
π-bridge and PBSBSSif bearing selenophene π-bridge donor groups was reported as
0.16 eV. As a consequence, polymers having thiophene π-bridge on their backbones
have low lying HOMO level with larger band gaps. The electrochemical studies
were summarized in Table 1.
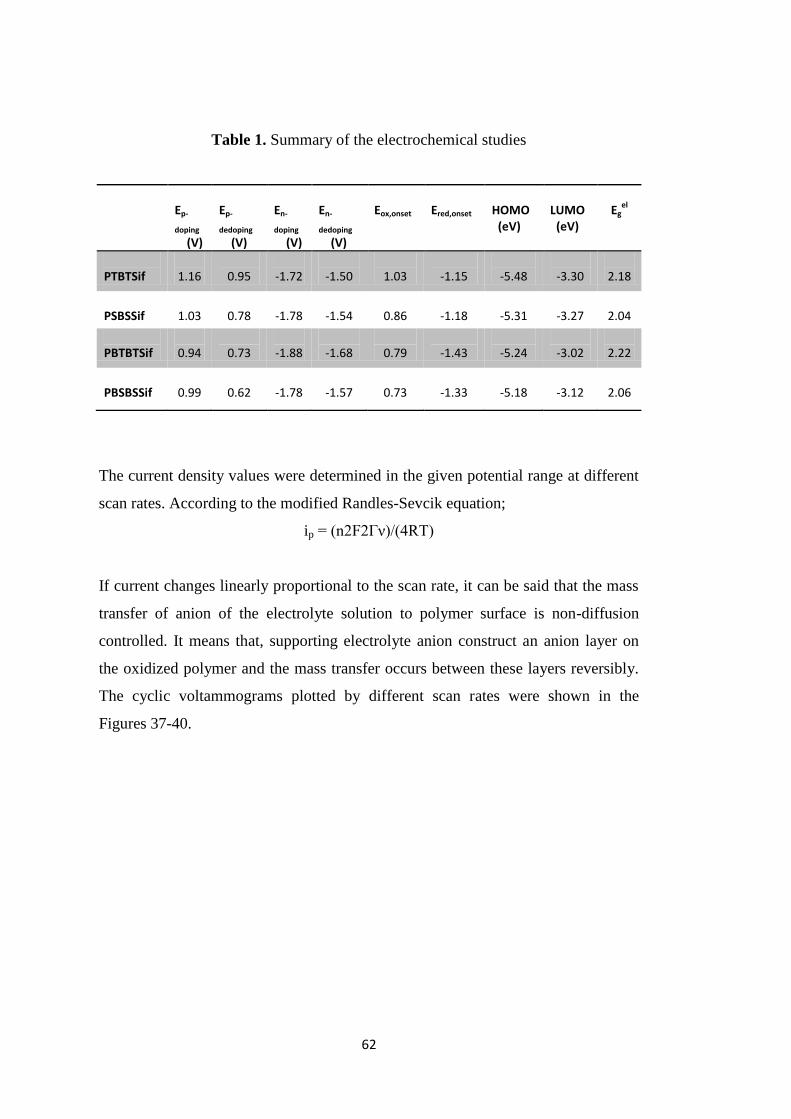
62
Table 1. Summary of the electrochemical studies
The current density values were determined in the given potential range at different
scan rates. According to the modified Randles-Sevcik equation;
ip = (n2F2Γν)/(4RT)
If current changes linearly proportional to the scan rate, it can be said that the mass
transfer of anion of the electrolyte solution to polymer surface is non-diffusion
controlled. It means that, supporting electrolyte anion construct an anion layer on
the oxidized polymer and the mass transfer occurs between these layers reversibly.
The cyclic voltammograms plotted by different scan rates were shown in the
Figures 37-40.
Ep-
doping
(V)
Ep-
dedoping
(V)
En-
doping
(V)
En-
dedoping
(V)
Eox,onset
Ered,onset
HOMO (eV)
LUMO (eV)
Eg
el
PTBTSif
1.16
0.95
-1.72
-1.50
1.03
-1.15
-5.48
-3.30
2.18
PSBSSif
1.03
0.78
-1.78
-1.54
0.86
-1.18
-5.31
-3.27
2.04
PBTBTSif
0.94
0.73
-1.88
-1.68
0.79
-1.43
-5.24
-3.02
2.22
PBSBSSif
0.99
0.62
-1.78
-1.57
0.73
-1.33
-5.18
-3.12
2.06

63
Figure 37. Scan rate study of PTBTSif
Figure 38. Scan rate study of PSBSSif

64
Figure 39. Scan rate study of PBTBTSif
Figure 40. Scan rate study of PBSBSSif
3.2. Spectroelectrochemical Studies
Polymers were investigated in the p-doped spectra to obtain quantitative
information on their light absorption behaviors as a function of wavelength. For that
purpose, polymer solutions were coated onto ITO integrated glass surface and
absorption spectra of the polymers in the UV-Vis-NIR region was taken in a quartz

65
cell filled with tetrabutylammonium hexafluorophosphate in acetonitrile as the
electrolyte solution,
The first absorption peak that observed in the visible region correspond to π-π*
transition between the HOMO and LUMO energy levels of the polymer. PTBTSif,
PSBSSif, PBTBTSif and PBSBSSif showed maximum absorption peaks at 510 nm,
502 nm, 515 nm and 542 nm respectively. In comparison with PTBTSif, its
branched alkyl chained counterpart, PBTBTSif showed red shift absorption with 5
nm. Similarly, PBSBSSif bearing branched alkyl chains showed red shift absorption
with respect to the PSBSSif with 40 nm. The reason of this red shift is that π-π
stacking among the chains in the polymer backbone enhances due to the increase in
the intermolecular interactions. Normally, it is expected that the intermolecular
interactions weaken by the increase in the length of the alkyl chains. However, these
red shifts in the mentioned studies were resulted from the decrease in the re-
organization energy leading to smaller geometry relaxations. Moreover, onset
values of the wavelengths of the polymers were recorded as 634 nm, 721 nm, 697
nm and 766 nm in the same order for mentioned polymers. The optical band gap
values were measured from these onset values by the formula; Egop
= 1241/λonset.
These values were recorded as 1.96 eV, 1.72 eV, 1.78 eV and 1.62 eV for PTBTSif,
PSBSSif, PBTBTSif and PBSBSSif respectively. π-bridge effect was seen clearly
from band gap energies. Band gap of the selenophene based PSBSSif is lower than
that of the thiophene based PTBTSif with 0.24 eV and similar result was depicted
from the difference in band gap values of PBTBTSif and PBSBSSif which is lower
in energy by 0.16 eV. The reason of this effect is coming from the high lying
HOMO energy levels of the selenophene bearing π-bridges. In consequence of
electrochemical and spectroelectrochemical studies, it was seen that optical band
gap values of the polymers were lower than their electronic band gaps energies
resulted from electron binding energy.
Upon oxidation of the polymers with an external voltage, new bands called as
polaron (radical cation) and bipolaron (dication) bands form on the spectra. The
polaron bands formed in the visible region and bipolaron bands appeared in the NIR

66
(near infrared) region. As the oxidation potential increases absorbance intensity in
neutral state decreases while polaron or bipolaron band intensity enhance. All
polymers except PBSBSSif showed two maxima at around 700 nm and 1200 nm for
PTBTSif, 705 nm and 1203 nm for PSBSSif, 729 nm and 1350 nm for PBTBTSif
and 1200 nm for PBSBSSif. The colors of the polymers in each state were
determined by the International Commission on Illumination (CIE) system based on
three variables, Luminance (L), hue (a), saturation (b). In this system, L indicates
whether the color is dark or light, a scale is in the red-green range and b variable is
in the yellow-blue color range. PTBTSif was orange (L: 86.504, a: 4.861, b:
34.937) in its neutral state and upon oxidation the color shifted to yellow (L:
89.205, a: 1.098, b: 37.029) and in the tail of the polaron band it was shifted to
yellowish green (L: 81.401, a: -7.970, b: 2.804). PSBSSif was pink in its neutral
state and its color shifted to light blue under positive voltage. PBTBTSif was
appeared as reddish in its neutral state (L: 80.460, a: -3.659, b: 1.970) and by
applying the positive voltage on it the colors shifted to the light blue (L: 79.443, a:
-9.034, b: -0.800). PBSBSSif was light purple in its neutral state (L: 70.176, a: -
2.327, b: -1.644) and color become light blue (L: 85.149, a: -8.842, b: 1.768) due to
the formation of the new bands. The reason of decrease in the polaron band
intensity is that polarons were converted into dications namely bipolarons with
increasing potential. The electronic absorption spectra of the polymers were
demonstrated in Figures 41-44 and also spectroelectrochemical studies were
summarized in Table 2.

67
Figure 41. Electronic absorption spectra of the PTBTSif in UV-Vis-NIR regions
Figure 42. Electronic absorption spectra of the PSBSSif in UV-Vis-NIR regions

68
Figure 43. Electronic absorption spectra of the PBTBTSif in UV-Vis-NIR regions
Figure 44. Electronic absorption spectra of the PBSBSSif in UV-Vis-NIR regions

69
Table 2. Summary of the spectroelectochemical studies
λmax (nm) λonset (nm) Egop
(eV)
PTBTSif 510 634 1.96
PSBSSif 502 721 1.72
PBTBTSif 515 697 1.78
PBSBSSif 544 766 1.62
3.3. Kinetic Studies
Percent transmittance change and switching times of the polymers were investigated
by alternating oxidation and reduction processes with 5 seconds time internals for
each cycle. Optical contrast and switching time values were summarized in Table 3
and shown in Figures 45-48. Optical contrast values of PTBTSif were calculated as
24 % (510 nm), 10 % (700 nm) and 35 % (1220 nm). Its selenophene based
counterpart PSBSSif showed unstable cycles in visible region and optical contrast
value of this polymer was 12 % (1200 nm). The reason of this instability in visible
region for the latter polymer resulted from the fact that selenophene is less stable to
ambient atmosphere compare to thiophene. PBTBTSif exhibited 16 % (520 nm)
and 24 % (1350 nm) percent transmittances and optical contrast value for PBSBSSif
was measured as 23 % at 1200 nm. Optical contrast values enhances toward the
NIR region since molecules achieve more quinoid character in this region and so
stability of the polymers increases.

70
Figure 45. Change in the percent transmittance for PTBTSif
Figure 46. Change in the percent transmittance for PSBSSif
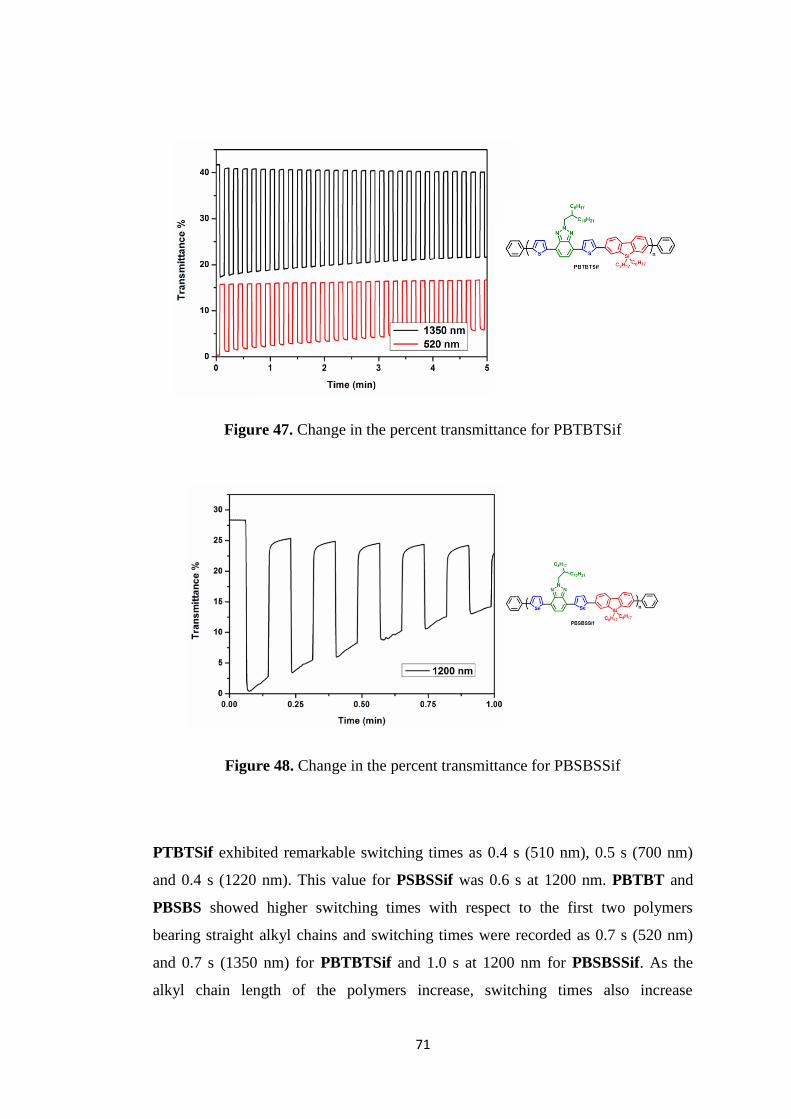
71
Figure 47. Change in the percent transmittance for PBTBTSif
Figure 48. Change in the percent transmittance for PBSBSSif
PTBTSif exhibited remarkable switching times as 0.4 s (510 nm), 0.5 s (700 nm)
and 0.4 s (1220 nm). This value for PSBSSif was 0.6 s at 1200 nm. PBTBT and
PBSBS showed higher switching times with respect to the first two polymers
bearing straight alkyl chains and switching times were recorded as 0.7 s (520 nm)
and 0.7 s (1350 nm) for PBTBTSif and 1.0 s at 1200 nm for PBSBSSif. As the
alkyl chain length of the polymers increase, switching times also increase

72
concordantly. This may be due to branched and long alkyl chains on the polymer
make difficult doping/de-doping mechanism occurring on the polymer backbone.
Table 3. Summary of the Chronoamperometric Studies
Optical Contrast
(∆T %)
Switching Time
(s)
PTBTSif 24 % (510 nm) 0.4
10 % (700 nm) 0.5
35 % (1220 nm) 0.4
PSBSSif 12 % (1200 nm) 0.6
PBTBTSif 16 % (520 nm) 0.7
24 % (1350 nm) 0.7
PBSBSSif 23 % (1200 nm) 1.0
3.4. Thermal Analyses
Thermogravimetry analyses of the polymers were performed under N2 atmosphere
using TGA and DSC. According to the TGA graphs, the first mass loss with 5 % of
PTBTSif was seen at around 430 °C and subsequently, the huge mass loss with 43
% until 800 °C which resulted from breaking of the covalent bonds on the polymer
backbone. PSBSSif is stable until 420 °C and at this temperature first 5 % mass loss
and from that point 63 % weight loss was seen until 800 °C. PBTBTSif exhibited 5
% mass loss at 430 °C and it lost 55 % its weight toward the 800 °C. PTBTSif and

73
PBTBTSif did not show glass-transition temperatures (Tg), which may deduced
from the rigid structure of the polymers. TGA and DSC results were showed in
Appendix B.
3.5. Photovoltaic Studies
Synthesized polymers were designed as the donor materials in the active layer for a
bulk heterojunction solar cell. Moieties bearing different alkyl chains were used to
enhance the solubility of the polymers. Normalized thin film light absorbance
spectrums were investigated for mixture of the polymer and PCBM in 1:2 ratio
showed in Figure 49 and for pristine polymers they are demonstrated in Figure 50.
Figure 49. Normalized film absorbance spectra for polymer and PCBM mixtures

74
Unsurprisingly, all polymers except PBSBSSif showed more broad absorptions in
mixture forms because of the enhanced light absorption capacity. The mixtures of
polymers and PCBM showed an additional peak absorbance on the left side of the
spectrum resulting from intermolecular charge transfer (ICT) between the donor
polymer and acceptor PCBM. Furthermore, PBSBSSif exhibited broadest
absorption in the visible region among the other polymers.
Figure 50. Relative thin film absorbance spectra of polymers
In photovoltaic studies, current density-voltage characteristics shown in Figures 51-
54 were investigated and power conversion efficiencies of the polymers were
measured at different conditions. In the light of these measurements, highest PCE
was reported for PBTBTSif as 2.57 %. The highest efficiency values of other
polymers were found as 1.78 % for PTBTSif, 1.85 % for PSBSSif and 1.81 % for
BSBSSif. Among the polymers PTBTSif showed deepest HOMO level however,
PBTBTSif has highest open circuit voltage value with 0.90 V because of the
formation of charge transfer states between the donor polymer and acceptor
fullerene. These polaron pairs can be seen by looking IPCE curves. A shoulder
appeared at around 700 nm for PTBTSif. In addition to this, fill factor value was

75
very low for PBTBTSif with respect to the other polymers despite the fact that
PBTBTSif has the highest current density and voltage characteristics. This resulted
due to charge transport properties of the cells. It means that mobility of the electron
and holes can be quite different from each other and this can lead to accumulation of
positively charge carriers on one electrode resulting low fill factor. Polymers
showed high current density values in 1:2 polymer/PCBM ratios due to the
enhancing morphology. Solar cell characteristics were summarized in Table 4.
Figure 51. Current-Voltage characteristics of the PTBTSif

76
Figure 52. Current-Voltage characteristics of the PSBSSif
Figure 53. Current-Voltage characteristics of the PBTBTSif

77
Figure 54. Current-Voltage characteristics of the PBSBSSif
The incident photon to current efficiency of cells prepared by 1:2 Polymer:PC71BM
ratio is shown in Figure 55. It was investigated in the range of 250-1000 nm by
using monochromatic light. The IPCE indicates the ratio of number of charges
collected by electrodes to the number of incident photons. The maximum IPCE for
PTBTSif was measured as 34 % at 375 nm. PSBSSif showed a maximum at 468
nm with 23 %. The lowest maximum IPCE value among the four polymers was
measured for PBTBTSif as 19 % at 472 nm. The maximum EQE in a cell
composed of PBSBSSif was measured as 22 % at 470 nm.

78
Figure 55. IPCE values of photovoltaic devices
Figure 56 demonstrates current density (J) - voltage (V) characteristics in the form
of logJ–logV for the ITO/PEDOT:PSS/copolymer:PCBM/Ca/Al devices and hole
mobility of the thin films were shown in Table 4. Although hole mobility of the
PSBSSif was higher than that of the PBSBSSif, FF (fill factor) values was almost
equal for these polymers. This is because the surface morphology of the PBSBSSif
is better than that of the PSBSSif as an evidence for decrease in the re-organization
energy in this polymer leading to highly ordered structure.

79
Figure 56. Logarithmic J-V curve for the polymers
Table 4. Summary of the photovoltaic studies

80
81
CHAPTER 4
CONCLUSION
Conjugated semiconducting polymers were synthesized by donor-acceptor-donor
(DAD) approach for optoelectronic applications. In this manner, monomers were
synthesized chemically by Stille coupling reactions and polymers were synthesized
chemically by Suzuki poly-condensation reactions. Polymers were investigated in
several aspects as electrochemically and optical. In addition to these investigations,
photovoltaic studies were conducted for all polymers.
In all these studies alkyl chain effect and π-bridge donor moiety effects were
explored separately. Polymers containing selenophene units in their backbone
showed lower band gap values with respect to polymers bearing thiophene π-bridge
units due to the increase in the energetic position of the HOMO energy level.
Furthermore, it was seen that optical band gaps of the polymers were lower than
that of the electronic band gaps because of the count for electron binding energy.
Another inference is that selenophene based polymers are oxidized easily and they
have lower stabilities in visible region with respect to the thiophene based ones. In
addition to this, polymers with branched alkyl chains showed red shift character in
comparison with polymers with straight alkyl chains due to the decrease in re-
organization energy leading to increase in the crystalline nature. Kinetic studies
exhibited that most stable polymers is PTBTSif and it showed good switching times
in the range of 0.4-0.5 seconds.
The bulk heterojunction solar cells were fabricated using four different polymers as
the donor materials. The highest PCE was reported as 2.57 % for PBTBTSif with
high Voc value (0.89 V), moderate Jsc value (6.43 mA/cm2) and low fill factor with

82
45 %. Other polymers also exhibited good PCE values as 1.78 % for PTBTSif, 1.85
% for PSBSSif and 1.81 % for PBSBSSif. Moreover, IPCE were obtained as 34 %
for PTBTSif at 375 nm, 23 % for PSBSSif at 468 nm, 19 % for PBTBTSif at 472
nm and 22 % for PBSBSSif at 470 nm. It is expected that solar cell efficiency for
these polymers will be increased by ongoing studies.

83
REFERENCES
[1] V. Devabhaktuni, Renewable and Sustainable Energy Reviews, 19, 2013, 555-
569
[2] US Department of Energy, International Energy Outlook 2013, Technical report
DOE/EIA-0484 (2013): http://www.eia.gov/forecasts/eio/ [last accessed on
September 2014]
[3] A. Slaoui and R.T. Collins, MRS Bulletin, 32, March 2007, 211-218
[4] W. Liptay, Angew. Chem. Internat. Edit., 8(3), 1969, 178-188
[5] R. J. Mortimer, Chemical Society Reviews, 26, 1997, 147-156
[6] A. A. Argun, P. H. Aubert, B. C. Thompson, I. Schwendeman, C.L. Gaupp, J.
Hwang, N.J. Pinto, D. B. Tanner, A. G. MacDiarmid, J. R. Reynolds, Chem. Mater.,
16, 2004, 4401-4412
[7] B. C. Thompson, P. Schottland, K. Zong, J. R. Reynolds, Chem. Mater., 12,
2000, 1563-1571
[8] D. D. Yao, R. A. Rani, A. P. O’Mullane, K. Kalantar-zadeh, J. Z. Ou, J. Phys.
Chem., 118, 2014, 10867-10873
[9] R. E. Hummel, K. H. Guenther, Handbook of Optical Properties, Volume I,
1995, p.110
[10] U. Bulut, A. Cirpan, Synthetic Metals, 148, 2005, 65-69
[11] E. F. Schubert, T. Gessmann, J. K. Kim, Encyclopedia of Chemical
Technology, 2005, p.1
[12] N. Yeh, J-P. Chung, Renewable and Sustainable Energy Reviews, 13, 2009,
2175-2180
[13] N. T. Kalyani, S. J. Dhoble, Renewable and Sustainable Energy Reviews, 16,
2012, 2696-2723
[14] A. P. Kulkarni, C. J. Tonzola, A. Babel, S. A. Jenekhe, Chem. Mater., 16,
2004, 4556-4573
[15] U. Mitschke, P. Baurle, J. Mater. Chem., 10, 2000, 1471-1507
[16] S. Reineke, Rev. Mod. Phys., 85, 2013, 1245-1293

84
[17] G. Horowitz, Adv. Mater., 10 (5), 1998, 365-377
[18] M. J. Malachowski and J. Zmija, Opto-Electronics Review, 18(2), 2010, 126-
136
[19] J. Zaumseil and H. Sirringhaus, Chem. Rev., 107, 2007, 1296-1323
[20] C. E. Fritts, Proc. Am. Assoc. Adv. Sci., 33, 1983, 97
[21] S. R. Wenham, M. A. Green, Prog. Photovolt: Res. Appl., 4, 1996, 3-33
[22] A. F. Fahrenbruch and R. H. Bube, ‘Fundamentals of Solar Cells’, Academic
Press, New York, p. 1-23, 1983
[23] S. E. Habas, A. S. Platt, F. A. M. van Hest, D. S. Ginley, Chem. Rev., 110,
2010, 6571-6594
[24] M. A. Green, K. Emery, Y. Hishikawa, W. Warta, E. D. Dunlop, Prog.
Photovolt: Res. Appl., 20, 2012, 12-20
[25] G. Horowitz, Adv. Mater., 2, 1998, 129
[26] N. Li, D. Baran, K. Forberich, F. Machui, T. Ameri, M. Turbiez, M. Carrasco-
Orozco, M. Drees, A. Facchetti, F. C. Krebs and C. J. Brabec, Energy Environ. Sci.,
6, 2013, 3407-3413
[27] D. Wöhrle and D. Meissner, Adv. Mater. 3 (3), 1991, 129-138
[28] S. Gunes and N. S. Sariciftci, Inorganica Chimica Acta, 361, 2008, 581-588
[29] M. Wright and A. Uddin, Solar Energy Materials & Solar Cells, 107, 2012, 87-
111
[30] T. Xu and Q. Qiao, Energy Environ. Sci., 4, 2011, 2700-2720
[31] H. Spanggaard and F. C. Krebs, Solar Energy Materials & Solar Cells, 83,
2004, 125-146
[32] H. P. Su, J. R. Schrieffer, S. Kivelson and A. J. Heeger, Rewievs of Modern
Physics, 60 (3), 1998, 781-851
[33] A. G. MacDiarmid, Angew. Chem. Int. Ed., 40, 2001, 2581-2590
[34] A. J. Heeger, Angew. Chem. Int. Ed., 40, 2001, 2591-2611
[35] H. Shirakawa, Angew. Chem. Int. Ed., 40, 2001, 2574-2580
[36] C. K. Chiang, C. R. Fincher, Y. W. Park, A. J. Heeger, H. Shirakawa, E. J.
Luis, S. C. Gau, A. G. MacDiarmid, Physical Review Letters, 39 (17), 1977,
1098-1101
[37] A. Facchetti, Chem. Mater. 23, 2011, 733-758

85
[39] J. M. Nunzi, C.R. Physique, 3, 2002, 523-542
[40] I. Schwendeman, PhD Thesis, University of Florida, 2002
[41] J. Rocali, Macromol. Rapid Commun., 28, 2007, 1761-1775
[42] Y. J. Cheng, S. H. Yang, C. S. Hsu, Chem. Rev., 109 (11), 2009, 5868-5923
[43] C. Winder and N. S. Sariciftci, J. Mater. Chem., 14, 2004, 1077-1086
[44] R. J. Waltman, J. Bargon and A. F. Diaz, J. Phys. Chem., 87 (8), 1983, 1459-
1463
[45] J. Roncali, R. Garreau, A. Yassar, P. Marque, F. Garnier and M. Lemaire, J.
Phys. Chem., 91 (27), 1987, 6706-6714
[46] R. D. McCullough, R. D. Lowe, M. Jayaraman and D. L. Anderson, J. Org.
Chem., 85, 1993, 904
[47] H. Zhou, L. Yang and W. You, Macromolecules, 45, 2012, 607-632
[48] A. Ajayaghosh, Chem. Soc.Rev., 32, 2003, 181-191
[49] D. Kumar and R. C. Sharma, Eur. Polym. J., 34, 1998, 1053-1060
[50] W. A. Gazotti, A. F. Nogueira, E. M. Girotto, L. Micaroni, M. Martini, S.
Neves and M. A. De-Paoli, ‘Handbook of Advanced Electronic and Photonic
Materials and Devices, Volume 10, 2001, p. 55
[51] J. L. Bredas, J. C. Scott, K. Yakushi and G. B. Street, Phys. Rev. B, 30, 1984,
1023-1025
[52] C. Deibel, T. Strobel and V. Dyakonov, Adv. Mater., 22, 2010, 4097-4111
[53] P. W. M. Blom, V. D. Mihailetchi, L. J. A. Koster and D. E Markov, Adv.
Mater., 19, 2007, 1551-1566
[54] J. L. Bredas, J. E. Norton, J. Cornil and V. Coropceanu, Accounts of Chemical
Research, 42 (11), 2009, 1691-1699
[55] A. Moliton ad J. M. Nunzi, Polym. Int.,55, 2006, 583-600
[56] H. Hoppe and N. S. Sariciftci, J. Mater. Res., 19 (7), 2004, 1924-1945
[57] S. Gunes, H. Neugebauer and N. S. Sariciftci, Chem. Rev., 107, 2007, 1324-
1338
[58] K. M. Coakley and M. D. McGehee, Chem. Mater., 16, 2004, 4533-4542
[59] L. M. Chen, Z. Hong, G. Li and Y. Yang, Adv. Mat., 21, 2009, 1434-1449
[60] I. Kim, PhD Thesis, Arizona State University, 2010
[61] A. J. Heeger, 25th
Anniversary Article, Adv. Mater., 2013
86
[62] X. Yang and A. Uddin, Renewable and Sustainable Energy Reviews, 30, 2014,
324-336
[63] E. Bundgaard and F. C. Krebs, Solar Energy Materials and Solar Cells, 91,
2007, 954-985
[64] E. Bundgaard, S. E. Shaheen, F. C. Krebs and D. S. Ginley, Solar Energy
Materials and Solar Cells, 91, 2007, 1631-1637
[65] S. H. Park, A. Roy, S. Beaupre, S. Cho, N. Coates, J. S. Moon, D. Moses, M.
Leclerc, K. Lee and A. J. Heeger
[66] G. Dennler, M. C. Scharber and C. J. Brabec, Adv. Mater., 21, 2009, 1323-
1338
[67] V. D. Mihailetchi, H. Xie, B. de Boer, L. J. A. Koster and P. W. M. Blom,
Adv. Funct. Mater., 16, 2006, 699-708
[68] C. J. Brabec, A. Cravino, D. Meissner, N. S. Sariciftci, T. Fromherz, M. T.
Rispens, L. Sanchez and J. C. Hummelen, Adv. Funct. Mater., 11 (5), 2001, 374-
380
[69] M. C. Scharber, D. Mühlbacher, M. Koppe, P. Denk, C. Waldauf, A. J. Heeger
and C. J. Brabec, Adv. Mater., 18, 2006, 789-794
[70] N. Miyaura and A. Suzuki, Chem. Rev., 95, 1995, 2457-2483
[71] P. Espinet and A. M. Echavarren, Angew. Chem. Int. Ed., 43, 2004, 4704-4734
[72] J. L. Banal, J. Subbiah, H. Graham, J. K. Lee, K. P. Ghiggino and W. W. H.
Wong, Polym. Chem., 4, 2013, 1077-1083
[73] W. W. H. Wong, J. Subbiah, S. R. Puniredd, W. Pisula, D. J. Jones and A. B.
Holmes, Polym. Chem., 5, 2014, 1258-1263
[74] A. Tanimoto and T. Yamamoto, Adv. Synth. Catal., 346, 2004, 1818-1823
[75] S. C. Price, A. C. Stuart, L. Yang, H. Zhou and W. You, J. Am. Chem. Soc.,
133, 2011, 4625-4631
[76] R. R. Gupta, T. M. Krygowski and M. K. Cyranski, Aromaticity in
Heterocyclic Compounds, p.292, 2009
[77] M. R. Detty, Chemistry of Heterocyclic Compounds, 1994, p.112
[78] L. Ye, S. Zhang, L. Huo, M. Zhang and J. Hou, Acc. Chem. Res. 47, 2014,
1595-1603

87
[79] X. Wang, Y. Sun, S. Chen, X. Guo, M. Zang, X. Li, Y. Li and H. Wang,
Macromolecules, 42, 2012, 1208-1216
[80] L. Dou, W. H. Cheng, J. Gao, C. C. Chen, J. You and Y. Yang, Adv. Mater.,
25, 2013, 825-831
[81] C. Duan, W. Cai, F. Huang, J. Zhang, M. Wang, T. Yang, C. Zhong, X. Gong
and Y. Cao, Macromolecules, 43, 2010, 5262-5268
[82] G. Lu, H. Usta, C. Risko, L. Wang, A. Facchetti, M. A. Ratner and T. J. Marks,
J. Am. Chem. Soc., 130, 2008, 7670-7685
[83] P. L. T. Boudreault, A. Michaud and M. Leclerc, Macromol. Rapid Commun.,
28, 2007, 2176-2179
[84] J. Song, C. Du, C. Li and Z. Bo, Journal of Polymer Science Part A: Polymer
Chemistry, 49, 2011, 4267-4274

88

89
APPENDIX A
NMR DATA
Figure 57. 1H NMR result of 4,7-dibromo-2-dodecyl-2H-benzo[d][1,2,3]triazole (2)
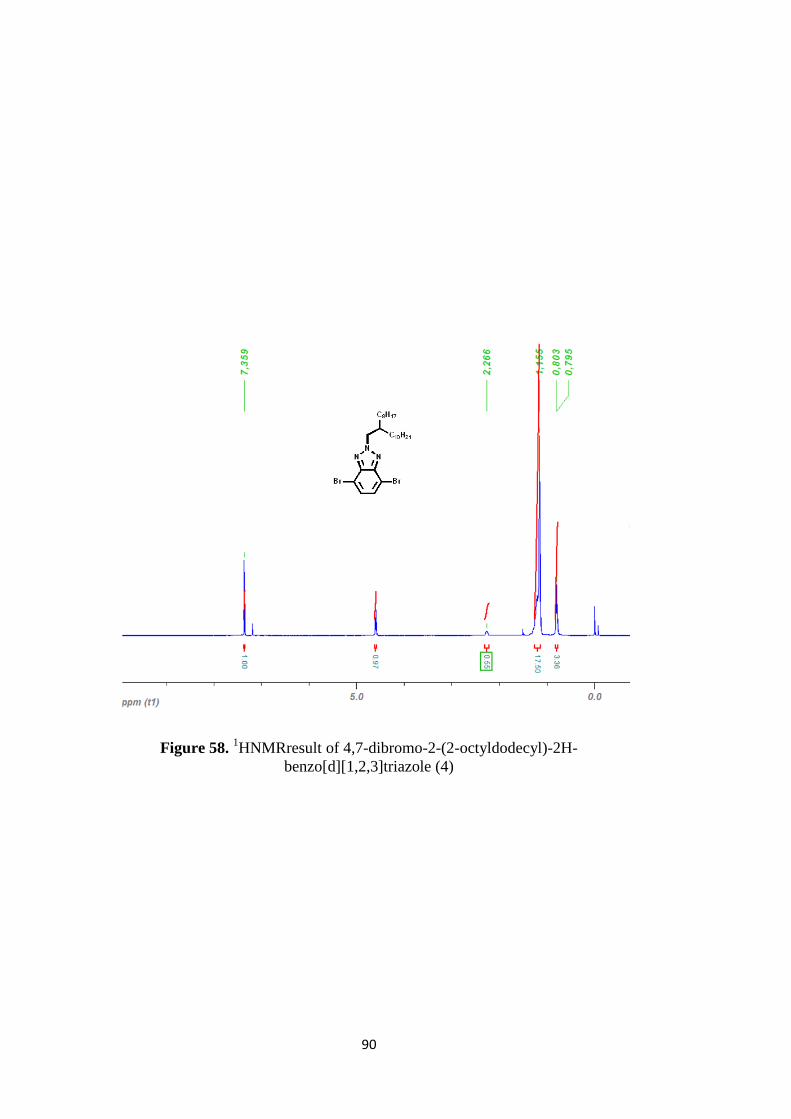
90
Figure 58. 1HNMRresult of 4,7-dibromo-2-(2-octyldodecyl)-2H-
benzo[d][1,2,3]triazole (4)

91
Figure 59. 1H NMR result of tributyl(thiophen-2-yl)stannane (5)

92
Figure 60. 1H NMR of tributyl(selenophen-2-yl)stannane (6)

93
Figure 61. 1H NMR result of 2-dodecyl-4,7-di(thiophen-2-yl)-2H-
benzo[d][1,2,3]triazole (7)
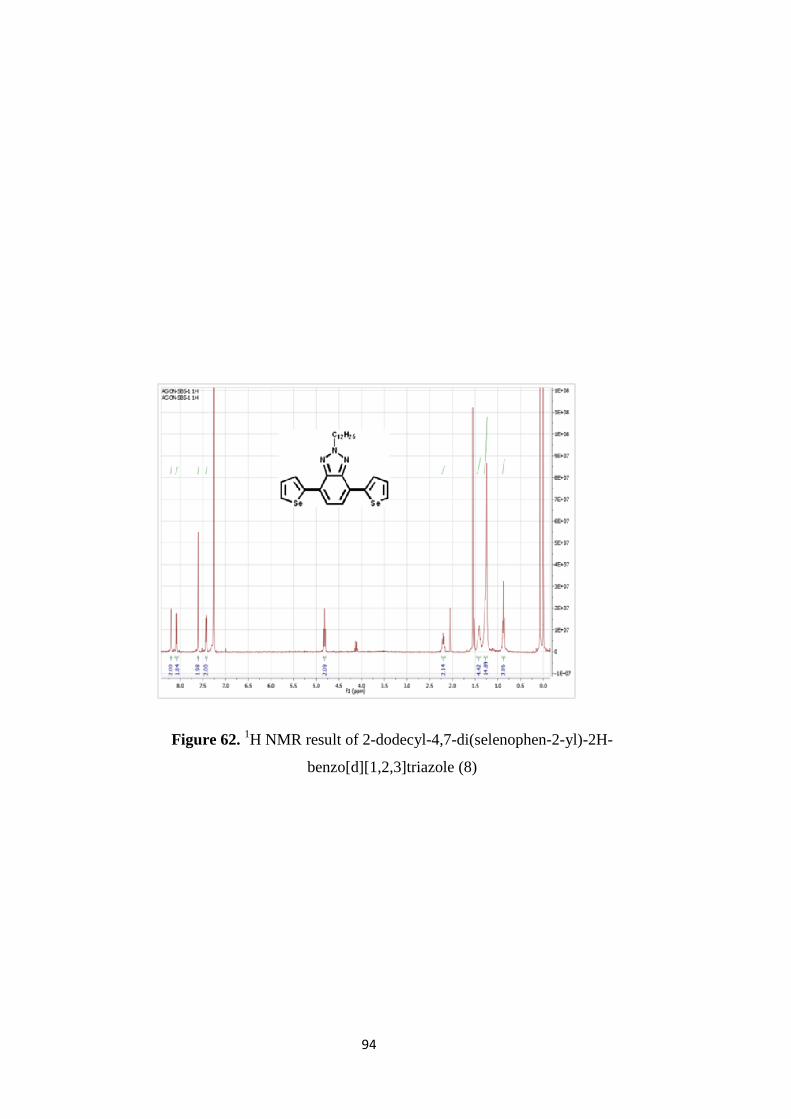
94
Figure 62. 1H NMR result of 2-dodecyl-4,7-di(selenophen-2-yl)-2H-
benzo[d][1,2,3]triazole (8)

95
Figure 63. 1H NMR result of Synthesis of 2-(2-octyldodecyl)-4,7-di(thiophen-2-yl)-2H-
benzo[d][1,2,3]triazole (9)

96
Figure 64. 1H NMR result of the 2-(2-octyldodecyl)-4,7-di(selenophen-2-yl)-2H-
benzo[d][1,2,3]triazole (10)

97
Figure 65. 1H NMR result of 4,7-bis(5-bromothiophen-2-yl)-2-dodecyl-2H-
benzo[d][1,2,3]triazole (11)

98
Figure 66. 13
C NMR result of 4,7-bis(5-bromothiophen-2-yl)-2-dodecyl-2H-
benzo[d][1,2,3]triazole (11)

99
Figure 67. 1H NMR Result of 4,7-bis(5-bromoselenophen-2-yl)-2-dodecyl-2H-
benzo[d][1,2,3]triazole (12)

100
Figure 68. 1H NMR result of 4,7-bis(5-bromothiophen-2-yl)-2-(2-octyldodecyl)-
2H-benzo[d][1,2,3]triazole (13)

101
Figure 69. 13
C NMR result of 4,7-bis(5-bromothiophen-2-yl)-2-(2-octyldodecyl)-
2H-benzo[d][1,2,3]triazole (13)

102
Figure 70. 1H NMR result of 4,7-bis(5-bromoselenophen-2-yl)-2-(2-octyldodecyl)-
2H-benzo[d][1,2,3]triazole (14)

103
Figure 71. 1H NMR result of the PTBTSif

104
Figure 72. 1H NMR result of PSBSSif

105
Figure 73. 1H NMR result of PBTBTSif

106
Figure 74. 1H NMR result of PBSBSSif

107
APPENDIX B
THERMAL ANALYSIS RESULTS
Figure 75. TGA result of PTBTSif

108
Figure 76. DSC result of PTBTSif
Figure 77. TGA result of PSBSSif

109
Figure 78. TGA result of PBTBTSif
Figure 79. DSC result of PBTBTSif