Embed Size (px)
Citation preview
Synthesis and Characterization of Pt Dendrimer-EncapsulatedNanoparticles: Effect of the Template on Nanoparticle Formation
Marc R. Knecht,†,⊥ Michael G. Weir,† V. Sue Myers,† William D. Pyrz,‡ Heechang Ye,†
Valeri Petkov,*,§ Douglas J. Buttrey,*,‡ Anatoly I. Frenkel,*,| and Richard M. Crooks*,†
Department of Chemistry and Biochemistry, Texas Materials Institute, Center for Nano- and MolecularScience and Technology, The UniVersity of Texas at Austin, 1 UniVersity Station, A5300, Austin,
Texas 78712-0165, Center for Catalytic Science and Technology, Department of Chemical Engineering,UniVersity of Delaware, Newark, Delaware 19716, Department of Physics, 203 Dow Science, CentralMichigan UniVersity, Mt. Pleasant, Michigan 48859, and Department of Physics, YeshiVa UniVersity,
245 Lexington AVenue, New York, New York 10016
ReceiVed February 11, 2008. ReVised Manuscript ReceiVed June 10, 2008
In this article, we provide a detailed description of the synthesis and properties of Pt dendrimer-encapsulated nanoparticles (DENs) prepared using sixth-generation, hydroxyl-terminated, poly(amidoam-ine) (PAMAM) dendrimers (G6-OH) and three different PtCl4
2-/G6-OH ratios: 55, 147, and 240. Resultsobtained from UV-vis spectroscopy, X-ray photoelectron spectroscopy, electron microscopy, X-rayabsorption spectroscopy, and high-energy X-ray diffraction show that only a fraction of the Pt2+/dendrimerprecursors are reduced by BH4
- and that the reduction process is highly heterogeneous. That is, afterreduction each Pt2+/dendrimer precursor complex is either fully reduced, to yield a DEN having a sizeand structure consistent with the original PtCl4
2-/dendrimer ratio used for the synthesis, or the precursoris not reduced at all. This result is consistent with an autocatalytic process that entails slow formation ofa nascent catalytic Pt seed within the dendrimer, followed by rapid, catalytic reduction of nearby Pt2+
ions. Details concerning the formation of the Pt2+/dendrimer precursor are also discussed.
Introduction
We report the atomic-level physical characterization of Ptdendrimer-encapsulated nanoparticles (DENs)1 with an em-phasis on the relationship between the Pt2+/dendrimercomposite starting material and the structural properties ofthe corresponding DENs. Here, Pt2+ refers to any form ofPt2+ regardless of its ligand field. This is a timely study,because it has recently been found that the use of slightlydifferent synthetic methods for preparing Pt DENs leads todifferent products.2–5 The purpose of this paper is to reconcilethese reports using a combination of time-resolved UV-visspectroscopy, X-ray photoelectron spectroscopy (XPS), high-resolution transmission electron microscopy (HRTEM),extended X-ray absorption fine structure (EXAFS) spectros-copy, and high-energy X-ray diffraction (XRD) coupled with
pair-distribution function (PDF) analysis. The combinationof these analytical methods, which provide complementaryinformation, is important because DENs are good modelsfor studying the effect of nanoparticle size, composition, andstructure on catalytic activity.6–17 However, to extract usefulcorrelations of this sort, it is necessary that there be consensuson the DEN structure.
The key findings of this study are as follows. First, time-resolved UV-vis spectroscopy indicates that the Pt speciesrequired for dendrimer binding is PtCln(H20)4-n
2-n, wheren e 3. Second, the UV-vis and XPS data indicate thatreduction of the Pt2+/dendrimer complexes with BH4
- isincomplete. Third, EXAFS results indicate relatively lowPt-Pt coordination numbers (CNs) that are consistent with
* To whom correspondence should be addressed. E-mail: [email protected](R.M.C.); [email protected] (D.J.B.); [email protected] (V.P.);[email protected] (A.I.F.). Phone: 512-475-8674(R.M.C.); 302-831-2034(D.J.B.); 989-774-3395(V.P.); 212-340-7827(A.I.F.).
† The University of Texas at Austin.‡ University of Delaware.§ Central Michigan University.| Yeshiva University.⊥ Present address: Department of Chemistry, University of Kentucky, 125
Chemistry Physics Building, Lexington, KY 40506.(1) Scott, R. W. J.; Wilson, O. M.; Crooks, R. M. J. Phys. Chem. B 2005,
109, 692–704.(2) Ye, H.; Scott, R. W. J.; Crooks, R. M. Langmuir 2004, 20, 2915–
2920.(3) Ye, H.; Crooks, R. M. J. Am. Chem. Soc. 2005, 127, 4930–4934.(4) Ozturk, O.; Black, T. J.; Perrine, K.; Pizzolato, K.; Williams, C. T.;
Parsons, F. W.; Ratliff, J. S.; Gao, J.; Murphy, C. J.; Xie, H.; Ploehn,H. J.; Chen, D. A. Langmuir 2005, 21, 3998–4006.
(5) Alexeev, O. S.; Siani, A.; Lafaye, G.; Williams, C. T.; Ploehn, H. J.;Amiridis, M. D. J. Phys. Chem. B 2006, 110, 24903–24914.
(6) Garcia-Martinez, J. C.; Lezutekong, R.; Crooks, R. M. J. Am. Chem.Soc. 2005, 127, 5097–5103.
(7) Hoover, N. N.; Auten, B. J.; Chandler, B. D. J. Phys. Chem. B 2006,110, 8606–8612.
(8) Narayanan, R.; El-Sayed, M. A. J. Phys. Chem. B 2004, 108, 8572–8580.
(9) Niu, Y.; Yeung, L. K.; Crooks, R. M. J. Am. Chem. Soc. 2001, 123,6840–6846.
(10) Scott, R. W. J.; Wilson, O. M.; Oh, S.-K.; Kenik, E. A.; Crooks, R. M.J. Am. Chem. Soc. 2004, 126, 15583–15591.
(11) Wilson, O. M.; Knecht, M. R.; Garcia-Martinez, J. C.; Crooks, R. M.J. Am. Chem. Soc. 2006, 128, 4510–4511.
(12) Chandler, B. D.; Gilbertson, J. D. Top. Organomet. Chem. 2006, 20,97–120.
(13) Vijayaraghavan, G.; Stevenson, K. J. Langmuir 2007, 23, 5279–5282.(14) Ye, H.; Crooks, R. M. J. Am. Chem. Soc. 2007, 129, 3627–3633.(15) Korkosz, R. J.; Gilbertson, J. D.; Prasfika, K. S.; Chandler, B. D. Catal.
Today 2007, 122, 370–377.(16) Ye, H.; Crooks, J. A.; Crooks, R. M. Langmuir 2007, 23, 11901–
11906.(17) Astruc, D. Nanoparticles and Catalysis; Wiley: New York, 2007.
5218 Chem. Mater. 2008, 20, 5218–5228
10.1021/cm8004198 CCC: $40.75 2008 American Chemical SocietyPublished on Web 07/30/2008
the UV-vis and XPS data. Fourth, HRTEM and XRD/PDFanalyses indicate that Pt DENs possess a face-centered cubic(fcc)-type structure and sizes that correlate very well to theinitial PtCl4
2-/dendrimer ratio used for the synthesis. Tosummarize, results obtained from TEM and XRD/PDFindicate the presence of fully reduced Pt DENs, whereasUV-vis, XPS, and EXAFS spectroscopic data are consistentwith incomplete reduction of the Pt2+/dendrimer precursors.Here we show how these seemingly inconsistent results canbe unified with a single model that invokes a bimodaldistribution of products.
The DEN synthesis is carried out in two steps. First, metalions are introduced to a solution of dendrimers, which resultsin complexation of the ions with interior tertiary amines ofthe dendrimer. Second, the encapsulated metal ions arechemically reduced, which usually results in formation ofzerovalent DENs. With the use of this method, monometallicDENs (Au, Pd, Pt, Cu, Ag, Ni, and Fe),1,13,15,18–26 bimetallicalloy and core-shell DENs (PdPt, PdAu, AuAg, andPtCu),7,10,12,27–30 and semiconducting quantum dots (CdS)have been prepared.31 These materials, which range in sizefrom just a few atoms32,33 to perhaps 1000 atoms, are oftennearlymonodisperseinsize,composition,andstructure.6–13,34,35
Moreover, because the dendrimers are highly permeable anddo not passivate the surface of the encapsulated nanoparticles,DENs are also good model catalysts.1,6,12
There are some interesting differences between Pt DENsand other monometallic DENs.3,5,34 Most notably, the PtDEN synthesis requires a significantly longer period of timeto complete (∼4 days) compared to other types of DENs(typically ∼1 h).18,19 On the basis of several recent reports,we believe the rate-limiting process in the DEN synthesis iscomplexation between Pt2+ and tertiary amines within thedendrimer.2,4,5,34,36 PtCl4
2- is typically the source of Pt2+
for the synthesis of Pt DENs, and in this case the complex-
ation process likely involves two steps: hydrolysis of one ormore Pt-Cl bonds followed by Pt-amine bond formation.Pellechia et al. have reported NMR data suggesting thepresence of numerous mono- and bidentate binding motifsbetween Pt2+ and sites within second- and fourth-generation,hydroxyl-terminated poly(amidoamine) (PAMAM) dendrim-ers (G2-OH and G4-OH, respectively).36 We believe theirmodel is generally correct, but they did not invoke thePtCl4
2- hydrolysis step which we will show here to be arequirement for complexation. Indeed, this sequence ofreactions (Pt-Cl bond hydrolysis followed by reaction withan amine) has been previously observed for relatedcompounds.37,38 Recent EXAFS results from Alexeev et al.have provided support for the NMR results.5 This group alsostudied the reactivity of PtCl4
2- with water in the absenceof dendrimer and interpreted the results in terms of hydrolysisof two Pt-Cl bonds.5
Another aspect of the Pt DEN synthesis that distinguishesit from other types of DENs is that a larger excess ofreductant (BH4
-) is required and that the reduction must becarried out in a sealed container.3 These requirements arenecessary to ensure that a partial pressure of H2, which is abyproduct of the aqueous BH4
- reduction step, is retainedwithin the reaction vessel. In solutions saturated with N2 orair, conversion of the Pt2+/dendrimer complexes to zerova-lent DENs does not occur.5 However, even when thereduction is carried out under favorable conditions, we2 andothers4 have observed that complete reduction of intraden-drimer Pt2+ may still not take place. For example, thepositions of the Pt(4f7/2) peaks in XPS spectra are shiftedpositive from the positions corresponding to zerovalent, bulkPt. Such shifts may correspond to the presence of unreducedPt2+ 4 or from quantum effects associated with these verysmall metal nanoparticles.2,39–41
In this article, we provide a detailed description of thesynthesis and properties of Pt DENs prepared using sixth-generation, hydroxyl-terminated, PAMAM dendrimers(G6-OH) and three different PtCl4
2-/G6-OH ratios: 55,147, and 240. Our principal finding is that only a fraction ofthe total number of Pt2+ ions encapsulated within thedendrimers is reduced, but that the reduction process is highlyheterogeneous. In other words, after reduction each Pt2+/dendrimer precursor is either fully reduced, to yield a DENhaving a size and structure consistent with the originalPtCl4
2-/dendrimer ratio used for the synthesis, or theprecursor is not reduced at all. That is, the product resultingfrom exposure to BH4
- is a bimodal mixture of precursorthat is fully reduced and precursor that is not reduced at all(Scheme 1). This counterintuitive result is consistent withan autocatalytic process that entails slow formation of anascent catalytic Pt seed within the dendrimer, followed byrapid, catalytic reduction of nearby Pt2+ ions.
(18) Zhao, M.; Sun, L.; Crooks, R. M. J. Am. Chem. Soc. 1998, 120, 4877–4878.
(19) Scott, R. W. J.; Ye, H.; Henriquez, R. R.; Crooks, R. M. Chem. Mater.2003, 15, 3873–3878.
(20) Knecht, M. R.; Garcia-Martinez, J. C.; Crooks, R. M. Chem. Mater.2006, 18, 5039–5044.
(21) Knecht, M. R.; Crooks, R. M. New J. Chem. 2007, 31, 1349–1353.(22) Kim, Y.-G.; Oh, S.-K.; Crooks, R. M. Chem. Mater. 2004, 16, 167–
172.(23) Grohn, F.; Bauer, B. J.; Akpalu, Y. A.; Jackson, C. L.; Amis, E. J.
Macromolecules 2000, 33, 6042–6050.(24) Mark, S. S.; Bergkvist, M.; Yang, X.; Angert, E. R.; Batt, C. A.
Biomacromolecules 2006, 7, 1884–1897.(25) Zhu, H.; Zhu, Y.; Yang, X.; Li, C. Chem. Lett. 2006, 35, 326–327.(26) Tran, M. L.; Zvyagin, A. V.; Plakhotnik, T. Chem. Commun. 2006,
2006, 2400–2401.(27) Knecht, M. R.; Weir, M. G.; Frenkel, A. I.; Crooks, R. M. Chem.
Mater. 2008, 20, 1019–1028.(28) Scott, R. W. J.; Datye, A. K.; Crooks, R. M. J. Am. Chem. Soc. 2003,
125, 3708–3709.(29) Scott, R. W. J.; Sivadinarayana, C.; Wilson, O. M.; Yan, Z.; Goodman,
D. W.; Crooks, R. M. J. Am. Chem. Soc. 2005, 127, 1380–1381.(30) Wilson, O. M.; Scott, R. W. J.; Garcia-Martinez, J. C.; Crooks, R. M.
J. Am. Chem. Soc. 2005, 127, 1015–1024.(31) Lemon, B. I.; Crooks, R. M. J. Am. Chem. Soc. 2000, 122, 12886–
12887.(32) Zheng, J.; Dickson, R. M. J. Am. Chem. Soc. 2002, 124, 13982–13983.(33) Zheng, J.; Petty, J. T.; Dickson, R. M. J. Am. Chem. Soc. 2003, 125,
7780–7781.(34) Zhao, M.; Crooks, R. M. Angew. Chem., Int. Ed. 1999, 38, 364–366.(35) Yeung, L. K.; Crooks, R. M. Nano Lett. 2001, 1, 14–17.(36) Pellechia, P. J.; Gao, J.; Gu, Y.; Ploehn, H. J.; Murphy, C. J. Inorg.
Chem. 2004, 43, 1421–1428.
(37) Lippard, S. J.; Berg, J. M. Principals of Bioinorganic Chemistry; 1sted.; University Science Books: Mill Valley, CA, 1994.
(38) Rochon, F. D.; Fleurent, L. Inorg. Chim. Acta 1988, 143, 81–87.(39) Fu, X.; Wang, Y.; Wu, N.; Gui, L.; Tang, Y. J. Colloid Interface Sci.
2001, 243, 326–330.(40) Eberhardt, W.; Fayet, P.; Cox, D. M.; Fu, Z.; Kaldor, A.; Sherwood,
R.; Sondericker, D. Phys. ReV. Lett. 1990, 64, 780–783.(41) You, T.; Niwa, O.; Horiuchi, T.; Tomita, M.; Iwasaki, Y.; Ueno, Y.;
Hirono, S. Chem. Mater. 2002, 14, 4796–4799.
5219Chem. Mater., Vol. 20, No. 16, 2008Pt Dendrimer-Encapsulated Nanoparticles
Experimental Section
Chemicals. G6-OH dendrimers were purchased from Den-dritech, Inc. (Midland, MI) as 10.0 wt % solutions in MeOH. Priorto use, the dendrimer stock solution was dried under vacuum andthen redissolved in sufficient deionized water to make a 100 µMsolution. The K2PtCl4, NaBH4, and KCl were purchased fromSigma-Aldrich (Milwaukee, WI) and used as received. Aqueoussolutions were prepared using 18 MΩ · cm Milli-Q water (Millipore,Bedford, MA).
Synthesis of Pt DENs. Pt DENs were prepared using previouslydescribed methods.3 Briefly, an aqueous solution of G6-OH wasprepared. To this solution, 55, 147, or 240 equiv of a freshlyprepared 100 mM K2PtCl4 aqueous solution was added to yieldthe G6-OH(Pt2+)n (n ) 55, 147, or 240) Pt2+/dendrimer com-plexes, respectively. Unless otherwise indicated, the solutions wereallowed to stir for 3.0 days to ensure complete complexation ofPt2+ to the tertiary amines present within the dendrimer interior.Note that there are 254 tertiary amines within G6-OH. Theseprecursor complexes were then reduced using at least a 10-foldmolar excess of NaBH4 from a freshly prepared aqueous 0.50 Mstock solution. The final concentration of dendrimer in all caseswas 10.0 µM. Reduction was allowed to proceed for 24.0 h in asealed reaction vessel prior to subsequent analysis. Powder samplesof the DENs were obtained by lyophilization (Freezone 12,Labconco Corp.).
Characterization. UV-vis spectra were obtained using aphotodiode array UV-vis spectrometer (model 8453, AgilentTechnologies) and 1.00 or 0.200 cm quartz cuvettes. All spectrawere background-corrected using a spectrum obtained from anaqueous 10.0 µM dendrimer solution. XPS data were collected usinga Kratos Axis Ultra DLD spectrometer having a monochromaticAl KR X-ray source. Spectra were collected in charge-compensationmode at a pass energy of 20 eV, a resolution of 0.1 eV, and adwell time of 1.00 s. The samples were prepared by submergingAu-coated Si wafers in a freshly prepared 10.0 µM DEN solutionfor 3.0 h.42 The DEN-modified wafers were then removed fromthe solution and dried under vacuum. To correct for charging, peaklocations were referenced to the most intense carbon peak assumedto be present at 286.0 eV. This peak has previously been associatedwith the C-N bond.1,2
TEM analyses were performed using a JEOL 2010F microscopeequipped with a Schottky field emission gun operated at 200 keVwith an ultrahigh resolution pole piece providing a point resolutionof 0.19 nm. Annular dark-field (ADF) imaging was completed usinga 0.7 nm probe at a camera length of 20 cm. Samples were preparedusing 200- or 300-mesh Cu grids coated with an ultrathin carbon
film (Electron Microscopy Sciences, UltraThin carbon-coated Cugrids). Samples were prepared by placing a Cu grid onto filter paper,applying 1-5 drops of the appropriate Pt DEN solution, andallowing the specimen to dry in air.
EXAFS spectra were obtained at beamline X18B of the NationalSynchrotron Light Source at the Brookhaven National Laboratory.The samples were measured either in solution or dried to a powderand then dispersed on adhesive tape. The tape samples were thenfolded multiple times to ensure sample homogeneity. All sampleswere measured in transmission mode, and data analysis wassubsequently completed using the IFEFFIT software package.43
High-energy XRD experiments were carried out at the 11-ID-Bbeamline (Advanced Photon Source, Argonne National Laboratory)using synchrotron radiation of 90.48 keV (λ ) 0.1372 Å) at roomtemperature. Both wet and dry Pt DENs were measured. Thescattered radiation was collected with a large-area detector (GeneralElectric). The experimental XRD data were reduced to atomic PDFsusing the function G(r) ) 4r(F(r) - F0), where F(r) and F0 arethe local and average atomic number densities, respectively, and ris the radial distance.
Results and Discussion
UV-Vis Spectroscopic Analysis. Formation of the Pt2+/dendrimer complex is the first step of the DEN synthesis.K2PtCl4 is usually the source of Pt2+, but previous studieshave shown that under most conditions it hydrolyzes inwater.5,44 To determine the form of Pt2+ that binds to thetertiary amine groups of the dendrimer, we carried out time-resolved UV-vis studies of the PtCl4
2- hydrolysis and thesubsequent reaction between the dendrimer and Pt2+ (steps1 and 2, Scheme 1). Recall that here Pt2+ represents anyform of unreduced Pt2+. Parts a-c of Figure 1 show time-resolved spectra obtained from 110, 294, and 480 µMaqueous PtCl4
2- solutions, respectively. These are the sameconcentrations used for the synthesis of 2.00 µM DENsolutions containing 55, 147, and 240 Pt atoms, respectively(vide infra).
Figure 1a confirms hydrolysis of PtCl42- present at the
concentration used to prepare G6-OH(Pt2+)55. The blackspectrum, taken immediately after solution preparation,reveals absorbances at 215 and 230 nm, which are charac-teristic of PtCl4
2-.44 The intensity of these peaks decreasesfor ∼15 h and then achieves a nearly constant value (Figure1d). The decrease in absorbance is directly attributable tothe hydrolysis of PtCl4
2- to yield PtCln(H20)4-n2-n (ne 3).44
Another important feature of these spectra is that at times>24 h, the absorbance at high wavelengths increases. Webelieve this is attributable to absorption and scattering oflight associated with aggregation and/or polymerization ofhydrolyzed PtCln(H20)4-n
2-n.36 Indeed, a black precipitateis clearly observed after 72 h.
Spectra similar to those obtained for 110 µM areobserved at 294 (Figure 1b) and 480 µM Pt2+ (Figure1c). The initial and final (t > 20 h) absorbances of allthree solutions (Figure 1d) scale approximately linearlywith the initial concentration of PtCl4
2-. The slightdeviation from Beer’s law is attributable to the overlapping
(42) Tokuhisa, H.; Zhao, M.; Baker, L. A.; Phan, V. T.; Dermody, D. L.;Garcia, M. E.; Peez, R. F.; Crooks, R. M.; Mayer, T. M. J. Am. Chem.Soc. 1998, 120, 4492–4501.
(43) Newville, M. J. Synchrotron Radiat. 2001, 8, 322–324.(44) Elding, L. I.; Olsson, L. F. J. Phys. Chem. 1978, 82, 69–74.
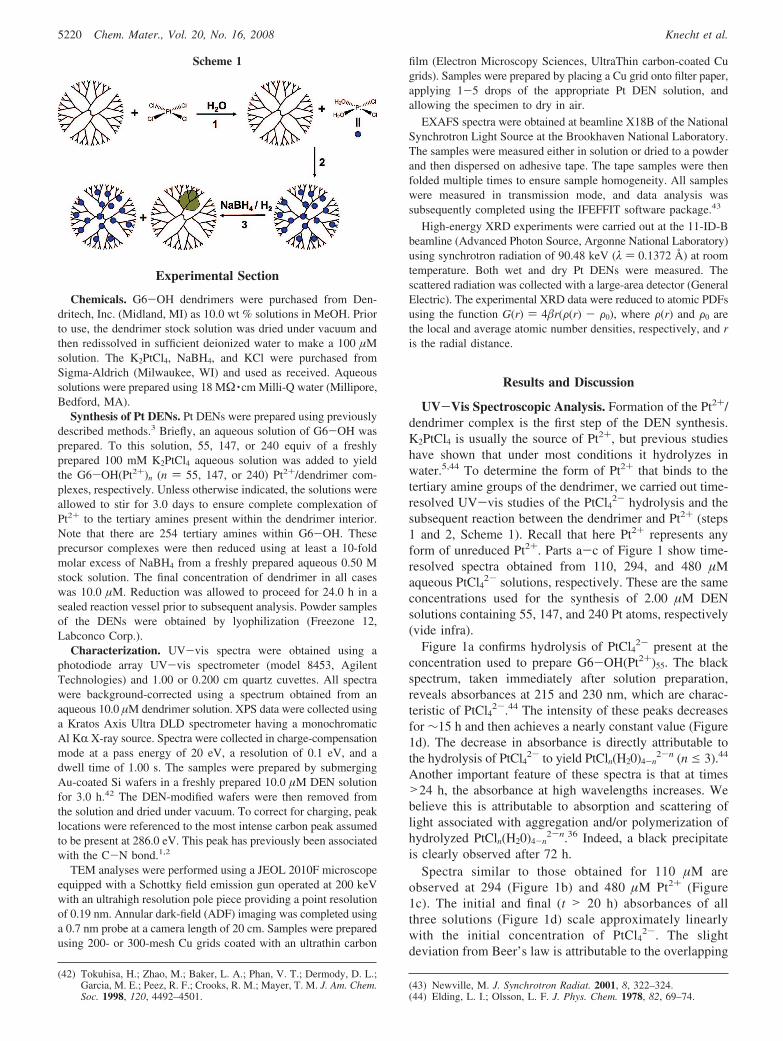
Scheme 1
5220 Chem. Mater., Vol. 20, No. 16, 2008 Knecht et al.
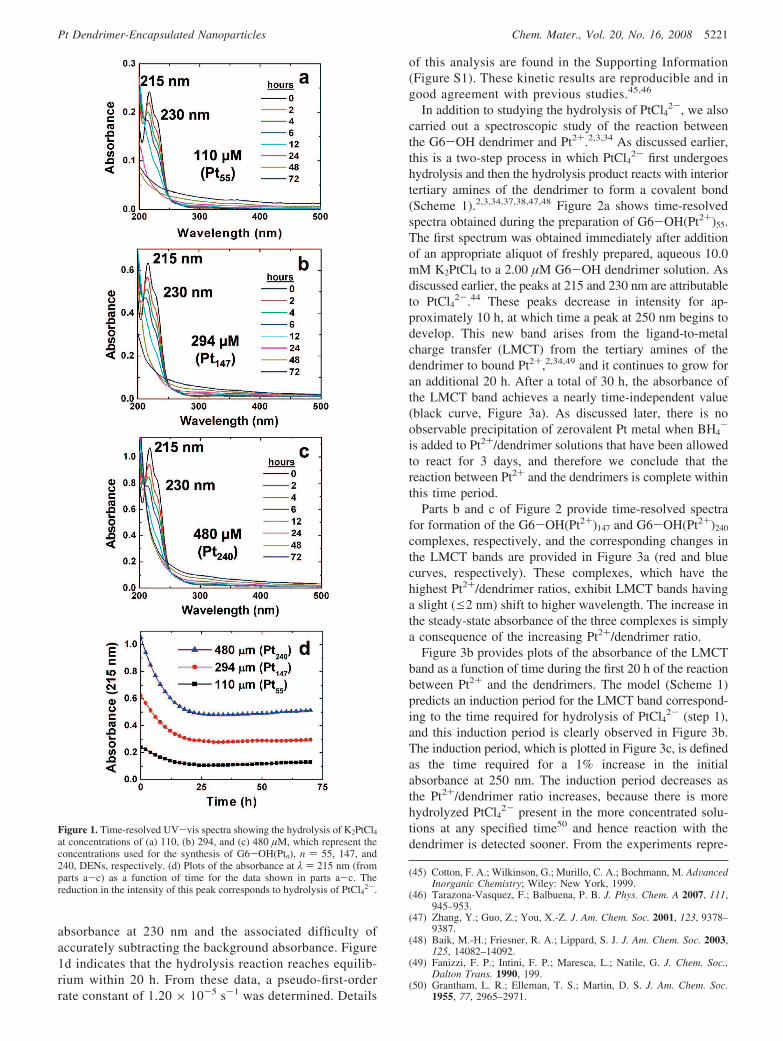
absorbance at 230 nm and the associated difficulty ofaccurately subtracting the background absorbance. Figure1d indicates that the hydrolysis reaction reaches equilib-rium within 20 h. From these data, a pseudo-first-orderrate constant of 1.20 × 10⁻⁵ s-1 was determined. Details
of this analysis are found in the Supporting Information(Figure S1). These kinetic results are reproducible and ingood agreement with previous studies.45,46
In addition to studying the hydrolysis of PtCl42-, we also
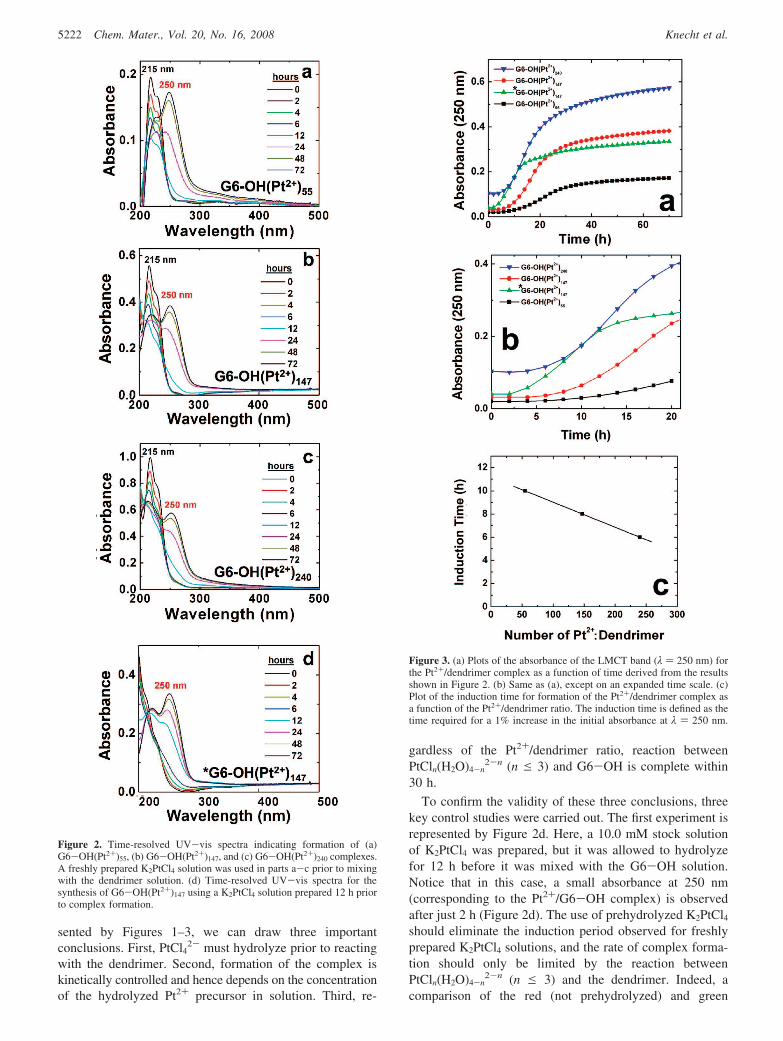
carried out a spectroscopic study of the reaction betweenthe G6-OH dendrimer and Pt2+.2,3,34 As discussed earlier,this is a two-step process in which PtCl4
2- first undergoeshydrolysis and then the hydrolysis product reacts with interiortertiary amines of the dendrimer to form a covalent bond(Scheme 1).2,3,34,37,38,47,48 Figure 2a shows time-resolvedspectra obtained during the preparation of G6-OH(Pt2+)55.The first spectrum was obtained immediately after additionof an appropriate aliquot of freshly prepared, aqueous 10.0mM K2PtCl4 to a 2.00 µM G6-OH dendrimer solution. Asdiscussed earlier, the peaks at 215 and 230 nm are attributableto PtCl4
2-.44 These peaks decrease in intensity for ap-proximately 10 h, at which time a peak at 250 nm begins todevelop. This new band arises from the ligand-to-metalcharge transfer (LMCT) from the tertiary amines of thedendrimer to bound Pt2+,2,34,49 and it continues to grow foran additional 20 h. After a total of 30 h, the absorbance ofthe LMCT band achieves a nearly time-independent value(black curve, Figure 3a). As discussed later, there is noobservable precipitation of zerovalent Pt metal when BH4
-
is added to Pt2+/dendrimer solutions that have been allowedto react for 3 days, and therefore we conclude that thereaction between Pt2+ and the dendrimers is complete withinthis time period.
Parts b and c of Figure 2 provide time-resolved spectrafor formation of the G6-OH(Pt2+)147 and G6-OH(Pt2+)240
complexes, respectively, and the corresponding changes inthe LMCT bands are provided in Figure 3a (red and bluecurves, respectively). These complexes, which have thehighest Pt2+/dendrimer ratios, exhibit LMCT bands havinga slight (e2 nm) shift to higher wavelength. The increase inthe steady-state absorbance of the three complexes is simplya consequence of the increasing Pt2+/dendrimer ratio.
Figure 3b provides plots of the absorbance of the LMCTband as a function of time during the first 20 h of the reactionbetween Pt2+ and the dendrimers. The model (Scheme 1)predicts an induction period for the LMCT band correspond-ing to the time required for hydrolysis of PtCl4
2- (step 1),and this induction period is clearly observed in Figure 3b.The induction period, which is plotted in Figure 3c, is definedas the time required for a 1% increase in the initialabsorbance at 250 nm. The induction period decreases asthe Pt2+/dendrimer ratio increases, because there is morehydrolyzed PtCl4
2- present in the more concentrated solu-tions at any specified time50 and hence reaction with thedendrimer is detected sooner. From the experiments repre-
(45) Cotton, F. A.; Wilkinson, G.; Murillo, C. A.; Bochmann, M. AdVancedInorganic Chemistry; Wiley: New York, 1999.
(46) Tarazona-Vasquez, F.; Balbuena, P. B. J. Phys. Chem. A 2007, 111,945–953.
(47) Zhang, Y.; Guo, Z.; You, X.-Z. J. Am. Chem. Soc. 2001, 123, 9378–9387.
(48) Baik, M.-H.; Friesner, R. A.; Lippard, S. J. J. Am. Chem. Soc. 2003,125, 14082–14092.
(49) Fanizzi, F. P.; Intini, F. P.; Maresca, L.; Natile, G. J. Chem. Soc.,Dalton Trans. 1990, 199.
(50) Grantham, L. R.; Elleman, T. S.; Martin, D. S. J. Am. Chem. Soc.1955, 77, 2965–2971.
Figure 1. Time-resolved UV-vis spectra showing the hydrolysis of K2PtCl4at concentrations of (a) 110, (b) 294, and (c) 480 µM, which represent theconcentrations used for the synthesis of G6-OH(Ptn), n ) 55, 147, and240, DENs, respectively. (d) Plots of the absorbance at λ ) 215 nm (fromparts a-c) as a function of time for the data shown in parts a-c. Thereduction in the intensity of this peak corresponds to hydrolysis of PtCl42-.
5221Chem. Mater., Vol. 20, No. 16, 2008Pt Dendrimer-Encapsulated Nanoparticles
sented by Figures 1–3, we can draw three importantconclusions. First, PtCl4
2- must hydrolyze prior to reactingwith the dendrimer. Second, formation of the complex iskinetically controlled and hence depends on the concentrationof the hydrolyzed Pt2+ precursor in solution. Third, re-
gardless of the Pt2+/dendrimer ratio, reaction betweenPtCln(H2O)4-n
2-n (n e 3) and G6-OH is complete within30 h.
To confirm the validity of these three conclusions, threekey control studies were carried out. The first experiment isrepresented by Figure 2d. Here, a 10.0 mM stock solutionof K2PtCl4 was prepared, but it was allowed to hydrolyzefor 12 h before it was mixed with the G6-OH solution.Notice that in this case, a small absorbance at 250 nm(corresponding to the Pt2+/G6-OH complex) is observedafter just 2 h (Figure 2d). The use of prehydrolyzed K2PtCl4
should eliminate the induction period observed for freshlyprepared K2PtCl4 solutions, and the rate of complex forma-tion should only be limited by the reaction betweenPtCln(H2O)4-n
2-n (n e 3) and the dendrimer. Indeed, acomparison of the red (not prehydrolyzed) and green
Figure 2. Time-resolved UV-vis spectra indicating formation of (a)G6-OH(Pt2+)55, (b) G6-OH(Pt2+)147, and (c) G6-OH(Pt2+)240 complexes.A freshly prepared K2PtCl4 solution was used in parts a-c prior to mixingwith the dendrimer solution. (d) Time-resolved UV-vis spectra for thesynthesis of G6-OH(Pt2+)147 using a K2PtCl4 solution prepared 12 h priorto complex formation.
Figure 3. (a) Plots of the absorbance of the LMCT band (λ ) 250 nm) forthe Pt2+/dendrimer complex as a function of time derived from the resultsshown in Figure 2. (b) Same as (a), except on an expanded time scale. (c)Plot of the induction time for formation of the Pt2+/dendrimer complex asa function of the Pt2+/dendrimer ratio. The induction time is defined as thetime required for a 1% increase in the initial absorbance at λ ) 250 nm.
5222 Chem. Mater., Vol. 20, No. 16, 2008 Knecht et al.
(prehydrolyzed) curves in Figure 3, parts a and b, clearlyindicates that formation of the Pt2+/dendrimer complexoccurs more quickly when PtCl4
2- is prehydrolyzed.A second control experiment was carried out in which
freshly prepared K2PtCl4 and G6-OH solutions were mixedin an effort to prepare G6-OH(Pt2+)147, but this time 1.00M KCl was also present. It is known that under theseconditions the common-ion effect prevents hydrolysis ofPtCl4
2-.45 Time-resolved spectra corresponding to thisexperiment are provided in the Supporting Information(Figure S2). No changes in these spectra are observed evenafter 72 h, confirming that no reaction takes place betweenPt2+ and the dendrimer in the absence of PtCl4
2- hydrolysis(Scheme 1).
The third control experiment was intended to confirm thatall, or nearly all, of the Pt2+ reacts irreversibly with thedendrimer. This experiment was carried out as follows. First,two solutions were prepared consisting of hydrolyzed PtCl42-
and G6-OH(Pt2+)147. Second, these solutions were passedthrough Millipore Centricon centrifugal filters having amolecular weight cutoff of 10 kDa. Third, the UV-visabsorbance spectra of the original solutions were comparedto those of the filtrates. The resulting spectra are providedin the Supporting Information (Figure S3). For hydrolyzedPt2+, nearly all of the Pt2+ is recovered in the filtrate, butfor the Pt2+/dendrimer complex the amount of Pt2+ observedin the filtrate is below the detection limit. Accordingly, weconclude that all, or nearly all, Pt2+ is strongly associatedwith the dendrimer.
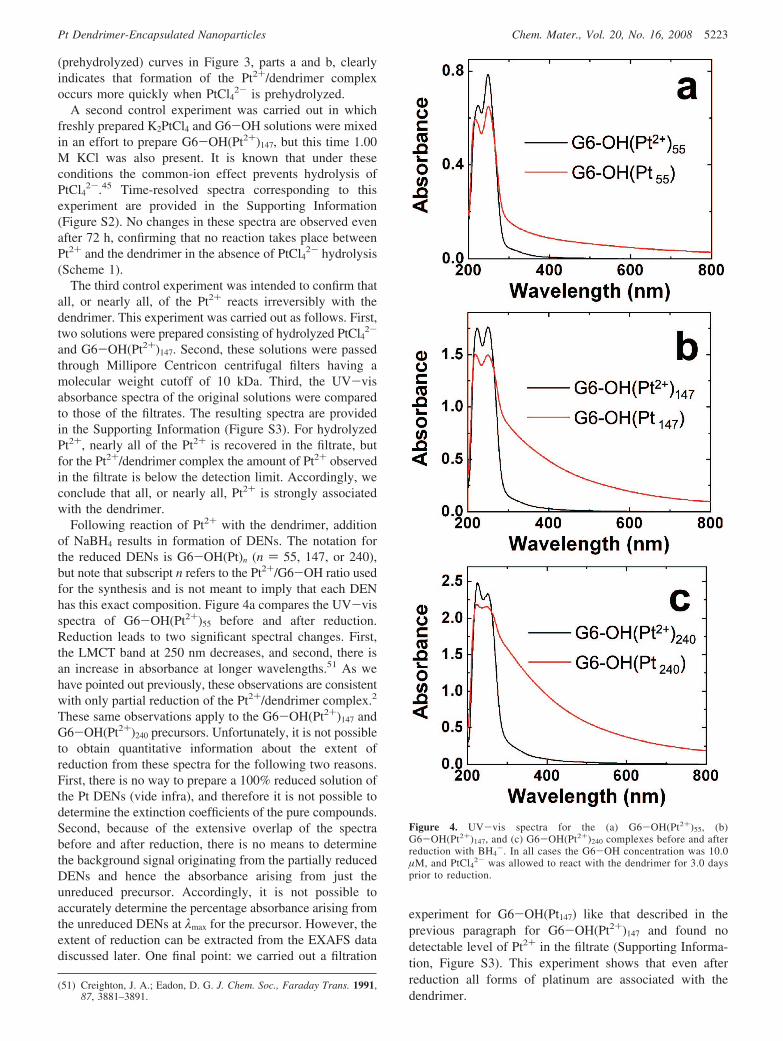
Following reaction of Pt2+ with the dendrimer, additionof NaBH4 results in formation of DENs. The notation forthe reduced DENs is G6-OH(Pt)n (n ) 55, 147, or 240),but note that subscript n refers to the Pt2+/G6-OH ratio usedfor the synthesis and is not meant to imply that each DENhas this exact composition. Figure 4a compares the UV-visspectra of G6-OH(Pt2+)55 before and after reduction.Reduction leads to two significant spectral changes. First,the LMCT band at 250 nm decreases, and second, there isan increase in absorbance at longer wavelengths.51 As wehave pointed out previously, these observations are consistentwith only partial reduction of the Pt2+/dendrimer complex.2
These same observations apply to the G6-OH(Pt2+)147 andG6-OH(Pt2+)240 precursors. Unfortunately, it is not possibleto obtain quantitative information about the extent ofreduction from these spectra for the following two reasons.First, there is no way to prepare a 100% reduced solution ofthe Pt DENs (vide infra), and therefore it is not possible todetermine the extinction coefficients of the pure compounds.Second, because of the extensive overlap of the spectrabefore and after reduction, there is no means to determinethe background signal originating from the partially reducedDENs and hence the absorbance arising from just theunreduced precursor. Accordingly, it is not possible toaccurately determine the percentage absorbance arising fromthe unreduced DENs at λmax for the precursor. However, theextent of reduction can be extracted from the EXAFS datadiscussed later. One final point: we carried out a filtration
experiment for G6-OH(Pt147) like that described in theprevious paragraph for G6-OH(Pt2+)147 and found nodetectable level of Pt2+ in the filtrate (Supporting Informa-tion, Figure S3). This experiment shows that even afterreduction all forms of platinum are associated with thedendrimer.
(51) Creighton, J. A.; Eadon, D. G. J. Chem. Soc., Faraday Trans. 1991,87, 3881–3891.
Figure 4. UV-vis spectra for the (a) G6-OH(Pt2+)55, (b)G6-OH(Pt2+)147, and (c) G6-OH(Pt2+)240 complexes before and afterreduction with BH4
-. In all cases the G6-OH concentration was 10.0µM, and PtCl4
2- was allowed to react with the dendrimer for 3.0 daysprior to reduction.
5223Chem. Mater., Vol. 20, No. 16, 2008Pt Dendrimer-Encapsulated Nanoparticles
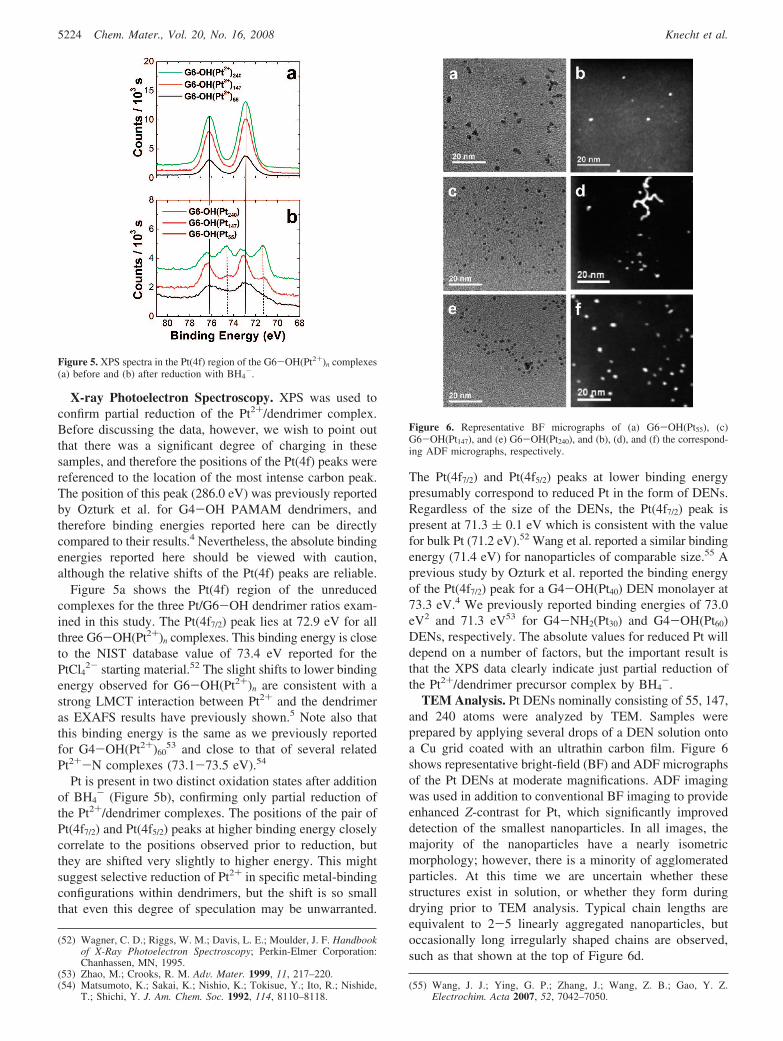
X-ray Photoelectron Spectroscopy. XPS was used toconfirm partial reduction of the Pt2+/dendrimer complex.Before discussing the data, however, we wish to point outthat there was a significant degree of charging in thesesamples, and therefore the positions of the Pt(4f) peaks werereferenced to the location of the most intense carbon peak.The position of this peak (286.0 eV) was previously reportedby Ozturk et al. for G4-OH PAMAM dendrimers, andtherefore binding energies reported here can be directlycompared to their results.4 Nevertheless, the absolute bindingenergies reported here should be viewed with caution,although the relative shifts of the Pt(4f) peaks are reliable.
Figure 5a shows the Pt(4f) region of the unreducedcomplexes for the three Pt/G6-OH dendrimer ratios exam-ined in this study. The Pt(4f7/2) peak lies at 72.9 eV for allthree G6-OH(Pt2+)n complexes. This binding energy is closeto the NIST database value of 73.4 eV reported for thePtCl4
2- starting material.52 The slight shifts to lower bindingenergy observed for G6-OH(Pt2+)n are consistent with astrong LMCT interaction between Pt2+ and the dendrimeras EXAFS results have previously shown.5 Note also thatthis binding energy is the same as we previously reportedfor G4-OH(Pt2+)60
53 and close to that of several relatedPt2+-N complexes (73.1-73.5 eV).54
Pt is present in two distinct oxidation states after additionof BH4
- (Figure 5b), confirming only partial reduction ofthe Pt2+/dendrimer complexes. The positions of the pair ofPt(4f7/2) and Pt(4f5/2) peaks at higher binding energy closelycorrelate to the positions observed prior to reduction, butthey are shifted very slightly to higher energy. This mightsuggest selective reduction of Pt2+ in specific metal-bindingconfigurations within dendrimers, but the shift is so smallthat even this degree of speculation may be unwarranted.
The Pt(4f7/2) and Pt(4f5/2) peaks at lower binding energypresumably correspond to reduced Pt in the form of DENs.Regardless of the size of the DENs, the Pt(4f7/2) peak ispresent at 71.3 ( 0.1 eV which is consistent with the valuefor bulk Pt (71.2 eV).52 Wang et al. reported a similar bindingenergy (71.4 eV) for nanoparticles of comparable size.55 Aprevious study by Ozturk et al. reported the binding energyof the Pt(4f7/2) peak for a G4-OH(Pt40) DEN monolayer at73.3 eV.4 We previously reported binding energies of 73.0eV2 and 71.3 eV53 for G4-NH2(Pt30) and G4-OH(Pt60)DENs, respectively. The absolute values for reduced Pt willdepend on a number of factors, but the important result isthat the XPS data clearly indicate just partial reduction ofthe Pt2+/dendrimer precursor complex by BH4
-.TEM Analysis. Pt DENs nominally consisting of 55, 147,
and 240 atoms were analyzed by TEM. Samples wereprepared by applying several drops of a DEN solution ontoa Cu grid coated with an ultrathin carbon film. Figure 6shows representative bright-field (BF) and ADF micrographsof the Pt DENs at moderate magnifications. ADF imagingwas used in addition to conventional BF imaging to provideenhanced Z-contrast for Pt, which significantly improveddetection of the smallest nanoparticles. In all images, themajority of the nanoparticles have a nearly isometricmorphology; however, there is a minority of agglomeratedparticles. At this time we are uncertain whether thesestructures exist in solution, or whether they form duringdrying prior to TEM analysis. Typical chain lengths areequivalent to 2-5 linearly aggregated nanoparticles, butoccasionally long irregularly shaped chains are observed,such as that shown at the top of Figure 6d.
(52) Wagner, C. D.; Riggs, W. M.; Davis, L. E.; Moulder, J. F. Handbookof X-Ray Photoelectron Spectroscopy; Perkin-Elmer Corporation:Chanhassen, MN, 1995.
(53) Zhao, M.; Crooks, R. M. AdV. Mater. 1999, 11, 217–220.(54) Matsumoto, K.; Sakai, K.; Nishio, K.; Tokisue, Y.; Ito, R.; Nishide,
T.; Shichi, Y. J. Am. Chem. Soc. 1992, 114, 8110–8118.(55) Wang, J. J.; Ying, G. P.; Zhang, J.; Wang, Z. B.; Gao, Y. Z.
Electrochim. Acta 2007, 52, 7042–7050.
Figure 5. XPS spectra in the Pt(4f) region of the G6-OH(Pt2+)n complexes(a) before and (b) after reduction with BH4
-.
Figure 6. Representative BF micrographs of (a) G6-OH(Pt55), (c)G6-OH(Pt147), and (e) G6-OH(Pt240), and (b), (d), and (f) the correspond-ing ADF micrographs, respectively.
5224 Chem. Mater., Vol. 20, No. 16, 2008 Knecht et al.
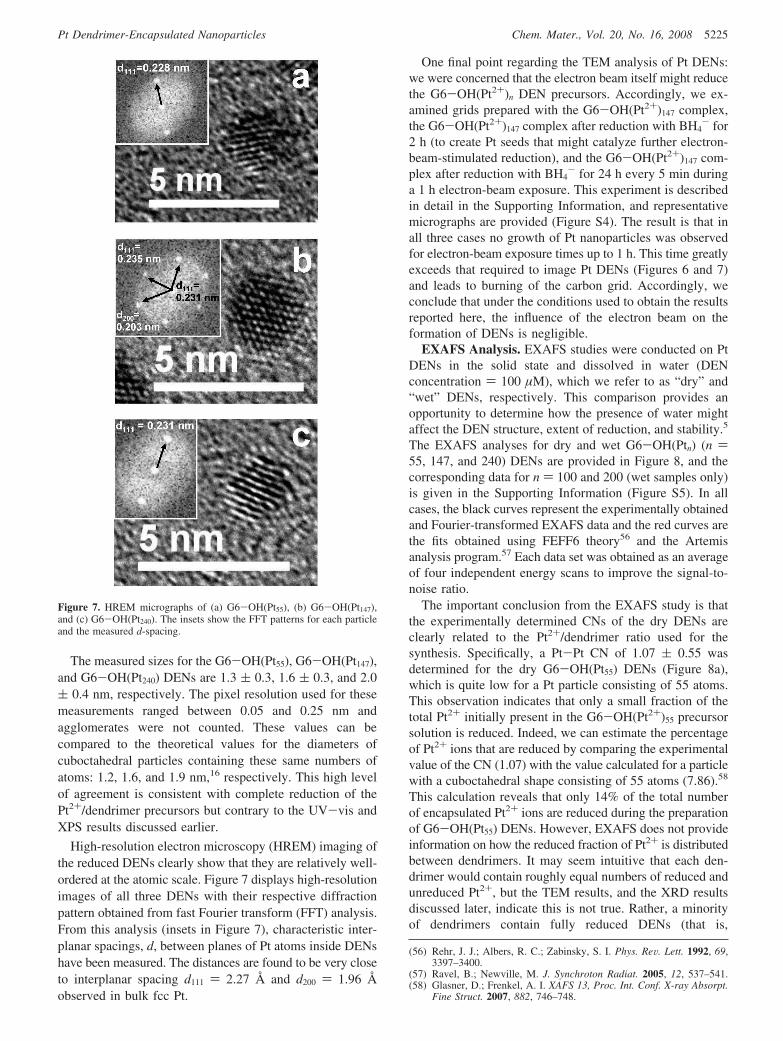
The measured sizes for the G6-OH(Pt55), G6-OH(Pt147),and G6-OH(Pt240) DENs are 1.3 ( 0.3, 1.6 ( 0.3, and 2.0( 0.4 nm, respectively. The pixel resolution used for thesemeasurements ranged between 0.05 and 0.25 nm andagglomerates were not counted. These values can becompared to the theoretical values for the diameters ofcuboctahedral particles containing these same numbers ofatoms: 1.2, 1.6, and 1.9 nm,16 respectively. This high levelof agreement is consistent with complete reduction of thePt2+/dendrimer precursors but contrary to the UV-vis andXPS results discussed earlier.
High-resolution electron microscopy (HREM) imaging ofthe reduced DENs clearly show that they are relatively well-ordered at the atomic scale. Figure 7 displays high-resolutionimages of all three DENs with their respective diffractionpattern obtained from fast Fourier transform (FFT) analysis.From this analysis (insets in Figure 7), characteristic inter-planar spacings, d, between planes of Pt atoms inside DENshave been measured. The distances are found to be very closeto interplanar spacing d111 ) 2.27 Å and d200 ) 1.96 Åobserved in bulk fcc Pt.
One final point regarding the TEM analysis of Pt DENs:we were concerned that the electron beam itself might reducethe G6-OH(Pt2+)n DEN precursors. Accordingly, we ex-amined grids prepared with the G6-OH(Pt2+)147 complex,the G6-OH(Pt2+)147 complex after reduction with BH4
- for2 h (to create Pt seeds that might catalyze further electron-beam-stimulated reduction), and the G6-OH(Pt2+)147 com-plex after reduction with BH4
- for 24 h every 5 min duringa 1 h electron-beam exposure. This experiment is describedin detail in the Supporting Information, and representativemicrographs are provided (Figure S4). The result is that inall three cases no growth of Pt nanoparticles was observedfor electron-beam exposure times up to 1 h. This time greatlyexceeds that required to image Pt DENs (Figures 6 and 7)and leads to burning of the carbon grid. Accordingly, weconclude that under the conditions used to obtain the resultsreported here, the influence of the electron beam on theformation of DENs is negligible.
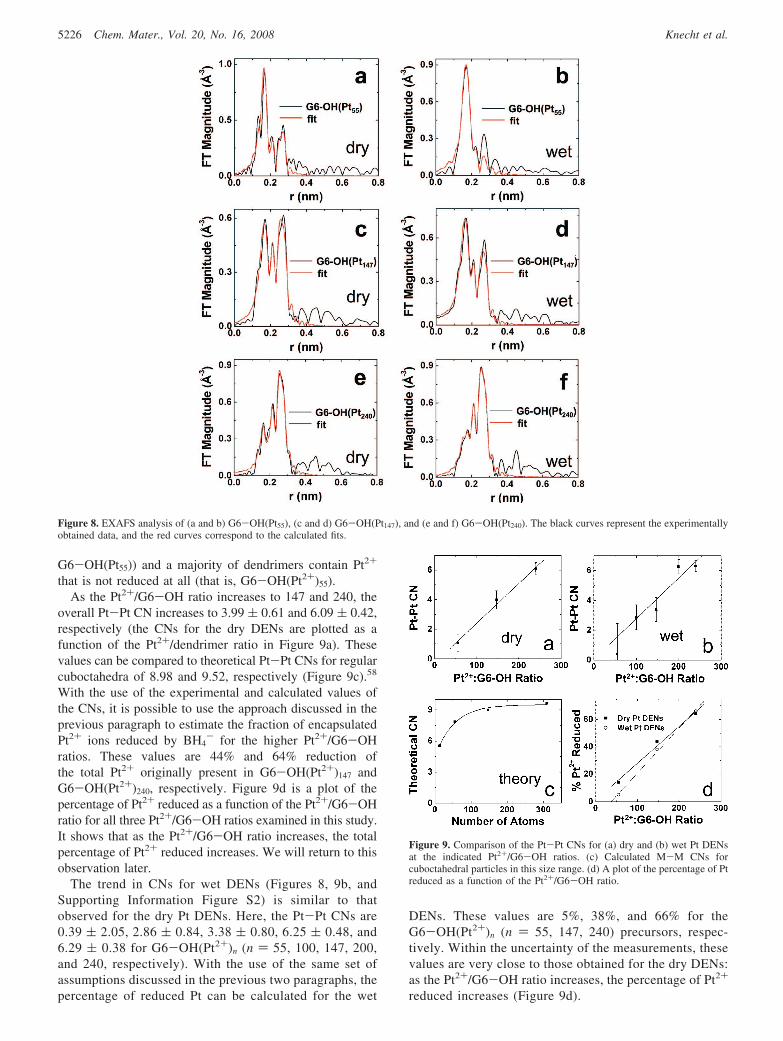
EXAFS Analysis. EXAFS studies were conducted on PtDENs in the solid state and dissolved in water (DENconcentration ) 100 µM), which we refer to as “dry” and“wet” DENs, respectively. This comparison provides anopportunity to determine how the presence of water mightaffect the DEN structure, extent of reduction, and stability.5
The EXAFS analyses for dry and wet G6-OH(Ptn) (n )55, 147, and 240) DENs are provided in Figure 8, and thecorresponding data for n ) 100 and 200 (wet samples only)is given in the Supporting Information (Figure S5). In allcases, the black curves represent the experimentally obtainedand Fourier-transformed EXAFS data and the red curves arethe fits obtained using FEFF6 theory56 and the Artemisanalysis program.57 Each data set was obtained as an averageof four independent energy scans to improve the signal-to-noise ratio.
The important conclusion from the EXAFS study is thatthe experimentally determined CNs of the dry DENs areclearly related to the Pt2+/dendrimer ratio used for thesynthesis. Specifically, a Pt-Pt CN of 1.07 ( 0.55 wasdetermined for the dry G6-OH(Pt55) DENs (Figure 8a),which is quite low for a Pt particle consisting of 55 atoms.This observation indicates that only a small fraction of thetotal Pt2+ initially present in the G6-OH(Pt2+)55 precursorsolution is reduced. Indeed, we can estimate the percentageof Pt2+ ions that are reduced by comparing the experimentalvalue of the CN (1.07) with the value calculated for a particlewith a cuboctahedral shape consisting of 55 atoms (7.86).58
This calculation reveals that only 14% of the total numberof encapsulated Pt2+ ions are reduced during the preparationof G6-OH(Pt55) DENs. However, EXAFS does not provideinformation on how the reduced fraction of Pt2+ is distributedbetween dendrimers. It may seem intuitive that each den-drimer would contain roughly equal numbers of reduced andunreduced Pt2+, but the TEM results, and the XRD resultsdiscussed later, indicate this is not true. Rather, a minorityof dendrimers contain fully reduced DENs (that is,
(56) Rehr, J. J.; Albers, R. C.; Zabinsky, S. I. Phys. ReV. Lett. 1992, 69,3397–3400.
(57) Ravel, B.; Newville, M. J. Synchroton Radiat. 2005, 12, 537–541.(58) Glasner, D.; Frenkel, A. I. XAFS 13, Proc. Int. Conf. X-ray Absorpt.
Fine Struct. 2007, 882, 746–748.
Figure 7. HREM micrographs of (a) G6-OH(Pt55), (b) G6-OH(Pt147),and (c) G6-OH(Pt240). The insets show the FFT patterns for each particleand the measured d-spacing.
5225Chem. Mater., Vol. 20, No. 16, 2008Pt Dendrimer-Encapsulated Nanoparticles
G6-OH(Pt55)) and a majority of dendrimers contain Pt2+
that is not reduced at all (that is, G6-OH(Pt2+)55).As the Pt2+/G6-OH ratio increases to 147 and 240, the
overall Pt-Pt CN increases to 3.99 ( 0.61 and 6.09 ( 0.42,respectively (the CNs for the dry DENs are plotted as afunction of the Pt2+/dendrimer ratio in Figure 9a). Thesevalues can be compared to theoretical Pt-Pt CNs for regularcuboctahedra of 8.98 and 9.52, respectively (Figure 9c).58
With the use of the experimental and calculated values ofthe CNs, it is possible to use the approach discussed in theprevious paragraph to estimate the fraction of encapsulatedPt2+ ions reduced by BH4
- for the higher Pt2+/G6-OHratios. These values are 44% and 64% reduction ofthe total Pt2+ originally present in G6-OH(Pt2+)147 andG6-OH(Pt2+)240, respectively. Figure 9d is a plot of thepercentage of Pt2+ reduced as a function of the Pt2+/G6-OHratio for all three Pt2+/G6-OH ratios examined in this study.It shows that as the Pt2+/G6-OH ratio increases, the totalpercentage of Pt2+ reduced increases. We will return to thisobservation later.
The trend in CNs for wet DENs (Figures 8, 9b, andSupporting Information Figure S2) is similar to thatobserved for the dry Pt DENs. Here, the Pt-Pt CNs are0.39 ( 2.05, 2.86 ( 0.84, 3.38 ( 0.80, 6.25 ( 0.48, and6.29 ( 0.38 for G6-OH(Pt2+)n (n ) 55, 100, 147, 200,and 240, respectively). With the use of the same set ofassumptions discussed in the previous two paragraphs, thepercentage of reduced Pt can be calculated for the wet
DENs. These values are 5%, 38%, and 66% for theG6-OH(Pt2+)n (n ) 55, 147, 240) precursors, respec-tively. Within the uncertainty of the measurements, thesevalues are very close to those obtained for the dry DENs:as the Pt2+/G6-OH ratio increases, the percentage of Pt2+
reduced increases (Figure 9d).
Figure 8. EXAFS analysis of (a and b) G6-OH(Pt55), (c and d) G6-OH(Pt147), and (e and f) G6-OH(Pt240). The black curves represent the experimentallyobtained data, and the red curves correspond to the calculated fits.
Figure 9. Comparison of the Pt-Pt CNs for (a) dry and (b) wet Pt DENsat the indicated Pt2+/G6-OH ratios. (c) Calculated M-M CNs forcuboctahedral particles in this size range. (d) A plot of the percentage of Ptreduced as a function of the Pt2+/G6-OH ratio.
5226 Chem. Mater., Vol. 20, No. 16, 2008 Knecht et al.
We attempted to induce a higher percentage of Pt2+
reduction by bubbling H2 through the G6-OH(Pt100) andG6-OH(Pt200) solutions of wet DENs for 20 h after the initialEXAFS analysis. The fitting analyses of these data areprovided in the Supporting Information (Figure S5). How-ever, no change in the Pt-Pt CN is observed for eithersample, indicating that no further reduction occurs for theseDENs in the presence of a saturated, aqueous H2 solution.
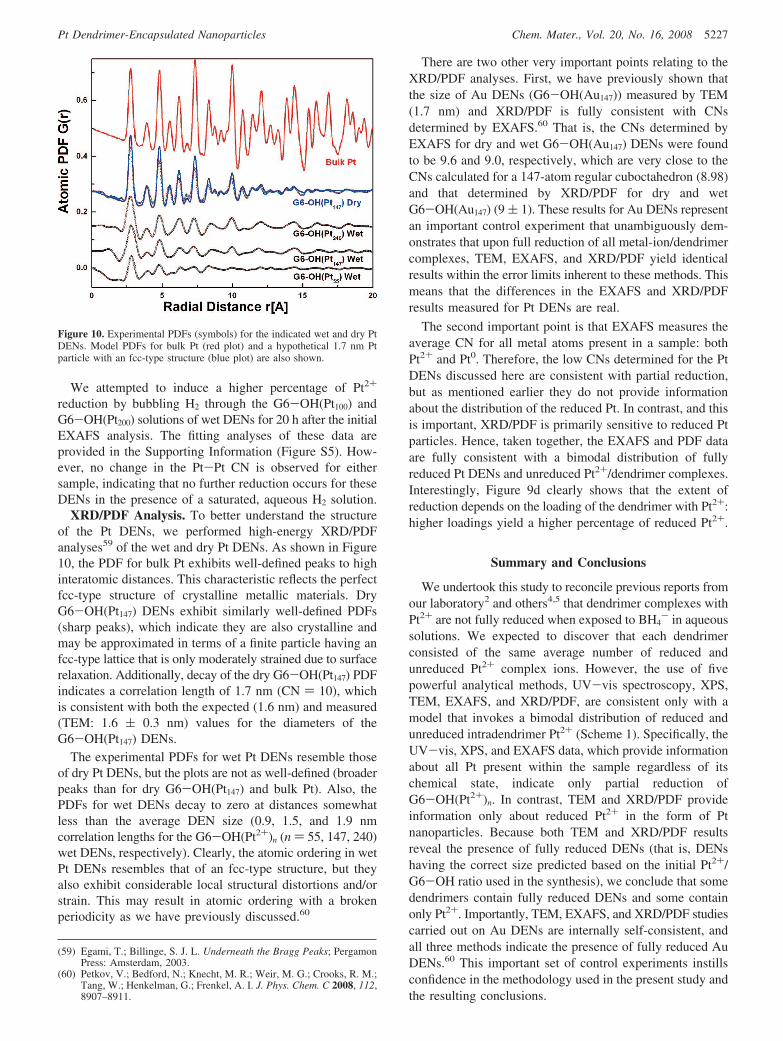
XRD/PDF Analysis. To better understand the structureof the Pt DENs, we performed high-energy XRD/PDFanalyses59 of the wet and dry Pt DENs. As shown in Figure10, the PDF for bulk Pt exhibits well-defined peaks to highinteratomic distances. This characteristic reflects the perfectfcc-type structure of crystalline metallic materials. DryG6-OH(Pt147) DENs exhibit similarly well-defined PDFs(sharp peaks), which indicate they are also crystalline andmay be approximated in terms of a finite particle having anfcc-type lattice that is only moderately strained due to surfacerelaxation. Additionally, decay of the dry G6-OH(Pt147) PDFindicates a correlation length of 1.7 nm (CN ) 10), whichis consistent with both the expected (1.6 nm) and measured(TEM: 1.6 ( 0.3 nm) values for the diameters of theG6-OH(Pt147) DENs.
The experimental PDFs for wet Pt DENs resemble thoseof dry Pt DENs, but the plots are not as well-defined (broaderpeaks than for dry G6-OH(Pt147) and bulk Pt). Also, thePDFs for wet DENs decay to zero at distances somewhatless than the average DEN size (0.9, 1.5, and 1.9 nmcorrelation lengths for the G6-OH(Pt2+)n (n ) 55, 147, 240)wet DENs, respectively). Clearly, the atomic ordering in wetPt DENs resembles that of an fcc-type structure, but theyalso exhibit considerable local structural distortions and/orstrain. This may result in atomic ordering with a brokenperiodicity as we have previously discussed.60
There are two other very important points relating to theXRD/PDF analyses. First, we have previously shown thatthe size of Au DENs (G6-OH(Au147)) measured by TEM(1.7 nm) and XRD/PDF is fully consistent with CNsdetermined by EXAFS.60 That is, the CNs determined byEXAFS for dry and wet G6-OH(Au147) DENs were foundto be 9.6 and 9.0, respectively, which are very close to theCNs calculated for a 147-atom regular cuboctahedron (8.98)and that determined by XRD/PDF for dry and wetG6-OH(Au147) (9 ( 1). These results for Au DENs representan important control experiment that unambiguously dem-onstrates that upon full reduction of all metal-ion/dendrimercomplexes, TEM, EXAFS, and XRD/PDF yield identicalresults within the error limits inherent to these methods. Thismeans that the differences in the EXAFS and XRD/PDFresults measured for Pt DENs are real.
The second important point is that EXAFS measures theaverage CN for all metal atoms present in a sample: bothPt2+ and Pt0. Therefore, the low CNs determined for the PtDENs discussed here are consistent with partial reduction,but as mentioned earlier they do not provide informationabout the distribution of the reduced Pt. In contrast, and thisis important, XRD/PDF is primarily sensitive to reduced Ptparticles. Hence, taken together, the EXAFS and PDF dataare fully consistent with a bimodal distribution of fullyreduced Pt DENs and unreduced Pt2+/dendrimer complexes.Interestingly, Figure 9d clearly shows that the extent ofreduction depends on the loading of the dendrimer with Pt2+:higher loadings yield a higher percentage of reduced Pt2+.
Summary and Conclusions
We undertook this study to reconcile previous reports fromour laboratory2 and others4,5 that dendrimer complexes withPt2+ are not fully reduced when exposed to BH4
- in aqueoussolutions. We expected to discover that each dendrimerconsisted of the same average number of reduced andunreduced Pt2+ complex ions. However, the use of fivepowerful analytical methods, UV-vis spectroscopy, XPS,TEM, EXAFS, and XRD/PDF, are consistent only with amodel that invokes a bimodal distribution of reduced andunreduced intradendrimer Pt2+ (Scheme 1). Specifically, theUV-vis, XPS, and EXAFS data, which provide informationabout all Pt present within the sample regardless of itschemical state, indicate only partial reduction ofG6-OH(Pt2+)n. In contrast, TEM and XRD/PDF provideinformation only about reduced Pt2+ in the form of Ptnanoparticles. Because both TEM and XRD/PDF resultsreveal the presence of fully reduced DENs (that is, DENshaving the correct size predicted based on the initial Pt2+/G6-OH ratio used in the synthesis), we conclude that somedendrimers contain fully reduced DENs and some containonly Pt2+. Importantly, TEM, EXAFS, and XRD/PDF studiescarried out on Au DENs are internally self-consistent, andall three methods indicate the presence of fully reduced AuDENs.60 This important set of control experiments instillsconfidence in the methodology used in the present study andthe resulting conclusions.
(59) Egami, T.; Billinge, S. J. L. Underneath the Bragg Peaks; PergamonPress: Amsterdam, 2003.
(60) Petkov, V.; Bedford, N.; Knecht, M. R.; Weir, M. G.; Crooks, R. M.;Tang, W.; Henkelman, G.; Frenkel, A. I. J. Phys. Chem. C 2008, 112,8907–8911.
Figure 10. Experimental PDFs (symbols) for the indicated wet and dry PtDENs. Model PDFs for bulk Pt (red plot) and a hypothetical 1.7 nm Ptparticle with an fcc-type structure (blue plot) are also shown.
5227Chem. Mater., Vol. 20, No. 16, 2008Pt Dendrimer-Encapsulated Nanoparticles
We are left to ponder the seemingly counterintuitive modelthat results from this study (Scheme 1). It may be reasonableto conclude that we are observing a stochastic, autocatalytic,intradendrimer nucleation and growth process. That is, forreasons we do not presently understand, BH4
- is apparentlycapable of reducing Pt2+ complexed to the dendrimer viaspecific motifs.36,46 Once reduction begins, however, it maybecome autocatalytic. That is, Pt2+ ions that are not directlysusceptible to BH4
- reduction may be catalytically reducedon the nascent Pt DEN. There is certainly ample priorevidence that Pt DENs are catalytic for hydrogenationreactions28,34 and for decomposition of dendrimers,4,61 whichmight support this hypothesis. Perhaps structural differencesbetween dendrimers (that is, defect structures which areknown to exist in PAMAM dendrimers to a substantialdegree)62 or different binding modalities between Pt2+ andthe dendrimer5,36 might account for this emergent hetero-geneity. Certainly the data shown in Figure 9d, which showsthat a higher percentage of Pt2+ is reduced in dendrimershaving a higher loading of Pt2+, is consistent with this view.That is, from a purely statistical viewpoint, higher loadingsof Pt2+ provide more opportunities for a nascent Pt0 nucleusto form.
Finally, we note that this bimodal reduction model is alsoconsistent with our recently published study of the effect ofPt DEN size on the kinetics of the oxygen reduction reaction(ORR).16 Specifically, this study indicated a monotonic trendin which smaller Pt particles resulted in slower ORR kinetics.This observation is more consistent with a bimodal distribu-tion of Pt DEN catalysts that are fully formed (fully reduced),and hence catalytic, and a second distribution, which areunreduced and thus not catalytically active. If Pt within
individual dendrimers was substantially present in multipleoxidation states, it is unlikely that catalytic activity approach-ing that of bulk Pt (for G6-OH(Pt240)) would have beenobserved because EXAFS indicates that such particles wouldhave CNs on the order of 6. This CN corresponds to regularcuboctahedra consisting of just 13 atoms, which surely wouldhave vastly different catalytic properties than bulk Pt.
Acknowledgment. R.M.C. acknowledges support from theRobert A. Welch Foundation (Grant F-1288) and the NationalScience Foundation (Grant 0531030). Financial support of thisproject was also provided by the DOE-BES Grants DE-FG02-03ER15468 (R.M.C.), DE-FG02-03ER15468 (D.J.B.), and DE-FG02-03ER15476 (A.I.F.). Work at the NSLS was supportedby DOE Grants DE-FG02-05ER15688 and DE-AC02-98CH10886, while work at the APS was supported by DOEcontract W-31-109-ENG-38. V.P. acknowledges support fromCMU through Grant REF 60628 and the help of Peter Chupas,APS, with the high-energy XRD measurements. M.R.K. andM.G.W. acknowledge the assistance of Ned Markinovich fromNSLS for assistance with the EXAFS experiments. W.D.P. andD.J.B. acknowledge C. Ni and the UD Keck Microscopy facilityfor access to the JEOL 2010F and assistance with TEM. Weacknowledge the Robert A. Welch Foundation and SPRINGfor support of some of the facilities used to carry out this projectand Dr. Yangming Sun for assistance with the XPS mea-surements.
Supporting Information Available: Kinetic rate analysis of thePtCl4
2- hydrolysis reaction, UV-vis analysis indicating no hy-drolysis of PtCl4
2- in the presence of 1.00 M KCl, spectroscopicevidence for complete sequestration of platinum within dendrimer,TEM results demonstrating that Pt2+ is not reduced under theelectron beam, and EXAFS analysis of the wet G6-OH(Pt100) andG6-OH(Pt200) DENs before and after exposure to H2 gas. Thismaterial is available free of charge via the Internet at http://pubs.acs.org.
CM8004198
(61) Singh, A.; Chandler, B. D. Langmuir 2005, 21, 10776–10782.(62) Tomalia, D. A.; Baker, H.; Dewald, J.; Hall, M.; Kallos, G.; Martin,
S.; Roeck, J.; Ryder, J.; Smith, P. Polym. J. 1985, 17, 117–132.
5228 Chem. Mater., Vol. 20, No. 16, 2008 Knecht et al.