Embed Size (px)
Citation preview
Synthesis and Characterization of Oxovanadium Complexes
Featuring O- and N- Donor Environment
A Dissertation
Submitted in partial fulfillment
FOR THE DEGREE OF
MASTER OF SCIENCE IN CHEMISTRY
Under The Academic Autonomy
NATIONAL INSTITUTE OF TECHNOLOGY, ROURKELA
Affiliated to
Deemed University
By
Paresh Kumar Majhi
Under the Guidance of
Dr. Rupam Dinda
DEPARTMENT OF CHEMISTRY,
NATIONAL INSTITUTE OF TECHNOLOGY,
ROURKELA – 769008 (ORISSA), INDIA

ii

iii
TO My PARENTS
WHO HELPED ME THROUGH OUT
AND
TO MY TEACHER
WHO TAUGHT ME THE BEAUTY OF CHEMISTRY
iv
Acknowledgements
This thesis is the account of one year of devoted work in the field of Co-ordination Chemistry at
the National Institute of Technology, Rourkela, India, which would not have been possible
without the help of many.
A few lines are too short to make a complete account of my deep appreciation for my advisors
Dr. Rupam Dinda. I would like to thank him with immense pleasure for his valuable guidance
and constant encouragements which I have received during last two years.
I acknowledge my sincere regards to all staff’s member, Department of Chemistry, NIT
Rourkela for their enthusiasm in promoting the research in chemistry and for their kindness and
dedication to students. I specially record my deep appreciation and thanks to Dr. Saurav
Chatterjee for his indefatigable encouragements, which set me on the right track.
I would like to thank here Professor Nigam P. Rath, Research Professor, Department of
Chemistry and Biochemistry, University of Missouri-St. Louis, USA, Professor Ekkehard Sinn,
Professor and Chair, WMU Department of Chemistry, Kalamazoo, USA and Partha Mitra,
IACS, Kolkata for single X-ray diffraction facilities.
I am also thankful to my lab mates Ms. Sagarika Pasayat, Mr. Sumanta Patel, Saurav, Sarita and
Moumita, who are worked with me since last one year and to my classmates also.
Last but not the least, I would like to record deep respect to my parents, brother, sisters,
nephews, nieces for selflessly extending their ceaseless support and moral sustence at all times.
Date: 11. 05. 2009 Name: Paresh Kumar Majhi

v
Contents
1. Introduction 1
2. Experimental 6
3. Physical Measurements 6
4. Chemicals and Solvents 6
5. Synthesis of the Ligands 7
6. Synthesis of the Metal complexes 10
7. X-Ray Structure Determination 13
8. Magnetic Susceptibility Measurement 14
9. Results and discussion 16
10. Protonated / Deprotonated form of Schiff’s Base 16
11. Spectral characteristics 17
12. IR Spectra of Complex 2 in Solution: Identification of the minor species 19
11. Electronic spectra of VOL2S (OEt) in CHCl3 20
12. Redox Properties 21
13. Magnetic Study 22
14. Description of Structure of Complex 1 22
15. Conclusion 28
16. Studies Under process 29
17. Future Studies 30
19. References 31
18. Spectral Data 34
vi
Figures and tables
1. Figure 1.1 7
2. Figure 1.2 7
3. Figure 2.1 8
4. Figure 2.2 8
5. Figure 2.3 9
6. Figure 2.4 9
7. Figure 3.1 10
8. Figure 3.2 11
9. Figure 3.3 12
10. Figure 3.4 12
11. Figure 3.5 13
12. Figure 3.6 16
13. Figure 4.1 17
14. Figure 4.2 18
15. Figure 4.3 18
16. Figure 4.4 19
17. Figure 4.5 20
18. Figure 4.6 21
19. Figure 4.7 23
20. Figure 4.8 25
21. Figure 4.9 26
22. Figure 5.1 29
23. Figure 5.2 30
24. Table 1.1 24
25. Table 1.2 27
1
1. INTRODUCTION:
Vanadium is the only element in the periodic table that is named after a goddess (the Nordic
goddess Vanadis), and perhaps with this legacy brings to the table a sense of some unpredictable
and surprising chemistry. It is an early first-row transition metal and forms colorful compounds
in its many different oxidation states. It undergoes a wide variety of chemistry depending on the
electronic and steric nature of the coordinating ligands. In higher oxidation states, vanadium is
very oxophilic, but at low oxidation states, π-donating ligands such as dinitrogen and carbon
monoxide are preferred. Two decades ago, vanadium chemistry, particularly vanadium (V)
chemistry, was significantly less developed than it is now. Many aspects of vanadium (V)
chemistry in solution that are now well known were about to be discovered. A compendium of
contributions dedicated to vanadium chemistry edited by Chasteen [1], showed the number of
publications in the area of vanadium chemistry increased dramatically from the early to the late
1980s. This level of interest has continued unabated, thus leading to the much more mature field
that exists presently. The barriers between bioinorganic and other areas of vanadium science are
now less obvious; systems of interest to bioinorganic chemists have catalytic properties, and
systems known for their catalytic properties have relevance to bioinorganic chemistry.
The catalytic and material properties of vanadium compounds and their effects in biological
systems have long provided the impetus and fuel to studies of vanadium science. The expanding
knowledge of the role of vanadium in biological systems and of the potential of vanadium
compounds as therapeutic agents has led to a continuously increasing interest in the coordination
chemistry and solution chemistry of this element. Within the spectrum of vanadium complexes
that have been synthesized as model compounds for the understanding of vanadium-controlled
2
biological systems or as potential therapeutic agents with insulin-mimetic properties, one finds a
substantial number of oxovanadium( V) chelate complexes with a variety of donor set.
Vanadium is a trace element that plays an important, perhaps essential and general role in the
regulation of enzymatic phosphorylations. Several forms of life, including the fly agaric
toadstool (Amanita muscaria) and certain sea squirts (ascidians), are able to concentrate
vanadium. In other organisms vanadium is part of the active site of some enzymes. Well-studied
examples are the nitrogen-fixing bacterium Azotobacter and various seaweeds that use vanadate-
dependent peroxidases to synthesize halogenated organic compounds. Another important
biological activity of vanadium is its insulin-mimetic characteristics, which can cause in vivo
stimulation of the uptake and metabolism of glucose. Despite its importance as a biometal both
in primitive, prokaryotic organisms (Azotobacter) and in the highly organized ascidians, which
represent an early stage in the evolution of vertebrates, the bioinorganic chemistry of vanadium
is still in its infancy.
The spectroscopic characterization of the oxovanadates by Howarth and coworkers [2,3] and that
of alkylated oxovanadates, i.e., vanadate esters, as reported by the Gresser and Tracey team [4,5]
were key studies in the area of vanadium(V) solution chemistry. The vanadium nucleus is very
sensitive to small structural variations, and is a very effective tool for investigation of vanadium
compounds in solution. Characterizing the molecular structure is a critical component of
understanding the properties of a complex and the determination of X-ray structure remains an
important endeavor in all areas of chemistry. This includes results using the tools of solid state
and modeling compounds to probe the coordination chemistry of vanadium (V) complexes.
The rich chemistry of vanadium in the +V oxidation state in comparison to other two
biologically important states, e.g. +IV and +III, is probably due to its ability to exist in three
3
forms, viz., VO3+, VO2+ and V2O3
+. In vanadium chemistry, the VO2+ and VO3+ motifs have
received considerable attention probably due to their involvement in many vanadium-dependent
enzymes, viz., nitrogenases [6], haloperoxidases [7], phosphomutases etc. Catalytic activity of
some vanadium(V) complexes in a-olefin polymerization has recently been discovered [8].
Moreover, the discoveries of several medicinal properties of vanadium complexes viz., insulin-
mimetic, anticancer, antitumour and antifungal/antibacterial activities [9, 10] have stimulated
further research in this area. In most cases the active site contains either of these two motifs
coordinated by oxygen–nitrogen atoms. The strong affinity of these two motifs towards O, N-
donor ligand is probably due to their hard acidic nature and selective stabilization of these two
motifs depends upon the basicity of donor atoms. These ligands have a tendency to stabilize the
vanadium in its highest oxidation state [11-13]. Electronic property of the metal ion in a complex
can be tuned by changing the coordination environment around the metal ion and this can be
done by two ways in a mixed- ligand system: (i) by making substitution on either or both of the
coordinated ligands and (ii) by changing one ligand with varying basicity.
A recent report [14] reveals the structure of an azide derivative of the chloroperoxidase from the
fungus CurVularia inæqualis, wherein the vanadium(V) center is bound to three oxygen donors
and an azide, while a histidine imidazole acts as the sole protein-derived ligand. The involvement
of vanadoenzymes in both reductive (N2 + 6H+ + 6e 2NH3) and oxidative (RH + H2O2 + HX
RX + 2H2O) transformations signifies the importance of the +3, +4, and +5 oxidation states. The
synthesis as well as characterization of low molecular weight complexes with these biologically
important oxidation states of vanadium will help in making further progress in the elucidation of
the biological roles of vanadium. Vanadium easily switches between the oxidation states IV and
V and the stabilization of either of these two states under aerobic condition depends upon the
4
basicity of the coordinated ligand and also on the pH of the reaction medium. Of these three, the
+V state has received considerable attention probably due to its two important properties: (i) it
can exist in three motifs viz., mononuclear VO3+ and VO2+ motifs and dinuclear V2O3
4+ motif
and (ii) it has the ability to exist in either five or six coordinated environment. These motifs are
stable in solution around the physiological pH (~7) only when the metal is coordinated with
sufficiently strong ligand for preventing the precipitation of hydroxides. A systematic study
regarding the exclusive formation of any one of these three motifs with O, N-donor ligands
[as V (V) due to its hard acidic nature, has strong affinity towards hard basic O, N-donor ligands]
and their interconversion is an important area of contemporary research. Hydrazone ligands
derived from the condensation of acid hydrazide with aromatic carbonyl compounds are
important tridentate O, N-donor ligands containing two intermediate basic phenolic and amide
groups and one neutral imine moiety. This type of work was motivated by four objectives: (i) to
synthesize the complexes containing V2O34+ core with a family of above mentioned hydrazone
ligands, (ii) to rationalize the various synthetic routes for the formation of such type of
complexes with these hydrazone ligands, (iii) to examine the feasibility of conversion of these
dinuclear complexes into the mononuclear complexes with VO3+ and VO2+ motifs.
Interest in the coordination chemistry with particular emphasis on the model character of
vanadium(V) complexes having O and N functionalities stems from the structural
characterization of three vanadate-dependent haloperoxidases (VHPO). Irrespective of their
origin from brown algae (Ascophyllum nodosum) [15], red algae (Corallinaofficinalis), or fungi
(CurVularia inequalis) [16], they all show a high degree of amino acid homology in their active
centers and have almost identical structural features, with vanadium(V) in a trigonal-bipyramidal
coordination environment. Vanadium is covalently linked to three nonprotein oxo groups in the
5
equatorial plane, to the protein backbone through Ne of an imidazole moiety of a proximal
histidine, and to an axial OH group trans to the histidine, further hydrogen bonded to a distal
(catalytic) histidine and water molecules. These enzymes, as well as various model complexes,
catalyze the oxidation, by peroxide, of halide to hypohalous acid [16, 17] and of (prochiral)
sulfides to (chiral) sulfoxides, and of several other organic substrates.
The coordination chemistry of aroyl hydrazones are quite interesting as it presents a combination
of donor sites such as protonated / deprotonated amide oxygen, an imine nitrogen of hydrazone
moiety and additional donor site (usually N or O) provided from the aldehyde or ketone forming
the Schiff base.
[VO(acac)2] serves as a good precursor and undergoes ligand exchange reaction where one or
both acetylacetonato groups can easily be exchanged with organic ligands having coordinating
atoms of different potentialities. Usually oxovanadium (IV) complexes form when [VO(acac)2]
reacts with ligands under anhydrous conditions. Under aerobic conditions most vanadium
complexes stabilize in their highest oxidation state (i.e. V). Factors such as nature of ligands,
solvents, pH of the reaction and reaction medium etc. have, however, great influence on the
stoichiometry and nature of the resulting complexes.
In this dissertation I report the synthesis, structure and full characterization of a new
mononuclear square pyramidal monoalkoxo-bound monooxo-vanadium (V) complex
VOL2S(OEt) (1) of 2-Hydroxyacetophenonehydrazone of 2-Hydroxybenzoylhydrazine Ligand. I
also report the synthesis of several other Schiff’s base ligands and their respective oxovanadium
complexes. But due to insufficient data and shortage of time we are unable to report the complete
characterization of all other complexes (2-4).
6
2. EXPERIMENTAL:
2.1. Physical Measurements:
Elemental analyses (C, H, and N) were performed by Perkin-Elmer 240 instrument. FTIR spectra
(4000-400 cm-1) as KBr discs of the samples were recorded on a Perkin Elmer spectrum RXI.
Electronic spectra were obtained using a Perkin Elmer Lambda 35 UV/VIS spectrophotometer.
Magnetic susceptibility was measured with a Sherwood Scientific MSBMK1 sample
magnetometer with Hg [Co (SCN)4] as calibrant. Electrochemical measurements were made at
298 K under a dry nitrogen atmosphere using a PC-controlled EG & G/PAR-273A potentiostat.
A conventional three electrode configuration was used, consisting of platinum-wire working and
auxiliary electrodes and an SCE reference electrode and TEAP as the supporting electrolyte. The
ferrocene/ferrocenium (Fe/Fe+) couple was used as the internal standard.
2.2. Chemicals and Solvents:
Chemicals were procured from renowned companies like Aldrich, E. Merck and Fluka and used
without further purification. HPLC grade acetonitrile, dichloromethane and chloroform were
used for spectroscopic studies. All other solvents were A.R. grade and used as received for
synthetic work. NH4VO3 and VOSO4 were procured from Loba Chemie. [VO(acac)2] was
prepared as described in the literature [17, 25].
7
2.3. Synthesis of the Ligands:
The synthesis of our final ligand consists of two steps.
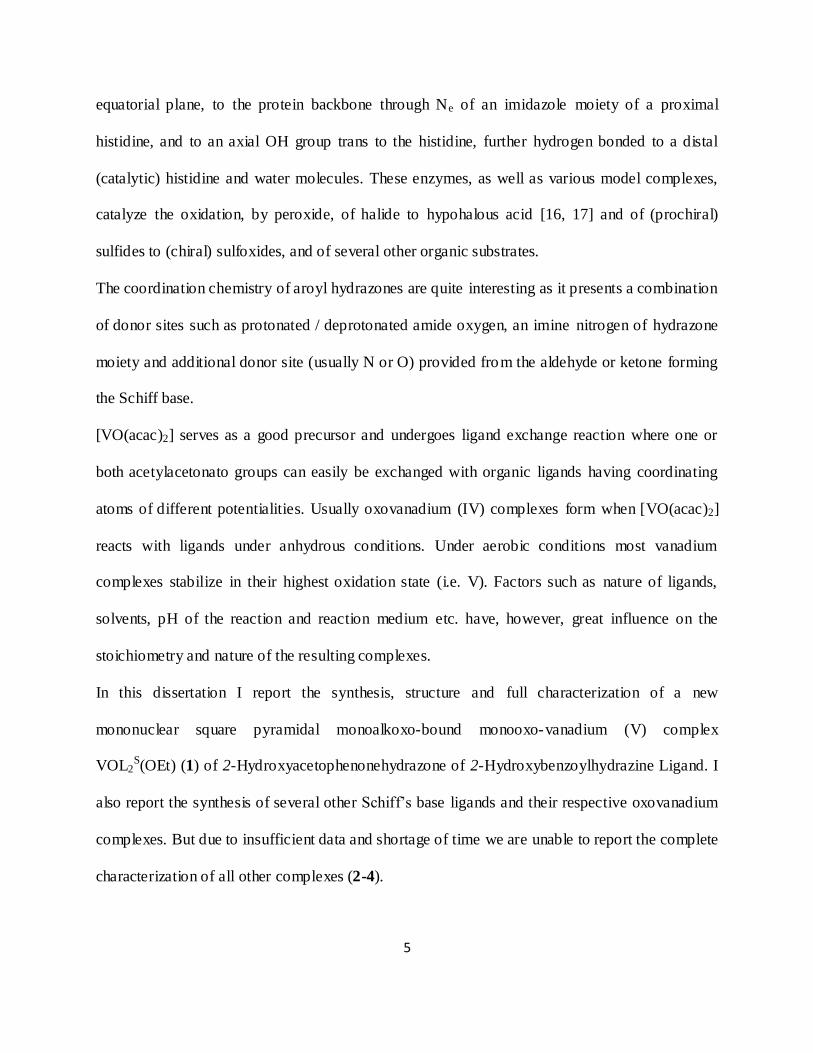
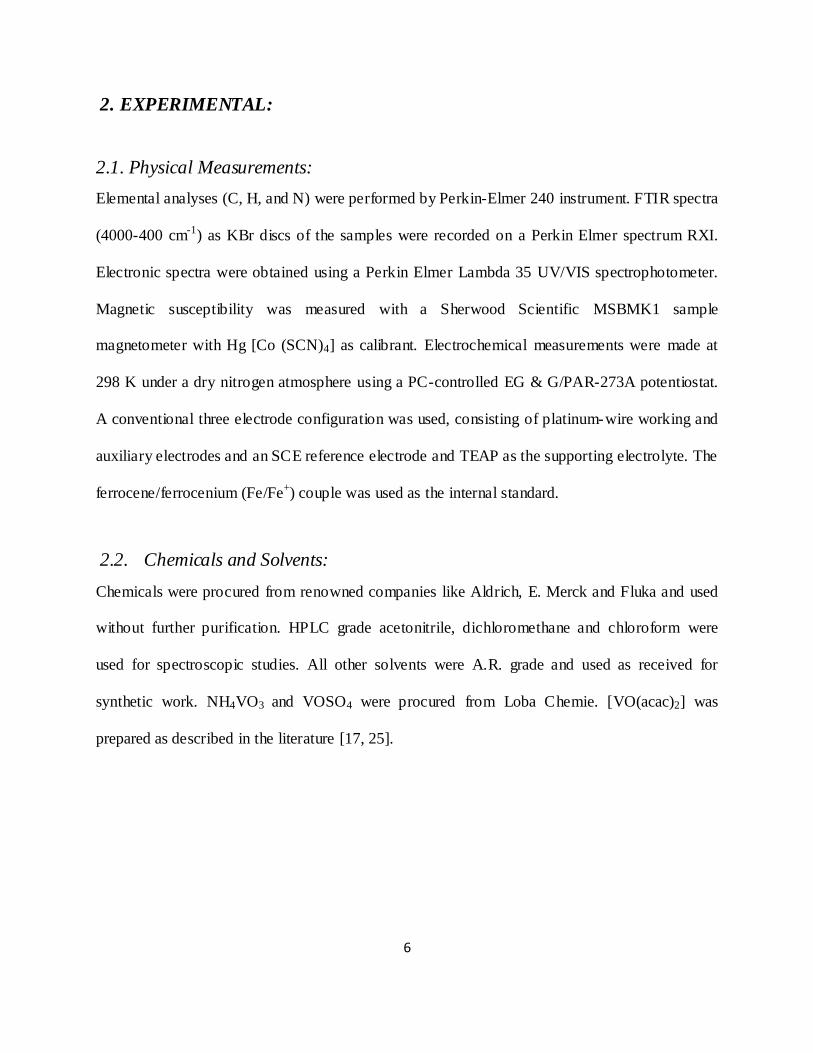
Step-1: Synthesis of acid hydrazide
The two acid hydrazides were prepared by known [13, 25] methods which are schematically
shown below:
:1 1
O
OMe
NH2
NH2NH2.OH
O
NHNH2
NH2
Reflux
Anthraniloyl Hydrazide (AH)Methyl Anthranilate
+3hr
Figure 1.1
Figure 1.2
OMe
OH
NH2NH2.OH
O
NHNH2
OH
Reflux
Salicylhydrazide (SH)Methyl Salicylate
+3hr
O
:1 1
Step-2: Synthesis of Schiff’s base ligand
All the four Schiff’s base ligands used in this study were prepared following same method by
stirring carbonyl compounds and the respective hydrazide in equimolar ratio. A typical synthesis
is described below.
8
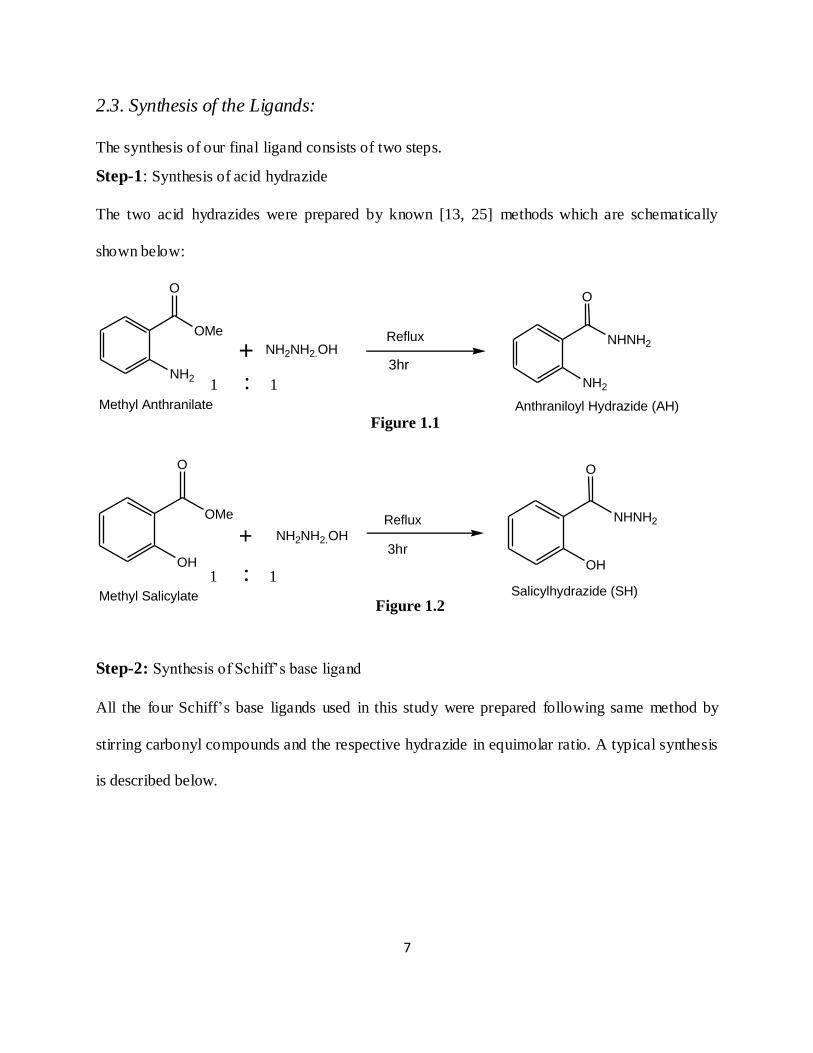
A. 2-Hydroxyacetophenonehydrazone of 2-Hydroxybenzoylhydrazine Ligand, (L2SH2)
Figure 2.1
:1 1
O
NH
NH2
HO
O
CH3
Salicylhydrazide 2-hydroxyacetophenone
EtOH,
Stir,3hr
H+
OH
O
NH
NC
CH3
HO
Ligand (L2SH2)
*
*
*OH
Schiff base ligand, 2-hydroxyacetophenonehydrazone of 2-hydroxybenzoylhydrazine (L2SH2)
was prepared by reacting salicylhydrazide (1.52-g / 10-mmol) and 2-hydroxy acetophenone
(1.36-g / 10-mmol) in stirring ethanol (25 mL) for 3 h. The resulting white compound was
filtered and washed three times with ethanol and dried over fused CaCl2.
M.P.170oC. Yield: 70%. Found (Calc. for C15H13N2O3): C 66.71 (66.66), H 4.85 (4.81), N 10.38
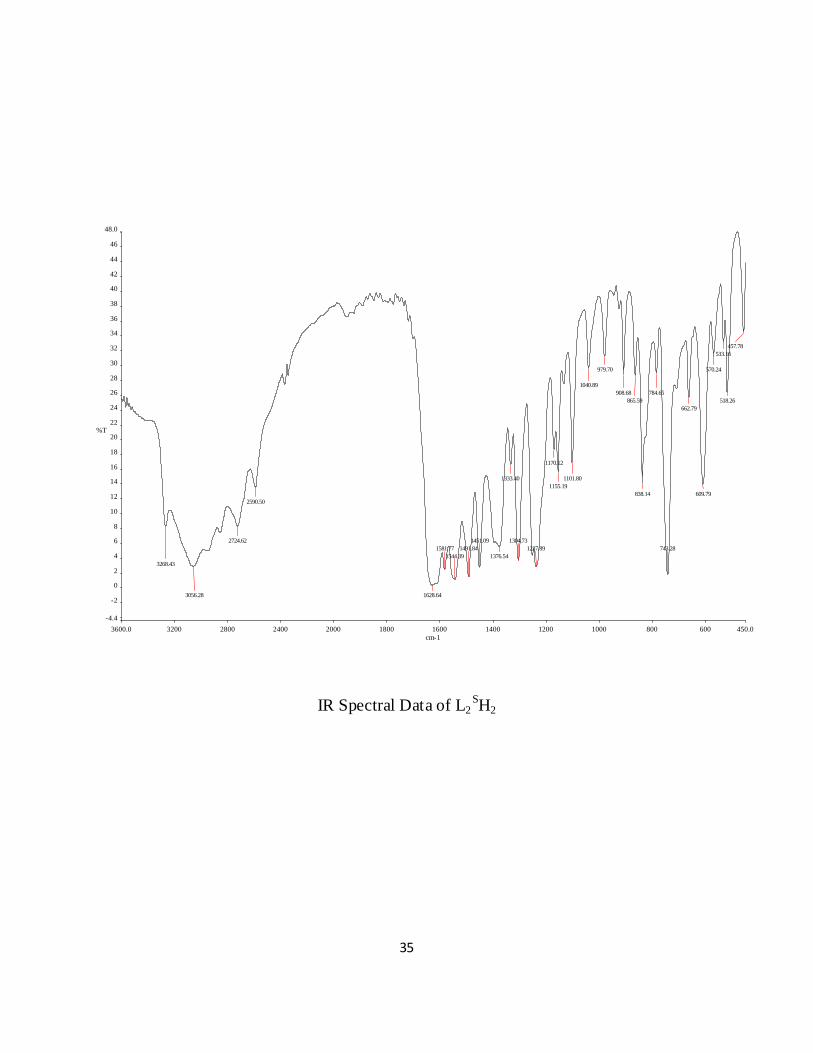
(10.37). Selected IR bands (cm-1): 3268 (νO-H), 1629 (νC=O), 1581 (νC=N), 3056 (νN-H).
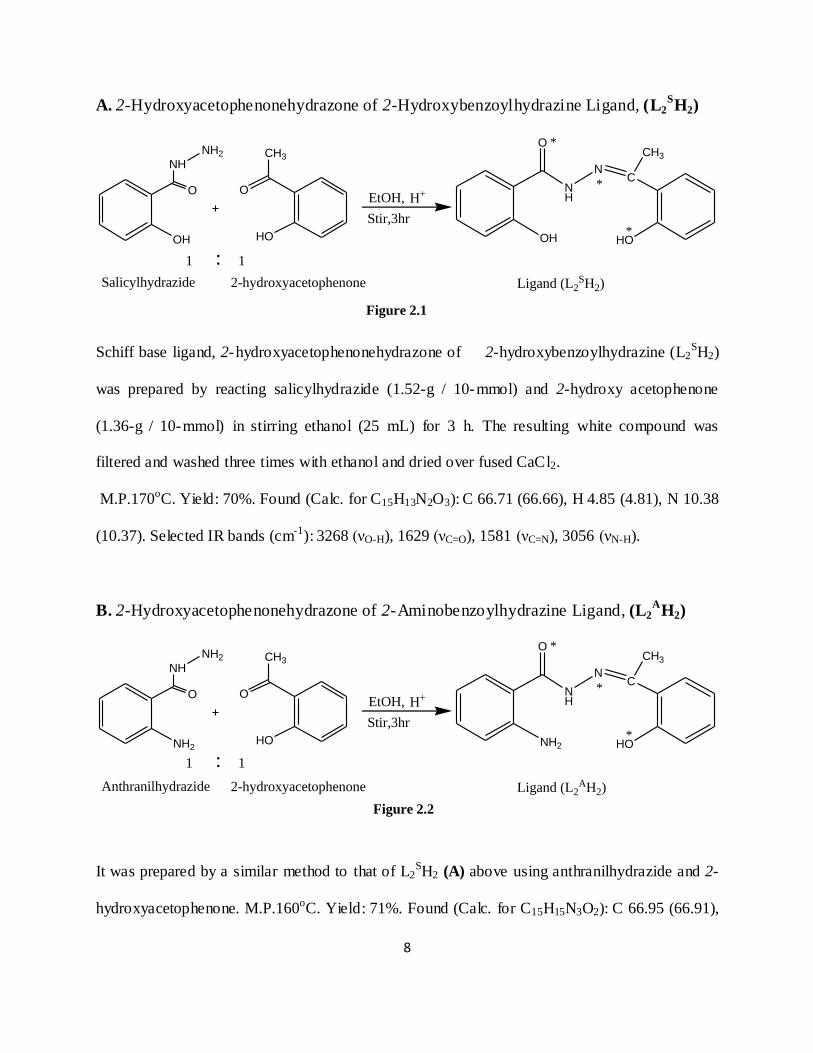
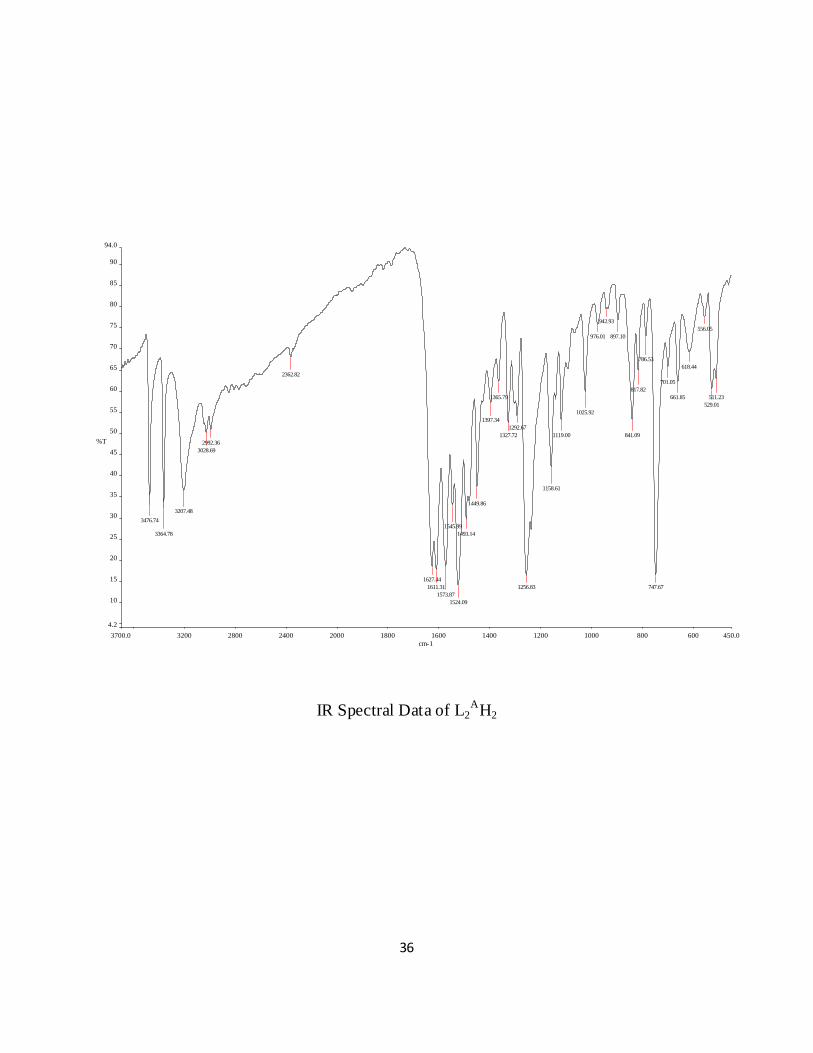
B. 2-Hydroxyacetophenonehydrazone of 2-Aminobenzoylhydrazine Ligand, (L2A
H2)
O
NH
NH2
HO
O
CH3
Anthranilhydrazide 2-hydroxyacetophenone
EtOH,
Stir,3hr
H+
NH2
O
NH
NC
CH3
HO
Ligand (L2AH2)
*
*
*NH2
:1 1
Figure 2.2
It was prepared by a similar method to that of L2SH2 (A) above using anthranilhydrazide and 2-
hydroxyacetophenone. M.P.160oC. Yield: 71%. Found (Calc. for C15H15N3O2): C 66.95 (66.91),
9
H 5.57 (5.59), N 15.64 (15.61). Selected IR bands (cm-1): 3476 (νN-H2), 1627 (νC=O), 1573 (νC=N),
3364 (νN-H).
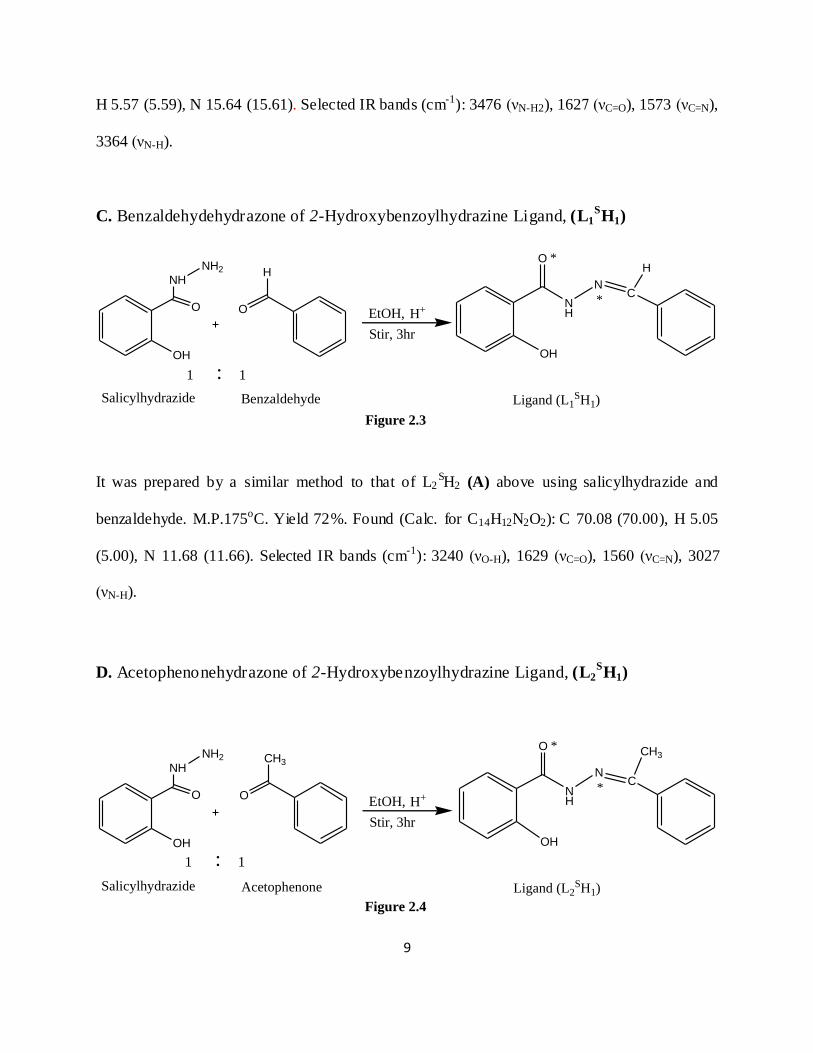
C. Benzaldehydehydrazone of 2-Hydroxybenzoylhydrazine Ligand, (L1SH1)
:1 1
O
NH
NH2
O
H
Salicylhydrazide
EtOH,
Stir, 3hr
H+
OH
O
NH
NC
H
Ligand (L1SH1)
*
*
OH
Benzaldehyde
Figure 2.3
It was prepared by a similar method to that of L2SH2 (A) above using salicylhydrazide and
benzaldehyde. M.P.175oC. Yield 72%. Found (Calc. for C14H12N2O2): C 70.08 (70.00), H 5.05
(5.00), N 11.68 (11.66). Selected IR bands (cm-1): 3240 (νO-H), 1629 (νC=O), 1560 (νC=N), 3027
(νN-H).
D. Acetophenonehydrazone of 2-Hydroxybenzoylhydrazine Ligand, (L2SH1)
:1 1
O
NH
NH2
O
CH3
Salicylhydrazide
EtOH,
Stir, 3hr
H+
OH
O
NH
NC
CH3
Ligand (L2SH1)
*
*
OH
Acetophenone
Figure 2.4
10
It was prepared by a similar method to that of L2SH2 (A) above using salicylhydrazide and
acetophenone. M.P.175o C. Yield 75%. Found (Calc. for C15H14N2O2): C 70.88 (70.86), H 5.55
(5.51), N 11.08 (11.02). Selected IR bands (cm-1): 3276 (νO-H), 1638 (νC=O), 1606 (νC=N), 3053
(νN-H).
2.4. Synthesis of the Metal complexes:
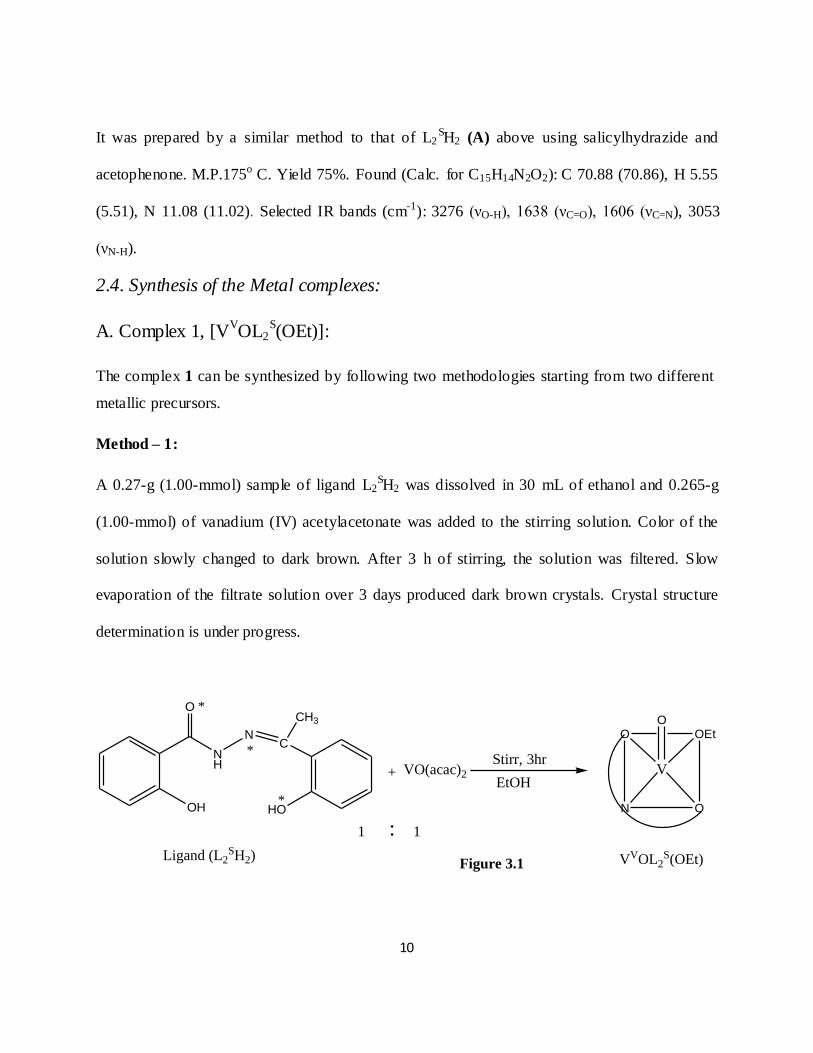
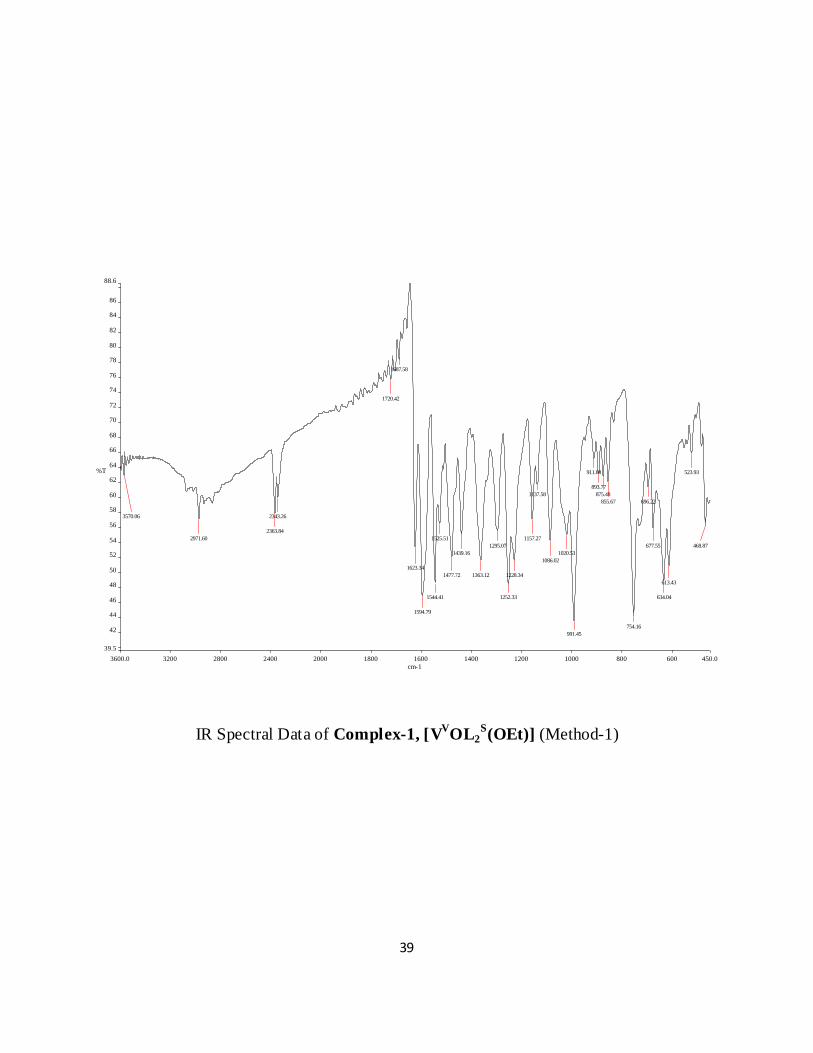
A. Complex 1, [VVOL2
S(OEt)]:
The complex 1 can be synthesized by following two methodologies starting from two different
metallic precursors.
Method – 1:
A 0.27-g (1.00-mmol) sample of ligand L2SH2 was dissolved in 30 mL of ethanol and 0.265-g
(1.00-mmol) of vanadium (IV) acetylacetonate was added to the stirring solution. Color of the
solution slowly changed to dark brown. After 3 h of stirring, the solution was filtered. Slow
evaporation of the filtrate solution over 3 days produced dark brown crystals. Crystal structure
determination is under progress.
O
N O
OEt
V
OO
NH
NC
CH3
HO
Ligand (L2SH2)
*
*
*OH
+ VO(acac)2
VVOL2S(OEt)
Stirr, 3hr
EtOH
:1 1
Figure 3.1

11
Yield: 70%. Found (Calc. for C17H17N2O5V): C 53.54 (53.52), H 4.72 (4.75), N 7.34 (7.36).
Selected IR bands (cm-1): 3570 (νO-H), 1252 (νC-O), 1623 (νC=N), 1595 (νC=N). Electronic spectrum
in CHCl3 solution, λ nm (ε M-1 cm-1): 403 (3928), 368 (5400), 358 (5497).
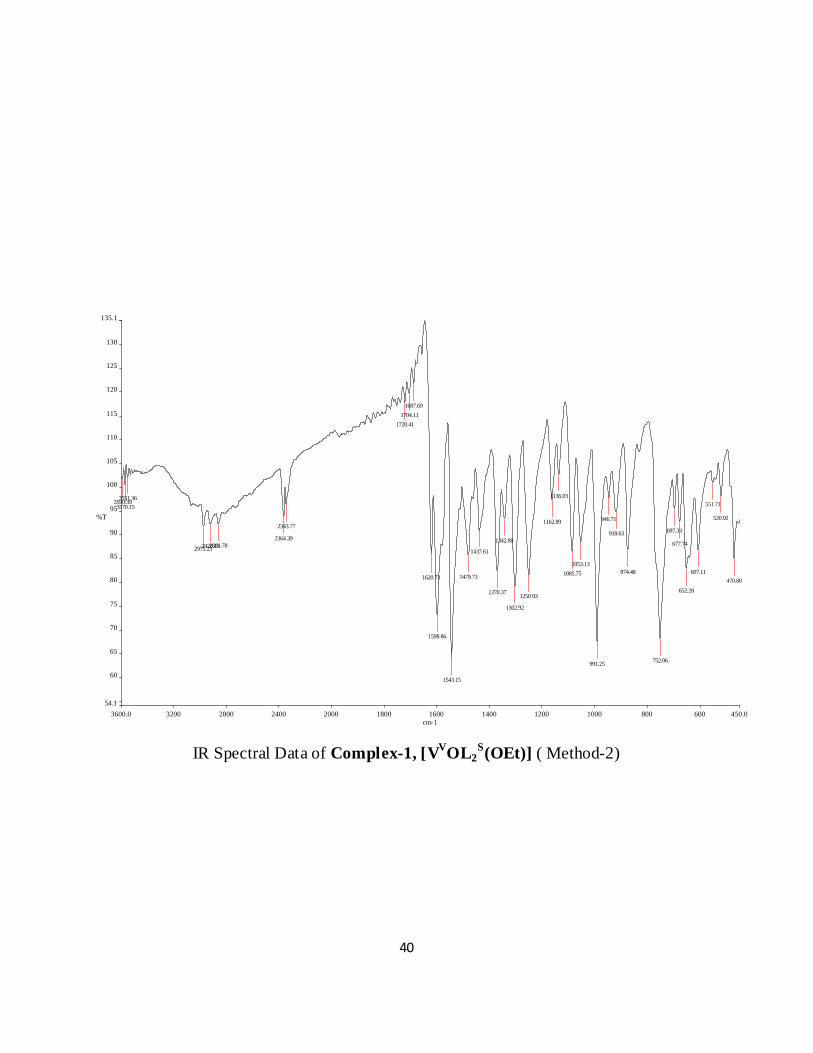
Method – 2:
A 0.27-g (1.00-mmol) sample of ligand L2SH2 was dissolved in 30 mL of ethanol and 0.117-g
(1.00-mmol) of NH4VO3 was added to the stirring solution. Color of the solution slowly
changed to yellow. After 3 h of stirring, the solution was filtered. Slow evaporation of the
filtrate solution over 4 days produced needle shaped crystals. We have solved the crystal
structure also.
O
NH
NC
CH3
HO
Ligand (L2SH2)
*
*
*OH
+
VVOL2S(OEt)
Stirr, 3hr
EtOHNH4VO3
O
N O
OEt
V
O
:1 1
Figure 3.2
Yield~65%. Found (Calc. for C17H17N2O5V): C 53.54 (53.52), H 4.72 (4.75), N 7.34 (7.36).
Selected IR bands (cm-1): 3551 (νO-H), 1250 (νC-O), 1620 (νC=N), 1598 (νC=N).
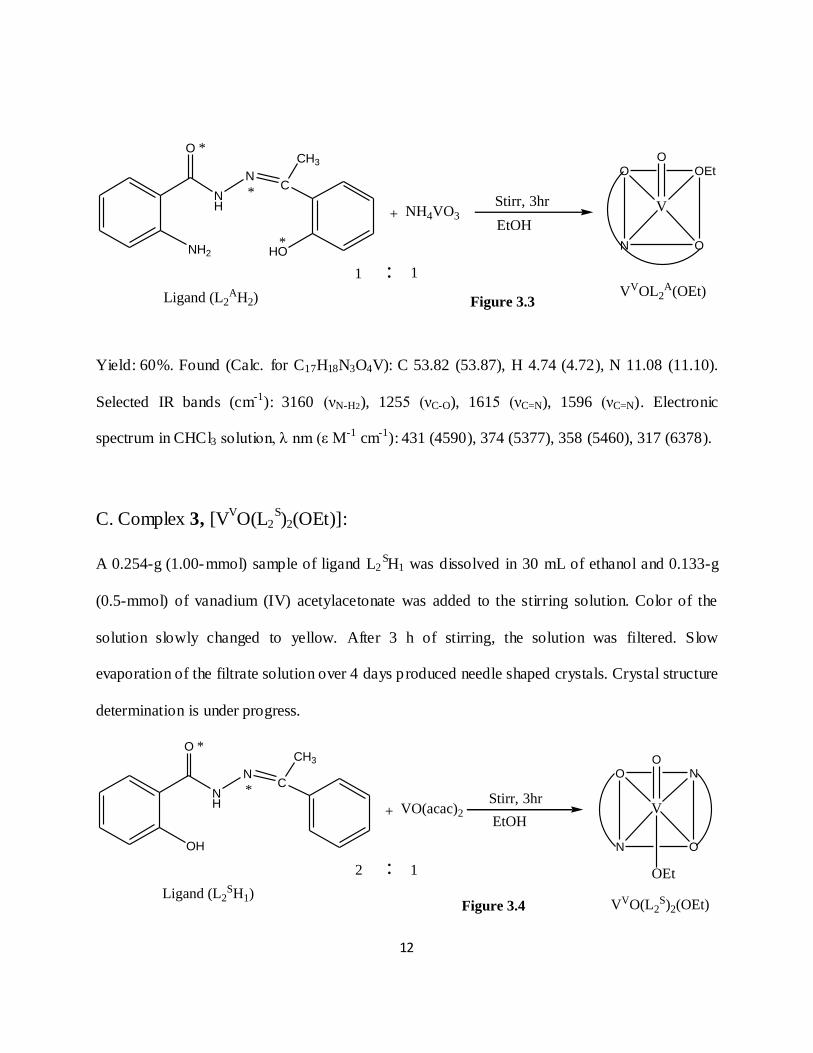
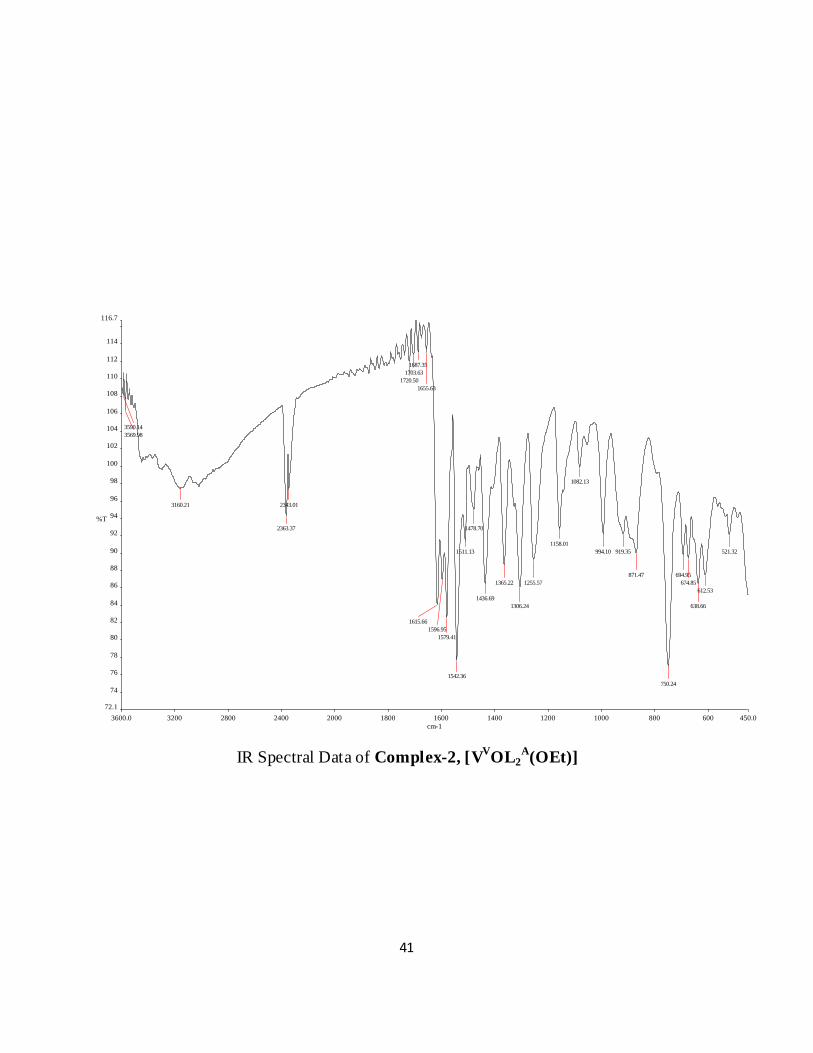
B. Complex 2, [VVOL2
A(OEt)]:
A 0.269-g (1.00-mmol) sample of ligand L2AH2 was dissolved in 30 mL of ethanol and 0.117-g
(1.00-mmol) of NH4VO3 was added to the stirring solution. Color of the solution slowly changed
to yellow. After 3 h of stirring, the solution was filtered. Slow evaporation of the filtrate solution
over 6 days produced brown crystals.
12
O
NH
NC
CH3
HO
Ligand (L2AH2)
*
*
*NH2
+
VVOL2A(OEt)
Stirr, 3hr
EtOHNH4VO3
O
N O
OEt
V
O
:1 1
Figure 3.3
Yield: 60%. Found (Calc. for C17H18N3O4V): C 53.82 (53.87), H 4.74 (4.72), N 11.08 (11.10).
Selected IR bands (cm-1): 3160 (νN-H2), 1255 (νC-O), 1615 (νC=N), 1596 (νC=N). Electronic
spectrum in CHCl3 solution, λ nm (ε M-1 cm-1): 431 (4590), 374 (5377), 358 (5460), 317 (6378).
C. Complex 3, [VVO(L2
S)2(OEt)]:
A 0.254-g (1.00-mmol) sample of ligand L2SH1 was dissolved in 30 mL of ethanol and 0.133-g
(0.5-mmol) of vanadium (IV) acetylacetonate was added to the stirring solution. Color of the
solution slowly changed to yellow. After 3 h of stirring, the solution was filtered. Slow
evaporation of the filtrate solution over 4 days produced needle shaped crystals. Crystal structure
determination is under progress.
O
N O
N
V
OO
NH
NC
CH3
Ligand (L2SH1)
*
*
OH
+ VO(acac)2
VVO(L2S)2(OEt)
Stirr, 3hr
EtOH
:2 1 OEt
Figure 3.4

13
Yield: 65%. Found (Calc. for C32H31N4O6V): C 62.33 (62.38), H 5.03 (5.10), N 9.09 (9.11).
Selected IR bands (cm-1): 3059 (νO-H), 1255 (νC-O), 1625 (νC=N), 1598 (νC=N).
D. Complex 4, [VVO(L1
S)3]:
A 0.254-g (1.00-mmol) sample of ligand L1SH1 was dissolved in 30 mL of ethanol and 0.039-g
(0.33-mmol) of NH4VO3 was added to the stirring solution. Color of the solution slowly changed
to yellow. After 3 h of stirring, the solution was filtered. Slow evaporation of the filtrate solution
over 3 days produced rhombic shaped crystals. Crystal structure determination is under progress.
Figure 3.5
O
NH
NC
H
Ligand (L1SH1)
*
*
NH2
+
VVO(L1S)3
Stirr, 3hr
EtOHNH4VO3
:3 1
V
ON
O
N O
N
O
Yield: 60%. Found (Calc. for C42H33N6O4V): C 64.28 (64.34), H 4.20 (4.25), N 10.70 (7.64).
Selected IR bands (cm-1): 3240 (νN-H2), 1235 (νC-O), 1630 (νC=N), 1563 (νC=N). Electronic
spectrum in CHCl3 solution, λ nm (ε M-1 cm-1): 343 (10140), 324 (10956), 310 (10991).
2.5. X-Ray Structure Determination:
Single crystals of 1 were obtained by slow evaporation of ethyl alcohol solution of the complex.
A deep yellow needle shaped crystal of 1 was chosen for X-ray diffraction study. Crystal data
and details of refinement for the complex VOL2S(OEt) are given in Table 1.2. The compound
crystallized in the monoclinic space group P21/c. Intensity data were collected at 100 K on a
14
Bruker Smart CCD area detector system using graphite- monochromatised Mo-K radiation ( =
0.71073 Å). The intensities were corrected for empirical absorption effects using SADABS [18].
The structure was solved by direct method. All non-hydrogen atoms were refined anisotropically
by full-matrix least squares, with a riding model for the hydrogen atoms, using the SHELXTL
package [19].
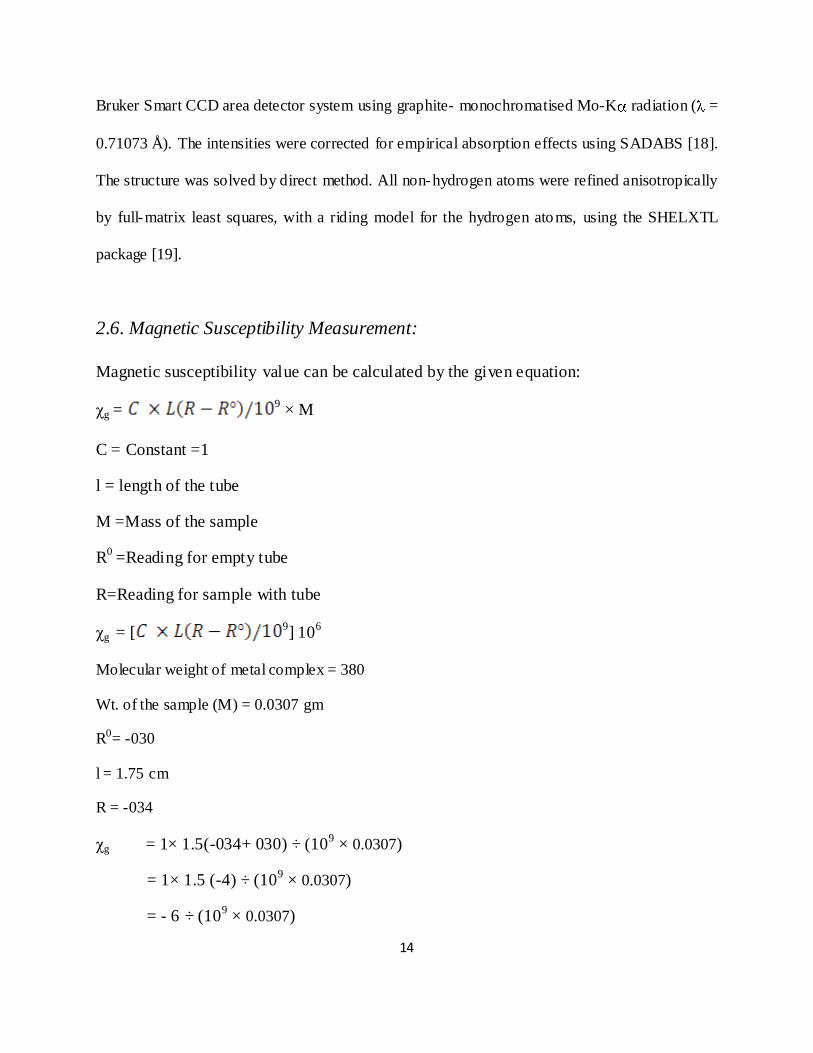
2.6. Magnetic Susceptibility Measurement:
Magnetic susceptibility value can be calculated by the given equation:
χg = 9 × M
C = Constant =1
l = length of the tube
M =Mass of the sample
R0
=Reading for empty tube
R=Reading for sample with tube
χg = [9] 10
6
Molecular weight of metal complex = 380
Wt. of the sample (M) = 0.0307 gm
R0= -030
l = 1.75 cm
R = -034
χg = 1× 1.5(-034+ 030) ÷ (109 × 0.0307)
= 1× 1.5 (-4) ÷ (109 × 0.0307)
= - 6 ÷ (109 × 0.0307)
15
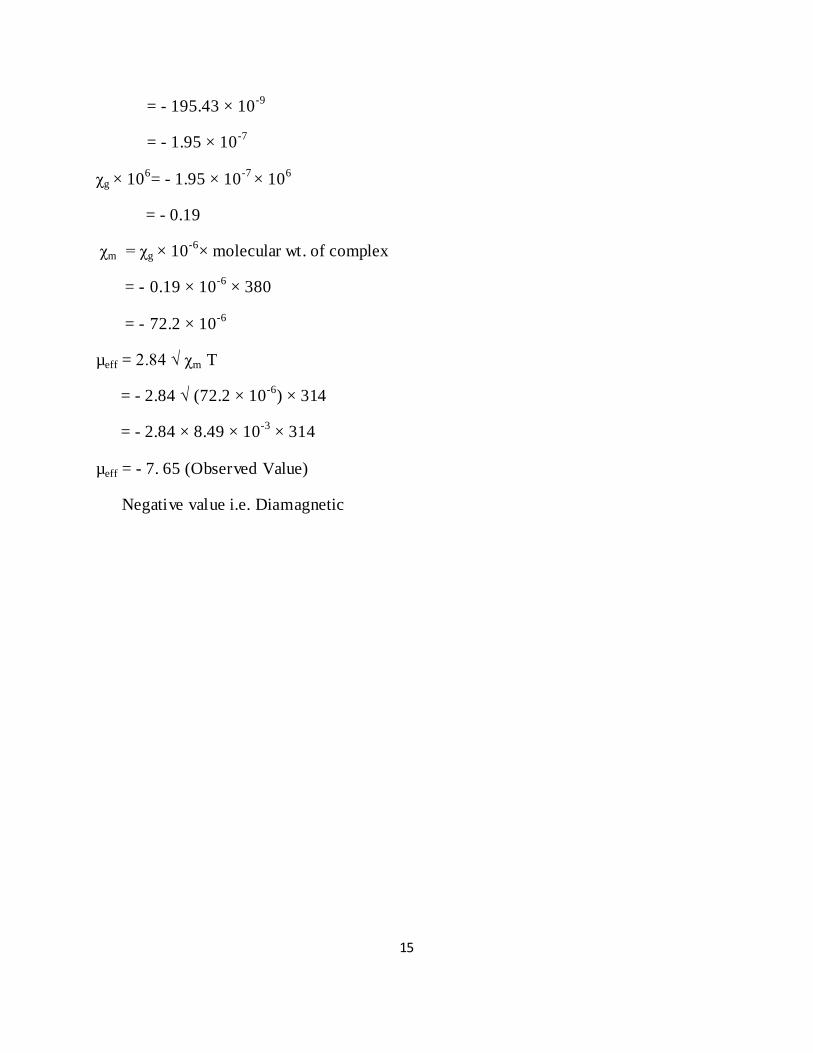
= - 195.43 × 10-9
= - 1.95 × 10-7
χg × 106= - 1.95 × 10
-7 × 10
6
= - 0.19
χm = χg × 10-6
× molecular wt. of complex
= - 0.19 × 10-6
× 380
= - 72.2 × 10⁻⁶
µeff = 2.84 √ χm T
= - 2.84 √ (72.2 × 10⁻⁶
) × 314
= - 2.84 × 8.49 × 10-3
× 314
µeff = - 7. 65 (Observed Value)
Negative value i.e. Diamagnetic
16
3. RESULTS AND DISCUSSION:
3.1. Protonated / Deprotonated form of Schiff’s Base:
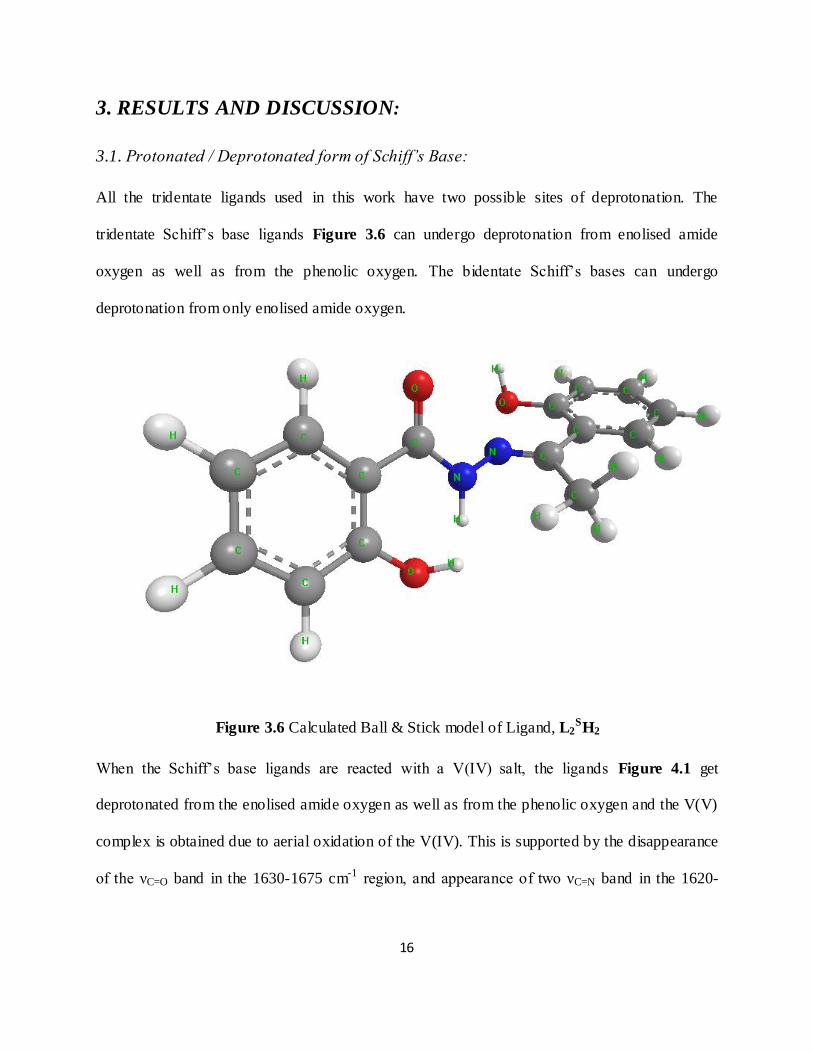
All the tridentate ligands used in this work have two possible sites of deprotonation. The
tridentate Schiff’s base ligands Figure 3.6 can undergo deprotonation from enolised amide
oxygen as well as from the phenolic oxygen. The bidentate Schiff’s bases can undergo
deprotonation from only enolised amide oxygen.
Figure 3.6 Calculated Ball & Stick model of Ligand, L2SH2
When the Schiff’s base ligands are reacted with a V(IV) salt, the ligands Figure 4.1 get
deprotonated from the enolised amide oxygen as well as from the phenolic oxygen and the V(V)
complex is obtained due to aerial oxidation of the V(IV). This is supported by the disappearance
of the νC=O band in the 1630-1675 cm-1 region, and appearance of two νC=N band in the 1620-

17
1550 cm-1 region [13, 25]. When they reacted with V(V), the ligands behaves same to that of
V(IV). So in both cases we get vanadium (V) complex.
Figure 4.1
O
N
NC
CH3
HO
*
*
*OH
O
N
NC
CH3
HO
*
*
*OH
-H+
+H+H
Keto form Enol form
2.3. Spectral characteristics
A. IR Spectra
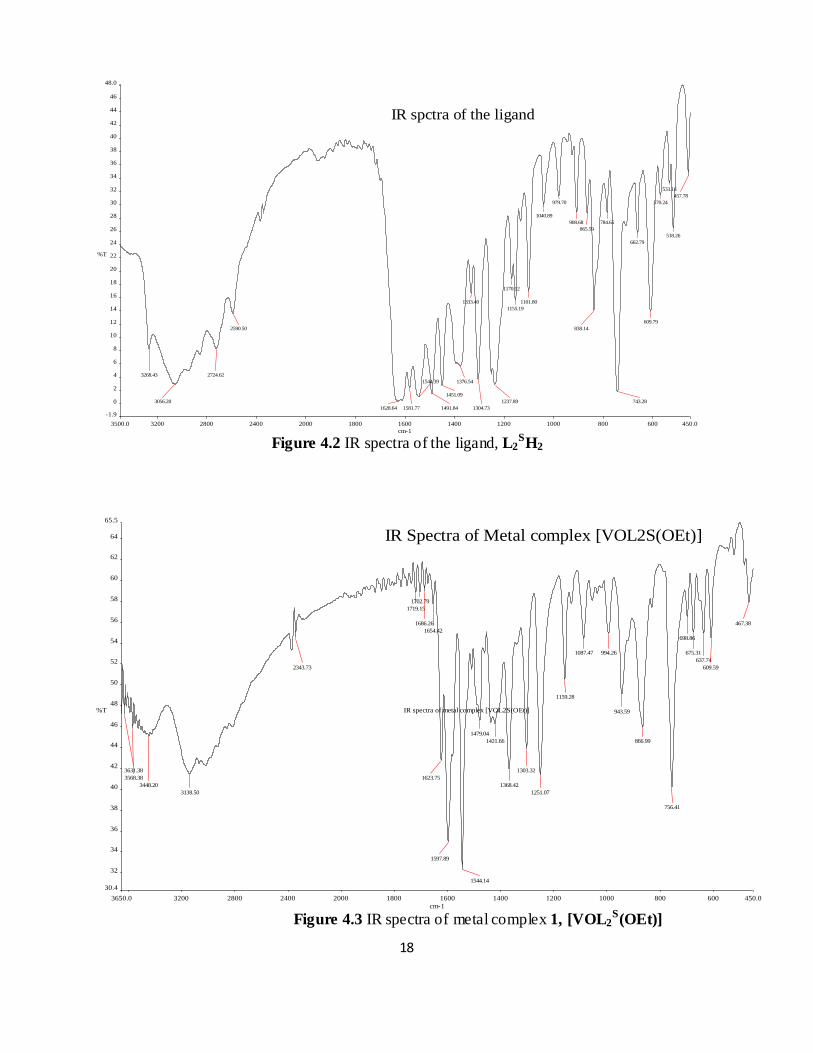
IR spectra of the ligand Figure 4.2 has several prominent bands at 3268, 3056 and 1628 cm-1 due
to (OH), (NH) and (C=O) stretching modes respectively, all of which are missing in the IR
spectra of complex 1 Figure 4.3. Characteristics strong bands in the spectra of both the ligand
and the complex 1 are located at 1625 cm-1 and 1558 cm-1 which arise due to (C=N) and
(C=C/aromatic) stretching modes of the ligand. In addition, each of the complex exhibits a
strong band in the 950-999 cm-1 region which is attributed to the V=O stretching mode. A new
band at 863cm-1 is located in the spectrum of the complex in solution (CHCl3), which is assigned
to asymmetric V-O-V bridge vibration [13, 25].
18
Figure 4.2 IR spectra of the ligand, L2SH2
3650.0 3200 2800 2400 2000 1800 1600 1400 1200 1000 800 600 450.0
30.4
32
34
36
38
40
42
44
46
48
50
52
54
56
58
60
62
64
65.5
cm-1
%T
IR Spectra of Metal complex [VOL2S(OEt)]
IR spectra of metal complex [VOL2S(OEt)]
3631.38
3568.38
3448.20
3138.50
2343.73
1719.15
1702.79
1686.26
1654.42
1623.75
1597.89
1544.14
1479.04
1421.66
1368.42
1303.32
1251.07
1159.28
1087.47 994.26
943.59
866.99
756.41
698.86
675.31
637.74
609.59
467.38
Figure 4.3 IR spectra of metal complex 1, [VOL2S(OEt)]
3500.0 3200 2800 2400 2000 1800 1600 1400 1200 1000 800 600 450.0
-1.9
0
2
4
6
8
10
12
14
16
18
20
22
24
26
28
30
32
34
36
38
40
42
44
46
48.0
cm-1
%T
IR spctra of the ligand
3268.43
3056.28
2724.62
2590.50
1628.64 1581.77
1544.39
1491.84
1451.09
1376.54
1333.40
1304.73
1237.89
1170.12
1155.19
1101.80
1040.89
979.70
908.68
865.59
838.14
784.65
743.28
662.79
609.79
570.24
533.16
518.26
457.78

19
IR Spectra of Complex 1 in Solution: Identification of the minor species:
When IR spectrum of complex 1 (KBr disc) is recorded Figure 4.4a, one strong, sharp (V=O)
band at 1000 cm-1 pointed to its monomeric nature. But when IR spectrum of 1 is recorded in
CHCl3 solution Figure 4.4b two new (V=O) bands appear at 1035 cm-1 and 1028 cm-1 and
another new band corresponding to the (V-O-V) mode is located at 890 cm-1. This band was
absent in the spectrum of 1 in the solid state and is diagnostic of a -oxo dimeric V(V) species
[13].
Figure 4.4 IR spectrum of 1, VOL2S(OEt) in KBr disc (a) and in CHCl3 (b)
20
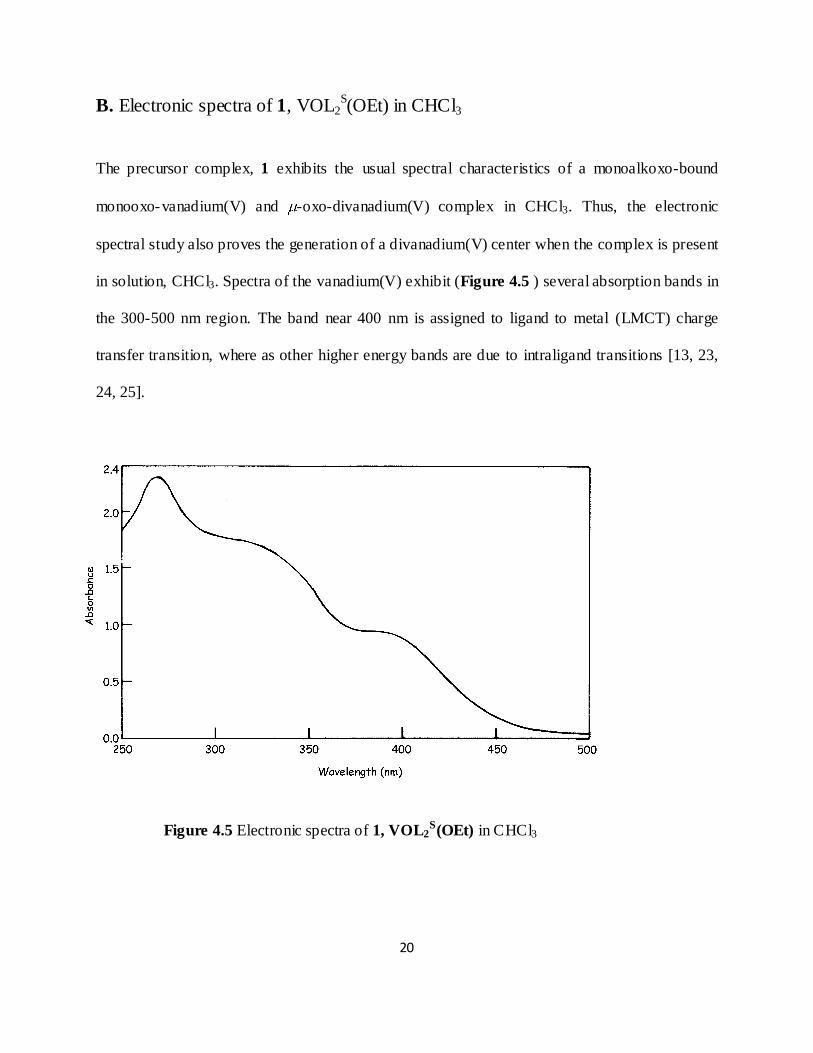
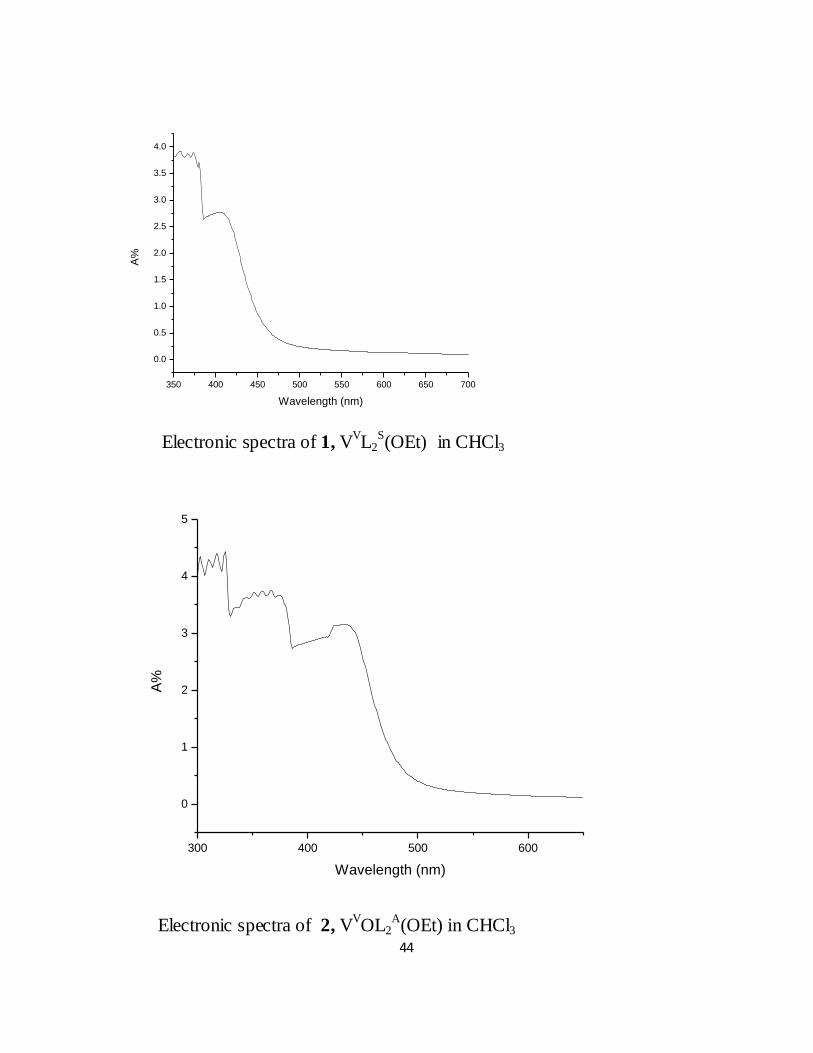
B. Electronic spectra of 1, VOL2S(OEt) in CHCl3
The precursor complex, 1 exhibits the usual spectral characteristics of a monoalkoxo-bound
monooxo-vanadium(V) and -oxo-divanadium(V) complex in CHCl3. Thus, the electronic
spectral study also proves the generation of a divanadium(V) center when the complex is present
in solution, CHCl3. Spectra of the vanadium(V) exhibit (Figure 4.5 ) several absorption bands in
the 300-500 nm region. The band near 400 nm is assigned to ligand to metal (LMCT) charge
transfer transition, where as other higher energy bands are due to intraligand transitions [13, 23,
24, 25].
Figure 4.5 Electronic spectra of 1, VOL2S(OEt) in CHCl3
21
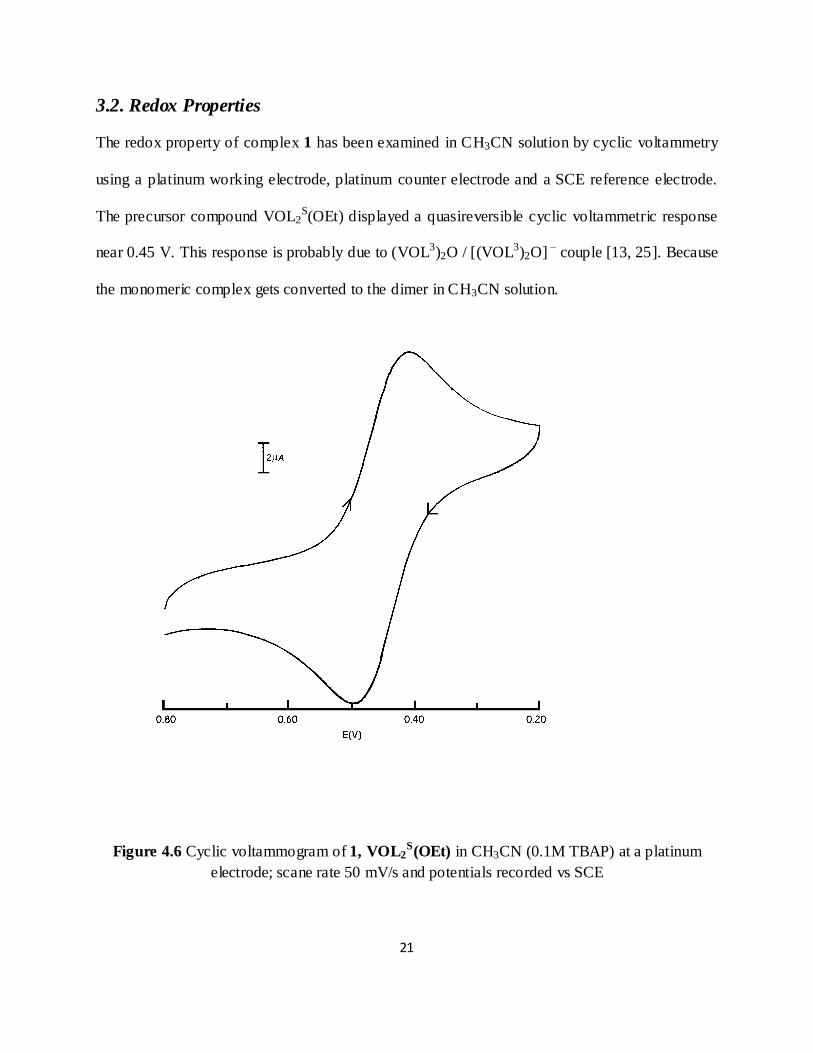
3.2. Redox Properties
The redox property of complex 1 has been examined in CH3CN solution by cyclic voltammetry
using a platinum working electrode, platinum counter electrode and a SCE reference electrode.
The precursor compound VOL2S(OEt) displayed a quasireversible cyclic voltammetric response
near 0.45 V. This response is probably due to (VOL3)2O / [(VOL3)2O] – couple [13, 25]. Because
the monomeric complex gets converted to the dimer in CH3CN solution.
Figure 4.6 Cyclic voltammogram of 1, VOL2S(OEt) in CH3CN (0.1M TBAP) at a platinum
electrode; scane rate 50 mV/s and potentials recorded vs SCE

22
2.4. Magnetic Study:
Since µeff value is negative, the metal complex 1 is diamagnetic indicating the presence of
vanadium in the +V oxidation state. The magnetic moment is changing with a d0 electronic
configuration of 1 (µeff = - 7.65) showing the oxidation of +IV to +V state (Method-1). But in
(Method-2) the magnetic moment is remains intact (both in d0) in the starting precursor and in
complex 1.
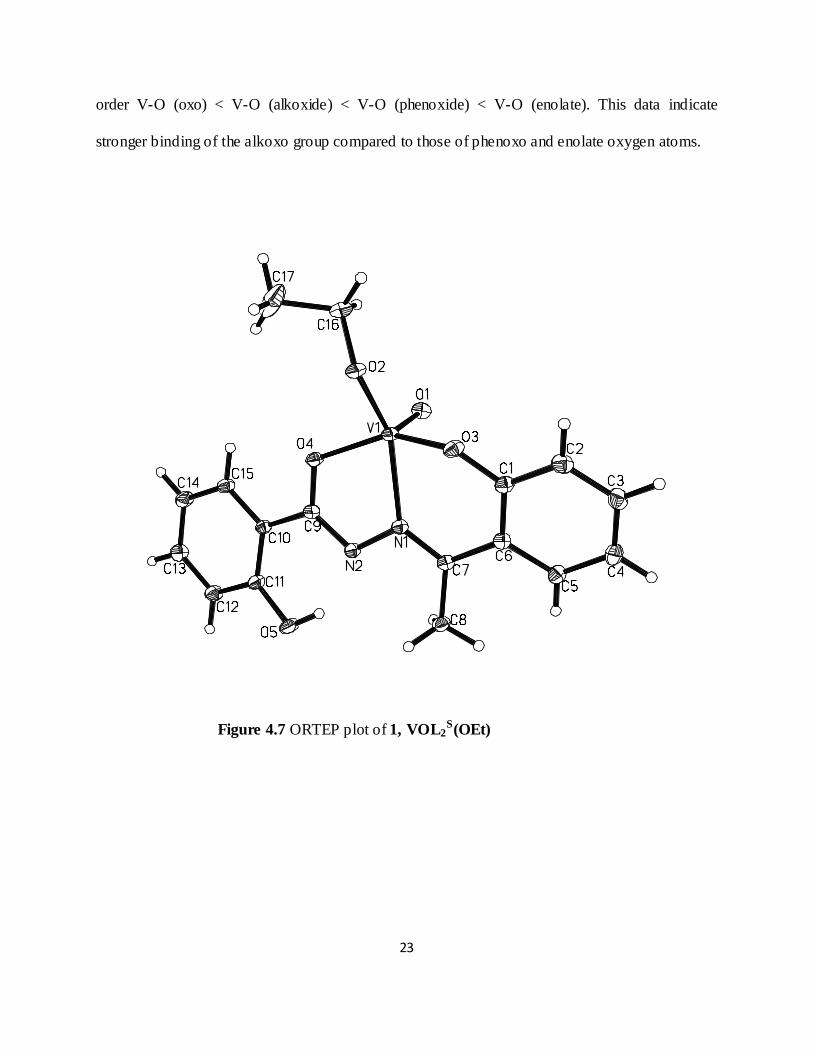
2.5. Description of Structure of Complex 1:
The molecular structure of 1 is shown in Figure 4.7 and important geometric parameters are
listed in Table 1.1. The VO4N coordination sphere around the mono alkoxo-bound monooxo-
vanadium(V) is grossly square pyramidal. The basal plane is made up by the phenolic oxygen
O(3), the enolic oxygen O(4), the imine nitrogen N(1) from the tridentate ligand and O(2) from
the deprotonated alkoxide oxygen. The Schiff base ligand 2-Hydroxyacetophenonehydrazone of
2-Hydroxybenzoylhydrazine Ligand (L2SH2) forms a six-membered and a five membered chelate
ring at the V(V) acceptor center. The apical position of square pyramid is occupied by the
terminal oxo-group O(1). The short V(1)-O(1) distance of 1.5871(9)Å indicates the presence of a
vanadium-oxygen double-bond (V = O) which is commonly found in five and six coordinated
octahedral complexes [17,20,25 ] of vanadium(IV) and (V). The four V-O bond lengths are
unequal; the V=O bond being the shortest and the V-O [enolate oxygen O(4)] being the longest.
The latter is subjected to the trans influence of the oxo oxygen. The V-O bond lengths follow the
23
order V-O (oxo) < V-O (alkoxide) < V-O (phenoxide) < V-O (enolate). This data indicate
stronger binding of the alkoxo group compared to those of phenoxo and enolate oxygen atoms.
Figure 4.7 ORTEP plot of 1, VOL2S(OEt)
24
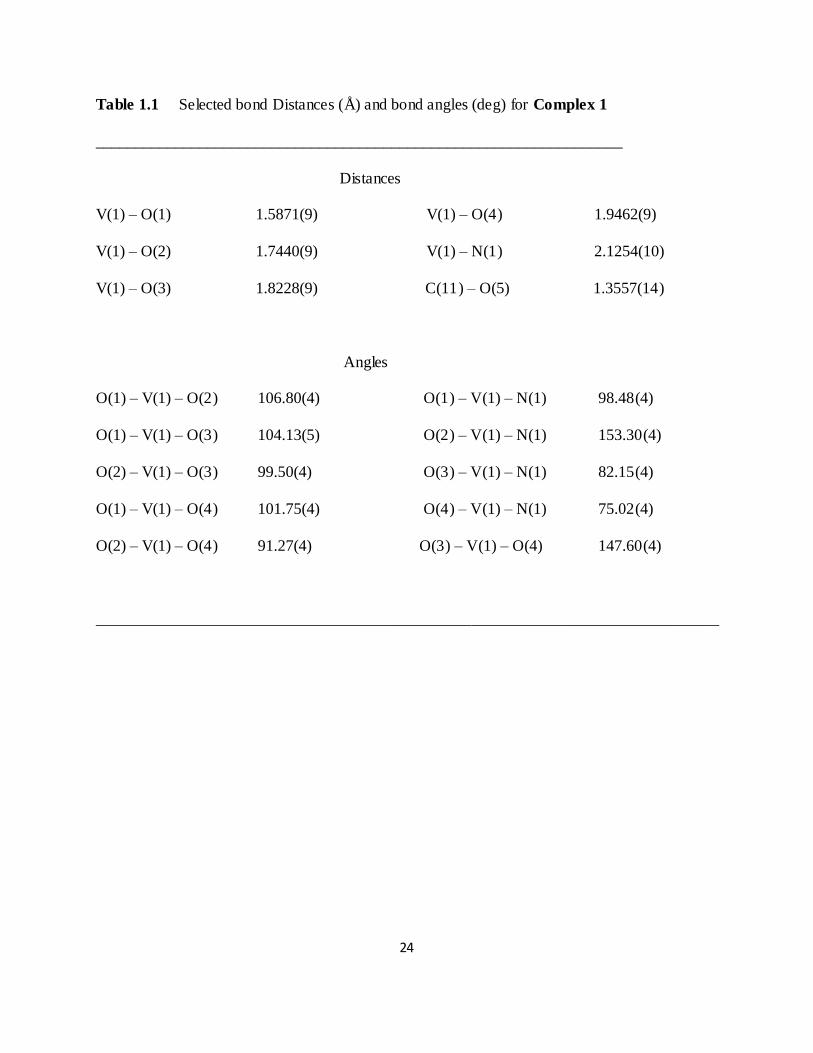
Table 1.1 Selected bond Distances (Å) and bond angles (deg) for Complex 1
__________________________________________________________________
Distances
V(1) – O(1) 1.5871(9) V(1) – O(4) 1.9462(9)
V(1) – O(2) 1.7440(9) V(1) – N(1) 2.1254(10)
V(1) – O(3) 1.8228(9) C(11) – O(5) 1.3557(14)
Angles
O(1) – V(1) – O(2) 106.80(4) O(1) – V(1) – N(1) 98.48(4)
O(1) – V(1) – O(3) 104.13(5) O(2) – V(1) – N(1) 153.30(4)
O(2) – V(1) – O(3) 99.50(4) O(3) – V(1) – N(1) 82.15(4)
O(1) – V(1) – O(4) 101.75(4) O(4) – V(1) – N(1) 75.02(4)
O(2) – V(1) – O(4) 91.27(4) O(3) – V(1) – O(4) 147.60(4)
______________________________________________________________________________
25
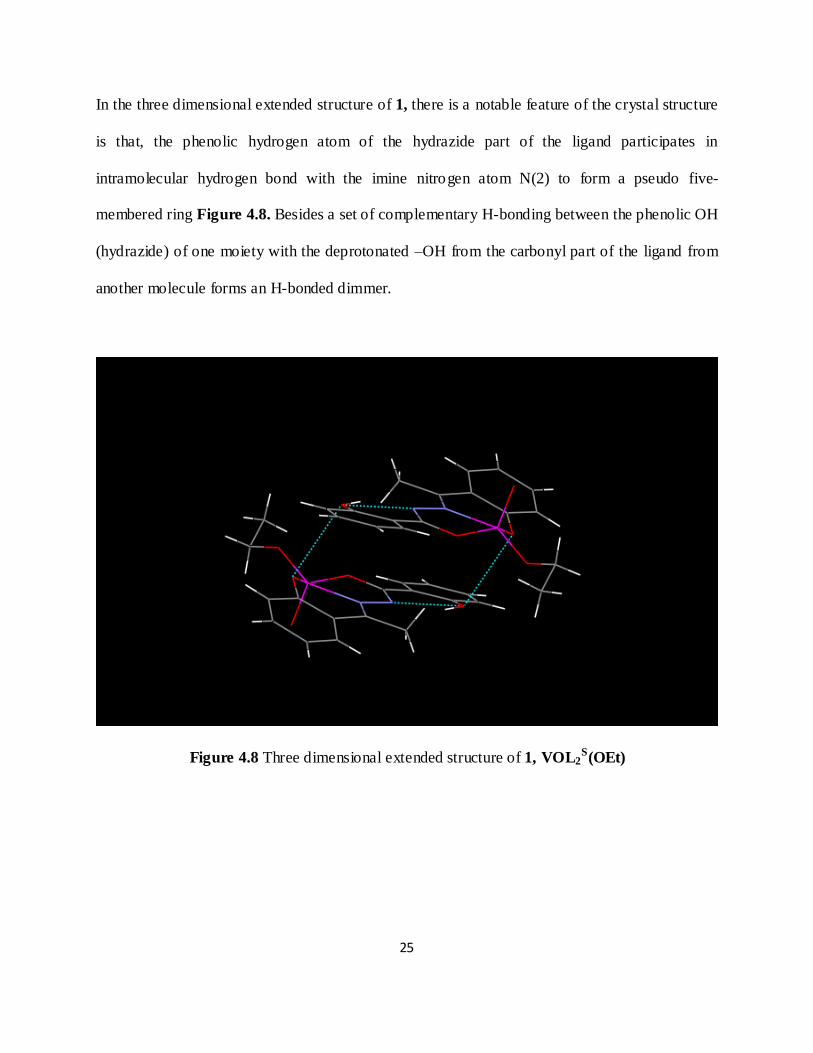
In the three dimensional extended structure of 1, there is a notable feature of the crystal structure
is that, the phenolic hydrogen atom of the hydrazide part of the ligand participates in
intramolecular hydrogen bond with the imine nitrogen atom N(2) to form a pseudo five-
membered ring Figure 4.8. Besides a set of complementary H-bonding between the phenolic OH
(hydrazide) of one moiety with the deprotonated –OH from the carbonyl part of the ligand from
another molecule forms an H-bonded dimmer.
Figure 4.8 Three dimensional extended structure of 1, VOL2S(OEt)

26
The packing diagram Figure 4.9 of complex 1 exhibits a intramolecular hydrogen bond between
the imine nitrogen atom N(2) and the phenolic hydrogen atom of the hydrazide part of the ligand
along b axis. Each cube can contain six metal complexes along b axis. There is also an
intermolecular hydrogen bond between the phenolic OH (hydrazide) of one moiety with the
deprotonated –OH from the carbonyl part of the ligand from another moiety.
Figure 4.9 Packing diagram of complex 1, VOL2S(OEt) along b axis
27
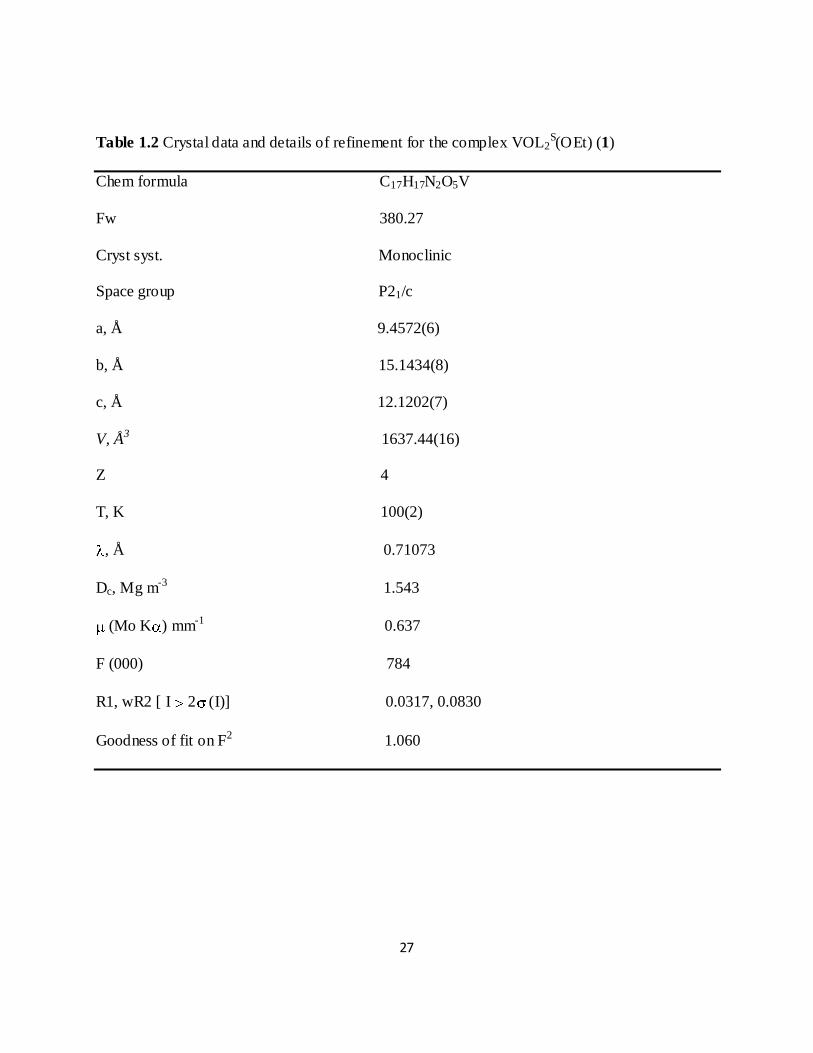
Table 1.2 Crystal data and details of refinement for the complex VOL2S(OEt) (1)
Chem formula C17H17N2O5V
Fw 380.27
Cryst syst. Monoclinic
Space group P21/c
a, Å 9.4572(6)
b, Å 15.1434(8)
c, Å 12.1202(7)
V, Å3 1637.44(16)
Z 4
T, K 100(2)
, Å 0.71073
Dc, Mg m-3 1.543
(Mo K ) mm-1 0.637
F (000) 784
R1, wR2 [ I 2 (I)] 0.0317, 0.0830
Goodness of fit on F2 1.060
28
3. CONCLUSION:
Several Schiff’s base hydrazone ligands were synthesized and successfully characterized by IR
and elemental (C, H, N) analyzer. The basic and electronic property of these ligands has been
nicely explored in the syntheses of various oxovanadium(V) complexes. One (complex 1) of the
five complexes reported here, has been fully characterized by IR, UV-visible spectroscopy,
magnetic susceptibility, cyclic voltammetry measurement, and structurally characterized by
single crystal X-Ray crystallography. This study indicates that the lower basic hydrazone ligands
(e.g., L2SH2) have the normal tendency to form monomeric complexes. I also have reported the
synthesis of few other oxovanadium complexes (2-4) but due to insufficient data and shortage of
time we are unable to report the complete characterization of all those complexes.

29
O
N O
OEt
V
O
O
N O
V
O
O
O N
O
V
O
Electroreduction
Figure 5.1 Reaction diagram for the isolation of divanadium(V) from vanadium (V),and mixed valence V(IV,V) complex
VVOL(OEt)
VVVIVL2O3-
STUDIES UNDER PROCESS:
Step DStep A
Step C
Kept in
CHCl3/CH3CN
Solution
CHCl3,H2O
Stir
VIVO(L)(bipy)
bipy,
EtOHReflux
Aerial Oxidation
1/2 O2
Step E
Passage of
Oxygen
[{VVO(L)}2 -O]
Step B
VIVO(L)(phen)
phen,
EtOHReflux
Aerial Oxidation
1/2 O2
Aerial Oxidation
1/2 O2
Aerial Oxidation
1/2 O2
30
OH
OH
OH
Catalyst, O2
Solvent, Temp
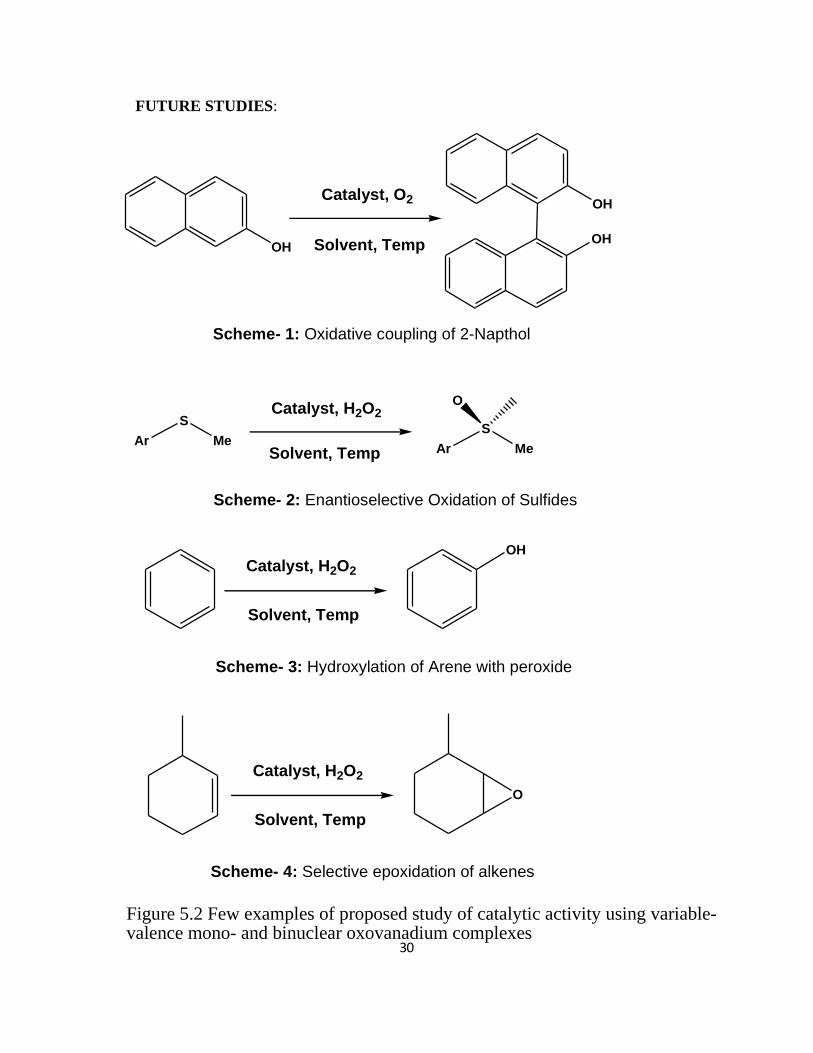
Scheme- 1: Oxidative coupling of 2-Napthol
Ar
S
MeAr
S
Me
OCatalyst, H2O2
Solvent, Temp
Scheme- 2: Enantioselective Oxidation of Sulfides
OH
Catalyst, H2O2
Solvent, Temp
Scheme- 3: Hydroxylation of Arene with peroxide
Catalyst, H2O2
Solvent, Temp
O
Scheme- 4: Selective epoxidation of alkenes
Figure 5.2 Few examples of proposed study of catalytic activity using variable-valence mono- and binuclear oxovanadium complexes
FUTURE STUDIES:
31
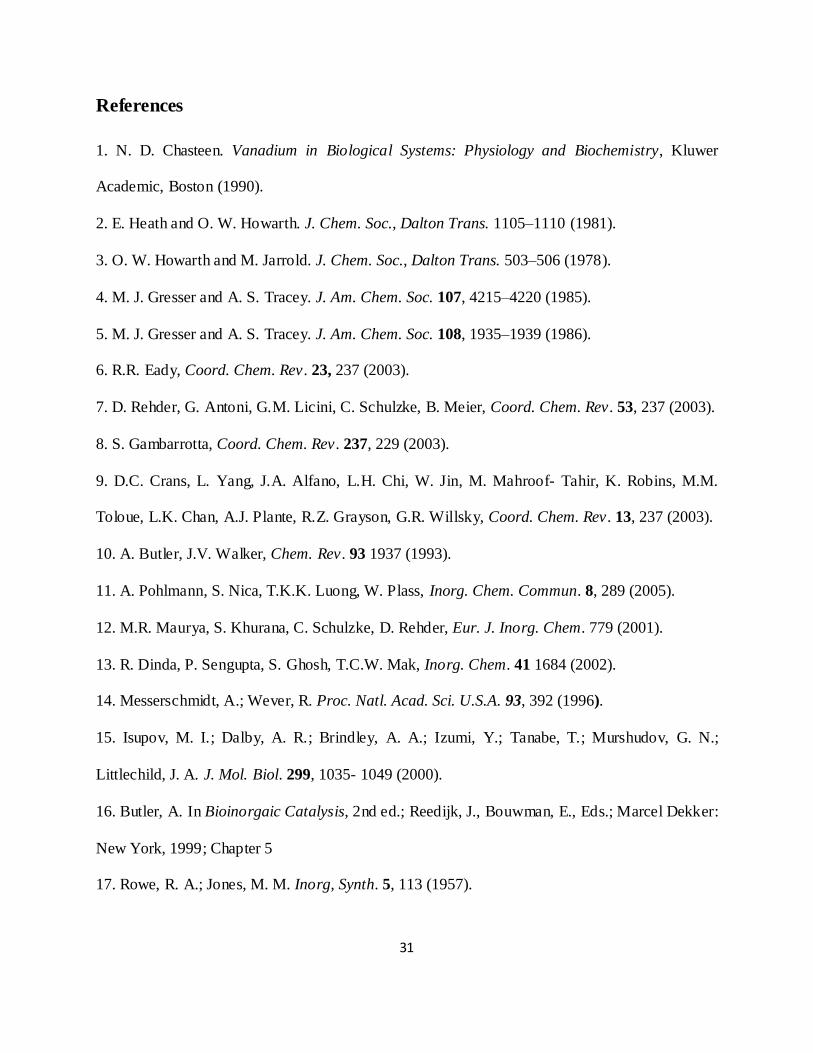
References
1. N. D. Chasteen. Vanadium in Biological Systems: Physiology and Biochemistry, Kluwer
Academic, Boston (1990).
2. E. Heath and O. W. Howarth. J. Chem. Soc., Dalton Trans. 1105–1110 (1981).
3. O. W. Howarth and M. Jarrold. J. Chem. Soc., Dalton Trans. 503–506 (1978).
4. M. J. Gresser and A. S. Tracey. J. Am. Chem. Soc. 107, 4215–4220 (1985).
5. M. J. Gresser and A. S. Tracey. J. Am. Chem. Soc. 108, 1935–1939 (1986).
6. R.R. Eady, Coord. Chem. Rev. 23, 237 (2003).
7. D. Rehder, G. Antoni, G.M. Licini, C. Schulzke, B. Meier, Coord. Chem. Rev. 53, 237 (2003).
8. S. Gambarrotta, Coord. Chem. Rev. 237, 229 (2003).
9. D.C. Crans, L. Yang, J.A. Alfano, L.H. Chi, W. Jin, M. Mahroof- Tahir, K. Robins, M.M.
Toloue, L.K. Chan, A.J. Plante, R.Z. Grayson, G.R. Willsky, Coord. Chem. Rev. 13, 237 (2003).
10. A. Butler, J.V. Walker, Chem. Rev. 93 1937 (1993).
11. A. Pohlmann, S. Nica, T.K.K. Luong, W. Plass, Inorg. Chem. Commun. 8, 289 (2005).
12. M.R. Maurya, S. Khurana, C. Schulzke, D. Rehder, Eur. J. Inorg. Chem. 779 (2001).
13. R. Dinda, P. Sengupta, S. Ghosh, T.C.W. Mak, Inorg. Chem. 41 1684 (2002).
14. Messerschmidt, A.; Wever, R. Proc. Natl. Acad. Sci. U.S.A. 93, 392 (1996).
15. Isupov, M. I.; Dalby, A. R.; Brindley, A. A.; Izumi, Y.; Tanabe, T.; Murshudov, G. N.;
Littlechild, J. A. J. Mol. Biol. 299, 1035- 1049 (2000).
16. Butler, A. In Bioinorgaic Catalysis, 2nd ed.; Reedijk, J., Bouwman, E., Eds.; Marcel Dekker:
New York, 1999; Chapter 5
17. Rowe, R. A.; Jones, M. M. Inorg, Synth. 5, 113 (1957).
32
18. G. M. Sheldrick, SADABS, Program for Empirical Absorption Correction of Area Detector
Data, University of Göttingen, 1996.
19.G. M. Sheldrick, SHELXTL 5.10, Structure Determination Software Package, Bruker
Analytical X-ray Systems, Madison, WI, 1998.
20. M. R. Maurya, S. Khurana, C. Schulzke and D. Rehder, Eur. J. Inorg. Chem. 779 (2001).
21. M. Moon, M. Pyo, Y. C. Myoung, C. Ahn and M. S. Lah, Inorg. Chem. 40, 554 (2001).
22. D. P. Kessissoglou, W. M. Butler, V. L. Pecoraro, J. Chem. Soc. Chem. Commun. 1253
(1986).
23. S. K. Dutta, S. B. Kumar, S. Bhattacharyya, E. R. T. Tiekink, and M. Chaudhury, Inorg.
Chem., 36, 4954 (1997).
24. S. Mondal, P. Ghosh, A. Chakraborty, Inorg. Chem. 36, 59 (1997).
25. R. Dinda, P. Sengupta, M Sutradhar, S. Ghosh and T.C.W. Mak, Inorg. Chem. 47, 5634
(2008).
26. G. Asgedom, A. Sreedhara, J. Kivikoski, J. Valkonen, E. Kolehmainnen and C. P. Rao,
Inorg. Chem. 35, 5674 (1996).
27. N. R. Sangeetha, S. Pal, Bull. Chem. Soc. Jpn. 73, 357 (2000).
28. M. Chatterjee, B. M. Wu, T. C. W. Mak, and S. Ghosh, Polyhedron. 17, 1369 (1998).
29. A. Butler and H. Eckert, J. Am. Chem. Soc. 111, 2802 (1989).
30. L. C. Cantley, Jr., L. Josephson, R. Warner, M. Yanagisawa, C. Lechene, G. Guidotti. J.
Biol.Chem. 252, 7421–7423 (1977).
31. E. Heath and O. W. Howarth. J. Chem. Soc., Dalton Trans. 1105–1110 (1981).
32. O. W. Howarth. Prog. NMR Spectrosc. 22, 453–483 (1990).
33. M. J. Gresser and A. S. Tracey. J. Am. Chem. Soc. 107, 4215–4220 (1985).
33
34. A. F. Nour-Eldeen, M. M. Craig, M. J. Gresser. J. Biol. Chem. 260, 6836–6842 (1985).
35. K. H. Thompson, J. H. McNeill, C. Orvig. Chem. Rev. 2561–2571 (1999).
36. D. Rehder. Inorg. Chem. Commun. 6, 604–617 (2003).
37. H. Glas, E. HerdTweck, G. R. J. Artus and W. R. Thil, Inorg. Chem. 37, 3644 (1998).
38. C. Tsiamis, B. Voulgaropoulos, D. Charistos, G. P. Voutsas, C. A. Kavounis, Polyhedron,
19, 2000 (2003)
39. Y. Shechter, S. J. D. Karlish, Nature, 284, 556 (1980).
40. C. E. Heyliger, A. G. Tahiliani and J. H. McNeill, Science, 227, 1474 (1985).
41. Weyand. M.; Hecht, H. J.; Keiss, M.; Liaud, M. F.; Vilter, H.; Schomburg, D. J. Mol. Biol.,
293, 595-611(1999).
42. K. K. Rajak, S. Mondal and S. P. Rath, Polyhedron, 19, 931 (2000).
43. S. P. Rath, S. Mondal and A. Chakraborty, Inorg. Chim. Acta, 263, 247 (1997).
44. M. Chatterjee, B. M. Wu, T. C. W. Mak, and S. Ghosh, Polyhedron. 17, 1369 (1998).
45. M. Chatterjee, A. K. Nandi, and S. Ghosh,. Transition Met. Chem. 24, 183 (1999).
46. D. P. Kessissoglou, W. M. Butler, V. L. Pecoraro, J. Chem. Soc. Chem. Commun. 1253
(1986).
47. G. Asgedom, A. Sreedhara, J. Kivikoski, J. Valkonen, E. Kolehmainnen and C. P. Rao,
Inorg. Chem. 35, 5674 (1996).
48. A. Maity, and S. Ghosh. Proc. Indian Acad. Sci. (Chem. Sci.). 104, 369 (1992).
49. A. Maity, and S. Ghosh, J. Inorg. Biochem. 36, 131 (1989).
50. J. M. Arber, E. deBoer, C. D. Garner, S. S. Hasnain and R Wever, Biochemistry, 28, 7968
(1989).
34
SPECTRAL DATA
35
3600.0 3200 2800 2400 2000 1800 1600 1400 1200 1000 800 600 450.0
-4.4
-2
0
2
4
6
8
10
12
14
16
18
20
22
24
26
28
30
32
34
36
38
40
42
44
46
48.0
cm-1
%T
3268.43
3056.28
2724.62
2590.50
1628.64
1581.77
1544.39
1491.84
1451.09
1376.54
1333.40
1304.73
1237.89
1170.12
1155.19
1101.80
1040.89
979.70
908.68
865.59
838.14
784.65
743.28
662.79
609.79
570.24
533.16
518.26
457.78
IR Spectral Data of L2SH2
36
3700.0 3200 2800 2400 2000 1800 1600 1400 1200 1000 800 600 450.0
4.2
10
15
20
25
30
35
40
45
50
55
60
65
70
75
80
85
90
94.0
cm-1
%T
3476.74
3364.78
3207.48
3028.69
2992.36
2362.82
1627.44
1611.31
1573.87
1545.99
1524.09
1493.14
1449.86
1397.34
1365.79
1327.72
1292.67
1256.83
1158.61
1119.00
1025.92
976.01
942.93
897.10
841.09
817.82
786.53
747.67
701.05
661.85
618.44
556.05
529.01
511.23
IR Spectral Data of L2A
H2

37
3650.0 3200 2800 2400 2000 1800 1600 1400 1200 1000 800 600 450.0
1.3
5
10
15
20
25
30
35
40
45
50
55
60
65
71.3
cm-1
%T
3240.14
3027.94
2932.87
2724.22
2582.57
1805.82
1629.38
1560.19
1492.24
1455.76
1377.64
1310.69
1234.41
1178.43
1152.30
1096.77
1082.34
1064.67
955.85
925.89
855.92
822.09
783.85
749.42
689.54
666.83
629.90
532.09
507.78
486.23
IR Spectral Data of L1SH1

38
3650.0 3200 2800 2400 2000 1800 1600 1400 1200 1000 800 600 450.0
-4.7
-2
0
2
4
6
8
10
12
14
16
18
20
22
24
26
28
30
32
34
36
38
40
42
44.5
cm-1
%T
3276.35
3053.18
2723.43
2586.15
1638.00
1606.11
1546.73
1491.97
1455.36
1385.87
1314.58 1234.67
1159.35
1104.16
1058.88
975.68
952.42
906.30
869.23
831.15
789.41
750.58
691.94
630.15
560.24
532.18
IR Spectral Data of L2SH1
39
3600.0 3200 2800 2400 2000 1800 1600 1400 1200 1000 800 600 450.0
39.5
42
44
46
48
50
52
54
56
58
60
62
64
66
68
70
72
74
76
78
80
82
84
86
88.6
cm-1
%T
3570.06
2971.60
2363.84
2343.26
1720.42
1687.58
1623.34
1594.79
1544.41
1525.51
1477.72
1439.16
1363.12
1295.07
1252.33
1228.34
1157.27
1137.58
1086.02
1020.53
991.45
911.88
893.77
875.48
855.67
754.16
696.22
677.55
634.04
613.43
523.93
468.87
IR Spectral Data of Complex-1, [VVOL2
S(OEt)] (Method-1)
40
3600.0 3200 2800 2400 2000 1800 1600 1400 1200 1000 800 600 450.0
54.1
60
65
70
75
80
85
90
95
100
105
110
115
120
125
130
135.1
cm-1
%T
3590.393570.15
3551.36
2975.232920.232861.78
2364.39
2343.77
1720.41
1704.11
1687.69
1620.73
1598.86
1543.15
1479.73
1437.61
1370.37
1342.88
1302.92
1250.93
1162.89
1136.03
1085.75
1053.13
991.25
946.71
918.63
874.48
752.06
697.33
677.74
652.28
607.11
551.71
520.92
470.80
IR Spectral Data of Complex-1, [VVOL2
S(OEt)] ( Method-2)
41
3600.0 3200 2800 2400 2000 1800 1600 1400 1200 1000 800 600 450.0
72.1
74
76
78
80
82
84
86
88
90
92
94
96
98
100
102
104
106
108
110
112
114
116.7
cm-1
%T
3590.14
3569.98
3160.21
2363.37
2343.01
1720.50
1703.63
1687.35
1655.63
1615.66
1596.95
1579.41
1542.36
1511.13
1478.70
1436.69
1365.22
1306.24
1255.57
1158.01
1082.13
994.10 919.35
871.47
750.24
694.95
674.85
638.66
612.53
521.32
IR Spectral Data of Complex-2, [VVOL2
A(OEt)]

42
3600.0 3200 2800 2400 2000 1800 1600 1400 1200 1000 800 600 450.0
20.8
22
24
26
28
30
32
34
36
38
40
42
44
46
48
50
52
54
56
58
60
61.9
cm-1
%T
3590.77
3570.33
3059.36
2365.03
2344.07
1720.51
1703.47
1624.25
1597.48
1562.14
1535.91
1492.07
1443.02
1369.54
1306.98
1278.93
1255.57
1159.72
1097.85
1039.95
1001.52
926.98
866.72
836.63
763.08
700.13
677.65
631.23
544.27
493.41
IR Spectral Data of Complex-3, [VVO(L2
S)2(OEt)]

43
3600.0 3200 2800 2400 2000 1800 1600 1400 1200 1000 800 600 450.0
4.5
10
15
20
25
30
35
40
45
50
55
60
65
71.0
cm-1
%T
3240.06
3028.12
2934.56
2856.20
2724.28
2584.50
2359.42
1945.48
1805.79
1630.79
1563.93
1492.63
1456.86
1380.05
1312.02
1235.76
1178.27
1153.19
1097.37
1082.78
1065.30
956.47
926.16
857.37
783.69
751.13
690.06
667.27
643.23
533.59
508.47
486.83
IR Spectral Data of Complex-4, [VVO(L1
S)3]
44
350 400 450 500 550 600 650 700
0.0
0.5
1.0
1.5
2.0
2.5
3.0
3.5
4.0
A%
Wavelength (nm)
Electronic spectra of 1, VVL2
S(OEt) in CHCl3
300 400 500 600
0
1
2
3
4
5
A%
Wavelength (nm)
Electronic spectra of 2, VVOL2
A(OEt) in CHCl3

45
300 400 500 600
-0.5
0.0
0.5
1.0
1.5
2.0
2.5
3.0
3.5
4.0
A%
Wavelength (nm)
Electronic spectra of 4,VVO(L1
S)3 in CHCl3