Embed Size (px)
Citation preview

RESEARCH ARTICLE
Synthesis and characterization of a magnetic
adsorbent from negatively-valued iron mud
for methylene blue adsorption
Jiancong Liu1, Yang Yu1,2, Suiyi Zhu1,3*, Jiakuan Yang4, Jian Song4, Wei Fan1,
Hongbin Yu1,3, Dejun Bian1, Mingxin Huo1,3*
1 Science and Technology Innovation Center for Municipal Wastewater Treatment and Water Quality
Protection, Northeast Normal University, Changchun, China, 2 Key Laboratory of Songliao Aquatic
Environment (Ministry of Education), Jilin Jianzu Univerisity, Changchun, China, 3 Engineering Lab for Water
Pollution Control and Resources Recovery, Northeast Normal University, Changchun, China, 4 School of
Environmental Science & Engineering, Huazhong University of Science and Technology, Wuhan, China
* [email protected] (SZ); [email protected] (MH)
Abstract
With increasing awareness of reduction of energy and CO2 footprint, more waste is consid-
ered recyclable for generating value-added products. Here we reported the negatively-val-
ued iron mud, a waste from groundwater treatment plant, was successfully converted into
magnetic adsorbent. Comparing with the conventional calcination method under the high
temperature and pressure, the synthesis of the magnetic particles (MPs) by Fe2+/Fe3+
coprecipitation was conducted at environment-friendly condition using ascorbic acid (H2A)
as reduction reagent and nitric acid (or acid wastewater) as leaching solution. The MPs with
major component of Fe3O4 were synthesized at the molar ratio (called ratio subsequently) of
H2A to Fe3+ of iron mud� 0.1; while amorphous ferrihydrite phase was formed at the ratio�
0.05, which were confirmed by vibrating sample magnetometer (VSM), X-ray diffraction
(XRD) and X-ray photoelectron spectroscopy (XPS). With the ratio increased, the crystalline
size and the crystallization degree of MPs increased, and thus the Brunauer-Emmett-Teller
(BET) surface and the cation-exchange capacity (CEC) decreased. MPs-3 prepared with
H2A to Fe3+ ratio of 0.1 demonstrated the highest methylene blue (MB) adsorption of 87.3
mg/g and good magnetic response. The adsorption of MB onto MPs agreed well with the
non-linear Langmuir isotherm model and the pseudo-second-order model. Pilot-scale
experiment showed that 99% of MB was removed by adding 10 g/L of MPs-3. After five
adsorption-desorption cycles, MPs-3 still showed 62% removal efficiency for MB adsorption.
When nitric acid was replaced by acid wastewater from a propylene plant, the synthesized
MPs-3w showed 3.7 emu/g of saturation magnetization (Ms) and 56.7 mg/g of MB adsorp-
tion capacity, 2.8 times of the widely used commercial adsorbent of granular active carbon
(GAC). The major mechanism of MPs adsorption for MB was electrostatic attraction and cat-
ion exchange. This study synthesized a magnetic adsorbent from the negatively-valued iron
mud waste by using an environment-friendly coprecipitation method, which had a potential
for treatment of dye wastewater.
PLOS ONE | https://doi.org/10.1371/journal.pone.0191229 February 2, 2018 1 / 22
a1111111111
a1111111111
a1111111111
a1111111111
a1111111111
OPENACCESS
Citation: Liu J, Yu Y, Zhu S, Yang J, Song J, Fan
W, et al. (2018) Synthesis and characterization of a
magnetic adsorbent from negatively-valued iron
mud for methylene blue adsorption. PLoS ONE 13
(2): e0191229. https://doi.org/10.1371/journal.
pone.0191229
Editor: Yogendra Kumar Mishra, Institute of
Materials Science, GERMANY
Received: July 26, 2017
Accepted: December 29, 2017
Published: February 2, 2018
Copyright: © 2018 Liu et al. This is an open access
article distributed under the terms of the Creative
Commons Attribution License, which permits
unrestricted use, distribution, and reproduction in
any medium, provided the original author and
source are credited.
Data Availability Statement: All relevant data are
within the paper and its Supporting Information
files.
Funding: This work was supported by the National
Natural Science Foundation of China (Granted
No.51578118, 51238001, 51408110 and
51378098), the Major Science and Technology
Program for Water Pollution Control and Treatment
of China (Granted No. 2014ZX07201-011-004-2),
the Jilin Provincial Natural Science Foundation
(Granted No. 20150101072JC) and the Long-term
Introduction
With the trend of urbanization, more and more waste is generated in big cities and must be
treated in a renewable and sustainable way. Iron mud waste was generated from the ground-
water treatment plant and usually contains 3% solids, in which iron and other impurities, such
as aluminum, calcium and waste fibers, were present. Iron mud waste are usually treated by
naturally drying at the dumping site [1, 2] and the run-off of toxic compounds from it may
contaminate nearby soil and water, a great threat of the environment [3]. With the tightening
environmental regulations, chemical coagulation followed by mechanical filtration becomes a
dominant method in iron mud disposal before sending to landfill, but the cost is high.
Over the past years, studies have been conducted to recover valuable materials from iron
mud at aluminum refineries [4], plating factories [5] and steel company [6], such as pigments
for mortar and concrete [5, 7], and adsorbents for removal of heavy metals [4, 8] and dyes [2].
In conversion of iron oxide in iron mud to magnetite for synthesis of adsorbent, hydrothermal
treatment is usually used at 260˚C with adding iron powder [9], roasting with pyrite [10] or
charcoal, or injecting with reducing gas, such as H2 [8], methane [11] or natural gas [12]. In
our previously studies, a reduced temperature of 180˚C was used to convert iron mud to MPs
by using glycol as a reduction reagent [2]. However, in all the cases, significant energy is
demanded in keeping the high temperatures and long heating hours in synthesis of the mag-
netic adsorbents. Thus, it is important to find an environment-friendly method to transform
iron mud to magnetite. Coprecipitation of Fe2+/Fe3+ mixed salt under alkaline conditions is
cost-effective and scaled up easily, which has been widely used in preparing MPs recently [13].
Akin et al. reported [4] that Fe3O4 nano-particles were coprecipitated by using FeCl2.4H2O
and Fe3+ solution after microwave digestion of iron mud. The resulting adsorbent had a high
capacity of 0.4 mg/g in adsorbing arsenate from groundwater. Wu et al. [14] also reported that
Fe3O4 nano-particles were obtained by adding FeSO4.7H2O to HCl-digested iron ore tailings.
Despite the Fe3O4 particles were successfully synthesized in both studies, the production cost
may be significantly increased by adding pure ferrous ions in coprecipitation.
It was reported that ascorbic acid (H2A) was applied in Fenton reaction to reduce Fe3+,
Cu2+ and Mn2+ ions [15] to produce hydroxide radical for oxidation of organic pollutants
[16]. Fe3+ in iron mud can be partially reduced by H2A to generate Fe2+ in MP in situ produc-
tion. Therefore, Fe3+ from iron mud waste was the sole iron source without adding pure Fe2+
ions. Recently, H2A was successfully used by Gupta et al in Fe3+/Fe2+ coprecipitation [17]. It
was also used by Nene et al [18] to reduce Fe(ACAC)3 in diphenyl-ether solution but the reac-
tions had to be conducted by refluxing the reactants at a high temperature of 190˚C for 1 hour.
In the present study, Fe3+ was partially reduced by H2A after iron mud was dissolved with
nitric acid and the magnetic adsorbent was synthesized via Fe2+/Fe3+ coprecipitation at room
temperature. To further reduce the production cost, acid wastewater from a propylene plant
was used to replace nitric acid in digestion of iron mud. The obtained MPs were further inves-
tigated to remove MB from a synthetic wastewater. To our knowledge, it was for the first time
to report to synthesize Fe3O4 particles at the environment-friendly room temperature by H2A
reduction of Fe3+ ions in low solid content of iron mud for Fe2+/Fe3+ coprecipitation.
Materials and methods
We had received approval from the Yatai-Longtan Cement Co. Ltd to collect iron mud form
its groundwater plant. This study did not involve human participants, specimens or tissue
samples, or vertebrate animals, embryos or tissues. In this study, no specific permissions were
required for these locations/activities, and provide details on why this is the case. The field
studies did not involve endangered or protected species.
Magnetic adsorbent for MB removal
PLOS ONE | https://doi.org/10.1371/journal.pone.0191229 February 2, 2018 2 / 22
Program in “1000 Talent Plan for High-Level
Foreign Experts” (Granted No. WQ20142200209).
Competing interests: The authors have declared
that no competing interests exist.
Abbreviations: H2A, ascorbic acid; HA-, ascorbate;
2,3-DKG, L-diketogulonate; DHA, dehydroascorbic
acid; GAC, HA granule active carbon; Fe(ACAC)3,
iron(III) acetylacetonate; MB, methylene blue; MPs,
magnetic particles; Ms, saturation magnetization;
FWHM, full-width-at-half-maximum; FE-SEM, field
emission scanning electron microscope; VSM,
vibrating sample magnetometer; XPS, X-ray
photoelectron spectroscopy; XRD, X-ray
diffraction; BET, Brunauer-Emmett-Teller; CEC,
cation exchange capacity.
Materials
Iron mud was acquired from the groundwater treatment plant of Jilin Yatai cement company
(China), and vacuum-dried at 80˚C for 2h before using for Fe3O4 synthesis. The composition
of iron mud was determined by X-ray fluorescence (XRF, ZSX Primus II, Rigaku, Japan). The
major components of iron mud solids were quartz and albite and the content of total iron (Fe2
+ and Fe3+) was 16.6 wt%. Acid wastewater was acquired from the propylene plant of Jilin pet-
rochemical company (S1 Table). Nitric acid and H2A were purchased from Sinopharm Chem-
ical Reagent Co., Ltd. (Beijing, China). The chemically pure grade GAC was supplied by
Tianjin Fuchen Chemical Reagent Factory (Tianjing, China).
MPs preparation
0.8 g of the dried iron mud was mixed with 30 mL of 2% nitric acid under magnetic stirring
over night. After iron mud was dissolved, the suspension was settled for 5 min before the red-
dish-brown supernatant was poured into a 50 mL Erlenmeyer flask. The flask was then placed
into an anaerobic chamber and H2A was added to the supernatant to reduce Fe3+ ions. After
stirring for 15 min, the pH of the supernatant was adjusted to 9.5 by adding 5% NaOH drop-
wise. When the supernatant became turbid, the flask was heated at 80 oC for 2 h in a water
bath for completing precipitation of MPs. The obtained MPs were washed three times in
deionized water. Each wash was carried out for 3 min under 40k Hz ultrasound and the super-
natant was removed by centrifuging at 5500 rpm for 5 min after washing. The prepared MPs
were vacuum-dried at 40 oC overnight before storing at room temperature.
The effect of H2A on the adsorption capacity of the synthesized MPs to MB was investigated
by changing the ratio of H2A to Fe3+ ions (Fe3+ ion in iron mud, the same in the following)
from 0.01, 0.05, 0.1, 0.15 to 0.2, and the obtained particles were denoted as MPs-1, MPs-2,
MPs-3, MPs-4 and MPs-5 respectively. MPs-3 was selected for the following adsorption exper-
iments because of its high adsorption capacity. To reduce production cost, nitric acid was
replaced by acid wastewater as the dissolving reagent in MP synthesis, and thus synthesized
MPs were named as MPs-3w.
MB adsorption
Sorption kinetics studies. The kinetics studies were conducted by mixing 0.015 g of MPs
with 20 mL of 60 mg/L MB in a series of nine groups of 50 mL Erlenmeyer flasks. The flasks
were sealed with parafilm and shaken for 2h at 150 rpm at 25 oC in a shaking incubator
(HZQ-X300, Yiheng, Shanghai, China). During adsorption, one group of the flasks was taken
out from the incubator at a given interval, and MB residue in the supernatant was determined
by using a UV-vis spectrophotometer (Purkinje General, China) at 655 nm [19] in the reading
range of 0.01 to 0.14, which measured MB concentrations between 0.1 mg/L and 0.8 mg/L.
The adsorption capacity of MPs to MB (qe, mg/g) was calculated using the following equation:
qe ¼ðC0 � CeÞ � V
mð1Þ
Herein, C0 and Ce were the initial and equilibrium MB concentrations (mg/L); V was the
volume (L) of the MB solution and m was the mass of MPs (g) used in MB adsorption.
Sorption isotherm models analysis. The sorption isotherm studies were conducted
according to the method described by Ramasamy et al. [19]. The initial MB concentrations
were 10, 30, 60, 100, 150, 200 and 300 mg/L, respectively, and the equilibrium time was 2h. All
data was the average of triplicate experiments.
Magnetic adsorbent for MB removal
PLOS ONE | https://doi.org/10.1371/journal.pone.0191229 February 2, 2018 3 / 22
Regeneration studies. MPs-3 had the highest adsorption capacity among the synthesized
MPs and was used for regeneration experiments. After equilibrium adsorption of MB with ini-
tial concentration of 60 mg/L, the MB-adsorbed MPs-3 was collected with a magnet and then
resuspended in 20 mL of deionized water with pH from 1 to 11 to select the best pH for regen-
eration, followed by shaking at 150 rpm in a shaking incubator (HZQ-300, Yiheng, Shanghai,
China) for 24 hours until the MB concentration stabilized according to Yan et al. [20]. The
final MB concentrations in solution were measured based on Ramasamy et al. [19]. The
desorption efficiency (Rd) was calculated using Eq (2).
Rd ¼Cd � Vd
qe �m� 100% ð2Þ
Where Cd was the final MB concentration after desorption (mg/L); Vd was the volume of
aqueous solution in the desorption (L); m was the mass of MPs-3(g) used in MB adsorption.
After desorption, MPs-3 was magnetically isolated from the solution and washed several
times with deionized water until pH = 7, followed by suspending in 60 mg/L of MB for the sec-
ond round of adsorption. The adsorption-desorption cycles were carried out five times, and
the re-adsorption efficiency (Ra) was calculated with the following equation.
Ra ¼Ca � Va
qe �m� 100% ð3Þ
Where Ca was the equilibrium concentration of MB in solution (mg/L); Va was the volume
of aqueous solution (L).
The column study. Column experiment was conducted in a plexiglass column with the
inner diameter of 22 mm and the height of 110 mm. The concentration of MB solutions was
100 mg/L. Temperature and the initial pH were 25 oC and 7.2, separately. The flow rate was
controlled at 2 mL/min with a peristaltic pump (HL-1D, Huxi, Shanghai, China). At a given
interval, the effluent was sampled for MB determination.
The pilot study. The pilot experiment was performed by using 2L of synthesized wastewa-
ter containing 100 mg/L MB with MPs-3 at concentrations of 0.75, 1.5, 2.5, 5, 7.5 and 10 g/L,
respectively, in 5L buckets, on which a shafted propeller (OS20, Dalong, Beijing, China) was
mounted and agitated at 300 rpm. After 2 hour, MPs-3 was separated from the supernatant
with a magnet and the supernatant was analyzed for MB residue.
Characterization of MPs
The saturation magnetization (Ms) of MPs and iron mud was determined by a magnetometer
(Quantum Design, USA) with a SQUID-VSM system. The XRD patterns were conducted for
phase identification using a diffractometer (RAPID-S, Rigaku, Japan) with Cu Kα radiation.
The crystallization degree of MPs was analyzed by using Materials Studio software (V 6.0,
Accelrys, USA) based on intensity and width of the standard peak of crystalline Fe3O4 phase
compared to the background peaks. The average crystallite size of MPs was calculated with the
Debye–Scherrer equation:
D ¼0:94� l
B� cosyð4Þ
Where D was the average crystallite size of MPs (nm), λ was the wavelength of the X-ray
source (nm), B was the full width at half maximum (FWHM) of an individual peak (rad), and
θ was the diffraction angle (o).
Compositions of MPs were determined by X-ray fluorescence (ARLADVANT XP+,
Thermo, USA). The chemical state information on the particle surface was determined with an
Magnetic adsorbent for MB removal
PLOS ONE | https://doi.org/10.1371/journal.pone.0191229 February 2, 2018 4 / 22

X-ray photoelectron spectrometer (ADES-400, VG, U.K.) using non-monochromated Mg KαX-ray source. Particle morphologies were observed through a field emission scanning electron
microscope (FE-SEM, FEI Co., USA) using a working voltage of 200 kV. The Brunauer-
Emmett-Teller (BET) surface area of MPs was determined through nitrogen adsorption-
desorption measurements (TriStar 3000, Micromeritics, USA). The Fourier transform infrared
spectra were determined by a spectrometer (Nicolet 6700, Thermo, USA) using KBr wafer in
the wavenumber range of 4000 cm-1 to 400−1. The zeta potential of MPs was measured by zeta
potential analyzer (mastersizer 3000E, Malvern UK). Before analysis, 0.1 g MPs was suspended
in 50 mL of KCl solution with concentration of 0.01 mol/L. pH of the suspension was adjusted
from 1.4 to 10.7 by adding 1 M HCl or 1 M NaOH solutions, and agitated for 24 h. Then 1 mL
sample was taken out for zeta potential analysis.
Results and discussion
Iron mud and MP composition
As demonstrated in Fig 1, the major elements of iron mud waste were Ca (2.4%), Al (6.2%), Fe
(16.6%) and Si (19.8%) but Fe was dominant in the synthesized MPs (Fig 1). When iron mud
was treated with nitric acid/acid wastewater, Fe and some metals leached out from mud into the
liquid fraction, leaving some other elements mostly in the solid fraction, such as Mg, K, Ca, Al
and Si. After separation from the solid fraction, Si was totally removed from, while Fe in the liq-
uid fraction was re-precipitated to Fe3O4 under alkaline conditions and its content gradually
increased when more H2A was added from MPs-1 to MPs-5 (Fig 1), indicating the crystalliza-
tion of Fe3O4 increased with more available Fe2+. However, Na+ decreased from MPs-1 to MPs-
5 because sizes of MPs increased with the increased crystallization, which led to the smaller
Fig 1. Major elements in iron mud and MPs. MPs 1–5 were synthesized by changing the molar ratio of ascorbic acid
to Fe3+ from 0.01 to 0.05, 0.1, 0.15 and 0.2, respectively. MPs-3w was prepared at the molar ratio of 0.1 with acid
wastewater digestion.
https://doi.org/10.1371/journal.pone.0191229.g001
Magnetic adsorbent for MB removal
PLOS ONE | https://doi.org/10.1371/journal.pone.0191229 February 2, 2018 5 / 22
surface area to support the functional groups (which will be discussed in the following sections).
In the coprecipitation process, Na+ served as a ligand and was adsorbed onto the MP’s surface.
The poorly crystalline iron oxide had a larger surface area, which support more functional
groups for Na+ adsorption [21]. Large quantity of Ca was present in the acid wastewater (S1
Table), which increased Ca content in MPs-3w and negatively affected the adsorption.
Mechanism of Fe3O4 synthesis
After H2A was added in the liquid fraction, Fenton reaction occurred in the presence of dis-
solved oxygen and Fe3+. Basically, H2A was firstly converted to ascorbate (HA-) after losing
protons at its 2- or 3- positions, which were then replaced by Fe3+ ions [22, 23]. The attached
Fe3+ ions were rapidly reduced to Fe2+, while HA- was oxidized to HA� [24]. Finally, the
formed HA� was captured by dissolved oxygen and quickly oxidized to dehydroascorbic acid
(DHA) [23, 25] with formation of H2O2. The reactions were enhanced when the solution was
exposed to the atmosphere. Other metal ions, such as Mn2+, Cu2+ and Zn2+, worked in a simi-
lar way in catalytic oxidation of H2A [26]. The resulting Fe2+ and other reduced ions, were re-
oxidized by hydrogen peroxide to complete the cycle to form Fe3+ and other oxidized ions.
Equations of the reactions were described as follow:
H2A$ HA þHþ ð5Þ
HA� þ Fe3þ ! ½HAFe�2þ ð6Þ
½HAFe�2þ ! ½FeHA��2þ ! HA � þFe2þ ð7Þ
HA � þO2 ! HAO2 � ð8Þ
HAO2 � þHþ ! DHA þ H2O2 ð9Þ
H2O2 þ Fe2þ ! Fe3þ þ OH þ �OH ð10Þ
Fe2þ þ �OH ! Fe3þ þ OH � ð11Þ
DHA was unstable and easily hydrolyzed to L-diketogulonate (2,3-DKG) at pH 7 [24, 27].
In the presence of high concentration of H2O2, both DHA and 2,3-DKG was oxidized and bro-
ken down rapidly to L-threonate and oxalate [28].
DHA þH2O! 2; 3 � DKG ð12Þ
DHA þ H2O2 ! L � threonateþ oxalate ð13Þ
2; 3 � DKGþH2O2 ! L � threonateþ oxalate ð14Þ
After the dissolved oxygen in the liquid fraction exhausted, H2O2 was not produced. There-
fore, stable Fe2+ was formed by continuous reduction of Fe3+ with H2A. Fe2+ tended to copre-
cipitate with Fe3+ when the two types of ions were present under high pH (Eq 15), which
resulted in formation of Fe3O4 particles.
Fe2þ þ 2Fe3þ þ 8OH � ! FeðOHÞ8! Fe3O4 þ 4H2O ð15Þ
Magnetic adsorbent for MB removal
PLOS ONE | https://doi.org/10.1371/journal.pone.0191229 February 2, 2018 6 / 22

Magnetization measurement
As shown in Fig 2, MPs-3, MPs-4, MPs-5M and MPs-3w demonstrated strong magnetism
with low remanence and coercivity, indicating these MPs had soft magnetism and easily
removed from the treated water by simply placing a magnetic field after MB adsorption (see
graph abstract). By increasing the H2A/Fe3+ ratio, the saturation magnetization (Ms) increased
from 3.7, 4.6, 5.9 to 7.1 emu/g for MPs-3w, MPs-3, MPs-4 and MPs-5, respectively, which indi-
cated magnetic response became stronger with increasing Fe2+/Fe3+ ratio. Similar to iron
mud, MPs-1 and MPs-2 were synthesized with lower H2A/Fe3+ ratios, demonstrated weak
magnetic response, and would not be considered in the following studies.
In precipitation of Fe3O4, it nucleated when Fe2+ concentration reached the critical super-
saturation level, and the nuclei grew by diffusing Fe2+ to the surface of Fe3O4 [29]. When the
H2A/Fe3+ ratio was smaller than 0.05, the limited H2A- was completely exhausted by dissolved
oxygen and other cations, such as Mn4+ [15, 30], resulting in inadequate Fe2+ accumulation
for nucleation of ferrihydrite (Fig 3A). The strongest Ms was generated when the Fe2+/Fe3+
ratio was between 0.67 and 1 in MPs coprecipitation and the small Fe2+/Fe3+ ratio led to a
weak magnetic response [31]. The magnetic response of Fe3O4 was size-dependent. When the
Fe2+/Fe3+ ratio increased, the size of Fe3O4 particles increased [32] and the magnetic response
increased correspondingly (Fig 2). The large size of Fe3O4 particles reduced the surface to vol-
ume ratio, which may decrease the thermal fluctuation and magnetic disorder of Fe3O4 mole-
cules, leading to strong magnetic response [33].
A acid wastewater with a pH of 0.61 from a propylene plant, which mainly contained acid
species of Cl- (3992.5mg/L), NO3- (444.4mg/L) and SO4
2- (22492.2mg/L) (S1 Table), was tested
Fig 2. Magnetic hysteresis loops of iron mud and MPs. MPs 1–5 were synthesized by changing the molar ratio of
ascorbic acid to Fe3+ from 0.01 to 0.05, 0.1, 0.15 and 0.2, respectively. MPs-3w was prepared at the molar ratio of 0.1
with acid wastewater digestion.
https://doi.org/10.1371/journal.pone.0191229.g002
Magnetic adsorbent for MB removal
PLOS ONE | https://doi.org/10.1371/journal.pone.0191229 February 2, 2018 7 / 22
to replace the commercial nitric acid in dissolving iron mud for Fe3O4 production. The waste-
water also contained 185.9 mg/L of Fe3+, which could contribute to iron species in MP synthe-
sis. However, significant amount of Ca2+ (3736.1 mg/L) and other impurities of ion species
may interrupt the reactions (S1 Table). The synthesized MPs using acid wastewater as a dis-
solving reagent (MPs-3w) demonstrated an Ms of 3.7 emu/g, slightly lower than 4.6 emu/g of
MPs-3 (Fig 2), probably because the generated gypsum by Ca2+ and SO42- precipitation nega-
tively affected the unit magnetite of Fe3O4. It was reported that Ms was greatly reduced to half
from 57.8 emu/g to 25 emu/g when Fe3O4 particles were coated by Zr(SO4)2 [34]. However, it
was significant that the commercial nitric acid could be replaced by the negatively valued
wastewater to reduce the cost of Fe3O4 production. Currently, studies are being carried out to
synthesize Fe3O4 with the reduced gypsum in acid wastewater.
XRD analysis
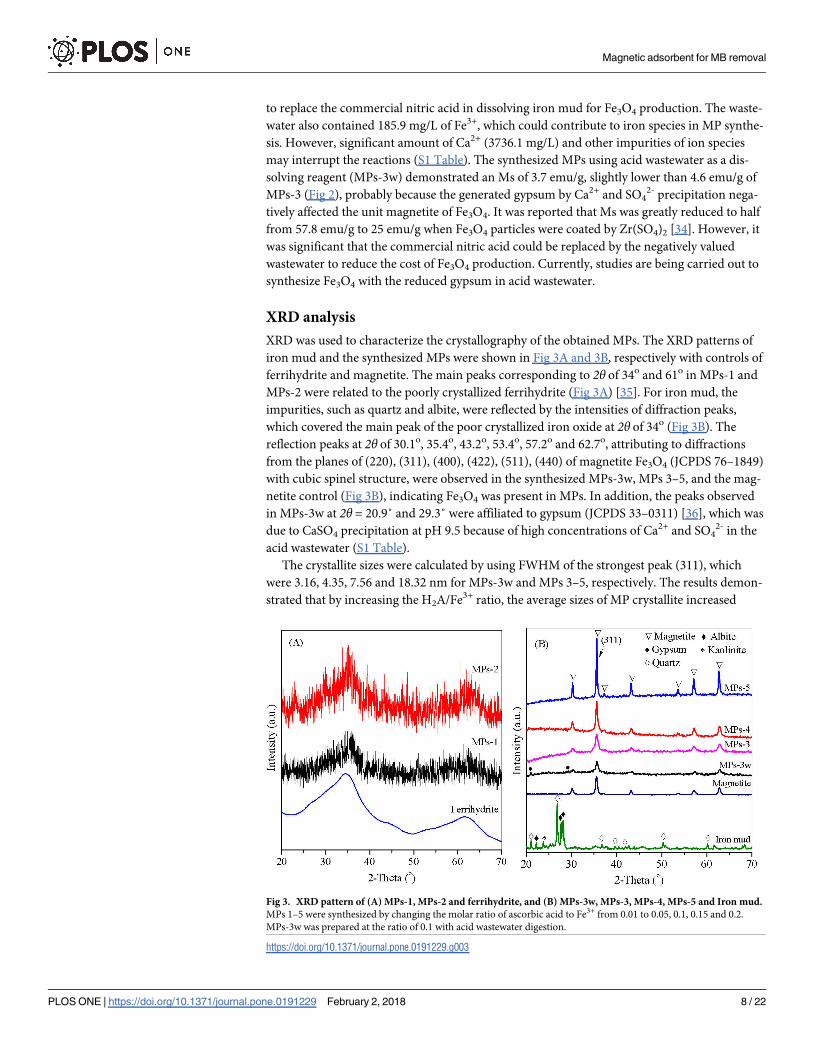
XRD was used to characterize the crystallography of the obtained MPs. The XRD patterns of
iron mud and the synthesized MPs were shown in Fig 3A and 3B, respectively with controls of
ferrihydrite and magnetite. The main peaks corresponding to 2θ of 34o and 61o in MPs-1 and
MPs-2 were related to the poorly crystallized ferrihydrite (Fig 3A) [35]. For iron mud, the
impurities, such as quartz and albite, were reflected by the intensities of diffraction peaks,
which covered the main peak of the poor crystallized iron oxide at 2θ of 34o (Fig 3B). The
reflection peaks at 2θ of 30.1o, 35.4o, 43.2o, 53.4o, 57.2o and 62.7o, attributing to diffractions
from the planes of (220), (311), (400), (422), (511), (440) of magnetite Fe3O4 (JCPDS 76–1849)
with cubic spinel structure, were observed in the synthesized MPs-3w, MPs 3–5, and the mag-
netite control (Fig 3B), indicating Fe3O4 was present in MPs. In addition, the peaks observed
in MPs-3w at 2θ = 20.9˚ and 29.3˚ were affiliated to gypsum (JCPDS 33–0311) [36], which was
due to CaSO4 precipitation at pH 9.5 because of high concentrations of Ca2+ and SO42- in the
acid wastewater (S1 Table).
The crystallite sizes were calculated by using FWHM of the strongest peak (311), which
were 3.16, 4.35, 7.56 and 18.32 nm for MPs-3w and MPs 3–5, respectively. The results demon-
strated that by increasing the H2A/Fe3+ ratio, the average sizes of MP crystallite increased
Fig 3. XRD pattern of (A) MPs-1, MPs-2 and ferrihydrite, and (B) MPs-3w, MPs-3, MPs-4, MPs-5 and Iron mud.
MPs 1–5 were synthesized by changing the molar ratio of ascorbic acid to Fe3+ from 0.01 to 0.05, 0.1, 0.15 and 0.2.
MPs-3w was prepared at the ratio of 0.1 with acid wastewater digestion.
https://doi.org/10.1371/journal.pone.0191229.g003
Magnetic adsorbent for MB removal
PLOS ONE | https://doi.org/10.1371/journal.pone.0191229 February 2, 2018 8 / 22
accordingly. The result was consistent with the studies of Samaneh et al., in which the average
crystallite size of magnetite increased almost double from 9.07 to 18.97 nm when the Fe2+/Fe3+
ratio was increased from 0.5 to 2 [32]. In preparing MPs-3w, acid wastewater containing Fe3+
replaced nitric acid and contributed iron species in Fe3O4 synthesis. The combined Fe3+ for
MPs-3w led to a lower Fe2+/Fe3+ ratio and therefore a smaller particle size of 3.16 nm.
It was demonstrated that amorphous iron oxide had higher surface area than the crystal-
lized one (Fig 3), which exposed more ion-exchange functional groups on the surface [37, 38].
Among the selected MPs in MB adsorption, MPs-3 was least crystallized and had the largest
surface area as demonstrated by the BET analysis in the following N2 adsorption isotherms,
which contained the most functional groups and the highest adsorption capacity. When the
H2A/Fe3+ ratio increased steadily from MPs-3 to MPs-5, the synthesized MPs became more
crystallized, reducing the surface area and functional groups on it, which was consistent with
the reduced MB adsorption capacity shown in the following isothermal equilibrium. This
result was consistent with the observation of Zhang et al. that amorphous Fe3O4 showed better
adsorption capacity to Pb(II) and Cd(II) than the well crystallized α- and γ- Fe2O3 [37]. It was
reported that after ferrihydrite was converted to more crystallized goethite, its adsorption
capacity to radium decreased from nearly 100% to 20% [39].
XPS analysis
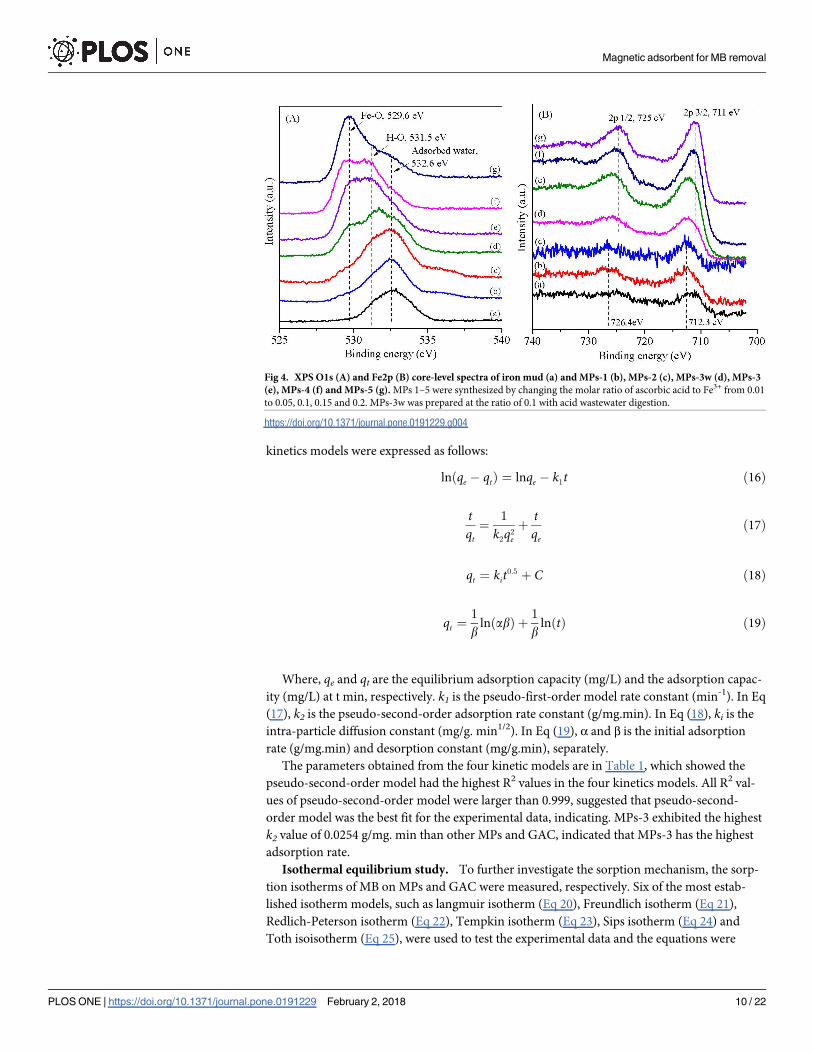
To further investigate the valence states of Fe and O in iron mud and MPs, O1s and Fe2p spec-
tra of XPS were analyzed and the two spectra demonstrated consistent results. In O1s spec-
trum, the Fe-O peak at 529.6 eV was observed in MPs-3w and MPs-3 to 5, indicating the
formation of Fe3O4 [40]. The peak at 712.3 eV and 726.4 eV was shown in Fe2p spectrum of
MPs 1–2, representing Fe 2p3/2 and Fe 2p1/2 of ferric species in ferrihydrite (Fig 4B) [41]. By
increasing the HA/Fe3+ ratios, Fe 2p3/2 and Fe 2p1/2 shifted to 711 eV and 725 eV, respectively
for MPs 3–5, corresponding the increased Fe2+/Fe3+ ratios in MPs. The results indicated that
Fe3O4 content increased by increasing HA/Fe3+ ratios, which corresponded to the increased
magnetic response from MPs-1 to MPs-5 demonstrated in Fig 2A.
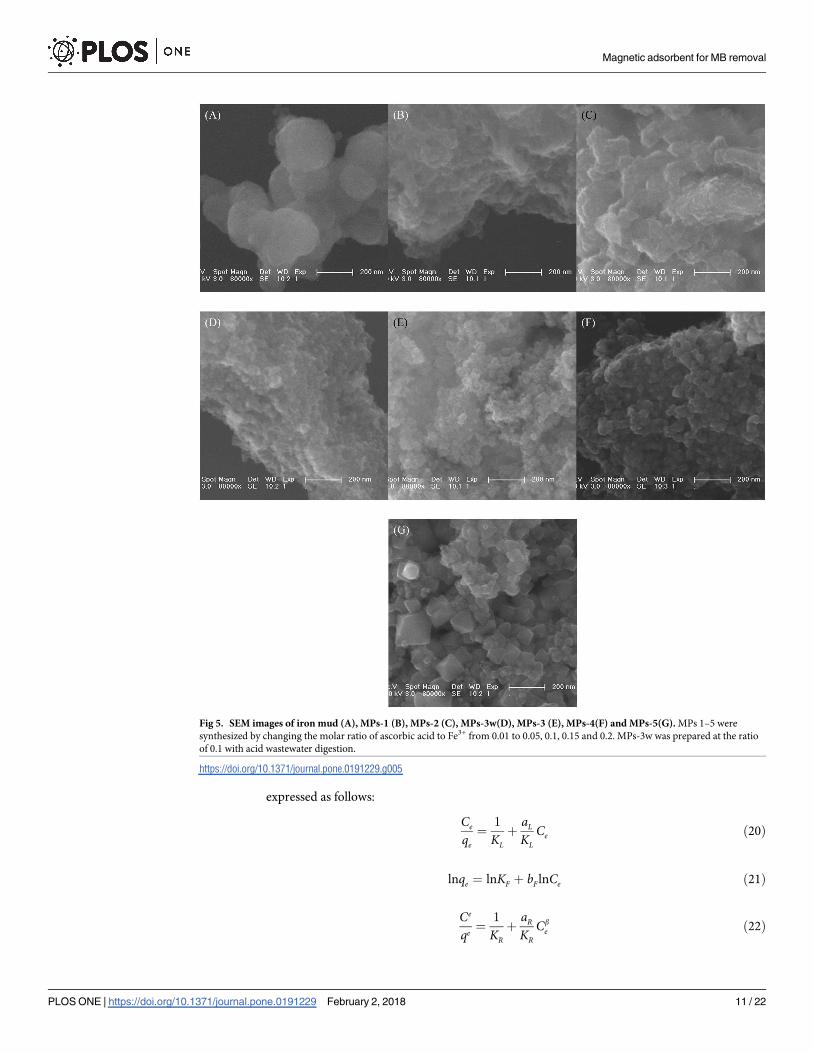
SEM analysis
The morphology of iron mud and MPs was characterized by SEM. As shown in Fig 5A, iron
mud was about 200 nm particles with smooth surface. The morphologies of MPs-1 and MPs-2
were irregular because of the formation of amorphous ferrihydrite (Fig 5B and 5C). When
more H2A was added, more Fe2+ was generated, which was favorable to the nuclei growth of
Fe3O4 and led to bigger size of MPs (Fig 5D–5G). The result was consistent with the XRD spec-
trum and magnetic response.
Sorption of MB
Sorption kinetics. MPs-3w and MPs 3–5 had good magnetic response, and were further
studied for MB adsorption, in which the widely used MB adsorbent of GAC was a reference.
Time-course of MB adsorption on MPs and GAC were investigated as shown in Fig 6. MPs
and GAC showed similar adsorption trend. The adsorption capacity increased rapidly at the
initial 30 min, and slowly in the following 90 min, and kept constant within the subsequent
120 min, indicating the adsorption was equilibrated in 120 min. The kinetics of adsorption of
MB on MPs-3w, MPs 3–5 and GAC were studied as a function of adsorption time at 25 oC. As
shown in Fig 6, four typical kinetic models, such as Lagergren’s pseudo-first order (Eq 16),
pseudo-second order kinetics model (Eq 17), inter-particle diffusion model (Eq 18) and kinetic
model (Eq 19) proposed by Elovich et al. [42], were tested for the experimental data. The four
Magnetic adsorbent for MB removal
PLOS ONE | https://doi.org/10.1371/journal.pone.0191229 February 2, 2018 9 / 22
kinetics models were expressed as follows:
lnðqe � qtÞ ¼ lnqe � k1t ð16Þ
tqt¼
1
k2q2e
þtqe
ð17Þ
qt ¼ kit0:5 þ C ð18Þ
qt ¼1
blnðabÞ þ
1
blnðtÞ ð19Þ
Where, qe and qt are the equilibrium adsorption capacity (mg/L) and the adsorption capac-
ity (mg/L) at t min, respectively. k1 is the pseudo-first-order model rate constant (min-1). In Eq
(17), k2 is the pseudo-second-order adsorption rate constant (g/mg.min). In Eq (18), ki is the
intra-particle diffusion constant (mg/g. min1/2). In Eq (19), α and β is the initial adsorption
rate (g/mg.min) and desorption constant (mg/g.min), separately.
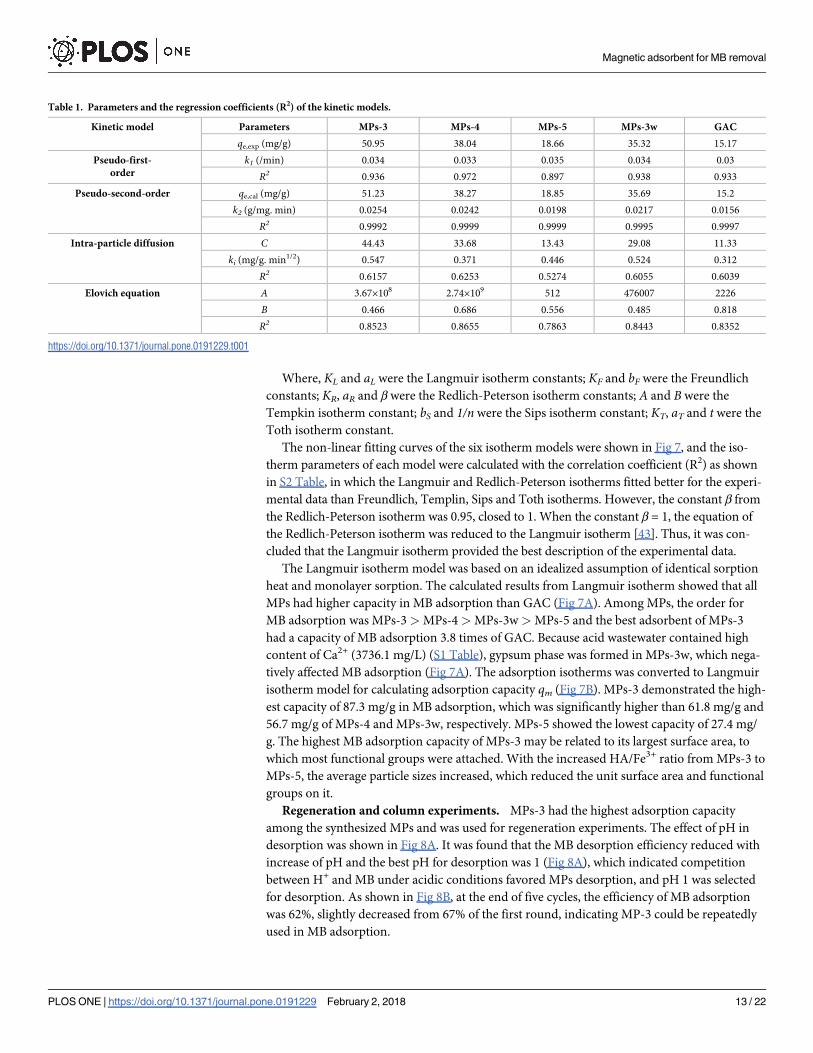
The parameters obtained from the four kinetic models are in Table 1, which showed the
pseudo-second-order model had the highest R2 values in the four kinetics models. All R2 val-
ues of pseudo-second-order model were larger than 0.999, suggested that pseudo-second-
order model was the best fit for the experimental data, indicating. MPs-3 exhibited the highest
k2 value of 0.0254 g/mg. min than other MPs and GAC, indicated that MPs-3 has the highest
adsorption rate.
Isothermal equilibrium study. To further investigate the sorption mechanism, the sorp-
tion isotherms of MB on MPs and GAC were measured, respectively. Six of the most estab-
lished isotherm models, such as langmuir isotherm (Eq 20), Freundlich isotherm (Eq 21),
Redlich-Peterson isotherm (Eq 22), Tempkin isotherm (Eq 23), Sips isotherm (Eq 24) and
Toth isoisotherm (Eq 25), were used to test the experimental data and the equations were
Fig 4. XPS O1s (A) and Fe2p (B) core-level spectra of iron mud (a) and MPs-1 (b), MPs-2 (c), MPs-3w (d), MPs-3
(e), MPs-4 (f) and MPs-5 (g). MPs 1–5 were synthesized by changing the molar ratio of ascorbic acid to Fe3+ from 0.01
to 0.05, 0.1, 0.15 and 0.2. MPs-3w was prepared at the ratio of 0.1 with acid wastewater digestion.
https://doi.org/10.1371/journal.pone.0191229.g004
Magnetic adsorbent for MB removal
PLOS ONE | https://doi.org/10.1371/journal.pone.0191229 February 2, 2018 10 / 22
expressed as follows:
Ce
qe¼
1
KLþ
aL
KLCe ð20Þ
lnqe ¼ lnKF þ bFlnCe ð21Þ
Ce
qe¼
1
KRþ
aR
KRCb
e ð22Þ
Fig 5. SEM images of iron mud (A), MPs-1 (B), MPs-2 (C), MPs-3w(D), MPs-3 (E), MPs-4(F) and MPs-5(G). MPs 1–5 were
synthesized by changing the molar ratio of ascorbic acid to Fe3+ from 0.01 to 0.05, 0.1, 0.15 and 0.2. MPs-3w was prepared at the ratio
of 0.1 with acid wastewater digestion.
https://doi.org/10.1371/journal.pone.0191229.g005
Magnetic adsorbent for MB removal
PLOS ONE | https://doi.org/10.1371/journal.pone.0191229 February 2, 2018 11 / 22

qe ¼ BlnAþ BlnCe ð23Þ
qe ¼qmðbSCeÞ
1n
1þ ðbSCeÞ1n
ð24Þ
qe ¼KTCe
ðaT þ CteÞ
1t
ð25Þ
Fig 6. Nonlinear Fitting curve of pseudo-first-order kinetic (A), pseudo-second-order kinetic (B), inter-particle diffusion (C) and
Elovich kinetic (D) for MB adsorption on MPs and GAC. Herein, MPs 3–5 were synthesized by changing the molar ratio of ascorbic
acid to Fe3+ from 0.1 to 0.15 and 0.2, respectively. MPs-3w was prepared at the molar ratio of 0.1 with acid wastewater digestion.
https://doi.org/10.1371/journal.pone.0191229.g006
Magnetic adsorbent for MB removal
PLOS ONE | https://doi.org/10.1371/journal.pone.0191229 February 2, 2018 12 / 22
Where, KL and aL were the Langmuir isotherm constants; KF and bF were the Freundlich
constants; KR, aR and β were the Redlich-Peterson isotherm constants; A and B were the
Tempkin isotherm constant; bS and 1/n were the Sips isotherm constant; KT, aT and t were the
Toth isotherm constant.
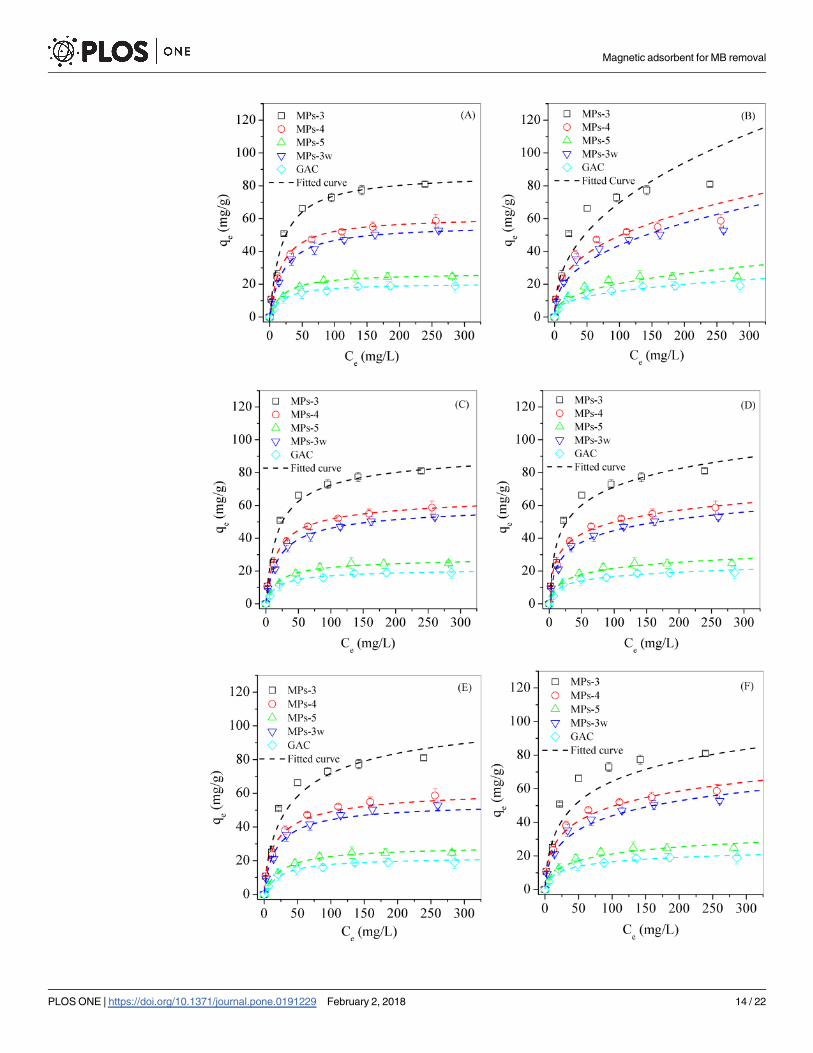
The non-linear fitting curves of the six isotherm models were shown in Fig 7, and the iso-
therm parameters of each model were calculated with the correlation coefficient (R2) as shown
in S2 Table, in which the Langmuir and Redlich-Peterson isotherms fitted better for the experi-
mental data than Freundlich, Templin, Sips and Toth isotherms. However, the constant β from
the Redlich-Peterson isotherm was 0.95, closed to 1. When the constant β = 1, the equation of
the Redlich-Peterson isotherm was reduced to the Langmuir isotherm [43]. Thus, it was con-
cluded that the Langmuir isotherm provided the best description of the experimental data.
The Langmuir isotherm model was based on an idealized assumption of identical sorption
heat and monolayer sorption. The calculated results from Langmuir isotherm showed that all
MPs had higher capacity in MB adsorption than GAC (Fig 7A). Among MPs, the order for
MB adsorption was MPs-3 > MPs-4 > MPs-3w> MPs-5 and the best adsorbent of MPs-3
had a capacity of MB adsorption 3.8 times of GAC. Because acid wastewater contained high
content of Ca2+ (3736.1 mg/L) (S1 Table), gypsum phase was formed in MPs-3w, which nega-
tively affected MB adsorption (Fig 7A). The adsorption isotherms was converted to Langmuir
isotherm model for calculating adsorption capacity qm (Fig 7B). MPs-3 demonstrated the high-
est capacity of 87.3 mg/g in MB adsorption, which was significantly higher than 61.8 mg/g and
56.7 mg/g of MPs-4 and MPs-3w, respectively. MPs-5 showed the lowest capacity of 27.4 mg/
g. The highest MB adsorption capacity of MPs-3 may be related to its largest surface area, to
which most functional groups were attached. With the increased HA/Fe3+ ratio from MPs-3 to
MPs-5, the average particle sizes increased, which reduced the unit surface area and functional
groups on it.
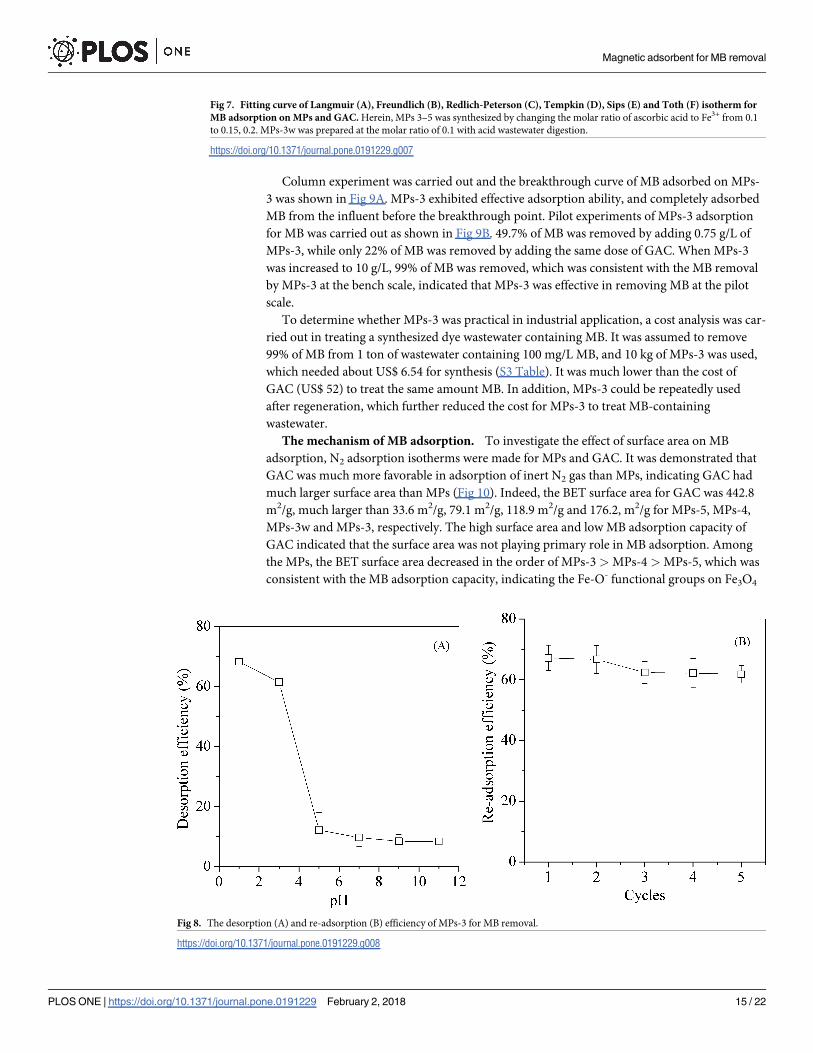
Regeneration and column experiments. MPs-3 had the highest adsorption capacity
among the synthesized MPs and was used for regeneration experiments. The effect of pH in
desorption was shown in Fig 8A. It was found that the MB desorption efficiency reduced with
increase of pH and the best pH for desorption was 1 (Fig 8A), which indicated competition
between H+ and MB under acidic conditions favored MPs desorption, and pH 1 was selected
for desorption. As shown in Fig 8B, at the end of five cycles, the efficiency of MB adsorption
was 62%, slightly decreased from 67% of the first round, indicating MP-3 could be repeatedly
used in MB adsorption.
Table 1. Parameters and the regression coefficients (R2) of the kinetic models.
Kinetic model Parameters MPs-3 MPs-4 MPs-5 MPs-3w GAC
qe,exp (mg/g) 50.95 38.04 18.66 35.32 15.17
Pseudo-first-
order
k1 (/min) 0.034 0.033 0.035 0.034 0.03
R2 0.936 0.972 0.897 0.938 0.933
Pseudo-second-order qe,cal (mg/g) 51.23 38.27 18.85 35.69 15.2
k2 (g/mg. min) 0.0254 0.0242 0.0198 0.0217 0.0156
R2 0.9992 0.9999 0.9999 0.9995 0.9997
Intra-particle diffusion C 44.43 33.68 13.43 29.08 11.33
ki (mg/g. min1/2) 0.547 0.371 0.446 0.524 0.312
R2 0.6157 0.6253 0.5274 0.6055 0.6039
Elovich equation Α 3.67×10⁸ 2.74×10⁹ 512 476007 2226
Β 0.466 0.686 0.556 0.485 0.818
R2 0.8523 0.8655 0.7863 0.8443 0.8352
https://doi.org/10.1371/journal.pone.0191229.t001
Magnetic adsorbent for MB removal
PLOS ONE | https://doi.org/10.1371/journal.pone.0191229 February 2, 2018 13 / 22
Magnetic adsorbent for MB removal
PLOS ONE | https://doi.org/10.1371/journal.pone.0191229 February 2, 2018 14 / 22
Column experiment was carried out and the breakthrough curve of MB adsorbed on MPs-
3 was shown in Fig 9A. MPs-3 exhibited effective adsorption ability, and completely adsorbed
MB from the influent before the breakthrough point. Pilot experiments of MPs-3 adsorption
for MB was carried out as shown in Fig 9B. 49.7% of MB was removed by adding 0.75 g/L of
MPs-3, while only 22% of MB was removed by adding the same dose of GAC. When MPs-3
was increased to 10 g/L, 99% of MB was removed, which was consistent with the MB removal
by MPs-3 at the bench scale, indicated that MPs-3 was effective in removing MB at the pilot
scale.
To determine whether MPs-3 was practical in industrial application, a cost analysis was car-
ried out in treating a synthesized dye wastewater containing MB. It was assumed to remove
99% of MB from 1 ton of wastewater containing 100 mg/L MB, and 10 kg of MPs-3 was used,
which needed about US$ 6.54 for synthesis (S3 Table). It was much lower than the cost of
GAC (US$ 52) to treat the same amount MB. In addition, MPs-3 could be repeatedly used
after regeneration, which further reduced the cost for MPs-3 to treat MB-containing
wastewater.
The mechanism of MB adsorption. To investigate the effect of surface area on MB
adsorption, N2 adsorption isotherms were made for MPs and GAC. It was demonstrated that
GAC was much more favorable in adsorption of inert N2 gas than MPs, indicating GAC had
much larger surface area than MPs (Fig 10). Indeed, the BET surface area for GAC was 442.8
m2/g, much larger than 33.6 m2/g, 79.1 m2/g, 118.9 m2/g and 176.2, m2/g for MPs-5, MPs-4,
MPs-3w and MPs-3, respectively. The high surface area and low MB adsorption capacity of
GAC indicated that the surface area was not playing primary role in MB adsorption. Among
the MPs, the BET surface area decreased in the order of MPs-3 > MPs-4 >MPs-5, which was
consistent with the MB adsorption capacity, indicating the Fe-O- functional groups on Fe3O4
Fig 7. Fitting curve of Langmuir (A), Freundlich (B), Redlich-Peterson (C), Tempkin (D), Sips (E) and Toth (F) isotherm for
MB adsorption on MPs and GAC. Herein, MPs 3–5 was synthesized by changing the molar ratio of ascorbic acid to Fe3+ from 0.1
to 0.15, 0.2. MPs-3w was prepared at the molar ratio of 0.1 with acid wastewater digestion.
https://doi.org/10.1371/journal.pone.0191229.g007
Fig 8. The desorption (A) and re-adsorption (B) efficiency of MPs-3 for MB removal.
https://doi.org/10.1371/journal.pone.0191229.g008
Magnetic adsorbent for MB removal
PLOS ONE | https://doi.org/10.1371/journal.pone.0191229 February 2, 2018 15 / 22

surface played a significant role in MB adsorption. The bigger the surface area, the more Fe-O-
functional groups it contained, and the better adsorption for MB. The cation exchange capac-
ity (CEC) of MPs was further tested with NH4-Na methods. As expected, MPs-3 showed the
highest CEC, followed by MPs-4 and MPs-5 (Table 2), which provided direct evidence that
cation exchange was the mechanism for MB adsorption.
The zeta potentials of MPs were shown in Fig 11 and pHzpc of MPs was calculated at the
zeta potential of 0 mV. The pHzpc for MPs-3w and MPs 3–5 was 3.15, 2.98, 2.83 and 2.69,
respectively. During the batch adsorption of MB, the pH of MB solution changed between 7.1
and 7.3, and thus all MPs have negative charges on their surfaces. The pK1 of MB was 4.5 [44],
At pH> pK1, the = N–in MB molecules was protonated and the cationic MB was formed.
Therefore, the cationic MB was adsorbed onto the negative charged surface of MPs by electro-
static attraction.
To determine the interaction of MB with MPs during adsorption, the infrared spectra of
MB adsorbed onto MPs-3 and MPs-3w was analyzed as shown in Fig 12A. It was demonstrated
in the MPs-3 and MPs-3w spectrum that the peaks at 590 cm-1 corresponded to the stretching
mode of Fe-O in Fe3O4, and peaks at 1624 cm-1 were related to the O-H functional groups
[45]. After MB was adsorbed, the peaks of O-H groups shifted from 1624 cm-1 to 1646 cm-1,
which indicated the O-H group participated in MB adsorption. The peaks appeared at 836,
874 and 1383 cm-1 were ascribed to wagging vibration of C-H in the alkyl group and aromatic
ring of MB, respectively [46]. Other peaks appeared at 1159 cm-1 and 1118 cm-1 after adsorp-
tion were attributed to the asymmetric vibration of C = S and stretching vibrations of C-S-C,
respectively [46]. This indicated that MB was adsorbed onto MPs. The infrared spectra of MB
adsorbed onto MPs-4 and MPs-5 in Fig 12B showed similar peaks with MPs-3.
Three typical functional groups of�FeOH2+,�FeOH and�FeO- were generated and pres-
ent on the surface of MPs [47]. These functional groups were mostly ionized to the negatively
charged�Fe-O- at alkaline condition and showed weakly acidic ion exchange property. Under
alkaline conditions, it was attached by Na+ to form�FeO-Na+ through electrostatic forces [38,
48]. Na+ had relative lower affinity to the�Fe-O- functional group and the attached Na+ could
be favorably replaced by MB [37, 47]. The possible reactions related to the MB adsorption are
Fig 9. Breakthrough curve (A) and Removal rate (B) of MB adsorption by MPs-3.
https://doi.org/10.1371/journal.pone.0191229.g009
Magnetic adsorbent for MB removal
PLOS ONE | https://doi.org/10.1371/journal.pone.0191229 February 2, 2018 16 / 22

Fig 10. N2 adsorption isotherms of MPs and GAC. Herein, MPs 3–5 were synthesized by changing the molar ratio of ascorbic acid to Fe3+ from 0.1 to 0.15, 0.2,
separately. MPs-3w was prepared at the molar ratio of 0.1 by acid wastewater digestion.
https://doi.org/10.1371/journal.pone.0191229.g010
Table 2. Cation exchange capacity of MPs by NH4-Na test. (Unit: Mmol/kg).
cation MPs-3w MPs-3 MPs-4 MPs-5
Na+ 840.12 1378.76 1085.13 271.4
https://doi.org/10.1371/journal.pone.0191229.t002
Magnetic adsorbent for MB removal
PLOS ONE | https://doi.org/10.1371/journal.pone.0191229 February 2, 2018 17 / 22

Fig 11. zeta potential variation of MPs. Herein, MPs 3–5 were synthesized by changing the molar ratio of ascorbic
acid to Fe3+ from 0.1 to 0.15, 0.2, separately. MPs-3w was prepared at the molar ratio of 0.1 by acid wastewater
digestion.
https://doi.org/10.1371/journal.pone.0191229.g011
Fig 12. Infrared spectra of MPs-3w and MPs-3w (A), and MPs-4 and MPs-5 (B) before and after MB adsorption. Herein, MPs 3–5
was synthesized by changing the molar ratio of ascorbic acid to Fe3+ from 0.1 to 0.15, 0.2, respectively. MPs-3w was prepared at the molar
ratio of 0.1 by acid wastewater digestion.
https://doi.org/10.1371/journal.pone.0191229.g012
Magnetic adsorbent for MB removal
PLOS ONE | https://doi.org/10.1371/journal.pone.0191229 February 2, 2018 18 / 22
described below:
� FeOH þ NaOH !� FeONaþH2O ð26Þ
� FeONa þMBþ !� FeOMBþ Naþ ð27Þ
Conclusion
Iron mud, a negatively valued waste from groundwater treatment plant, was successfully con-
verted to a magnetic cation exchanger for MB adsorption by simple Fe3+/Fe2+ coprecipitation
with H2A as reduction reagent. The synthesized MPs-3 with the H2A/Fe3+ ratio of 0.1 had an
Ms of 4.6 emu/g and highest MB adsorption capacity of 87.3 mg/g. The adsorption of MB onto
MPs was in agreement with the Langmuir isotherm model and the adsorption kinetics fitted
well with the pseudo-second-order model. When the dissolving reagent of nitric acid was
replaced by acid wastewater, the generated MPs-3w also showed significant magnetic response
and MB adsorption capacity of 56.7 mg/g. Our study demonstrated that cation exchange and
electrostatic attraction, not surface area, were the major mechanism for MB adsorption. The
magnetic adsorbent synthesized from negatively-valued iron mud waste using an environ-
ment-friendly method had a good potential for effective treatment of dye wastewater.
Supporting information
S1 Table. Characteristics of the acid wastewater and the supernatant. (Unit: Mg/L).
(DOC)
S2 Table. Parameters and the regression coefficients (R2) of the isotherm models.
(DOC)
S3 Table. The cost for MPs-3 synthesis.
(DOC)
Author Contributions
Data curation: Jiancong Liu, Suiyi Zhu, Dejun Bian.
Formal analysis: Jiancong Liu, Suiyi Zhu, Dejun Bian.
Funding acquisition: Mingxin Huo.
Investigation: Jiancong Liu, Suiyi Zhu.
Methodology: Suiyi Zhu, Wei Fan.
Project administration: Jian Song, Mingxin Huo.
Resources: Jiakuan Yang.
Software: Yang Yu, Jian Song, Wei Fan, Hongbin Yu.
Supervision: Mingxin Huo.
Validation: Hongbin Yu.
Writing – original draft: Yang Yu, Suiyi Zhu.
Writing – review & editing: Jiakuan Yang, Mingxin Huo.
Magnetic adsorbent for MB removal
PLOS ONE | https://doi.org/10.1371/journal.pone.0191229 February 2, 2018 19 / 22
References1. Ngatenah SNI, Kutty SRM, Isa MH, editors. Optimization of heavy metal removal from aqueous solution
using groundwater treatment plant sludge (GWTPS). International Conference on Environment
(ICENV); 2010; Penang, Malaysia.
2. Zhu S, Fang S, Huo M, Yu Y, Chen Y, Yang X, et al. A novel conversion of the groundwater treatment
sludge to magnetic particles for the adsorption of methylene blue. Journal of Hazardous Materials.
2015; 292:173–9. https://doi.org/10.1016/j.jhazmat.2015.03.028 PMID: 25804792
3. Mayes WM, Burke IT, Gomes HI, Anton AD, Molnar M, Feigl V, et al. Advances in understanding envi-
ronmental risks of red mud after the Ajka Spill, Hungary. Journal of Sustainable Metallurgy. 2016; 2
(4):332–43. https://doi.org/10.1007/s40831-016-0050-z
4. Akin I, Arslan G, Tor A, Ersoz M, Cengeloglu Y. Arsenic(V) removal from underground water by mag-
netic nanoparticles synthesized from waste red mud. Journal of Hazardous Materials. 2012; 235–
236:62–8. https://doi.org/10.1016/j.jhazmat.2012.06.024 PMID: 22846216
5. Hills CD, Koe L, Sollars CJ, Perry R. Early heat of hydration during the solidification of a metal plating
sludge. Cement and Concrete Research. 1992; 22(5):822–32. http://dx.doi.org/10.1016/0008-8846(92)
90106-6.
6. Blanchard JM, Murat M. Recovery of chemicals from waste iron sulfate. A laboratory test of the produc-
tion of iron chloride and/or electrolytic iron. Resources and Conservation. 1981; 6(1):21–7. http://dx.doi.
org/10.1016/0166-3097(81)90004-3.
7. Sales A, Souza FRD. Concretes and mortars recycled with water treatment sludge and construction
and demolition rubble. Construction & Building Materials. 2009; 23(6):2362–70.
8. Costa R, Moura F, Oliveira P. Controlled reduction of red mud waste to produce active systems for envi-
ronmental applications: Heterogeneous Fenton reaction and reduction of Cr(VI). Chemosphere. 2010;
78(9):1116–20. https://doi.org/10.1016/j.chemosphere.2009.12.032 PMID: 20060564
9. Li X-B, Liu N, Qi T-G, Wang Y-L, Zhou Q-S, Peng Z-H, et al. Conversion of ferric oxide to magnetite by
hydrothermal reduction in Bayer digestion process. Transactions of Nonferrous Metals Society of
China. 2015; 25(10):3467–74. http://dx.doi.org/10.1016/S1003-6326(15)63984-X.
10. Liu Y, Zhao B, Tang Y, Wan P, Chen Y, Lv Z. Recycling of iron from red mud by magnetic separation
after co-roasting with pyrite. Thermochimica Acta. 2014; 588:11–5. https://doi.org/10.1016/j.tca.2014.
04.027.
11. Sushil S, Alabdulrahman AM, Balakrishnan M, Batra VS, Blackley RA, Clapp J, et al. Carbon deposition
and phase transformations in red mud on exposure to methane. Journal of Hazardous Materials. 2010;
180(1–3):409–18. https://doi.org/10.1016/j.jhazmat.2010.04.046 PMID: 20462696
12. Man Y, Feng J. Effect of gas composition on reduction behavior in red mud and iron ore pellets. Powder
Technology. 2016; 301:674–8.
13. Laurent S, Forge D, Port M, Roch A, Robic C, Elst LV, et al. Magnetic iron oxide nanoparticles: synthe-
sis, stabilization, vectorization, physicochemical characterizations, and biological applications. Chemi-
cal Reviews. 2008; 108(6):2064–110. https://doi.org/10.1021/cr068445e PMID: 18543879
14. Wu S, Sun A, Zhai F, Wang J, Xu W, Zhang Q, et al. Fe3O4 magnetic nanoparticles synthesis from tail-
ings by ultrasonic chemical co-precipitation. Materials Letters. 2011; 65(12):1882–4.
15. Khorasani-Motlagh M, Noroozifar M, Shahroosvand H. A new reduction route for the synthesis of nano-
scale metals and metal oxides with ascorbic acid at low temperature. Journal of the Iranian Chemical
Society. 2010; 7(2):113–22.
16. Hou X, Huang X, Ai Z, Zhao J, Zhang L. Ascorbic acid/Fe@Fe2O3: A highly efficient combined Fenton
reagent to remove organic contaminants. Journal of Hazardous Materials. 2016; 310:170–8. https://doi.
org/10.1016/j.jhazmat.2016.01.020 PMID: 26921510
17. Gupta H, Paul P, Kumar N, Baxi S, Das DP. One pot synthesis of water-dispersible dehydroascorbic
acid coated Fe3O4 nanoparticles under atmospheric air: Blood cell compatibility and enhanced mag-
netic resonance imaging. Journal of Colloid & Interface Science. 2014; 430:221–8.
18. Nene A, Takahashi M, Wakita K, Umeno M. Size controlled synthesis of Fe3O4 nanoparticles by ascor-
bic acid mediated reduction of Fe(acac)3 without using capping agent. Journal of Nano Research. 2016;
40:8–19.
19. Ramasamy V, Anandalakshmi K. The determination of kaolinite clay content in limestones of western
Tamil Nadu by methylene blue adsorption using UV–vis spectroscopy. Spectrochimica Acta Part A
Molecular & Biomolecular Spectroscopy. 2008; 70(1):25–9.
20. Yan H, Zhang W, Kan X, Dong L, Jiang Z, Li H, et al. Sorption of methylene blue by carboxymethyl cellu-
lose and reuse process in a secondary sorption☆. Colloids & Surfaces A Physicochemical & Engineer-
ing Aspects. 2011; 380(1–3):143–51.
Magnetic adsorbent for MB removal
PLOS ONE | https://doi.org/10.1371/journal.pone.0191229 February 2, 2018 20 / 22

21. Fredrickson JK, Zachara JM, Kukkadapu RK, Gorby YA, Smith SC, Brown CF. Biotransformation of Ni-
substituted hydrous ferric oxide by an Fe(III)-reducing bacterium. Environmental Science & Technol-
ogy. 2001; 35(4):703–12.
22. Bai LJ, Wang JY, Cui NJ, Zhang Y. The ESR and UV-VIS Studies on the Reaction Between Ascorbic
Acid and Iron Ion. Acta biochimica et biophysica Sinica. 1997; 29(6):527–32. PMID: 12215764
23. Yang W, Wang H, Zhao X. Study on the complexation reaction of ascorbic acid with Fe (II) by thin layer
chromatography /in-situ absorption spectrometry. Chinese Journal of Analytieal Chemistry. 1996:828–
31.
24. Bode AM, Cunningham L, Rose RC. Spontaneous decay of oxidized ascorbic acid (dehydro-L-ascorbic
acid) evaluated by high-pressure liquid chromatography. Clinical Chemistry. 1990; 36(10):1807–9.
PMID: 2208658
25. Ghosh SK, Gould ES. Electron transfer. 97. The iron-catalyzed reduction of peroxide-bound chromium
(IV) with ascorbic acid. Inorganic Chemistry. 1989; 28(8):1538–42.
26. Takamura K, Ito M. Effects of metal ions and flavonoids on the oxidation of ascorbic acid. Chemical &
Pharmaceutical Bulletin. 1977; 25(12):3218–25.
27. Yu Y, Christopher LP. Detoxification of hemicellulose-rich poplar hydrolysate by polymeric resins for
improved ethanol fermentability. Fuel. 2017; 203:187–96. https://doi.org/10.1016/j.fuel.2017.04.118.
28. Simpson GL, Ortwerth BJ. The non-oxidative degradation of ascorbic acid at physiological conditions.
Biochimica Et Biophysica Acta. 2000; 1501(1):12–24. PMID: 10727845
29. Tran HL, Tran TD, Vo TV. Promising iron oxide-based magnetic nanoparticles in biomedical engineer-
ing. Archives of Pharmacal Research. 2012; 35(12):2045–61. https://doi.org/10.1007/s12272-012-
1203-7 PMID: 23263800
30. Wu S. Preparation of fine copper powder using ascorbic acid as reducing agent and its application in
MLCC. Materials Letters. 2007; 61(4–5):1125–9.
31. Chen F, Xie S, Zhang J, Liu R. Synthesis of spherical Fe3O4 magnetic nanoparticles by co-precipitation
in choline chloride/urea deep eutectic solvent. Materials Letters. 2013; 112:177–9. https://doi.org/10.
1016/j.matlet.2013.09.022.
32. Alibeigi S, Vaezi MR. Phase Transformation of Iron Oxide Nanoparticles by Varying the Molar Ratio of
Fe2+:Fe3+. Chemical Engineering & Technology. 2008; 31(11):1591–6.
33. Iida H, Takayanagi K, Nakanishi T, Osaka T. Synthesis of Fe3O4 nanoparticles with various sizes and
magnetic properties by controlled hydrolysis. Journal of Colloid and Interface Science. 2007; 314
(1):274–80. https://doi.org/10.1016/j.jcis.2007.05.047 PMID: 17568605
34. Chang Z, Li F, Duan X, Zhang ML. Preparation and Character Study of the Magnetic Nano-Size Solid
Acid Catalyst. Chinese Journal of Inorganic Chemistry. 2001; 17(3):366–72.
35. Jia Y, Xu L, Zhen F, Demopoulos GP. Observation of Surface Precipitation of Arsenate on Ferrihydrite.
Environmental Science & Technology. 2006; 40(10):3248–53.
36. Zuhaimi NAS, Indran VP, Deraman MA, Mudrikah NF, Maniam GP, Taufiq-Yap YH, et al. Reusable
gypsum based catalyst for synthesis of glycerol carbonate from glycerol and urea. Applied Catalysis A:
General. 2015; 502:312–9. http://dx.doi.org/10.1016/j.apcata.2015.06.024.
37. Zhang C, Yu Z, Zeng G, Huang B, Dong H, Huang J, et al. Phase transformation of crystalline iron
oxides and their adsorption abilities for Pb and Cd. Chemical Engineering Journal. 2016; 284:247–59.
https://doi.org/10.1016/j.cej.2015.08.096.
38. Shao Z, Chen J. Study on ion adsorption characteristics of some iron oxides. Acta Pedologica Sinica.
1984; 21(2):153–62.
39. Sajih M, Bryan ND, Livens FR, Vaughan DJ, Descostes M, Phrommavanh V, et al. Adsorption of radium
and barium on goethite and ferrihydrite: A kinetic and surface complexation modelling study. Geochi-
mica Et Cosmochimica Acta. 2014; 146(146):150–63.
40. Zong Y, Xin H, Zhang J, Li X, Feng J, Deng X, et al. One-pot, template- and surfactant-free solvothermal
synthesis of high-crystalline Fe3O4 nanostructures with adjustable morphologies and high magnetiza-
tion. Journal of Magnetism and Magnetic Materials. 2017; 423:321–6. https://doi.org/10.1016/j.jmmm.
2016.09.132.
41. Gong X, Li J, Lin Y, Liu X, Chen L, Li J, et al. Formation of highly crystalline maghemite nanoparticles
from ferrihydrite in the liquid phase. Chinese Science Bulletin. 2014; 59(29):3904–11. https://doi.org/10.
1007/s11434-014-0520-2
42. Elovich SY, Larionov OG. Theory of adsorption from nonelectrolyte solutions on solid adsorbents. Bulle-
tin of the Academy of Sciences of the Ussr Division of Chemical Science. 1962; 11(2):191–7.
43. Allen SJ, Mckay G, Porter JF. Adsorption isotherm models for basic dye adsorption by peat in single
and binary component systems. Journal of Colloid & Interface Science. 2004; 280(2):322–33.
Magnetic adsorbent for MB removal
PLOS ONE | https://doi.org/10.1371/journal.pone.0191229 February 2, 2018 21 / 22
44. Snehalatha T. Methylene Blue—Ascorbic Acid: An Undergraduate Experiment in Kinetics. Journal of
Chemical Education. 1997; 74(2):228–33.
45. Yang K, Peng H, Wen Y, Li N. Re-examination of characteristic FTIR spectrum of secondary layer in
bilayer oleic acid-coated Fe3O4 nanoparticles. Applied Surface Science. 2010; 256(10):3093–7. http://
dx.doi.org/10.1016/j.apsusc.2009.11.079.
46. Ovchinnikov OV, Evtukhova AV, Kondratenko TS, Smirnov MS, Khokhlov VY, Erina OV. Manifestation
of intermolecular interactions in FTIR spectra of methylene blue molecules. Vibrational Spectroscopy.
2016; 86:181–9.
47. Li FW, Wu X, Ma SJ, Xu ZJ, Liu WH, Liu F. Adsorption and desorption mechanisms of methylene blue
removal with iron-oxide coated porous ceramic filter. Journal of Water Resource & Protection. 2009; 1
(1):35–40.
48. Yukselen Y, Kaya A. Suitability of the methylene blue test for surface area, cation exchange capacity
and swell potential determination of clayey soils. Engineering Geology. 2008; 102(1–2):38–45. https://
doi.org/10.1016/j.enggeo.2008.07.002
Magnetic adsorbent for MB removal
PLOS ONE | https://doi.org/10.1371/journal.pone.0191229 February 2, 2018 22 / 22