Embed Size (px)
Citation preview
RSC Advances
PAPER
Ope
n A
cces
s A
rtic
le. P
ublis
hed
on 0
9 O
ctob
er 2
017.
Dow
nloa
ded
on 1
0/29
/202
1 10
:28:
56 P
M.
Thi
s ar
ticle
is li
cens
ed u
nder
a C
reat
ive
Com
mon
s A
ttrib
utio
n 3.
0 U
npor
ted
Lic
ence
.
View Article OnlineView Journal | View Issue
Synthesis and as
aChemistry Department, Faculty of Scienc
E-mail: [email protected]; feltaibh
Tel: +20 1002449048bDepartment of Analysis and Evaluation, Egy
Cairo, Egypt
† Electronic supplementary informa10.1039/c7ra07176k
Cite this: RSC Adv., 2017, 7, 47335
Received 28th June 2017Accepted 30th September 2017
DOI: 10.1039/c7ra07176k
rsc.li/rsc-advances
This journal is © The Royal Society of C
sessment of new cationic geminisurfactants as inhibitors for carbon steel corrosionin oilfield water†
F. El-Taib Heakal, *a M. A. Deyab, b M. M. Osman,b M. I. Nessimb and A. E. Elkholyb
Three gemini surfactants were synthesized having the same length of terminal chain but differing in the
spacer chain length and they were evaluated as corrosion inhibitors for carbon steel in oilfield water
using weight loss, EIS, potentiodynamic polarization and open-circuit potential measurements. These
measurements revealed that the synthesized materials have served as effective mixed-type corrosion
inhibitors. Their adsorption on a carbon steel surface was well described by means of the Langmuir
adsorption isotherm. The activation parameters for the dissolution of carbon steel in solutions of oilfield
water in the absence and presence of these inhibitors were calculated. The effect of immersion time on
the stability and durability of protective films adsorbed on a carbon steel surface was studied using
weight loss method. Ex situ inspection, i.e. post-exposure analysis, for the treated carbon steel surface
has been performed using SEM, EDX and FT-IR tools.
1. Introduction
Carbon steel (C-steel) is the main engineering material used inconstructing pipelines for transferring water, chemicals andpetroleum products in addition to vessels used in oil and gasproduction systems. This broad usage of carbon steel is due to itsexcellent mechanical properties and cheapness.1,2 Unfortunately,carbon steel-based materials are vulnerable to corrosion by theirneighboring environment. Among the corrosive media doingviolence to C-steel is oileld water which naturally exists in gasand oil reservoirs. It contains huge amounts of dissolved salts (e.g.chloride and sulfate ions) and dissolved corrosive gases (e.g. CO2
and H2S) as well.3 In petroleum oilelds, the disposal of oileldwater separated from crude oil represents a nuisance for workersin the petroleum industry because it is highly saline and pollutedby oil. So, this water is mixed with fresh water and re-injected inthe oil wells so as to stimulate the crude oil stuck to rocks in theoil reservoir to be recovered with the advantage of increasing theoil productivity on one hand and the disposal of oileld water onthe other hand in a process called hydraulic fracturing. Beforeinjection, some chemicals are added to this uid such as scaleand corrosion inhibitors to prevent scale deposition inside oilpipelines and also to prevent their corrosion.4
e, Cairo University, 12613 Giza, Egypt.
[email protected]; Fax: +20 35738425;
ptian Petroleum Research Institute, 11727
tion (ESI) available. See DOI:
hemistry 2017
Among the methods followed for protecting metals againsttheir corrosion is using corrosion inhibitors. It is the mostsuitable procedure because of its high efficiency, economicadvantages, and wide applicability in various elds.5 A corro-sion inhibitor is any material that can reduce the corrosion rateof a metal6 via displacing water molecules from the vicinity ofthe metallic surface then its molecules can interact with theanodic and/or cathodic sites by adsorption.7 These materialscan be classied according to their chemical nature into threegenres: (i) inorganic inhibitors, (ii) organic inhibitors, and (iii)mixed-compound inhibitors.8 Nevertheless, most commonlyused inhibitors are organic compounds especially those con-taining hetero atoms (O, N and/or S)9 and/or those containingmultiple bonds or aromatic rings (p-systems).10 Inhibitionprocess can be performed by electrons transfer between theinhibitor and the metal surface (vacant d-orbitals) formingcoordinate covalent bonds between them.11 Furthermore,adsorption can be due to electrostatic interaction between themetal surface and inhibitor molecules.12 As a result, inhibitoradsorption relies on the surface charge of the metal, i.e., theadsorption of cations is favored if the net charge is negativewhile adsorption of anions is favored when the case isreversed.11
Surfactants, or surface active agents, are a general class oforganic chemical compounds of amphiphilic molecules, eachof them contains a hydrophobic (non-polar) tail and a hydro-philic (polar) head.13 Usually, the hydrophilic head (either polaror ionic group) of surfactant molecule attaches to the metalsurface and its tail or hydrophobic moiety extends away fromthe interface towards the solution bulk forming an array ofhydrophobic tails which leads to a change in the
RSC Adv., 2017, 7, 47335–47352 | 47335
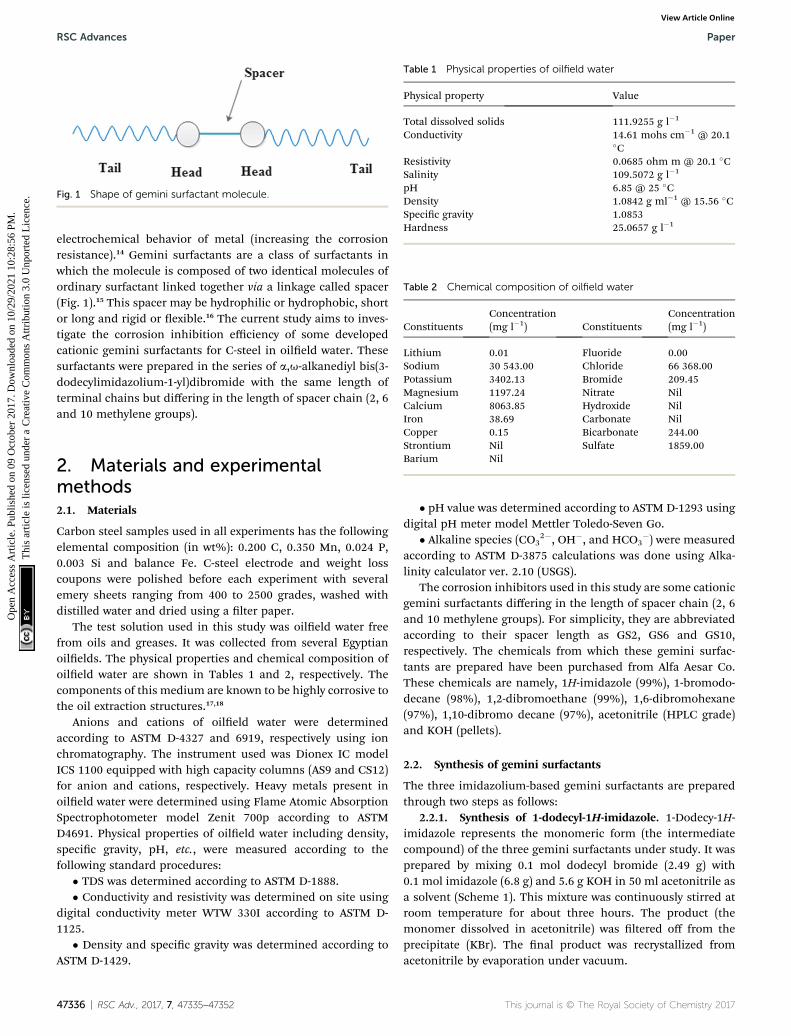
Fig. 1 Shape of gemini surfactant molecule.
Table 1 Physical properties of oilfield water
Physical property Value
Total dissolved solids 111.9255 g l�1
Conductivity 14.61 mohs cm�1 @ 20.1�C
Resistivity 0.0685 ohm m @ 20.1 �CSalinity 109.5072 g l�1
pH 6.85 @ 25 �CDensity 1.0842 g ml�1 @ 15.56 �CSpecic gravity 1.0853Hardness 25.0657 g l�1
Table 2 Chemical composition of oilfield water
ConstituentsConcentration(mg l�1) Constituents
Concentration(mg l�1)
Lithium 0.01 Fluoride 0.00Sodium 30 543.00 Chloride 66 368.00Potassium 3402.13 Bromide 209.45Magnesium 1197.24 Nitrate NilCalcium 8063.85 Hydroxide NilIron 38.69 Carbonate Nil
RSC Advances Paper
Ope
n A
cces
s A
rtic
le. P
ublis
hed
on 0
9 O
ctob
er 2
017.
Dow
nloa
ded
on 1
0/29
/202
1 10
:28:
56 P
M.
Thi
s ar
ticle
is li
cens
ed u
nder
a C
reat
ive
Com
mon
s A
ttrib
utio
n 3.
0 U
npor
ted
Lic
ence
.View Article Online
electrochemical behavior of metal (increasing the corrosionresistance).14 Gemini surfactants are a class of surfactants inwhich the molecule is composed of two identical molecules ofordinary surfactant linked together via a linkage called spacer(Fig. 1).15 This spacer may be hydrophilic or hydrophobic, shortor long and rigid or exible.16 The current study aims to inves-tigate the corrosion inhibition efficiency of some developedcationic gemini surfactants for C-steel in oileld water. Thesesurfactants were prepared in the series of a,u-alkanediyl bis(3-dodecylimidazolium-1-yl)dibromide with the same length ofterminal chains but differing in the length of spacer chain (2, 6and 10 methylene groups).
Copper 0.15 Bicarbonate 244.00Strontium Nil Sulfate 1859.00Barium Nil
2. Materials and experimentalmethods2.1. Materials
Carbon steel samples used in all experiments has the followingelemental composition (in wt%): 0.200 C, 0.350 Mn, 0.024 P,0.003 Si and balance Fe. C-steel electrode and weight losscoupons were polished before each experiment with severalemery sheets ranging from 400 to 2500 grades, washed withdistilled water and dried using a lter paper.
The test solution used in this study was oileld water freefrom oils and greases. It was collected from several Egyptianoilelds. The physical properties and chemical composition ofoileld water are shown in Tables 1 and 2, respectively. Thecomponents of this medium are known to be highly corrosive tothe oil extraction structures.17,18
Anions and cations of oileld water were determinedaccording to ASTM D-4327 and 6919, respectively using ionchromatography. The instrument used was Dionex IC modelICS 1100 equipped with high capacity columns (AS9 and CS12)for anion and cations, respectively. Heavy metals present inoileld water were determined using Flame Atomic AbsorptionSpectrophotometer model Zenit 700p according to ASTMD4691. Physical properties of oileld water including density,specic gravity, pH, etc., were measured according to thefollowing standard procedures:
� TDS was determined according to ASTM D-1888.� Conductivity and resistivity was determined on site using
digital conductivity meter WTW 330I according to ASTM D-1125.
� Density and specic gravity was determined according toASTM D-1429.
47336 | RSC Adv., 2017, 7, 47335–47352
� pH value was determined according to ASTM D-1293 usingdigital pH meter model Mettler Toledo-Seven Go.
� Alkaline species (CO32�, OH�, and HCO3
�) were measuredaccording to ASTM D-3875 calculations was done using Alka-linity calculator ver. 2.10 (USGS).
The corrosion inhibitors used in this study are some cationicgemini surfactants differing in the length of spacer chain (2, 6and 10 methylene groups). For simplicity, they are abbreviatedaccording to their spacer length as GS2, GS6 and GS10,respectively. The chemicals from which these gemini surfac-tants are prepared have been purchased from Alfa Aesar Co.These chemicals are namely, 1H-imidazole (99%), 1-bromodo-decane (98%), 1,2-dibromoethane (99%), 1,6-dibromohexane(97%), 1,10-dibromo decane (97%), acetonitrile (HPLC grade)and KOH (pellets).
2.2. Synthesis of gemini surfactants
The three imidazolium-based gemini surfactants are preparedthrough two steps as follows:
2.2.1. Synthesis of 1-dodecyl-1H-imidazole. 1-Dodecy-1H-imidazole represents the monomeric form (the intermediatecompound) of the three gemini surfactants under study. It wasprepared by mixing 0.1 mol dodecyl bromide (2.49 g) with0.1 mol imidazole (6.8 g) and 5.6 g KOH in 50 ml acetonitrile asa solvent (Scheme 1). This mixture was continuously stirred atroom temperature for about three hours. The product (themonomer dissolved in acetonitrile) was ltered off from theprecipitate (KBr). The nal product was recrystallized fromacetonitrile by evaporation under vacuum.
This journal is © The Royal Society of Chemistry 2017
Scheme 1 Synthetic route for 1-dodecyl-1H-imidazole.
Paper RSC Advances
Ope
n A
cces
s A
rtic
le. P
ublis
hed
on 0
9 O
ctob
er 2
017.
Dow
nloa
ded
on 1
0/29
/202
1 10
:28:
56 P
M.
Thi
s ar
ticle
is li
cens
ed u
nder
a C
reat
ive
Com
mon
s A
ttrib
utio
n 3.
0 U
npor
ted
Lic
ence
.View Article Online
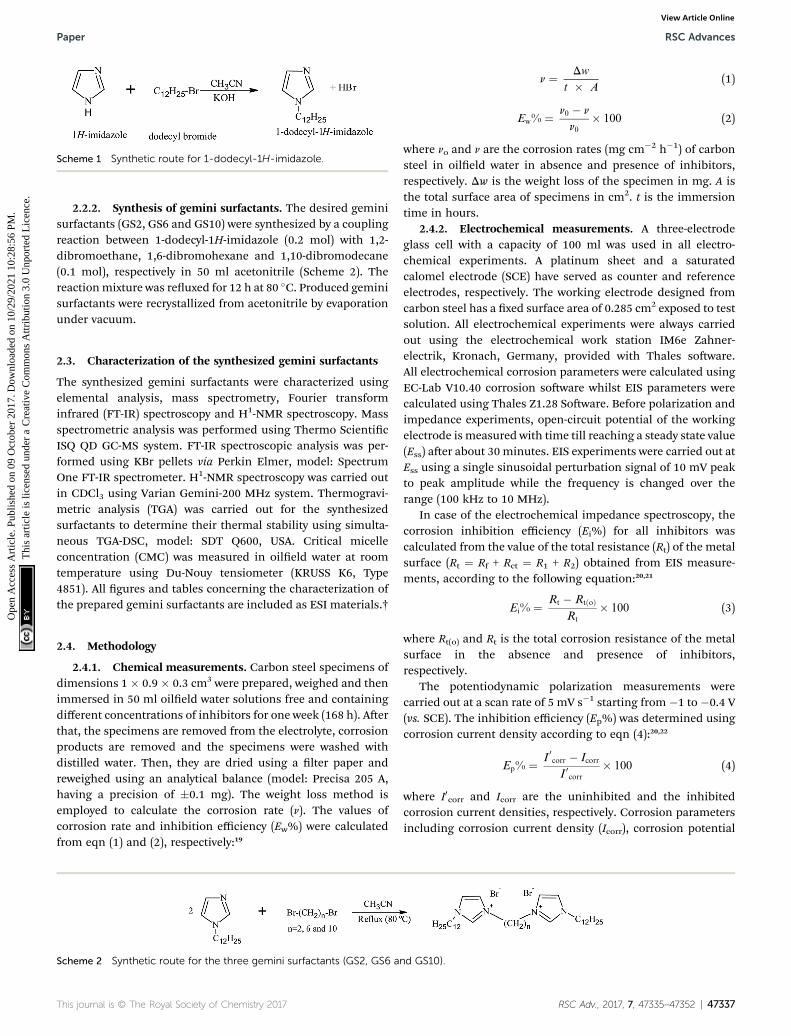
2.2.2. Synthesis of gemini surfactants. The desired geminisurfactants (GS2, GS6 and GS10) were synthesized by a couplingreaction between 1-dodecyl-1H-imidazole (0.2 mol) with 1,2-dibromoethane, 1,6-dibromohexane and 1,10-dibromodecane(0.1 mol), respectively in 50 ml acetonitrile (Scheme 2). Thereactionmixture was reuxed for 12 h at 80 �C. Produced geminisurfactants were recrystallized from acetonitrile by evaporationunder vacuum.
2.3. Characterization of the synthesized gemini surfactants
The synthesized gemini surfactants were characterized usingelemental analysis, mass spectrometry, Fourier transforminfrared (FT-IR) spectroscopy and H1-NMR spectroscopy. Massspectrometric analysis was performed using Thermo ScienticISQ QD GC-MS system. FT-IR spectroscopic analysis was per-formed using KBr pellets via Perkin Elmer, model: SpectrumOne FT-IR spectrometer. H1-NMR spectroscopy was carried outin CDCl3 using Varian Gemini-200 MHz system. Thermogravi-metric analysis (TGA) was carried out for the synthesizedsurfactants to determine their thermal stability using simulta-neous TGA-DSC, model: SDT Q600, USA. Critical micelleconcentration (CMC) was measured in oileld water at roomtemperature using Du-Nouy tensiometer (KRUSS K6, Type4851). All gures and tables concerning the characterization ofthe prepared gemini surfactants are included as ESI materials.†
2.4. Methodology
2.4.1. Chemical measurements. Carbon steel specimens ofdimensions 1 � 0.9 � 0.3 cm3 were prepared, weighed and thenimmersed in 50 ml oileld water solutions free and containingdifferent concentrations of inhibitors for one week (168 h). Aerthat, the specimens are removed from the electrolyte, corrosionproducts are removed and the specimens were washed withdistilled water. Then, they are dried using a lter paper andreweighed using an analytical balance (model: Precisa 205 A,having a precision of �0.1 mg). The weight loss method isemployed to calculate the corrosion rate (n). The values ofcorrosion rate and inhibition efficiency (Ew%) were calculatedfrom eqn (1) and (2), respectively:19
Scheme 2 Synthetic route for the three gemini surfactants (GS2, GS6 a
This journal is © The Royal Society of Chemistry 2017
n ¼ Dw
t � A(1)
Ew% ¼ n0 � n
n0� 100 (2)
where no and n are the corrosion rates (mg cm�2 h�1) of carbonsteel in oileld water in absence and presence of inhibitors,respectively. Dw is the weight loss of the specimen in mg. A isthe total surface area of specimens in cm2. t is the immersiontime in hours.
2.4.2. Electrochemical measurements. A three-electrodeglass cell with a capacity of 100 ml was used in all electro-chemical experiments. A platinum sheet and a saturatedcalomel electrode (SCE) have served as counter and referenceelectrodes, respectively. The working electrode designed fromcarbon steel has a xed surface area of 0.285 cm2 exposed to testsolution. All electrochemical experiments were always carriedout using the electrochemical work station IM6e Zahner-electrik, Kronach, Germany, provided with Thales soware.All electrochemical corrosion parameters were calculated usingEC-Lab V10.40 corrosion soware whilst EIS parameters werecalculated using Thales Z1.28 Soware. Before polarization andimpedance experiments, open-circuit potential of the workingelectrode is measured with time till reaching a steady state value(Ess) aer about 30 minutes. EIS experiments were carried out atEss using a single sinusoidal perturbation signal of 10 mV peakto peak amplitude while the frequency is changed over therange (100 kHz to 10 MHz).
In case of the electrochemical impedance spectroscopy, thecorrosion inhibition efficiency (Ei%) for all inhibitors wascalculated from the value of the total resistance (Rt) of the metalsurface (Rt ¼ Rf + Rct ¼ R1 + R2) obtained from EIS measure-ments, according to the following equation:20,21
Ei% ¼ Rt � RtðoÞRt
� 100 (3)
where Rt(o) and Rt is the total corrosion resistance of the metalsurface in the absence and presence of inhibitors,respectively.
The potentiodynamic polarization measurements werecarried out at a scan rate of 5 mV s�1 starting from �1 to �0.4 V(vs. SCE). The inhibition efficiency (Ep%) was determined usingcorrosion current density according to eqn (4):20,22
Ep% ¼ I0corr � Icorr
I 0corr� 100 (4)
where I0corr and Icorr are the uninhibited and the inhibitedcorrosion current densities, respectively. Corrosion parametersincluding corrosion current density (Icorr), corrosion potential
nd GS10).
RSC Adv., 2017, 7, 47335–47352 | 47337

RSC Advances Paper
Ope
n A
cces
s A
rtic
le. P
ublis
hed
on 0
9 O
ctob
er 2
017.
Dow
nloa
ded
on 1
0/29
/202
1 10
:28:
56 P
M.
Thi
s ar
ticle
is li
cens
ed u
nder
a C
reat
ive
Com
mon
s A
ttrib
utio
n 3.
0 U
npor
ted
Lic
ence
.View Article Online
(Ecorr), cathodic and anodic Tafel slopes (bc and ba) are obtainedby extrapolating the linear parts of cathodic and anodic Tafelcurves to the point of intersection.20 The effect of temperaturewas studied using polarization technique throughouta temperature range of 283–313 K. The potential of zero charge(pzc) is recorded as a relation between potential and capaci-tance giving a plot having a shape of a downward parabolawhose minimum represents pzc.23 The potential is scanned overthe range from �0.8 to �0.6 V (vs. SCE).
2.5. Surface analysis
2.5.1. SEM and EDX. Surface morphology of carbon steelimmersed in blank and inhibited solutions of oileld water isinvestigated using Scanning Electron Microscopy (SEM) andEnergy Dispersive X-ray (EDX). Then, the surface morphology ofcarbon steel coupons is scanned using FE-SEM Model Quanta250 attached with EDX (Energy Dispersive X-ray) unit, FEICompany, Netherlands.
2.5.2. FT-IR. FT-IR analysis is performed for corrosionproducts scratched from surface of C-steel immersed ininhibited solutions and compared with FT-IR spectra of crudeinhibitors to conrm the occurrence of adsorption of inhibitorsmolecules on C-steel surface.24 FT-IR analysis was performedusing KBr pellets via Perkin Elmer, Spectrum One FT-IRspectrometer.
3. Results and discussion3.1. Characterization of the synthesized gemini surfactants
3.1.1. The intermediate compound. The mass spectrum ofthe intermediate compound (Fig. S1†) shows a base peak at m/z¼ 81.99 [(C3N2H3)CH3]
+. and other signicant peaks some ofthem are shown at m/z: 68.98 [CH2CHCH2CH2CH2]
+, 123.03[(C3N2H3)C4H8]
+, 136.92 [(C3N2H3)C5H10]+, 151.03 [(C3N2H3)
C6H12]+, 179.06 [(C3N2H3)C8H16]
+, 193.02 [(C3N2H3)C9H18]+,
207.07 [(C3N2H3)C10H20]+ and 235.08 [(C3N2H3)C12H24]
+. Themolecular ion peak appears at m/z of 236.13 [(C3N2H3)C12H25]
+.Fig. S2† displays the FT-IR spectrum of the intermediatecompound. Its FT-IR absorption bands are listed in Table S1†and can be discussed as following:
� Aliphatic C–H stretching bands appear at 2923–2854 cm�1.� Aromatic C–H stretching bands appear at 3099 cm�1.� N–H stretching bands (broad) appear at 3407 cm�1. This
could be attributed to the presence of the carbene proton in theform of NH+ (Scheme S1†).
� C]C stretching bands appear at 2028 cm�1.� C–C stretching bands appear at 1563 cm�1.Fig. S3† demonstrates the H1-NMR spectrum of the inter-
mediate compound. From the data listed in Table S2,† we canobserve the following:
� The proton (a) has a high chemical shi which could beattributed to the presence of the carbene proton.
� The same protons (b) [with the value of 7.436 ppm],possesses the carbene type.
47338 | RSC Adv., 2017, 7, 47335–47352
� The aromatic proton (c) has the value (6.969 ppm), whereasthe aromatic protons (d) have the chemical shis of 6.843 ppm.Both of the two types showed doublet spin multiplicity.
� Protons of the type (e), attached directly to nitrogen atom,have the value of 4.274.
� In the case of protons (f), the chemical shi appears at3.864 ppm.
� The d value of (g) protons is 1.703 ppm.� In case of four protons (h), d value is 1.187 ppm.� The highly shielded protons of themonomer have the value
of 0.812 ppm.3.1.2. The gemini surfactants. The mass spectrum of GS2
(Fig. S4†) shows a base peak at m/z ¼ 136.92 [(C3N2H3)C5H10]+
and other signicant peaks some of them are shown at m/z:68.98 [CH2CHCH2CH2CH2]
+, 81.99 [(C3N2H3)CH3]+, 123.03
[(C3N2H3)C4H8]+, 151.03 [(C3N2H3)C6H12]
+, 162.01[(C3N2H3)(CH2)2[(C3N2H3)]
+, 179.06 [(C3N2H3)C8H16]+, 193.02
[(C3N2H3)C9H18]+, 207.07 [(C3N2H3)C10H20]
+, 235.08 [(C3N2H3)C12H24]
+, and 236.13 [(C3N2H3)C12H25]+. Themolecular ion peak
appears at m/z of 660 [C12H25(C3N2H3)2C12H25Br2]+.
Fig. S5 through Fig. S7† display the FT-IR spectra of GS2, GS6and GS10. The FT-IR absorption bands of the prepared geminisurfactants are listed in Table S1† and can be discussed asfollowing:
� N–H stretching bands (broad) appear at: 3417 cm�1; GS2,3416 cm�1; GS6 and 3419 cm�1; GS10 due to the presence of thecarbene proton in the form of NH+ (Scheme 2).
� Aromatic C–H stretching bands appear at: 3039 cm�1
(GS2), 3073 cm�1 (GS6) and 3070 cm�1 (GS10).� Aliphatic C–H stretching bands appear at: 2922–2852 cm�1
(GS2), 2924–2854 cm�1 (GS6) and 2923–2853 cm�1 (GS10).� C]C stretching bands appear at: 2042 cm�1 (GS2),
2062 cm�1 (GS6) and 2055 cm�1 (GS10).� C–C stretching bands appear at: 1563 cm�1 (GS2),
1625 cm�1 (GS6) and 1623 cm�1 (GS10).� C–Br (ionic bond) bands appear at: 635.7 cm�1 (GS2),
634.9 cm�1 (GS6) and 634.8 cm�1 (GS10).Fig. S8 through Fig. S10† demonstrates the H1-NMR spec-
trum of GS2, GS6 and GS10. The chemical shis of H1-NMRspectra for different types of protons in the three geminisurfactants (Fig. S11†) are listed in Table S3† and we canobserve the following:
� The proton (a), [compounds GS2, GS6 and GS10], has highchemical shi (10.168, 10.177 and 10.323 ppm, respectively).This could be attributed also to the presence of the carbeneproton in the form of NH+.
� The same protons (b) [with the values of 8.409, 9.375 and9.274 ppm], possess the carbene type.
� The aromatic protons (c) have the values (7.376, 7.453 and7.421 ppm), whereas the aromatic protons (d) have the chemicalshis of 7.270, 7.272 and 7.271 ppm. Both of the two typesshowed doublet spin multiplicity.
� Protons of the type (e), attached directly to N+, have thevalues of 4.534, 4.308 and 4.335 ppm respectively. The spinmultiplicity of (e) proton is triplet.
� In case of compound GS2, the four protons (f) possess (d)value of 4.202 ppm (triplet). Whereas the four (f) protons of
This journal is © The Royal Society of Chemistry 2017

Paper RSC Advances
Ope
n A
cces
s A
rtic
le. P
ublis
hed
on 0
9 O
ctob
er 2
017.
Dow
nloa
ded
on 1
0/29
/202
1 10
:28:
56 P
M.
Thi
s ar
ticle
is li
cens
ed u
nder
a C
reat
ive
Com
mon
s A
ttrib
utio
n 3.
0 U
npor
ted
Lic
ence
.View Article Online
compounds GS6 and GS10 have the values of 4.248 and3.370 ppm with triplet spin multiplicity and the four (f*)protons possess (d) values of 4.283 and 3.393 ppm respectivelywith multiplet spin multiplicity.
� The (d) value of the four multiplet (g) protons in (GS2) is4.094 ppm. In the case of GS6 and GS10, the eight (multiplet g)protons are approximately equal and possess 3.462 and2.568 ppm respectively.
� In case of four protons (h) of GS2 and GS6, d values are1.881 and 1.854 ppm respectively with multiplet spin multi-plicity. While in GS10, the twelve protons possess 1.844 ppmwith multiplet multiplicity.
� The 32 protons (i) for GS2, GS6 and GS10 have the values of1.273, 1.383 and 1.235 ppm respectively, with multipletmultiplicity.
� The highly shielded six protons of GS2, GS6 and GS10, havethe values of 0.838, 0.811 and 0.842 ppm respectively withtriplet spin multiplicity.
Table S4† illustrates the results of elemental analysis wherethe observed results are in good agreement with the calculatedones. The thermal stability of the three prepared geminisurfactants was assessed using thermogravimetric analysis(TGA). Fig. S12† shows that the three surfactants are stable up to250 �C and completely lose their weights at 340 �C. Both GS6and GS10 have comparable thermal stability but the geminisurfactant of shortest spacer (GS2) has showed a slight increasein the degradation temperature in comparison to both GS6 andGS10.
3.2. Effect of inhibitor concentration
3.2.1. Weight loss measurements. Gravimetric (chemical)method is utilized for evaluating the corrosion rate and inhi-bition efficiency (Ew%) for carbon steel in oileld water
Table 3 Weight loss rate and inhibition efficiency calculated fromgravimetric measurements for C-steel in oilfield water as a function ofgemini surfactant concentration at room temperature for one week
InhibitorConcentration(ppm)
Weight loss rate� 103 (mg cm�2 h�1) Ew%
Blank — 5.30 —GS2 50 4.16 21.49
100 1.98 62.69150 1.83 65.47200 1.72 67.64300 1.75 67.04400 1.75 67.05
GS6 50 4.79 17.89100 3.46 34.76150 3.29 37.93200 3.12 41.13300 2.65 62.30400 3.02 43.05
GS10 50 2.04 61.53100 0.85 83.98150 0.78 85.21200 0.85 83.96300 0.98 81.52400 1.27 76.01
This journal is © The Royal Society of Chemistry 2017
solutions in absence and presence of the three synthesizedgemini surfactants, GS2, GS6 and GS10 at ambient temperature.Table 3 reveals that the corrosion rate of C-steel immersed inoileld water containing GS2, GS6 or sGS10 decreases withincreasing their concentration (up to critical values). Thisbehavior can be attributed to the increase in the number ofsurfactant molecules adsorbed at metal/solution interface onincreasing its concentration. So, molecules of the geminisurfactants constitute adsorption lms on C-steel surface whichprotects it against corrosive species. The maximum Ew% valuesfor the three gemini surfactants are 67.64% at 200 ppm GS2,62.30% at 300 ppm GS6 and 85.21% at 150 ppm GS10. Thedecrease in the corrosion rate of C-steel in oileld water inpresence of these gemini surfactants conrms that their mole-cules have adsorbed on C-steel surface.20
3.2.2. EIS measurements. EIS is an effective techniqueutilized for studying the corrosion behavior of protected andbare carbon steel.25 EIS spectra for solutions containing anygemini surfactant show some deviations from the ideal
Fig. 2 EIS spectra for C-steel in oilfield water as a function of GS2concentration at 293 K in the Bode format (a) and Nyquist format (b).
RSC Adv., 2017, 7, 47335–47352 | 47339

RSC Advances Paper
Ope
n A
cces
s A
rtic
le. P
ublis
hed
on 0
9 O
ctob
er 2
017.
Dow
nloa
ded
on 1
0/29
/202
1 10
:28:
56 P
M.
Thi
s ar
ticle
is li
cens
ed u
nder
a C
reat
ive
Com
mon
s A
ttrib
utio
n 3.
0 U
npor
ted
Lic
ence
.View Article Online
capacitive behavior recorded in any tested solution. As anexample, Bode plot for GS2 (Fig. 2(a)) displays a two-timeconstant behavior where the resistive part at LF region inBode plot doesn't appear and F doesn't reach 0 although thespectra was measured down to 0.01 Hz. Two-time constantbehavior may be attributed to roughness and other inhomoge-neity of solid surface.26 Moreover, Nyquist format (Fig. 2(b))shows no ideal capacitive semicircles but each plot displays twoincomplete semicircles: the rst one, at high frequency (HF)region appearing as a part of small loop linked to another largeincomplete one at low frequency region (LF) and deectsupward giving to a slightly inclined line or an arc. This featurerefers to Warburg impedance21 due to diffusion process.27 Formore clarication, Nyquist spectrum for the blank solution isdisplayed in the inset. The arcs that have appeared in theNyquist plots represent parts of depressed semicircles whosecenters are located beneath the real axis. This behavior ischaracteristic for solid electrodes and is oen referred to asfrequency dispersion and occurs due to surface roughness,impurities or dislocations.28 Surface roughness is attributed tothe eating away of local sites on electrode surface.22 For oileld
Table 4 Electrochemical impedance parameters and inhibition efficiesurfactant concentration at 293 K
Inhibitor C (ppm)W(U cm2 s�0.5) R1 (U cm2) Q1 (mF cm�2)
Blank — 66.23 491.34 100.21GS2 50 24.74 1010.04 136.81
100 7.5 1056.21 252.32150 7.21 1181.33 306.00200 11.39 1726.53 314.21300 30.75 1574.06 280.67400 35.23 1529.88 255.05
GS6 50 150.08 654.08 62.67100 27.87 802.85 104.14150 128.14 993.23 118.91200 1.85 1362.3 215.16300 740.15 1393.65 132.04400 2.62 1206.98 182.46
GS10 50 7.46 1093.55 207.47100 10.66 1471.74 177.05150 75.13 1951.4 131.65200 74.53 1749.33 129.4300 9.1 1633.34 161.19400 48.22 1507.94 121.37
Fig. 3 The equivalent circuit.
47340 | RSC Adv., 2017, 7, 47335–47352
water inhibited by gemini surfactants, the straight lineappearing at LF region in blank solution turns to take the shapeof an arc whose angle increases with inhibitor concentration(till a critical value) due to the increase in the degree of surfacecoverage (q) by inhibitor molecules.29 Above the criticalconcentrations, the arcs are lowered again indicating thatcorrosion protection has decreased again. EIS spectra for GS6and GS10 are shown in ESI data (Fig. S13 through Fig. S16†).
In an attempt to analyze the experimental impedance data,the equivalent circuit depicted in Fig. 330 was found to givea satisfactory tting result with a maximum average error 0.3%.In this electrical model, two constant phase elements (Q1 andQ2) are used instead of the two real capacitances to give the besttting. For a rough or porous surface, non-homogeneity cancause the double layer capacitance to appear as a constantphase element.31 This model consists of two-time constants((Q1R1W) and (Q2R2)) parallel to each other and all in series tothe solution resistance (Rs). The rst time constant (Q1R1W)expresses the behavior at LF region and is attributed to theadsorbed lm while the other one (Q2R2) is related to the HFregion and describes the behavior of the double layer at the baseof pores or defects in the lm. The constant phase element hasa non-integer parameter called the phase shi (n) which is usedto compensate the system heterogeneity. So, the phase shi (n)can be described as a degree of surface roughness or non-homogeneity.32
Investigating the simulated data listed in Table 4 illustratesthe following important points:
(a) The solution resistance (Rs) is low and nearly remainsconstant either in the absence or presence of inhibitors (rangesbetween 1.11 and 1.61 U cm2) due to good conductivity of alltested solutions.33
ncy calculated for C-steel in oilfield water as a function of gemini
n1 R2 (U cm2) Q2 (mF cm�2) n2 Rs (U cm2) Ei%
0.47 10.10 68.11 0.82 1.13 —0.537 14.25 62.21 0.836 1.2 51.050.585 12.41 71.44 0.815 1.29 53.080.609 12.52 72.32 0.819 1.11 58.000.601 11.39 69.02 0.819 1.20 71.150.591 11.63 71.33 0.806 1.33 68.380.611 11.75 70.25 0.814 1.32 67.470.42 17.12 51.75 0.804 1.29 25.290.484 13.47 47.65 0.753 1.35 38.570.498 13.86 50.98 0.777 1.57 50.210.556 21.79 57.26 0.725 1.59 63.770.501 15.04 45.65 0.749 1.16 64.400.534 19.31 55.96 0.746 1.61 59.110.6 14.09 58.42 0.79 1.27 54.730.61 19.93 54.81 0.79 1.28 66.380.58 22.54 51.79 0.79 1.36 74.600.58 20.09 52.35 0.82 1.37 71.660.62 25.95 48.25 0.8 1.33 69.780.57 22.65 49.26 0.82 1.15 67.24
This journal is © The Royal Society of Chemistry 2017
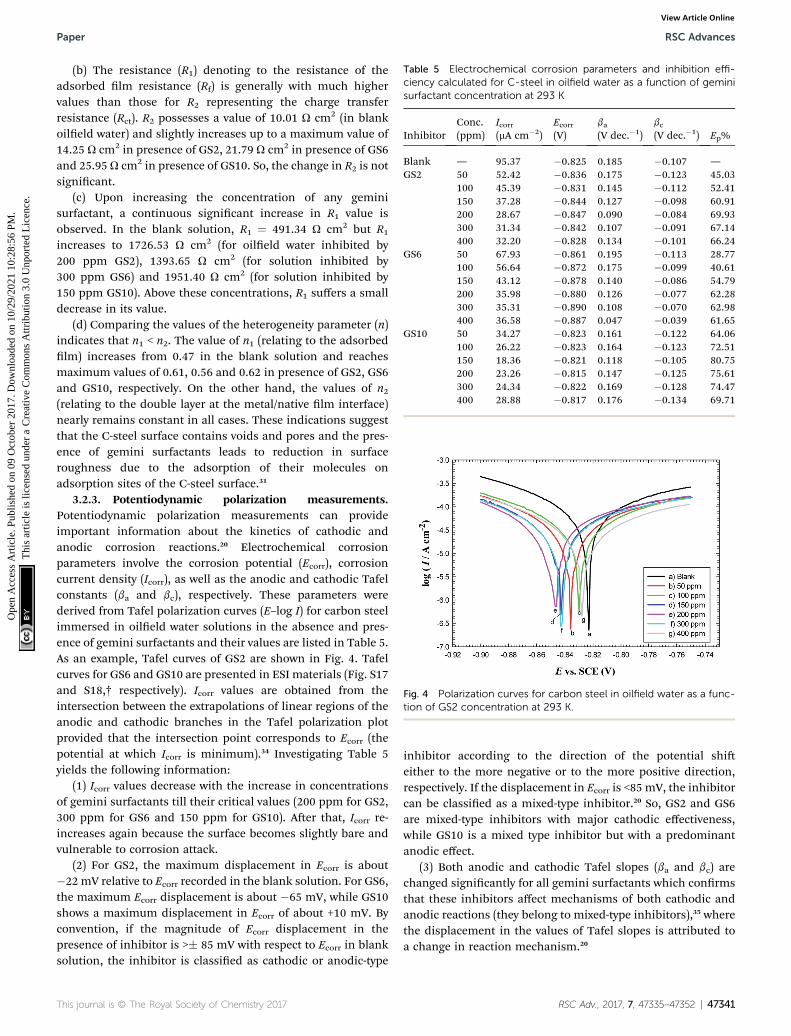
Fig. 4 Polarization curves for carbon steel in oilfield water as a func-tion of GS2 concentration at 293 K.
Table 5 Electrochemical corrosion parameters and inhibition effi-ciency calculated for C-steel in oilfield water as a function of geminisurfactant concentration at 293 K
InhibitorConc.(ppm)
Icorr(mA cm�2)
Ecorr(V)
ba(V dec.�1)
bc(V dec.�1) Ep%
Blank — 95.37 �0.825 0.185 �0.107 —GS2 50 52.42 �0.836 0.175 �0.123 45.03
100 45.39 �0.831 0.145 �0.112 52.41150 37.28 �0.844 0.127 �0.098 60.91200 28.67 �0.847 0.090 �0.084 69.93300 31.34 �0.842 0.107 �0.091 67.14400 32.20 �0.828 0.134 �0.101 66.24
GS6 50 67.93 �0.861 0.195 �0.113 28.77100 56.64 �0.872 0.175 �0.099 40.61150 43.12 �0.878 0.140 �0.086 54.79200 35.98 �0.880 0.126 �0.077 62.28300 35.31 �0.890 0.108 �0.070 62.98400 36.58 �0.887 0.047 �0.039 61.65
GS10 50 34.27 �0.823 0.161 �0.122 64.06100 26.22 �0.823 0.164 �0.123 72.51150 18.36 �0.821 0.118 �0.105 80.75200 23.26 �0.815 0.147 �0.125 75.61300 24.34 �0.822 0.169 �0.128 74.47400 28.88 �0.817 0.176 �0.134 69.71
Paper RSC Advances
Ope
n A
cces
s A
rtic
le. P
ublis
hed
on 0
9 O
ctob
er 2
017.
Dow
nloa
ded
on 1
0/29
/202
1 10
:28:
56 P
M.
Thi
s ar
ticle
is li
cens
ed u
nder
a C
reat
ive
Com
mon
s A
ttrib
utio
n 3.
0 U
npor
ted
Lic
ence
.View Article Online
(b) The resistance (R1) denoting to the resistance of theadsorbed lm resistance (Rf) is generally with much highervalues than those for R2 representing the charge transferresistance (Rct). R2 possesses a value of 10.01 U cm2 (in blankoileld water) and slightly increases up to a maximum value of14.25 U cm2 in presence of GS2, 21.79 U cm2 in presence of GS6and 25.95 U cm2 in presence of GS10. So, the change in R2 is notsignicant.
(c) Upon increasing the concentration of any geminisurfactant, a continuous signicant increase in R1 value isobserved. In the blank solution, R1 ¼ 491.34 U cm2 but R1
increases to 1726.53 U cm2 (for oileld water inhibited by200 ppm GS2), 1393.65 U cm2 (for solution inhibited by300 ppm GS6) and 1951.40 U cm2 (for solution inhibited by150 ppm GS10). Above these concentrations, R1 suffers a smalldecrease in its value.
(d) Comparing the values of the heterogeneity parameter (n)indicates that n1 < n2. The value of n1 (relating to the adsorbedlm) increases from 0.47 in the blank solution and reachesmaximum values of 0.61, 0.56 and 0.62 in presence of GS2, GS6and GS10, respectively. On the other hand, the values of n2(relating to the double layer at the metal/native lm interface)nearly remains constant in all cases. These indications suggestthat the C-steel surface contains voids and pores and the pres-ence of gemini surfactants leads to reduction in surfaceroughness due to the adsorption of their molecules onadsorption sites of the C-steel surface.31
3.2.3. Potentiodynamic polarization measurements.Potentiodynamic polarization measurements can provideimportant information about the kinetics of cathodic andanodic corrosion reactions.20 Electrochemical corrosionparameters involve the corrosion potential (Ecorr), corrosioncurrent density (Icorr), as well as the anodic and cathodic Tafelconstants (ba and bc), respectively. These parameters werederived from Tafel polarization curves (E–log I) for carbon steelimmersed in oileld water solutions in the absence and pres-ence of gemini surfactants and their values are listed in Table 5.As an example, Tafel curves of GS2 are shown in Fig. 4. Tafelcurves for GS6 and GS10 are presented in ESI materials (Fig. S17and S18,† respectively). Icorr values are obtained from theintersection between the extrapolations of linear regions of theanodic and cathodic branches in the Tafel polarization plotprovided that the intersection point corresponds to Ecorr (thepotential at which Icorr is minimum).34 Investigating Table 5yields the following information:
(1) Icorr values decrease with the increase in concentrationsof gemini surfactants till their critical values (200 ppm for GS2,300 ppm for GS6 and 150 ppm for GS10). Aer that, Icorr re-increases again because the surface becomes slightly bare andvulnerable to corrosion attack.
(2) For GS2, the maximum displacement in Ecorr is about�22 mV relative to Ecorr recorded in the blank solution. For GS6,the maximum Ecorr displacement is about �65 mV, while GS10shows a maximum displacement in Ecorr of about +10 mV. Byconvention, if the magnitude of Ecorr displacement in thepresence of inhibitor is >� 85 mV with respect to Ecorr in blanksolution, the inhibitor is classied as cathodic or anodic-type
This journal is © The Royal Society of Chemistry 2017
inhibitor according to the direction of the potential shieither to the more negative or to the more positive direction,respectively. If the displacement in Ecorr is <85 mV, the inhibitorcan be classied as a mixed-type inhibitor.20 So, GS2 and GS6are mixed-type inhibitors with major cathodic effectiveness,while GS10 is a mixed type inhibitor but with a predominantanodic effect.
(3) Both anodic and cathodic Tafel slopes (ba and bc) arechanged signicantly for all gemini surfactants which conrmsthat these inhibitors affect mechanisms of both cathodic andanodic reactions (they belong to mixed-type inhibitors),35 wherethe displacement in the values of Tafel slopes is attributed toa change in reaction mechanism.20
RSC Adv., 2017, 7, 47335–47352 | 47341
RSC Advances Paper
Ope
n A
cces
s A
rtic
le. P
ublis
hed
on 0
9 O
ctob
er 2
017.
Dow
nloa
ded
on 1
0/29
/202
1 10
:28:
56 P
M.
Thi
s ar
ticle
is li
cens
ed u
nder
a C
reat
ive
Com
mon
s A
ttrib
utio
n 3.
0 U
npor
ted
Lic
ence
.View Article Online
The inhibition efficiency values increase as a function ofconcentration of gemini surfactants till certain values. Abovethese critical concentrations, the inhibition efficiency valuesstart to decrease again with increasing concentration. There aretwo suggestions for explaining this behavior:
1 Mu et al.36 have studied the inhibitive effect of sodiumdodecyl sulfonate (SDS) onmild steel in 2 MHCl and found thatthe maximum inhibition efficiency was obtained at 150 ppmand the inhibition efficiency decreases when surfactantconcentration increases above this value. They explained thisbehavior in a manner that at the high concentration range, SDSadsorbed on the steel surface may form hemi-micelles throughthe interaction between their hydrophobic groups and thesehemi-micelles are similar in structure to the normal micelles.According to this attitude, high concentrations of geminisurfactants lead to aggregation of their molecules which maylead to the desorption of some initially adsorbed ones.
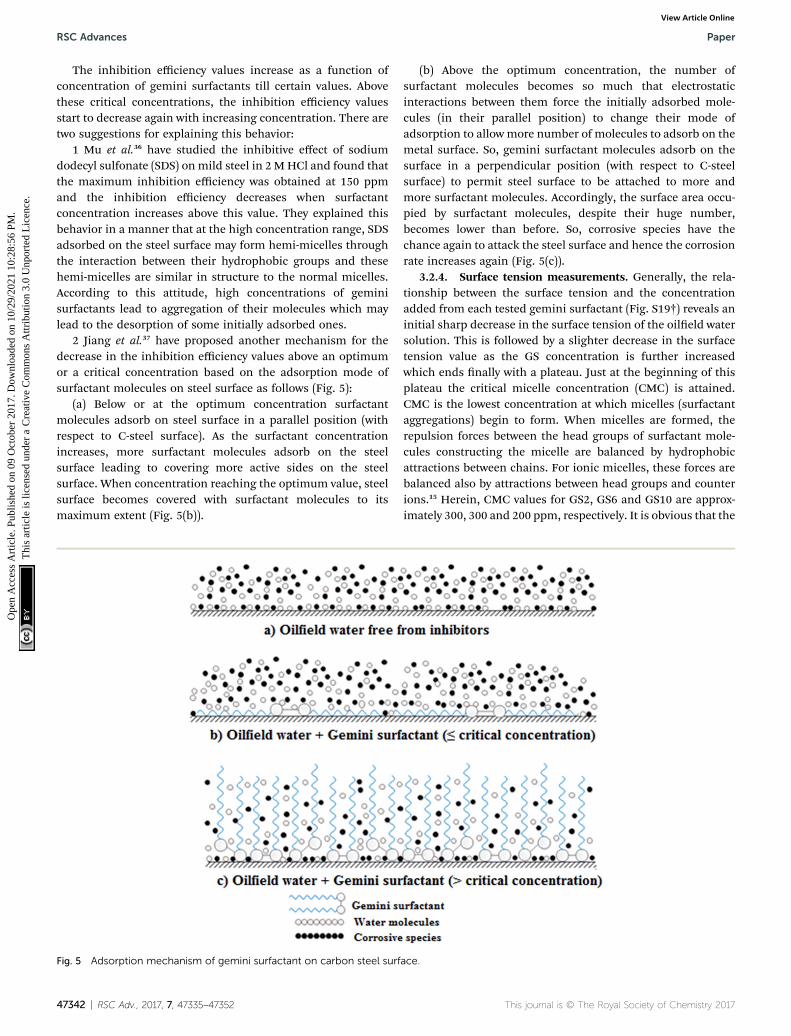
2 Jiang et al.37 have proposed another mechanism for thedecrease in the inhibition efficiency values above an optimumor a critical concentration based on the adsorption mode ofsurfactant molecules on steel surface as follows (Fig. 5):
(a) Below or at the optimum concentration surfactantmolecules adsorb on steel surface in a parallel position (withrespect to C-steel surface). As the surfactant concentrationincreases, more surfactant molecules adsorb on the steelsurface leading to covering more active sides on the steelsurface. When concentration reaching the optimum value, steelsurface becomes covered with surfactant molecules to itsmaximum extent (Fig. 5(b)).
Fig. 5 Adsorption mechanism of gemini surfactant on carbon steel surf
47342 | RSC Adv., 2017, 7, 47335–47352
(b) Above the optimum concentration, the number ofsurfactant molecules becomes so much that electrostaticinteractions between them force the initially adsorbed mole-cules (in their parallel position) to change their mode ofadsorption to allow more number of molecules to adsorb on themetal surface. So, gemini surfactant molecules adsorb on thesurface in a perpendicular position (with respect to C-steelsurface) to permit steel surface to be attached to more andmore surfactant molecules. Accordingly, the surface area occu-pied by surfactant molecules, despite their huge number,becomes lower than before. So, corrosive species have thechance again to attack the steel surface and hence the corrosionrate increases again (Fig. 5(c)).
3.2.4. Surface tension measurements. Generally, the rela-tionship between the surface tension and the concentrationadded from each tested gemini surfactant (Fig. S19†) reveals aninitial sharp decrease in the surface tension of the oileld watersolution. This is followed by a slighter decrease in the surfacetension value as the GS concentration is further increasedwhich ends nally with a plateau. Just at the beginning of thisplateau the critical micelle concentration (CMC) is attained.CMC is the lowest concentration at which micelles (surfactantaggregations) begin to form. When micelles are formed, therepulsion forces between the head groups of surfactant mole-cules constructing the micelle are balanced by hydrophobicattractions between chains. For ionic micelles, these forces arebalanced also by attractions between head groups and counterions.15 Herein, CMC values for GS2, GS6 and GS10 are approx-imately 300, 300 and 200 ppm, respectively. It is obvious that the
ace.
This journal is © The Royal Society of Chemistry 2017

Fig. 6 Langmuir adsorption plots for carbon steel in oilfield waterinhibited by gemini surfactants based on data from weight loss (a), EIS(b) and polarization (c).
Paper RSC Advances
Ope
n A
cces
s A
rtic
le. P
ublis
hed
on 0
9 O
ctob
er 2
017.
Dow
nloa
ded
on 1
0/29
/202
1 10
:28:
56 P
M.
Thi
s ar
ticle
is li
cens
ed u
nder
a C
reat
ive
Com
mon
s A
ttrib
utio
n 3.
0 U
npor
ted
Lic
ence
.View Article Online
maximum inhibition efficiency is below or just at the CMCvalues at which micelles begin to form. Aer CMC, the inhibi-tion efficiency decreases as surfactant molecules start to leavethe carbon steel surface offering a chance for the corrosivespecies to re-attack the bare region on the steel surface.
3.2.5. Adsorption isotherms. Since the metal surface inaqueous solutions is always covered with adsorbed watermolecules, the adsorption of inhibitor molecules from theaqueous solution can be considered as a quasi-substitutionprocess between the inhibitor molecules in the aqueousphase, Inh(sol), and the water molecules at the metal surface,H2O(ads):38
Inh(sol) + xH2O(ads) / Inh(ads) + xH2O(sol) (5)
where x represents the number of water molecules replaced byone molecule of organic inhibitor. Corrosion inhibition isa surface process based on the adsorption of organiccompounds on the metal surface.39 The presence of chemicallystable and surface active inhibitor molecules increases theenergy of activation for iron dissolution reaction and leads todiminishing its surface area available for corrosion attack.40
The mechanism of corrosion inhibition can be thusexplained on the basis of adsorption principle41 and the natureof the interaction between the inhibitor and C-steel surface canbe understood using an adsorption isotherm.42 Assuming thatthe gemini surfactants reduce the rate of corrosion processmainly through the increase in the degree of C-steel surfacecoverage (q) by surfactant molecules, the inhibition efficiencycan be considered as a function of q, i.e. q ¼ 10�2 � E%.22
Frumkin, Freundlich, Temkin, Flory–Huggins and Langmuiradsorption isotherms have been attempted for tting theadsorption of molecules of GS2, GS6 and GS10 on C-steelsurface in oileld water. It was found that the Langmuirmodel have showed the best tting where it had the highestvalues of regression factor, r2. Langmuir isotherm is repre-
sented with a relation betweenCqand C according to eqn (6):40,43
C
q¼ 1
Kads
þ C (6)
where Kads is the adsorption–desorption equilibrium constant.Langmuir isotherm assumes that the solid surface containsa xed number of adsorption sites and each site holds oneadsorbed species22 and there are no interactions between theadsorbed molecules on the metal surface.40 Langmuir plot isdrawn based on the data obtained from weight loss, EIS andpolarization techniques (Fig. 6) and the change in free energy ofadsorption (DGads) is calculated according to the followingequation:44
DGads ¼ �RT ln(106Kads) (7)
where the factor 106 represents the concentration of watermolecules in the solution (in mg l�1) and R is the universal gasconstant (8.314 J K�1 mol�1). DGads values are depicted in Table6. The value of DGads determines the nature of adsorptionprocess such that: (i) if DGads is less negative than �20 kJ mol�1
This journal is © The Royal Society of Chemistry 2017
the adsorption will be physical (known as physisorption) whichoccurs via electrostatic interactions. (ii) If DGads is more nega-tive than �40 kJ mol�1 the adsorption is chemical (known aschemisorption) where coordinate bonds are formed via electrontransfer from inhibitor molecules to the metal surface. (iii) But, ifthe DGads is between �20 and �40 kJ mol�1 then both types ofadsorption are involved.38 For GS2, GS6 and GS10,DGads values areranging between �20.58 and �30.44 kJ mol�1 which indicate theoccurrence of both physisorption and chemisorption processes
RSC Adv., 2017, 7, 47335–47352 | 47343
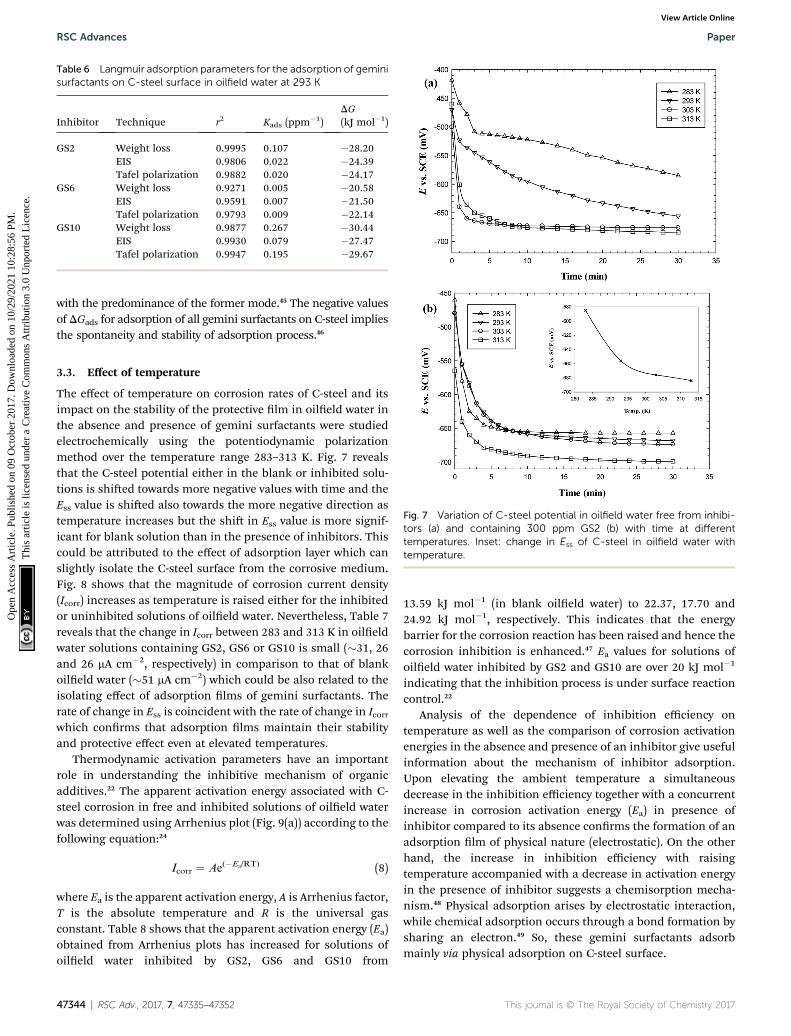
Table 6 Langmuir adsorption parameters for the adsorption of geminisurfactants on C-steel surface in oilfield water at 293 K
Inhibitor Technique r2 Kads (ppm�1)
DG(kJ mol�1)
GS2 Weight loss 0.9995 0.107 �28.20EIS 0.9806 0.022 �24.39Tafel polarization 0.9882 0.020 �24.17
GS6 Weight loss 0.9271 0.005 �20.58EIS 0.9591 0.007 �21.50Tafel polarization 0.9793 0.009 �22.14
GS10 Weight loss 0.9877 0.267 �30.44EIS 0.9930 0.079 �27.47Tafel polarization 0.9947 0.195 �29.67
RSC Advances Paper
Ope
n A
cces
s A
rtic
le. P
ublis
hed
on 0
9 O
ctob
er 2
017.
Dow
nloa
ded
on 1
0/29
/202
1 10
:28:
56 P
M.
Thi
s ar
ticle
is li
cens
ed u
nder
a C
reat
ive
Com
mon
s A
ttrib
utio
n 3.
0 U
npor
ted
Lic
ence
.View Article Online
with the predominance of the former mode.45 The negative valuesof DGads for adsorption of all gemini surfactants on C-steel impliesthe spontaneity and stability of adsorption process.46
Fig. 7 Variation of C-steel potential in oilfield water free from inhibi-tors (a) and containing 300 ppm GS2 (b) with time at differenttemperatures. Inset: change in Ess of C-steel in oilfield water withtemperature.
3.3. Effect of temperature
The effect of temperature on corrosion rates of C-steel and itsimpact on the stability of the protective lm in oileld water inthe absence and presence of gemini surfactants were studiedelectrochemically using the potentiodynamic polarizationmethod over the temperature range 283–313 K. Fig. 7 revealsthat the C-steel potential either in the blank or inhibited solu-tions is shied towards more negative values with time and theEss value is shied also towards the more negative direction astemperature increases but the shi in Ess value is more signif-icant for blank solution than in the presence of inhibitors. Thiscould be attributed to the effect of adsorption layer which canslightly isolate the C-steel surface from the corrosive medium.Fig. 8 shows that the magnitude of corrosion current density(Icorr) increases as temperature is raised either for the inhibitedor uninhibited solutions of oileld water. Nevertheless, Table 7reveals that the change in Icorr between 283 and 313 K in oileldwater solutions containing GS2, GS6 or GS10 is small (�31, 26and 26 mA cm�2, respectively) in comparison to that of blankoileld water (�51 mA cm�2) which could be also related to theisolating effect of adsorption lms of gemini surfactants. Therate of change in Ess is coincident with the rate of change in Icorrwhich conrms that adsorption lms maintain their stabilityand protective effect even at elevated temperatures.
Thermodynamic activation parameters have an importantrole in understanding the inhibitive mechanism of organicadditives.22 The apparent activation energy associated with C-steel corrosion in free and inhibited solutions of oileld waterwas determined using Arrhenius plot (Fig. 9(a)) according to thefollowing equation:24
Icorr ¼ Ae(�Ea/RT) (8)
where Ea is the apparent activation energy, A is Arrhenius factor,T is the absolute temperature and R is the universal gasconstant. Table 8 shows that the apparent activation energy (Ea)obtained from Arrhenius plots has increased for solutions ofoileld water inhibited by GS2, GS6 and GS10 from
47344 | RSC Adv., 2017, 7, 47335–47352
13.59 kJ mol�1 (in blank oileld water) to 22.37, 17.70 and24.92 kJ mol�1, respectively. This indicates that the energybarrier for the corrosion reaction has been raised and hence thecorrosion inhibition is enhanced.47 Ea values for solutions ofoileld water inhibited by GS2 and GS10 are over 20 kJ mol�1
indicating that the inhibition process is under surface reactioncontrol.22
Analysis of the dependence of inhibition efficiency ontemperature as well as the comparison of corrosion activationenergies in the absence and presence of an inhibitor give usefulinformation about the mechanism of inhibitor adsorption.Upon elevating the ambient temperature a simultaneousdecrease in the inhibition efficiency together with a concurrentincrease in corrosion activation energy (Ea) in presence ofinhibitor compared to its absence conrms the formation of anadsorption lm of physical nature (electrostatic). On the otherhand, the increase in inhibition efficiency with raisingtemperature accompanied with a decrease in activation energyin the presence of inhibitor suggests a chemisorption mecha-nism.48 Physical adsorption arises by electrostatic interaction,while chemical adsorption occurs through a bond formation bysharing an electron.49 So, these gemini surfactants adsorbmainly via physical adsorption on C-steel surface.
This journal is © The Royal Society of Chemistry 2017

Fig. 9 Arrhenius plot (a) and transition state plot (b) for carbon steel inoilfield water in absence and presence of GS2, GS6 and GS10.
Table 7 Corrosion kinetic parameters for carbon steel in oilfield waterin absence and presence of 300 ppm of each gemini surfactant asa function of temperature
InhibitorTemperature(K)
Icorr(mA cm�2)
Ecorr(V)
ba(V dec.�1)
bc(V dec.�1) Ep%
Blank 283 63.58 �0.793 0.239 �0.132 —293 95.37 �0.824 0.185 �0.107 —303 101.05 �0.825 0.135 �0.121 —313 114.70 �0.827 0.057 �0.569 —
GS2 283 20.00 �0.813 0.158 �0.139 68.54293 31.34 �0.842 0.129 �0.099 67.14303 38.78 �0.831 0.128 �0.096 61.62313 51.09 �0.847 0.171 �0.112 54.20
GS6 283 23.51 �0.811 0.139 �0.109 63.02293 35.31 �0.890 0.108 �0.070 62.98303 42.11 �0.848 0.153 �0.102 58.33313 49.12 �0.815 0.079 �0.082 57.17
GS10 283 14.71 �0.809 0.131 �0.117 76.87293 24.34 �0.822 0.169 �0.128 74.47303 34.27 �0.806 0.174 �0.134 66.09313 40.24 �0.802 0.169 �0.141 64.91
Fig. 8 Polarization curves for carbon steel in oilfield water free (a) andcontaining 300 ppm GS2 (b) at different temperatures.
Paper RSC Advances
Ope
n A
cces
s A
rtic
le. P
ublis
hed
on 0
9 O
ctob
er 2
017.
Dow
nloa
ded
on 1
0/29
/202
1 10
:28:
56 P
M.
Thi
s ar
ticle
is li
cens
ed u
nder
a C
reat
ive
Com
mon
s A
ttrib
utio
n 3.
0 U
npor
ted
Lic
ence
.View Article Online
Thermodynamic parameters of activation, enthalpy change(DH*) and entropy change (DS*), were calculated from eqn (9)
using log�IcorrT
�vs: T plot (Fig. 9(b)) where its slope equals
This journal is © The Royal Society of Chemistry 2017
�DH*
2:303Rand its intercept represents
log
RNAh
þ DS*
2:303R
!where
h is Planck's constant (6.626 � 10�34 J s), NA is Avogadro'snumber (6.022 � 1023 mol�1), R is the general gas constant(8.314 J K�1 mol�1).24
log
�Icorr
T
�¼ log
R
NAh� DH*
2:303RTþ DS*
2:303R(9)
The DH* values of activation for the dissolution reaction ofC-steel surface in oileld water in the presence of GS2, GS6 andGS10 are high (19.89, 15.22 and 22.44 kJ mol�1, respectively) incomparison to that in absence of inhibitors (11.12 kJ mol�1).The positive signs of DH* reect the endothermic nature of C-steel dissolution activated process which suggests the slow
RSC Adv., 2017, 7, 47335–47352 | 47345

Table 8 Activation parameters for carbon steel in oilfield water inabsence and presence of 300 ppm GS2, GS6 and GS10
Inhibitor Ea (kJ mol�1) r2DH*(kJ mol�1)
DS*(J mol�1 K�1) r2
Blank 13.59 0.8731 11.12 �170.01 0.8198GS2 22.37 0.9813 19.89 �148.93 0.9760GS6 17.70 0.9529 15.22 �163.94 0.9363GS10 24.92 0.9626 22.44 �142.29 0.9753
RSC Advances Paper
Ope
n A
cces
s A
rtic
le. P
ublis
hed
on 0
9 O
ctob
er 2
017.
Dow
nloa
ded
on 1
0/29
/202
1 10
:28:
56 P
M.
Thi
s ar
ticle
is li
cens
ed u
nder
a C
reat
ive
Com
mon
s A
ttrib
utio
n 3.
0 U
npor
ted
Lic
ence
.View Article Online
dissolution of C-steel surface in presence of inhibitors.38 Largeand negative values of DS* show that the activated complex inthe rate determining step represents an association rather thana dissociation step, meaning that a decrease in disordering orrandomness takes place on going from reactants to the acti-vated complex (molecules are in higher ordered state in theactivated complex than in the initial state).22 Comparing theentropy of activation in both inhibited and uninhibited oileldwater reveals that the values ofDS* are less negative in solutionscontaining GS2, GS6 and GS10 (�148.93,�163.94 and�142.29 Jmol�1 K�1, respectively) than for uninhibited solution (�170.01J mol�1 K�1). The thermodynamic values obtained for DS* arethe algebraic sum of the adsorption of inhibitor molecules(solute) and desorption of water molecules (solvent). Hence, theincrease in entropy of activation in presence of gemini surfac-tants is attributed to the increase in the solvent (H2O) entropy asa result of H2O molecules desorbed from C-steel surface.38
3.4. Effect of immersion time
It is of prime importance to study the effect of immersion timeon corrosion inhibition to examine the stability of the inhibitorlm with time. Weight loss method was employed to evaluatethe effect of immersion time on the corrosion rate of C-steel upto four weeks. Fig. 10 shows that oileld water (free frominhibitor) leads to severe corrosion for C-steel with a corrosionrate being continuously increased during the rst two weeks.Aer that, the corrosion rate drops suddenly till the end of thethird week and eventually becomes nearly constant. For C-steelcoupons immersed in oileld water inhibited by any of the threetested gemini surfactants, the corrosion rate continues to
Fig. 10 Effect of immersion time on corrosion rate of carbon steelrecorded at room temperature.
47346 | RSC Adv., 2017, 7, 47335–47352
decrease with time. These results indicate that in blank oileldwater, the continuous increase in corrosion rate during theinitial days of immersion could be due to the dissolution of theair-oxide lm formed before immersion. In the meantime, theprevailing corrosive species aggressively attack the C-steel andcorrosion products (Fe oxides and salts) accumulate on itssurface with time forming a somewhat protective lm whichslightly isolates the C-steel surface from the medium.33 Aerlonger immersion time, the amount of corrosion productsbecomes so much that the aggressive species can hardly attackthe metal surface. So, the corrosion process continues but witha decreasing rate. For solutions of oileld water inhibited bygemini surfactants, the corrosion rate was found to be contin-uously decreasing with time due to the inhibitive contributionbetween adsorption lm and corrosion products. With pro-longing immersion time, more surfactant molecules come inthe vicinity of C-steel surface and adsorb on it until the surfaceis covered with surfactant molecules to its maximum value.Aer that, surfactant molecules can form multilayers over thesurface leading to more enhanced adsorption lm and thecorrosion process becomes more inhibited.50
3.5. Inhibition mechanism
It is important to determine the potential of zero charge (pzc) ofC-steel in oileld water to know the charge of steel surface andhence we can explain the adsorption mechanism of geminisurfactants.32 Values of pzc for the blank and all inhibited
Fig. 11 Variation of the capacitance as a function of potential appliedon carbon steel in oilfield water in the absence and presence of geminisurfactants at 293 K.
This journal is © The Royal Society of Chemistry 2017

Table 9 Comparison between Ess and pzc
InhibitorEss vs.SCE (mV)
pzc vs.SCE (mV)
Blank �656 �737GS2 �670 �760GS6 �656 �738GS10 �645 �739
Fig. 12 Adsorption modes of GS2, GS6 and GS10.
Fig. 14 HOMO (a) and LUMO (b) distributions in GS6 molecule.
Paper RSC Advances
Ope
n A
cces
s A
rtic
le. P
ublis
hed
on 0
9 O
ctob
er 2
017.
Dow
nloa
ded
on 1
0/29
/202
1 10
:28:
56 P
M.
Thi
s ar
ticle
is li
cens
ed u
nder
a C
reat
ive
Com
mon
s A
ttrib
utio
n 3.
0 U
npor
ted
Lic
ence
.View Article Online
oileld water solutions were calculated from Fig. 11. Table 9reveals that all pzc values are more negative than their corre-sponding steady state (Ess) values. This means that the C-steelsurface either in the blank or inhibited solutions is positivelycharged at the open-circuit conditions. This observation can beexplained such that steels or iron corrode when Fe atomsdecompose from their surfaces into positive ions and electrons;Fe ¼ Fe2+ + 2e leaving the surface positively charged. In natu-rally aerated neutral solutions, the released electrons are
Fig. 13 HOMO (a) and LUMO (b) distributions in GS2 molecule.
This journal is © The Royal Society of Chemistry 2017
involved in oxygen reduction; H2O + 12O2 + 2e ¼ 2OH�.22 Table 2
shows that the corrosive medium under study is slightly acidic(pH ¼ 6.85 at 25 �C) so the possible cathodic reactions areoxygen reduction and hydrogen evolution; 2H+ + 2e ¼ H2.35
Since the C-steel is positively charged either in inhibited oruninhibited oileld water, the inhibitor molecules can beadsorbed on the metal/solution interface by one or more of thefollowing ways 38: (i) donor–acceptor interactions between thep-electrons of aromatic imidazolium ring and vacant d-orbitalsof iron surface atoms. (ii) Unshared electron pairs of tertiaryimidazolium N atoms and vacant d-orbitals of iron surfaceatoms. (iii) Interaction of d-electrons of iron surface atoms andthe positive charge delocalized over the imidazolium ring.Gemini surfactants may also adsorb on positively charged C-steel surface in a manner that anions (e.g. Cl�, Br� andHCO3
�) adsorb directly on C-steel surface then molecules ofcationic gemini surfactants adsorb on the anionic layer.35
According to Heakal and Elkholy,15 research works that havestudied the effect of spacer revealed two contradictory opinions:(i) the inhibition efficiency decreases with increasing the lengthof spacer chain. This behavior has been explained such that theincrease in the number of methylene units in the spacer chainleads to an increase in the molecule exibility. This hinders the
RSC Adv., 2017, 7, 47335–47352 | 47347

Fig. 15 HOMO (a) and LUMO (b) distributions in GS10 molecule.
RSC Advances Paper
Ope
n A
cces
s A
rtic
le. P
ublis
hed
on 0
9 O
ctob
er 2
017.
Dow
nloa
ded
on 1
0/29
/202
1 10
:28:
56 P
M.
Thi
s ar
ticle
is li
cens
ed u
nder
a C
reat
ive
Com
mon
s A
ttrib
utio
n 3.
0 U
npor
ted
Lic
ence
.View Article Online
adsorption of the gemini surfactant on metal surface and thusthe inhibition efficiency decreases. (ii) The inhibition efficiencyincreases as the length of spacer chain is increased. This can be
Table 10 Quantum chemical parameters calculated for GS2, GS6 and G
Molecule EHOMO (eV) ELUMO (eV) DE
GS2 �8.357 �1.071 7.286GS6 �8.134 �0.721 7.413GS10 �8.234 �1.453 6.781
Fig. 16 SEM micrographs and EDX images for: (a) abraded C-steel surfa
47348 | RSC Adv., 2017, 7, 47335–47352
explained assuming that lengthening the spacer chainincreases the degree of surface coverage and also the averagearea occupied by each adsorbed molecule. Hence, the inhibi-tion efficiency increases. Both phenomena have been observedin our study for the three gemini surfactants having the sameterminal chain length (dodecyl group) and differing in thespacer length (2, 6 and 10 methylene groups). Data obtainedfrom electrochemical and chemical measurements conrm thatGS10 > GS2 > GS6 in inhibition efficiency as well as their criticalconcentrations follows the trend: GS10 < GS2 < GS6, i.e.150 ppm, 200 ppm and 300 ppm, respectively. In other words,GS10 demonstrates higher efficiency at lower concentrationthan GS2 which, in turn, shows also higher efficiency at lowerconcentration than GS6. This behavior can be elucidated asfollows (Fig. 12):
(1) For the gemini surfactant of shortest spacer (GS2), the veryshort spacer allows the terminal chains to be very close to eachother. So, there is a degree of attraction forces between adjacentchains in the samemolecule and between neighboringmoleculesby hydrophobic interaction.51 This leads to the presence of arraysof stacked molecules which represent a barrier against corrosivemolecules to penetrate to C-steel surface (Fig. 12(a)).
(2) On the other hand, GS6 has a longer spacer and itsterminal chains are far away from each other so there are weak
S10
I (eV) A (eV) c (eV) h (eV) m (Debye)
8.357 1.071 4.714 3.643 5.9468.134 0.721 4.428 3.707 14.5968.234 1.453 4.844 3.391 30.551
ce, (b) surface of C-steel immersed in a solution of oilfield water.
This journal is © The Royal Society of Chemistry 2017

Paper RSC Advances
Ope
n A
cces
s A
rtic
le. P
ublis
hed
on 0
9 O
ctob
er 2
017.
Dow
nloa
ded
on 1
0/29
/202
1 10
:28:
56 P
M.
Thi
s ar
ticle
is li
cens
ed u
nder
a C
reat
ive
Com
mon
s A
ttrib
utio
n 3.
0 U
npor
ted
Lic
ence
.View Article Online
hydrophobic interactions between the terminal chains. Inaddition, a specic region on C-steel surface can be covered bya number of GS6 less than GS2. In this case there may be voidsor weak regions through which corrosive species can attack C-steel surface (Fig. 12(b)).
Unlike GS2 and GS6 whom molecules are predicted toadsorb on C-steel via vertical orientation, GS10 molecules areexpected to adsorb on C-steel surface via lateral interactions dueto the absence of hydrophobic interactions between terminalchains. So, both terminal chains in GS10 molecule can extendover C-steel surface instead of being extended in the solution(Fig. 12(c)). Moreover, this mode of interaction allows moreGS10 molecules to overlay on each other forming multilayers.So, GS10 forms a tough barrier against corrosive species.
A conclusion can be gained from these observations that veryshort and very long spacer-gemini surfactants are more efficientthan those of intermediate spacers. This assumption compro-mises between the previously mentioned contradictoryphenomena concerning the effect of spacer length on thecorrosion inhibition efficiency.
Fig. 17 SEM micrographs and EDX images for surface of C-steel imme300 ppm GS6 and (c) 300 ppm GS10.
This journal is © The Royal Society of Chemistry 2017
3.6. Quantum chemical calculations
In an attempt to undergo a correlation between computationalchemical calculations and experimental measurements, thequantum chemical parameters are calculated and discussed. Alloptimization calculations were done using VAMP module inMaterials Studio 6.0 soware from Accelrys Inc. The ParametricMethod (PM3), a semi-empirical method was employed toobtain quantum chemical parameters and to optimize themolecule geometry.52 As it can be seen in Fig. 13–15, bothHOMO and LUMO regions are focused on imidazolium ringswhere in each molecule; HOMO is localized on one imidazo-lium ring while LUMO is distributed over the other ring. Thisindicates that the imidazolium rings are the active parts inthese gemini surfactants. Low values of the gap energy (DE ¼ELUMO � EHOMO)20 refer to good inhibition efficiencies becausethe energy needed to remove an electron from the HOMO of aninhibitor will be minimized and also it will be easy to donateelectrons for Fe d-orbital. Moreover, ELUMO will be minimumand thus the inhibitor can gain electrons from lled Fe d-
rsed in a solution of oilfield water inhibited by: (a) 300 ppm GS2, (b)
RSC Adv., 2017, 7, 47335–47352 | 47349
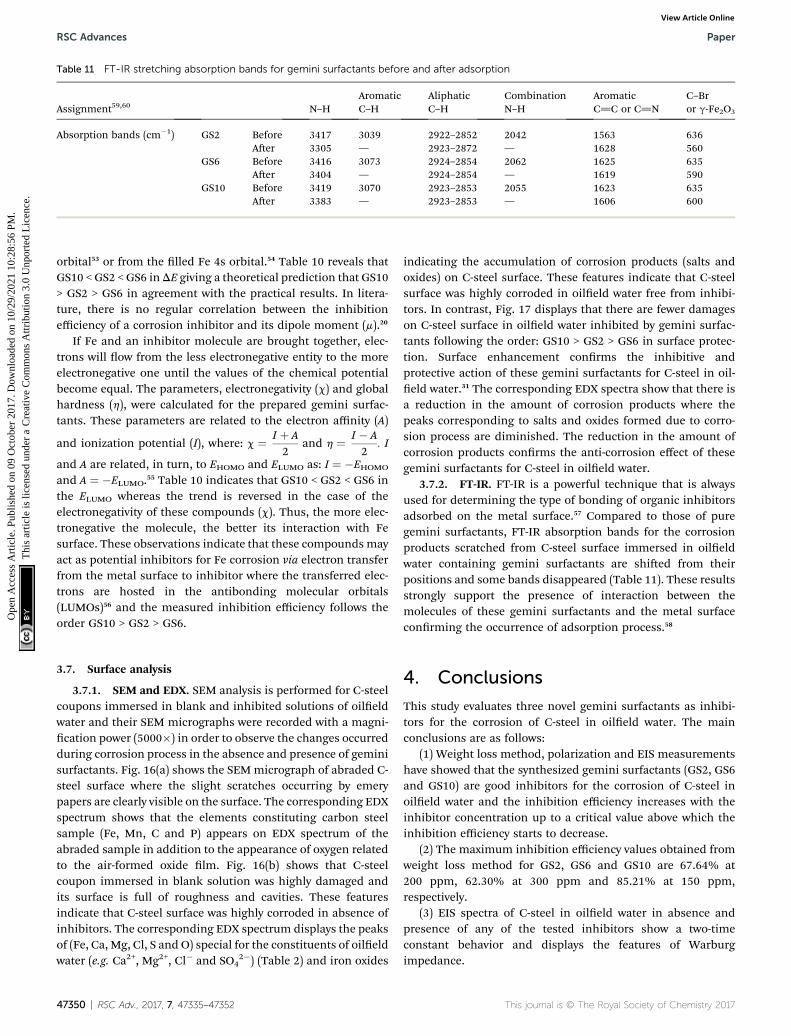
Table 11 FT-IR stretching absorption bands for gemini surfactants before and after adsorption
Assignment59,60 N–HAromaticC–H
AliphaticC–H
CombinationN–H
AromaticC]C or C]N
C–Bror g-Fe2O3
Absorption bands (cm�1) GS2 Before 3417 3039 2922–2852 2042 1563 636Aer 3305 — 2923–2872 — 1628 560
GS6 Before 3416 3073 2924–2854 2062 1625 635Aer 3404 — 2924–2854 — 1619 590
GS10 Before 3419 3070 2923–2853 2055 1623 635Aer 3383 — 2923–2853 — 1606 600
RSC Advances Paper
Ope
n A
cces
s A
rtic
le. P
ublis
hed
on 0
9 O
ctob
er 2
017.
Dow
nloa
ded
on 1
0/29
/202
1 10
:28:
56 P
M.
Thi
s ar
ticle
is li
cens
ed u
nder
a C
reat
ive
Com
mon
s A
ttrib
utio
n 3.
0 U
npor
ted
Lic
ence
.View Article Online
orbital53 or from the lled Fe 4s orbital.54 Table 10 reveals thatGS10 < GS2 < GS6 inDE giving a theoretical prediction that GS10> GS2 > GS6 in agreement with the practical results. In litera-ture, there is no regular correlation between the inhibitionefficiency of a corrosion inhibitor and its dipole moment (m).20
If Fe and an inhibitor molecule are brought together, elec-trons will ow from the less electronegative entity to the moreelectronegative one until the values of the chemical potentialbecome equal. The parameters, electronegativity (c) and globalhardness (h), were calculated for the prepared gemini surfac-tants. These parameters are related to the electron affinity (A)
and ionization potential (I), where: c ¼ I þ A2
and h ¼ I � A2
: I
and A are related, in turn, to EHOMO and ELUMO as: I ¼ �EHOMO
and A ¼ �ELUMO.55 Table 10 indicates that GS10 < GS2 < GS6 inthe ELUMO whereas the trend is reversed in the case of theelectronegativity of these compounds (c). Thus, the more elec-tronegative the molecule, the better its interaction with Fesurface. These observations indicate that these compounds mayact as potential inhibitors for Fe corrosion via electron transferfrom the metal surface to inhibitor where the transferred elec-trons are hosted in the antibonding molecular orbitals(LUMOs)56 and the measured inhibition efficiency follows theorder GS10 > GS2 > GS6.
3.7. Surface analysis
3.7.1. SEM and EDX. SEM analysis is performed for C-steelcoupons immersed in blank and inhibited solutions of oileldwater and their SEM micrographs were recorded with a magni-cation power (5000�) in order to observe the changes occurredduring corrosion process in the absence and presence of geminisurfactants. Fig. 16(a) shows the SEMmicrograph of abraded C-steel surface where the slight scratches occurring by emerypapers are clearly visible on the surface. The corresponding EDXspectrum shows that the elements constituting carbon steelsample (Fe, Mn, C and P) appears on EDX spectrum of theabraded sample in addition to the appearance of oxygen relatedto the air-formed oxide lm. Fig. 16(b) shows that C-steelcoupon immersed in blank solution was highly damaged andits surface is full of roughness and cavities. These featuresindicate that C-steel surface was highly corroded in absence ofinhibitors. The corresponding EDX spectrum displays the peaksof (Fe, Ca, Mg, Cl, S and O) special for the constituents of oileldwater (e.g. Ca2+, Mg2+, Cl� and SO4
2�) (Table 2) and iron oxides
47350 | RSC Adv., 2017, 7, 47335–47352
indicating the accumulation of corrosion products (salts andoxides) on C-steel surface. These features indicate that C-steelsurface was highly corroded in oileld water free from inhibi-tors. In contrast, Fig. 17 displays that there are fewer damageson C-steel surface in oileld water inhibited by gemini surfac-tants following the order: GS10 > GS2 > GS6 in surface protec-tion. Surface enhancement conrms the inhibitive andprotective action of these gemini surfactants for C-steel in oil-eld water.31 The corresponding EDX spectra show that there isa reduction in the amount of corrosion products where thepeaks corresponding to salts and oxides formed due to corro-sion process are diminished. The reduction in the amount ofcorrosion products conrms the anti-corrosion effect of thesegemini surfactants for C-steel in oileld water.
3.7.2. FT-IR. FT-IR is a powerful technique that is alwaysused for determining the type of bonding of organic inhibitorsadsorbed on the metal surface.57 Compared to those of puregemini surfactants, FT-IR absorption bands for the corrosionproducts scratched from C-steel surface immersed in oileldwater containing gemini surfactants are shied from theirpositions and some bands disappeared (Table 11). These resultsstrongly support the presence of interaction between themolecules of these gemini surfactants and the metal surfaceconrming the occurrence of adsorption process.58
4. Conclusions
This study evaluates three novel gemini surfactants as inhibi-tors for the corrosion of C-steel in oileld water. The mainconclusions are as follows:
(1) Weight loss method, polarization and EIS measurementshave showed that the synthesized gemini surfactants (GS2, GS6and GS10) are good inhibitors for the corrosion of C-steel inoileld water and the inhibition efficiency increases with theinhibitor concentration up to a critical value above which theinhibition efficiency starts to decrease.
(2) The maximum inhibition efficiency values obtained fromweight loss method for GS2, GS6 and GS10 are 67.64% at200 ppm, 62.30% at 300 ppm and 85.21% at 150 ppm,respectively.
(3) EIS spectra of C-steel in oileld water in absence andpresence of any of the tested inhibitors show a two-timeconstant behavior and displays the features of Warburgimpedance.
This journal is © The Royal Society of Chemistry 2017

Paper RSC Advances
Ope
n A
cces
s A
rtic
le. P
ublis
hed
on 0
9 O
ctob
er 2
017.
Dow
nloa
ded
on 1
0/29
/202
1 10
:28:
56 P
M.
Thi
s ar
ticle
is li
cens
ed u
nder
a C
reat
ive
Com
mon
s A
ttrib
utio
n 3.
0 U
npor
ted
Lic
ence
.View Article Online
(4) The synthesized gemini compounds act as mixed-typecorrosion inhibitors, retarding both anodic metal dissolutionand cathodic reactions.
(5) The decrease in corrosion rate of C-steel as a function ofeach inhibitor concentration (till its critical value) indicates thatits molecules adsorb on C-steel surface.
(6) Adsorption of molecules of each gemini surfactant isdescribed according to Langmuir isotherm. Both physisorptionand chemisorption processes are present but the former ispredominant.
(7) Thermodynamic parameters calculated from polarizationmeasurements indicate that the presence of these inhibitorsincreases the activation energy and these compounds arespontaneously adsorbed on C-steel surface mainly via phys-isorption mechanism.
(8) Surface analyses (SEM, EDX and FT-IR) conrm theadsorption of these inhibitors on C-steel surface.
Conflicts of interest
There are no conicts to declare.
References
1 M. Deyab and S. Keera, Egypt. J. Pet., 2012, 21, 31–36.2 M. A. Migahed, M. M. Attya, S. M. Rashwan, M. Abd El-Raoufand A. M. Al-Sabagh, Egypt. J. Pet., 2013, 22, 149–160.
3 M. A. Deyab, Desalination, 2016, 384, 60–67.4 P. Boschee, Soc. Petrol. Eng. J., 2012, 1, 22–26.5 M. A. M. Deyab, J. Surfactants Deterg., 2015, 18, 405–411.6 D. Lopez, S. Simison and S. De Sanchez, Corros. Sci., 2005, 47,735–755.
7 M. Bobina, A. Kellenberger, J.-P. Millet, C. Muntean andN. Vaszilcsin, Corros. Sci., 2013, 69, 389–395.
8 M. Deyab, RSC Adv., 2015, 5, 41365–41371.9 M. Deyab, J. Taiwan Inst. Chem. Eng., 2016, 60, 369–375.10 M. Prabakaran, S.-H. Kim, V. Hemapriya, M. Gopiraman,
I. S. Kim and I.-M. Chung, RSC Adv., 2016, 6, 57144–57153.11 M. V. Fiori-Bimbi, P. E. Alvarez, H. Vaca and C. A. Gervasi,
Corros. Sci., 2015, 92, 192–199.12 L. Fragoza-Mar, O. Olivares-Xometl, M. A. Domınguez-
Aguilar, E. A. Flores, P. Arellanes-Lozada and F. Jimenez-Cruz, Corros. Sci., 2012, 61, 171–184.
13 P. Brown, T. Alan Hatton and J. Eastoe, Curr. Opin. ColloidInterface Sci., 2015, 20, 140–150.
14 M. A. Amin, M. A. Ahmed, H. A. Arida, F. Kandemirli,M. Saracoglu, T. Arslan and M. A. Basaran, Corros. Sci.,2011, 53, 1895–1909.
15 F. El-Taib Heakal and A. E. Elkholy, J. Mol. Liq., 2017, 230,395–407.
16 R. Zana and J. Xia, Gemini surfactants: synthesis, interfacialand solution-phase behavior, and applications, MarcelDekker, New York, 2003.
17 F. El-Taib Heakal, M. M. Osman, M. A. Deyab andA. E. Elkholy, Z. Phys. Chem., 2017, 231, DOI: 10.1515/zpch-2017-0949.
This journal is © The Royal Society of Chemistry 2017
18 M. Deyab, M. Osman, A. Elkholy and F. El-Taib Heakal, RSCAdv., 2017, 7, 45241–45251.
19 M. Deyab, K. Eddahaoui, R. Essehli, T. Rhad,S. Benmokhtar and G. Mele, Desalination, 2016, 383, 38–45.
20 H. M. Abd El-Lateef, M. A. Abo-Riya and A. H. Tantawy,Corros. Sci., 2016, 108, 94–110.
21 J. M. Zhao, H. B. Duan and R. J. Jiang, Corros. Sci., 2015, 91,108–119.
22 F. El-Taib Heakal, A. S. Fouda and M. S. Radwan, Mater.Chem. Phys., 2011, 125, 26–36.
23 M. A. Amin, S. S. A. El-Rehim, E. El-Sherbini andR. S. Bayoumi, Electrochim. Acta, 2007, 52, 3588–3600.
24 M. A. Deyab and S. S. A. El-Rehim, J. Taiwan Inst. Chem. Eng.,2014, 45, 1065–1072.
25 F. Ivusic, O. Lahodny-Sarc, H. O. Curkovic and V. Alar,Corros. Sci., 2015, 98, 88–97.
26 Q. Deng, H.-W. Shi, N.-N. Ding, B.-Q. Chen, X.-P. He, G. Liu,Y. Tang, Y.-T. Long and G.-R. Chen, Corros. Sci., 2012, 57,220–227.
27 F. El-Taib Heakal and S. Haruyama, Corros. Sci., 1980, 20,887–898.
28 A. El Bribri, M. Tabyaoui, B. Tabyaoui, H. El Attari andF. Bentiss, Mater. Chem. Phys., 2013, 141, 240–247.
29 A. M. Awad, O. S. Shehata and F. El-Taib Heakal, Appl. Surf.Sci., 2015, 359, 939–947.
30 A. E. Elkholy, M.Sc. thesis, Cairo University, 2017.31 A. Singh, Y. Lin, E. E. Ebenso, W. Liu, J. Pan and B. Huang, J.
Ind. Eng. Chem., 2015, 24, 219–228.32 H. Bentrah, Y. Rahali and A. Chala, Corros. Sci., 2014, 82,
426–431.33 Q. Qu, Y. He, L. Wang, H. Xu, L. Li, Y. Chen and Z. Ding,
Corros. Sci., 2015, 91, 321–329.34 S. Banerjee, V. Srivastava andM. Singh, Corros. Sci., 2012, 59,
35–41.35 M. Lebrini, F. Robert, H. Vezin and C. Roos, Corros. Sci.,
2010, 52, 3367–3376.36 G. Mu, T. Zhao, M. Liu and T. Gu, Corrosion, 1996, 52, 853–
856.37 X. Jiang, Y. Zheng and W. Ke, Corros. Sci., 2005, 47, 2636–
2658.38 D. K. Yadav, M. Quraishi and B. Maiti, Corros. Sci., 2012, 55,
254–266.39 G. Karthik and M. Sundaravadivelu, Egypt. J. Pet., 2016, 25,
183–191.40 A. Satapathy, G. Gunasekaran, S. Sahoo, K. Amit and
P. Rodrigues, Corros. Sci., 2009, 51, 2848–2856.41 S. K. Shukla and M. Quraishi, J. Appl. Electrochem., 2009, 39,
1517–1523.42 S. M. Tawk and M. F. Zaky, Res. Chem. Intermed., 2015, 41,
8747–8772.43 A. M. Al-Sabagh, N. G. Kandile, N. M. Nasser, M. R. Mishrif
and A. E. El-Tabey, Egypt. J. Pet., 2013, 22, 351–365.44 M. Deyab, R. Essehli and B. El Bali, RSC Adv., 2015, 5, 48868–
48874.45 M. A. Migahed, M. M. Shaban, A. A. Fadda, T. A. Ali and
N. A. Negm, RSC Adv., 2015, 5, 104480–104492.
RSC Adv., 2017, 7, 47335–47352 | 47351

RSC Advances Paper
Ope
n A
cces
s A
rtic
le. P
ublis
hed
on 0
9 O
ctob
er 2
017.
Dow
nloa
ded
on 1
0/29
/202
1 10
:28:
56 P
M.
Thi
s ar
ticle
is li
cens
ed u
nder
a C
reat
ive
Com
mon
s A
ttrib
utio
n 3.
0 U
npor
ted
Lic
ence
.View Article Online
46 N. A. Odewunmi, S. A. Umoren, Z. M. Gasem, S. A. Ganiyuand Q. Muhammad, J. Taiwan Inst. Chem. Eng., 2015, 51,177–185.
47 J. C. da Rocha, J. A. d. C. P. Gomes and E. D'Elia, Corros. Sci.,2010, 52, 2341–2348.
48 M. Hegazy, M. Abdallah and H. Ahmed, Corros. Sci., 2010, 52,2897–2904.
49 D. Dwivedi, K. Lepkova and T. Becker, RSC Adv., 2017, 7,4580–4610.
50 D. Ase, M. Arami and N. M. Mahmoodi, Corros. Sci., 2010,52, 794–800.
51 W. Ansari, J. Aslam and U. Siddiqui, J. Mol. Liq., 2012, 174, 5–10.
52 A. Y. Musa, A. A. H. Kadhum, A. B. Mohamad andM. S. Takriff, Mater. Chem. Phys., 2011, 129, 660–665.
47352 | RSC Adv., 2017, 7, 47335–47352
53 E. Oguzie, C. Enenebeaku, C. Akalezi, S. Okoro, A. Ayuk andE. Ejike, J. Colloid Interface Sci., 2010, 349, 283–292.
54 F. El-Taib Heakal, A. Fouda and S. Zahran, Int. J. Electrochem.Sci., 2015, 10, 1595–1615.
55 F. El-Taib Heakal, S. A. Rizk and A. E. Elkholy, J. Mol. Struct.,2017, DOI: 10.1016/j.molstruc.2017.09.079.
56 F. El-Taib Heakal, S. K. Attia, S. A. Rizk, M. A. Abou Essa andA. E. Elkholy, J. Mol. Struct., 2017, 1147, 714–724.
57 X. Li, S. Deng, H. Fu and T. Li, Electrochim. Acta, 2009, 54,4089–4098.
58 T. Ramde, S. Rossi and C. Zanella, Appl. Surf. Sci., 2014, 307,209–216.
59 B. Stuart, Infrared spectroscopy, Wiley Online Library, 2005.60 L. Chauhan and G. Gunasekaran, Corros. Sci., 2007, 49,
1143–1161.
This journal is © The Royal Society of Chemistry 2017


![Synthesis and characterisation of cationic quaternary ...eprints.brighton.ac.uk/14948/1/art%253A10.1007%252Fs10856-015-5637-6[1].pdf · DELIVERY SYSTEMS Original Research Synthesis](https://img.dokumen.tips/doc/110x75/5e0a8e7b4f1e5d523647bd22/synthesis-and-characterisation-of-cationic-quaternary-253a101007252fs10856-015-5637-61pdf.jpg)


![A cationic water-soluble pillar[5]arene: synthesis and ... · S1 A cationic water-soluble pillar[5]arene: synthesis and host − guest complexation with sodium 1-octanesulfonate Yingjie](https://img.dokumen.tips/doc/110x75/60616c387c76dc33b6079e25/a-cationic-water-soluble-pillar5arene-synthesis-and-s1-a-cationic-water-soluble.jpg)
![A Cationic Water-Soluble Pillar[6]arene: Synthesis, Host ... · A Cationic Water-Soluble Pillar[6]arene: Synthesis, Host–Guest Properties, and Self-Assembly with Amphiphilic Guests](https://img.dokumen.tips/doc/110x75/60616c387c76dc33b6079e27/a-cationic-water-soluble-pillar6arene-synthesis-host-a-cationic-water-soluble.jpg)


