Embed Size (px)
Citation preview
Synchronous and Cogged Fan Belt Performance Assessment
February 2014
Dylan Cutler
Jesse Dean
Jason Acosta
Prepared for the General Services Administration By The National Renewable Energy Laboratory
The Green Proving Ground program leverages GSA’s real estate portfolio to evaluate innovative sustainable building technologies and practices. Findings are used to support the development of GSA performance specifications and inform decision-making within GSA, other federal agencies, and the real estate industry. The program aims to drive innovation in environmental performance in federal buildings and help lead market transformation through deployment of new technologies.
Synchronous and Cogged Belt Evaluation Page i
Disclaimer
This document was prepared as an account of work sponsored by the United States Government. While this document is believed to contain correct information, neither the United States Government nor any agency thereof, nor the National Renewable Energy Laboratory, nor any of their employees, makes any warranty, express or implied, or assumes any legal responsibility for the accuracy, completeness, or usefulness of any information, apparatus, product, or process disclosed, or represents that its use would not infringe privately owned rights. Reference herein to any specific commercial product, process, or service by its trade name, trademark, manufacturer, or otherwise, does not constitute or imply its endorsement, recommendation, or favoring by the United States Government or any agency thereof, or the U.S. Department of Energy’s National Renewable Energy Laboratory. The views and opinions of authors expressed herein do not necessarily state or reflect those of the United States Government or any agency thereof or the National Renewable Energy Laboratory.
The work described in this report was funded by the U.S. General Services Administration [and the Federal Energy Management Program of the U.S. Department of Energy] under Contract No. IAG-11-01815 and Task No. WFK91002.
Acknowledgements
United States General Services Administration (GSA) Region 8: Silas Campbell, Douglas Rothgeb, Jessica Higgins, Andrew Bond, John Marino, and Joseph Baker
National Renewable Energy Laboratory: Peter McNutt
University of Michigan: Heath Hofmann
For more information contact:
Energy and Environment Team Facilities Management and Services Programs Public Buildings Service - Rocky Mountain Region U.S. General Services Administration One Denver Federal Center P.O. Box 25546 (8P2PM) Denver, CO 80225-0546
Phone: (303) 236 - 8000
Synchronous and Cogged Belt Evaluation Page ii
Table of Contents Page
I. Executive Summary ............................................................................................................................ 1
A. Background ................................................................................................................................................ 1
B. Study Design and Objectives ...................................................................................................................... 1
C. Project Results/Findings ............................................................................................................................. 2
D. Conclusions ................................................................................................................................................ 5
II. Background ........................................................................................................................................ 6
A. Assessment................................................................................................................................................. 6
B. Opportunity ................................................................................................................................................ 6
III. Measurement & Verification Project Plan ......................................................................................... 8
A. Technical Objectives ................................................................................................................................... 8
B. Technology Description ............................................................................................................................ 10
C. Demonstration Project Location(s) .......................................................................................................... 11
IV. Measurement & Verification Evaluation Plan ................................................................................. 12
A. Facility Description ................................................................................................................................... 12
B. Technology Specification ......................................................................................................................... 14
C. Technology Deployment .......................................................................................................................... 14
D. Test Plan ................................................................................................................................................... 14
E. Instrumentation Plan ............................................................................................................................... 15
V. Results .............................................................................................................................................. 16
A. VAV Fan Analysis ...................................................................................................................................... 16
B. Economic Analysis .................................................................................................................................... 20
C. Power Factor Analysis .............................................................................................................................. 21
D. Noise Level Analysis ................................................................................................................................. 22
E. CV Fan Analysis ......................................................................................................................................... 23
F. Economic Analysis .................................................................................................................................... 24
G. Power Factor Analysis .............................................................................................................................. 25
H. Maximum Power at Start-Up ................................................................................................................... 26
VI. Conclusions ...................................................................................................................................... 27
A. Overall Technology Assessment at Demonstration Facility ..................................................................... 27
B. Best Practice ............................................................................................................................................. 27
C. Barriers and Enablers to Adoption ........................................................................................................... 28
D. Market Potential within the GSA Portfolio .............................................................................................. 28
Synchronous and Cogged Belt Evaluation Page iii
E. Recommendations for Installation, Commissioning, Training, and Change Management...................... 30
Appendices ................................................................................................................................................ 32
A. Research Details ....................................................................................................................................... 32
B. References ................................................................................................................................................ 33
C. Glossary .................................................................................................................................................... 33
Synchronous and Cogged Belt Evaluation Page 1
I. Executive Summary
A. Background
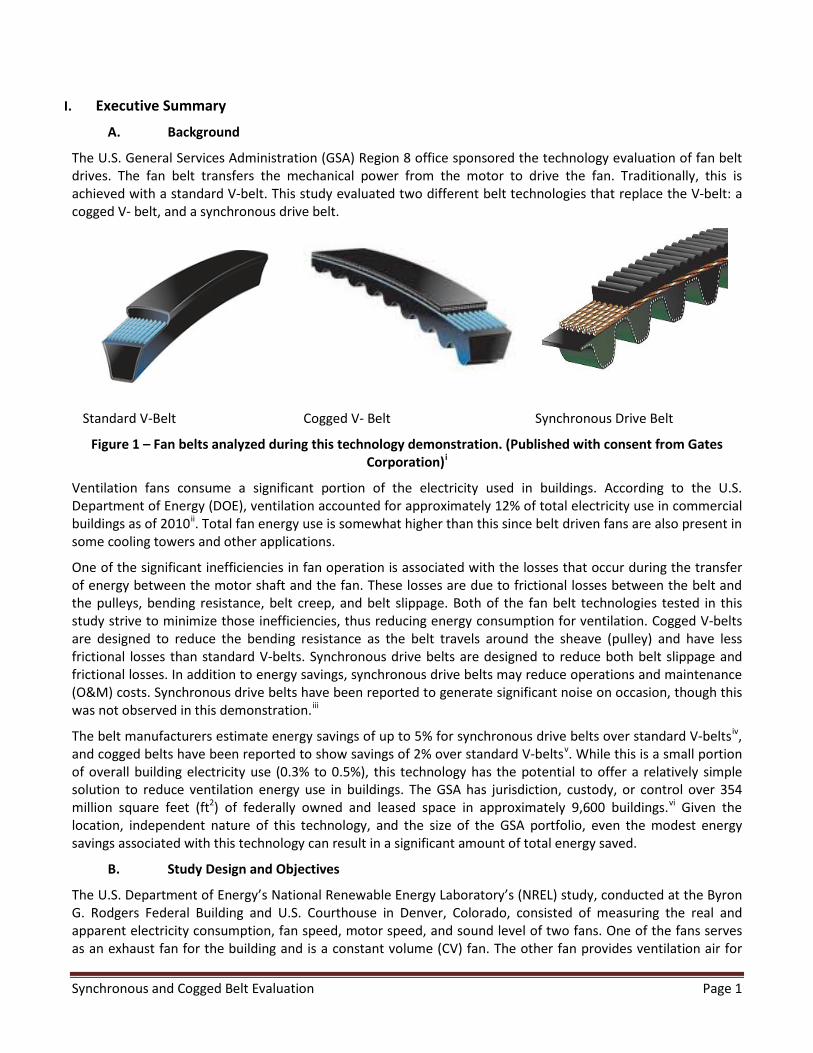
The U.S. General Services Administration (GSA) Region 8 office sponsored the technology evaluation of fan belt drives. The fan belt transfers the mechanical power from the motor to drive the fan. Traditionally, this is achieved with a standard V-belt. This study evaluated two different belt technologies that replace the V-belt: a cogged V- belt, and a synchronous drive belt.
Standard V-Belt Cogged V- Belt Synchronous Drive Belt
Figure 1 – Fan belts analyzed during this technology demonstration. (Published with consent from Gates Corporation)i
Ventilation fans consume a significant portion of the electricity used in buildings. According to the U.S. Department of Energy (DOE), ventilation accounted for approximately 12% of total electricity use in commercial buildings as of 2010ii. Total fan energy use is somewhat higher than this since belt driven fans are also present in some cooling towers and other applications.
One of the significant inefficiencies in fan operation is associated with the losses that occur during the transfer of energy between the motor shaft and the fan. These losses are due to frictional losses between the belt and the pulleys, bending resistance, belt creep, and belt slippage. Both of the fan belt technologies tested in this study strive to minimize those inefficiencies, thus reducing energy consumption for ventilation. Cogged V-belts are designed to reduce the bending resistance as the belt travels around the sheave (pulley) and have less frictional losses than standard V-belts. Synchronous drive belts are designed to reduce both belt slippage and frictional losses. In addition to energy savings, synchronous drive belts may reduce operations and maintenance (O&M) costs. Synchronous drive belts have been reported to generate significant noise on occasion, though this was not observed in this demonstration.iii
The belt manufacturers estimate energy savings of up to 5% for synchronous drive belts over standard V-beltsiv, and cogged belts have been reported to show savings of 2% over standard V-beltsv. While this is a small portion of overall building electricity use (0.3% to 0.5%), this technology has the potential to offer a relatively simple solution to reduce ventilation energy use in buildings. The GSA has jurisdiction, custody, or control over 354 million square feet (ft2) of federally owned and leased space in approximately 9,600 buildings.vi Given the location, independent nature of this technology, and the size of the GSA portfolio, even the modest energy savings associated with this technology can result in a significant amount of total energy saved.
B. Study Design and Objectives
The U.S. Department of Energy’s National Renewable Energy Laboratory’s (NREL) study, conducted at the Byron G. Rodgers Federal Building and U.S. Courthouse in Denver, Colorado, consisted of measuring the real and apparent electricity consumption, fan speed, motor speed, and sound level of two fans. One of the fans serves as an exhaust fan for the building and is a constant volume (CV) fan. The other fan provides ventilation air for
Synchronous and Cogged Belt Evaluation Page 2
the parking garage and is a variable air volume (VAV) fan, equipped with a variable frequency drive (VFD). Both fans are served by 3-phase, 480-volt electricity.
The testing was performed three different times for each fan. For the CV fan, the testing was performed with the existing belts, with the existing belts appropriately tensioned, and with the synchronous drive belts. The VAV fan was tested with the existing V-belts (baseline), with cogged V-belts, and with the synchronous drive belts. The cogged V-belts were not tested on the CV fan due to logistical install issues at the site. All metering was performed with a Fluke Power Logger 1735.
The electrical performance was monitored for each belt placed on the CV fan for a period of 3 to 5 minutes, with data recorded at one second intervals. This captured both the start-up and the steady-state operation of the CV fan. The VFD on the VAV fan was placed into “hand mode” and the frequency was adjusted in increments of 5 hertz (Hz) from 15 to 60 Hz (the maximum) to capture the performance at different fan speeds. Approximately 2 to 3 minutes of metered data was recorded at each frequency, along with fan and motor shaft speed, and ambient noise in the room.
Results of the VAV system are adjusted for the outside weather due to the change in the density of air at different testing periods (variation in temperature, humidity, or barometric pressure). The CV fan exhausts conditioned air, so the results are not adjusted for weather.
C. Project Results/Findings
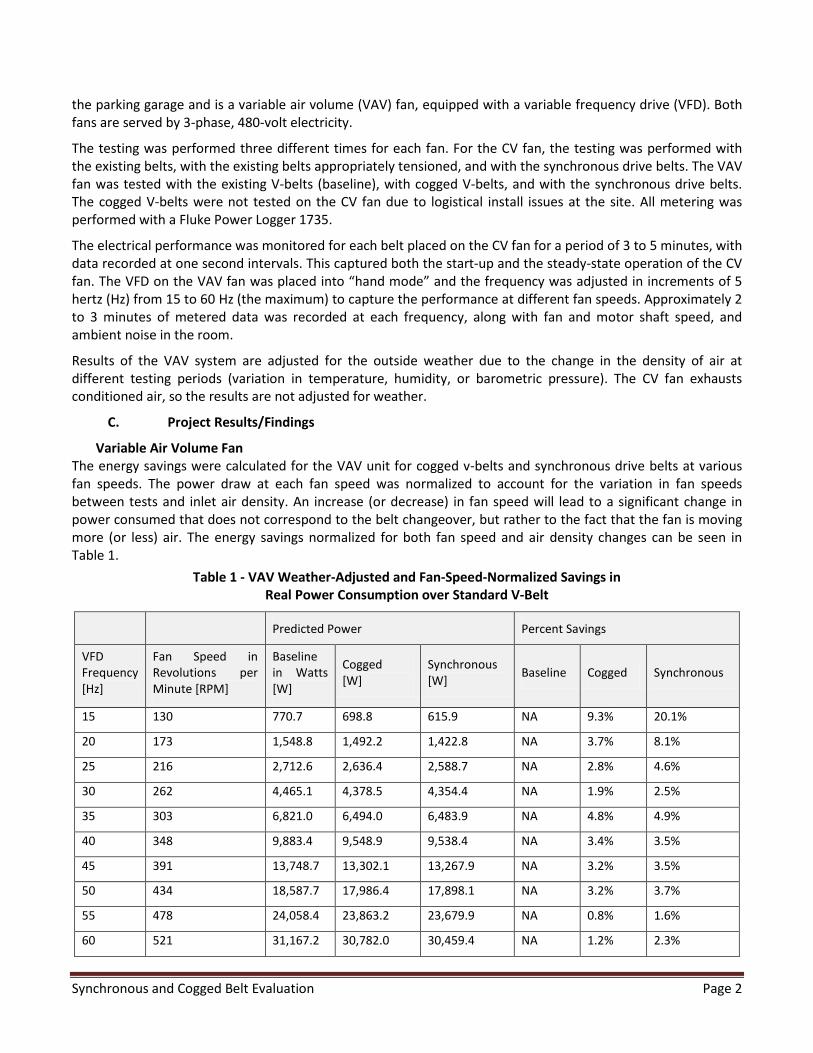
Variable Air Volume Fan The energy savings were calculated for the VAV unit for cogged v-belts and synchronous drive belts at various fan speeds. The power draw at each fan speed was normalized to account for the variation in fan speeds between tests and inlet air density. An increase (or decrease) in fan speed will lead to a significant change in power consumed that does not correspond to the belt changeover, but rather to the fact that the fan is moving more (or less) air. The energy savings normalized for both fan speed and air density changes can be seen in Table 1.
Table 1 - VAV Weather-Adjusted and Fan-Speed-Normalized Savings in Real Power Consumption over Standard V-Belt
Predicted Power Percent Savings
VFD Frequency [Hz]
Fan Speed in Revolutions per Minute [RPM]
Baseline in Watts [W]
Cogged [W]
Synchronous [W] Baseline Cogged Synchronous
15 130 770.7 698.8 615.9 NA 9.3% 20.1%
20 173 1,548.8 1,492.2 1,422.8 NA 3.7% 8.1%
25 216 2,712.6 2,636.4 2,588.7 NA 2.8% 4.6%
30 262 4,465.1 4,378.5 4,354.4 NA 1.9% 2.5%
35 303 6,821.0 6,494.0 6,483.9 NA 4.8% 4.9%
40 348 9,883.4 9,548.9 9,538.4 NA 3.4% 3.5%
45 391 13,748.7 13,302.1 13,267.9 NA 3.2% 3.5%
50 434 18,587.7 17,986.4 17,898.1 NA 3.2% 3.7%
55 478 24,058.4 23,863.2 23,679.9 NA 0.8% 1.6%
60 521 31,167.2 30,782.0 30,459.4 NA 1.2% 2.3%

Synchronous and Cogged Belt Evaluation Page 3
The electricity savings ranged from 1.6% to 20.1% for the synchronous drive belt, and the electricity savings ranged from 0.8% to 9.3% for the cogged belts, with greatest savings at low fan speeds. For the synchronous drive belts retrofit the savings were on the order of 1.6% to 4.6% for the range of VFD frequencies at which most fan systems will operate.
The economics for the VAV system were analyzed on a 25,000 cubic feet per minute (CFM) fan with a 40 horsepower (HP) motor. The VAV fan operates continuously (24 hours-per-day), and ramps up due to high levels of carbon monoxide in the parking garage, which occurs approximately 4 hours per day. The life of the V-belt, the synchronous drive belt, and the cogged V-belt was assumed to be 3 years for the life-cycle analysis. The specific installation will dictate belt lifetime, and belts should be monitored multiple times each year to evaluate appropriate replacement schedules. The blended electric utility rate for the Byron Rogers Courthouse was $0.084/kilowatt-hour (kWh).
The life-cycle analysis is conducted over a 9-year period. Nine years was chosen for the period of analysis because it includes three full life cycles for each belt. The life-cycle cost (LCC) analysis analyzes the total cost of ownership of each belt over the 9-year period, converting future costs to a present value based on the expected inflation rate and electricity escalation rate. Replacement costs are incurred at the beginning of years 4 and 7. The belt with the lowest LCC is economically the best decision for GSA over a 10-year period assuming the rates used in this analysis are consistent with future trends.
The synchronous drive belt upgrade involves a one-time, upfront cost due to the required pulley changeovers. Once the pulleys on the fan and motor are replaced for the synchronous drive belt, they are expected to last throughout many belt replacements. This difference between initial cost and incremental cost was taken into account in all of the economic analyses. Table 2 shows the life-cycle analysis summary. Note that the belt type with lowest LCC, the synchronous drive belt, is economically the best option.
Table 2 - VAV Fan Economic Analysis
Cost V-Belt Cogged V-Belt Synchronous Drive Belt
Initial Costs $379 $419 $1,280
Replacement Costs $379 $419 $372
O&M Costs $92 $92 $23
Energy Costs $4,772 $4,690 $4,608
Life-cycle Costs $37,694 $37,187 $36,809
Constant Volume Fan The CV fan is rated at 12,000 CFM and is operated by a 10 HP motor. The fan operates 11 hours per day, 5 days per week. The installation of the synchronous drive belt in the CV system actually increased power consumption. This was due to the fact that the retrofit increased fan speed. This illustrates the importance of installing a belt and pulley system that accomplishes the desired objectives of the facility. The power consumption was normalized for fan speed and those results are shown in Table 3.

Synchronous and Cogged Belt Evaluation Page 4
Table 3 - CV Fan Average, Normalized Power Consumption
Belt Type Fan Speed (RPM)
Actual Average Power
Consumption (W)
Percent Savings (Normalized, Average Power Consumption)
Loose V-Belt 1161.5 7,107.4 NA
Tensioned V-Belt 1164 7,153.3 0.001%
Synchronous drive belt 1183 7,368.9 1.871%
The two LCC analyses displayed in the tables below show the importance of proper installation. The increase in fan speed caused by the installation of the synchronous drive belt causes an increase in LCC versus the base case. The synchronous drive belt is more efficient than the standard V-belt, yet this efficiency was outweighed by the RPM increase from the installation. If the efficiency gains are used to reduce power consumption, with no increase in fan speed, the synchronous drive belt offers the lowest LCC scenario.
Table 4 – CV Fan Life-cycle Cost Analysis
Cost Loose V-Belt Tensioned
V-Belt Synchronous
Drive Belt
Synchronous Drive Belt (assuming no increase
in fan speed)
Initial Costs $111 $111 $470 $470
Replacement Costs $111 $111 $165 $165
O&M Costs $92 $92 $23 $23
Energy Costs $1,707 $1,719 $1,770 $1,676
Life-Cycle Costs $13,881 $13,964 $14,270 $13,556
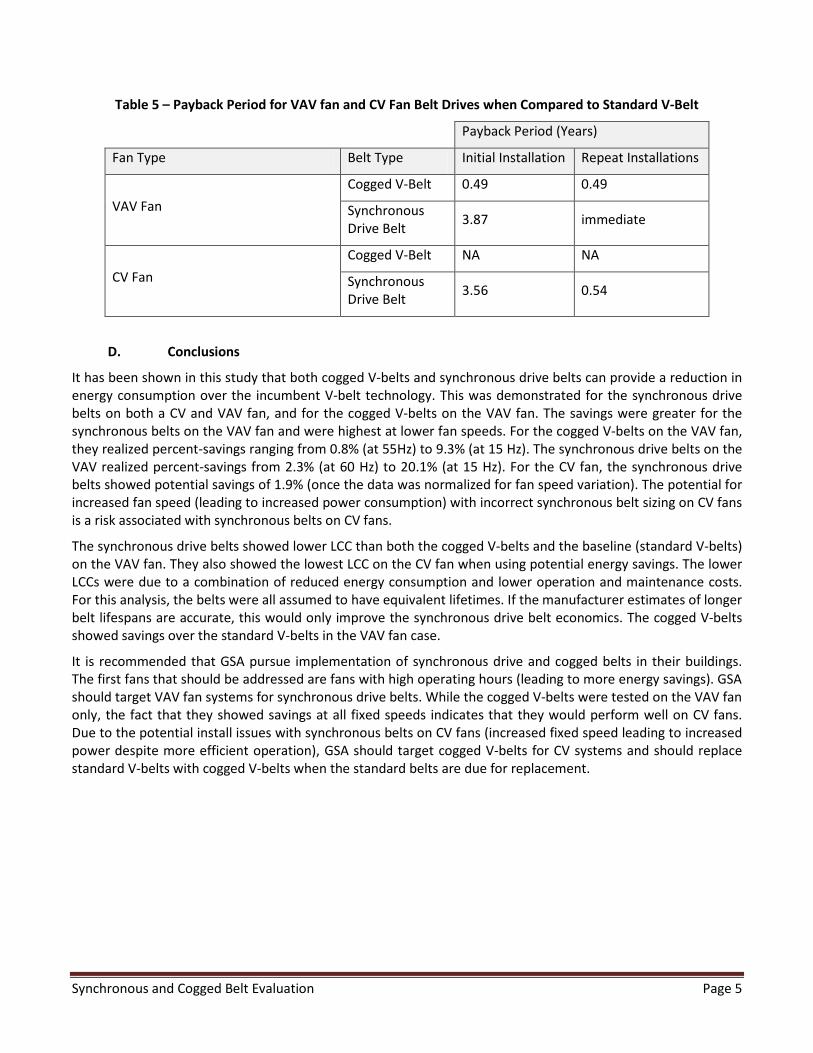
A return on investment was calculated for both the VAV and the CV fans. This was calculated as a simple payback period and these values are included in Table 5. For the synchronous drive belts, it was necessary to calculate both initial installation and repeat installation paybacks. This was due to the increased initial cost required for the pulley changeover. The “immediate” payback for the synchronous drive belt repeat installations on the VAV fan is due to the fact that replacing the single synchronous drive belt has a lower initial cost than replacing all four standard V-belts. This means that there is no initial cost to recoup. This is possible due to the robust materials used in the synchronous drive belt, which allows a single belt to perform the task that previously required four standard V-belts.
Synchronous and Cogged Belt Evaluation Page 5
Table 5 – Payback Period for VAV fan and CV Fan Belt Drives when Compared to Standard V-Belt
Payback Period (Years)
Fan Type Belt Type Initial Installation Repeat Installations
VAV Fan Cogged V-Belt 0.49 0.49
Synchronous Drive Belt 3.87 immediate
CV Fan Cogged V-Belt NA NA
Synchronous Drive Belt 3.56 0.54
D. Conclusions
It has been shown in this study that both cogged V-belts and synchronous drive belts can provide a reduction in energy consumption over the incumbent V-belt technology. This was demonstrated for the synchronous drive belts on both a CV and VAV fan, and for the cogged V-belts on the VAV fan. The savings were greater for the synchronous belts on the VAV fan and were highest at lower fan speeds. For the cogged V-belts on the VAV fan, they realized percent-savings ranging from 0.8% (at 55Hz) to 9.3% (at 15 Hz). The synchronous drive belts on the VAV realized percent-savings from 2.3% (at 60 Hz) to 20.1% (at 15 Hz). For the CV fan, the synchronous drive belts showed potential savings of 1.9% (once the data was normalized for fan speed variation). The potential for increased fan speed (leading to increased power consumption) with incorrect synchronous belt sizing on CV fans is a risk associated with synchronous belts on CV fans.
The synchronous drive belts showed lower LCC than both the cogged V-belts and the baseline (standard V-belts) on the VAV fan. They also showed the lowest LCC on the CV fan when using potential energy savings. The lower LCCs were due to a combination of reduced energy consumption and lower operation and maintenance costs. For this analysis, the belts were all assumed to have equivalent lifetimes. If the manufacturer estimates of longer belt lifespans are accurate, this would only improve the synchronous drive belt economics. The cogged V-belts showed savings over the standard V-belts in the VAV fan case.
It is recommended that GSA pursue implementation of synchronous drive and cogged belts in their buildings. The first fans that should be addressed are fans with high operating hours (leading to more energy savings). GSA should target VAV fan systems for synchronous drive belts. While the cogged V-belts were tested on the VAV fan only, the fact that they showed savings at all fixed speeds indicates that they would perform well on CV fans. Due to the potential install issues with synchronous belts on CV fans (increased fixed speed leading to increased power despite more efficient operation), GSA should target cogged V-belts for CV systems and should replace standard V-belts with cogged V-belts when the standard belts are due for replacement.
Synchronous and Cogged Belt Evaluation Page 6
II. Background
A. Assessment
According to the U.S Department of Energy (DOE), ventilation energy use accounted for approximately 12% of total electricity use in commercial buildings as of 2010. Ventilation systems in commercial buildings are typically driven by centrifugal fans and asynchronous induction motors. The fan belt is the device that transfers the mechanical power from the motor to rotate the fan. Traditionally, this is achieved with a standard V-belt. Standard V-belts can have an efficiency as high as 95-98% at the time of installation. This efficiency can deteriorate as much as 5% during operationvii. This study evaluated two different belt technologies that replace the V-belt: a cogged V-belt, and a synchronous drive belt. These technologies aim to reduce frictional losses, bending resistance, and slippage losses, resulting in a potential increase to the operating efficiency of the fan/motor combination by 2-5%viii. The synchronous drive belt also can limit the degradation of performance over time due its integrated pulley/belt technology.
While the efficiency improvement of fan operation only provides a small reduction in overall building electricity use, this technology has the potential to offer a relatively simple solution to reduce ventilation energy use in buildings. Given the location-independent nature of this technology and the size of the GSA portfolio, even the modest percent savings associated with this technology can result in a significant amount of total energy saved. This report will evaluate the installed performance of the different belt drives to verify the actual savings achieved through belt retrofits.
B. Opportunity
This technology has the opportunity to provide savings in virtually every building under the jurisdiction, custody, or control of the GSA. Ventilation is required by code in almost every building type and ventilation air is often provided by belt-driven fans. Forced air heating and cooling also require fans to distribute the conditioned air. Belt-driven fans are also found in most cooling towers, presenting another opportunity for the technology. The technology is thus building type independent.
The technology is also climate independent. Certain technologies are more applicable for heating- or cooling- dominated climates or for climates with significant solar resources. Cogged V-belts and synchronous drive belts are an applicable technology independent of local climatic influences. The tested technologies have the potential to provide a relatively simple solution for increasing the operating efficiency for fan/motor combinations throughout the GSA portfolio.
The technology currently used in the majority of installations transfers mechanical power from the motor to the fan with a standard V-belt. V-belts depend on the friction between the belt and the pulley to transfer the mechanical power. This can lead to energy losses due to friction (given off as heat) and slippage losses if the belt is not appropriately tensioned.
Cogged V-belts reduce the amount of bending resistance as the belt travels around the sheave by reducing the amount of material on the inside (contact-point) edge of the belt. This allows cogged V-belts to run cooler and attain a higher efficiency. Cogged V-belts can also be used with the exact same pulleys as conventional V-belts. The largest opportunity for cogged V-belts is with small-diameter motor or fan sheaves. Each V-belt has specifications on minimum recommended sheave diameters for operation. If the actual sheave diameters are at or below the minimum recommended diameters, then the cogged V-belt can reduce bending resistance and offer greater potential savings.
Synchronous drive belts are positive drive belts that actually mesh with the pulleys at the motor and fan. Therefore, this technology requires both new belts and new pulleys. The toothed belts synch with the grooves in the pulley (much like a motorcycle drive), which eliminates any slippage losses. They also run much cooler and do not require the frequent re-tensioning that V-belts require.
Synchronous and Cogged Belt Evaluation Page 7
Belt manufacturers estimate energy savings of up to 5% over standard V-belts for synchronous drive belts and smaller savings for cogged V-beltsix. Both the cogged V-belts and the synchronous drive belts are available from a variety of vendors.
Synchronous drive belts offer the largest potential efficiency gains. Yet they are also more application-specific; due to the lack of slippage, high torque startups can cause belt tooth jumping on the pulleys and lead to significant wear on the belts. It is important to size the belts and pulleys appropriately. If the fan is forced to run at a higher speed due to the new belts, it is possible that all efficiency gains will be overshadowed by higher power draw due to the increased revolutions per minute (RPM) dictated by the new belt/pulley system.

Synchronous and Cogged Belt Evaluation Page 8
III. Measurement & Verification Project Plan
A. Technical Objectives
The testing of the fan belts aims to examine the effect of replacing the current V-belts with cogged V-belts or synchronous drive belts on: real power consumption (watts), fan speed, and changes in the power factor of the motors. There are two elements to the power consumption that need to be analyzed separately: the peak startup consumption as the fan ramps up, and the power consumption once the fan has reached near steady-state operation.
The noise generated by the different belts was examined by recording ambient noise levels near the fan. Due to the location of the tested fans, noise in surrounding occupied space was not a concern. Both of the fans were located in a penthouse mechanical room above the elevator shafts. Ambient noise recordings were still taken near the fan to examine the effect of the different belts on noise production. This variation in noise production could be useful information for buildings with fans near occupied spaces.
The three different fan belt drives (regular v-belt, cogged v-belt, and synchronous drive belt) are examined on two different fan types, a variable air volume (VAV) fan and a constant volume (CV) fan. A series of quantitative and qualitative performance objectives were created by NREL to evaluate the performance of the technology.

Synchronous and Cogged Belt Evaluation Page 9
Table 6 - Performance Objectives for Synchronous Belts
Performance Objective Metric Data
Requirements Success Criteria Results
Constant Volume
Results Variable Air
Volume
Quantitative Performance Objectives
Reduce Fan System Energy Use
Electrical power at pre-defined fan speeds
Electrical Power (true kW) > 2% fan power savings
relative to new, tensioned standard v-belt
Fail (as installed) Pass Power quality
(starting current, PF, THD)
Acceptable Increase in Ambient Noise Levels and Surrounding Occupied Space Noise Levels
Ambient noise level in surrounding occupied spaces
Ambient noise level pre and post retrofit (decibel)
Ambient noise level in surrounding occupied space within acceptable range, per ASHRAE requirements pre and post retrofit
No consistent noise increase with cogged or synchronous drive belts over standard V-belts. No surrounding occupied space, which prevents analysis of ASHRAE noise standards.
Cost Effectiveness Life-cycle cost effectiveness
Installation costs relative to standard V-Belt
Exceeds GSA's LCC criteria for energy efficiency projects for motors
Fail (as installed) Pass Electric rates
for GSA facilities in each region
Motor run time
Qualitative Performance Objectives
Reduce Fan Belt Operation and Maintenance Time and Cost
HVAC technician labor time per motor per year
Current O&M protocol for belt driven systems
Reduction in annual O&M costs Neutral Pass Labor hours for
standard v-belt per year and cogged v-belt per year
Belt life
Synchronous and Cogged Belt Evaluation Page 10
Two variables that were important to account for in the analysis were
• Speed of the fan and motor shafts in revolutions per minute (RPM) • Density of the air during the different testing periods.
The fan and motor speed were important to quantify so as to be able to calculate power consumption normalized for flow rate. This is especially important for VAV fans where the variable frequency drives (VFD) will ideally calibrate to a set point (usually pressure); therefore, an increase in RPM at the fixed test frequency would be adjusted for in normal operation and result in equal flow rate delivered to an equal load on the system. In the case of the CV fan it is still important to quantify the RPM-normalized power consumption, while also reiterating the fact that the installation must be carried out to achieve the same RPM post-retrofit (otherwise with a higher RPM in a CV fan, efficiency savings can be overshadowed by increased power consumption due to higher speed and the inability of the fan to ramp down).
The density of the air has an impact on the power consumption of the fan as well. This was recorded for the different test periods and the power data was adjusted using the ratios of the air densities to ensure that the belt changeover was the only variable impacting any observed changes in power consumption.
B. Technology Description
Standard V-belts have several limitations that cogged V-belts and synchronous drive belts aim to overcome. V-belts generate excessive friction when they travel around the motor and fan sheaves. This is due to the belt’s solid design, which inhibits bending and from the large amount of contact surface. The belt’s bending resistance generates extra friction. V-belts also rely on friction to transfer mechanical power, which can lead to slippage (especially if improperly tensioned). This slippage leads to further friction losses and wasted power from the motor shaft.
Cogged V-belts overcome much of the bending resistance by removing some of the material from the belt. This allows for a reduction in the inner diameter of the belt as it travels around the pulleys, reducing the bending resistance. The cogged V-belts still rely on friction to transfer the mechanical energy from the motor and are, in general, very similar to the standard V-belt.
Synchronous drive belts have teeth on the inside of the belt. The shape of these teeth are usually curvilinear in shape (similar to a rounded-over trapezoid), yet the exact shape depends on the specific manufacturer. The belts integrate with specific pulleys that accept the teeth on the belt. This geared interaction between belt and pulley can, if installed properly, greatly reduce slippage and friction. Synchronous drive belts also do not need to be re-tensioned after installation, which can result in operation and maintenance (O&M) savings over cogged V-belts and standard V-belts. The Gates® Poly Chain® GT® Carbon™ synchronous drive belts that were installed at the Byron Rogers Courthouse and monitored for this report are made of carbon fiber, which the manufacture claims provides longer lifetimes for the beltsx.

Synchronous and Cogged Belt Evaluation Page 11
Standard V-Belt Cogged V- Belt Synchronous Drive Belt
Figure 2 – Fan belts analyzed during this technology demonstration (Published with consent from Gates Corporation)xi
The tested belts would fall under a DOE technology readiness level (TRL) 8 or 9.xii They are fully tested and deployed technologies that have seen successful operation. Limited independent testing has been conducted on fan belt drives. A study was conducted by the University of Virginia Facilities Managementxiii on a constant speed, 40 HP HVAC fan that contained 3 fan belts. They found that replacing worn, properly tensioned V-belts with a new V-belt reduced energy demand by 2.9%. Installation of cogged V-belts resulted in additional savings of 3.3% when compared to a new V-Belt and 6.3% when compared to the worn V-belt. The study findings resulted in a simple payback period of 0.5 years. Both the cogged V-belts and the synchronous drive belts are technologies that are available through various manufacturers.
The risks associated with installation of the technology apply mainly to the synchronous belt drives. The belt and pulley for the synchronous drive belt must be properly selected to ensure the desired fan speed is achieved. An unintended increase in the fan speed will increase the power consumption of the motor. An unintended decrease in fan speed will reduce the volumetric flow of the fan and could lead to building performance issues. Having access to the technical expertise to specify and commission the belts is the biggest barrier to entry. Without the proper specification, installation, and commissioning of belts, an undesired change in performance may occur. Cogged V-belts are similar to standard V-belts and the challenges and risks with installation are comparable. Proper belt tension and preventative maintenance will ensure a longer life and good performance of the fan and motor system.
C. Demonstration Project Location(s)
The Byron Rodgers Courthouse in Denver was selected as an installation site for this study. A CV fan and a VAV fan were both necessary for the technology demonstration and the selected facility had both of these in close proximity. The fans are located in a penthouse mechanical room above the elevator shafts.
Synchronous and Cogged Belt Evaluation Page 12
IV. Measurement & Verification Evaluation Plan
A. Facility Description
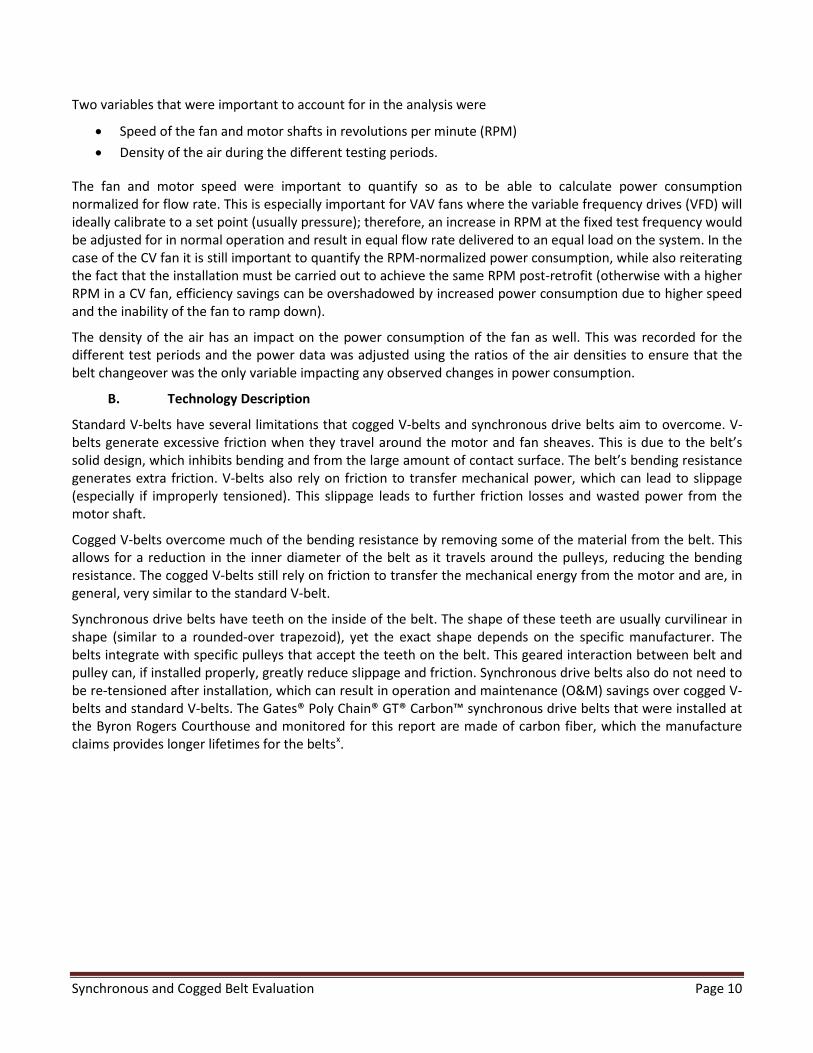
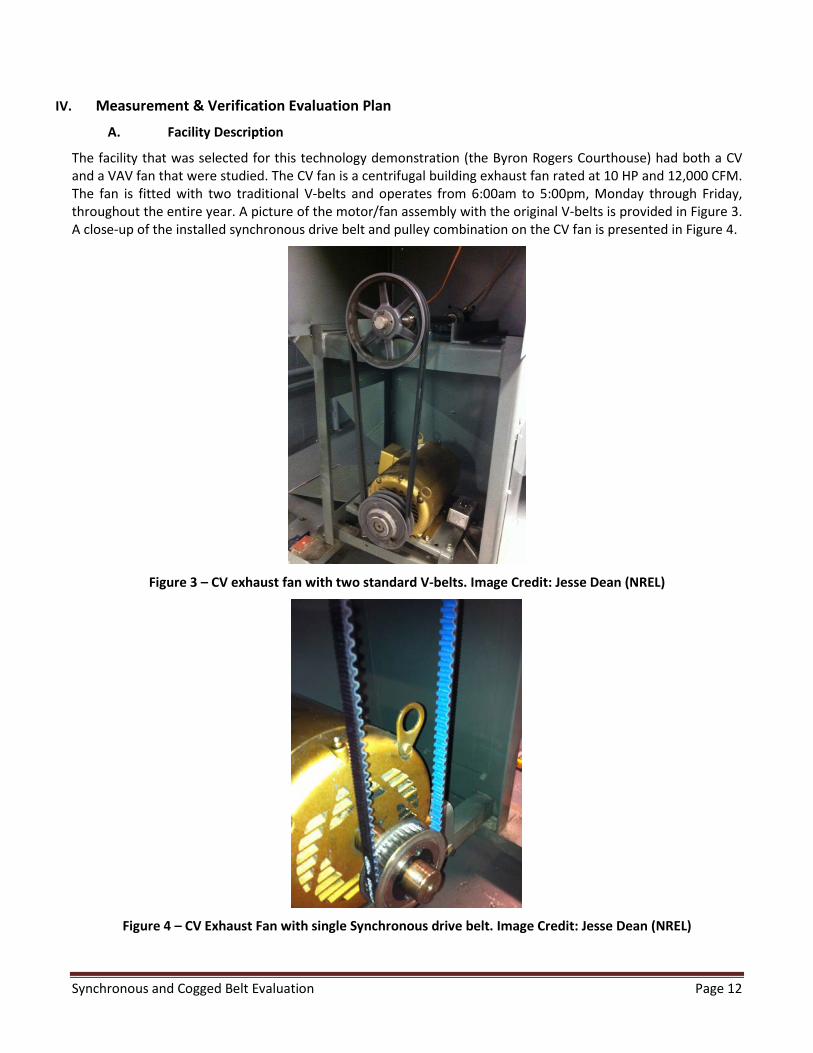
The facility that was selected for this technology demonstration (the Byron Rogers Courthouse) had both a CV and a VAV fan that were studied. The CV fan is a centrifugal building exhaust fan rated at 10 HP and 12,000 CFM. The fan is fitted with two traditional V-belts and operates from 6:00am to 5:00pm, Monday through Friday, throughout the entire year. A picture of the motor/fan assembly with the original V-belts is provided in Figure 3. A close-up of the installed synchronous drive belt and pulley combination on the CV fan is presented in Figure 4.
Figure 3 – CV exhaust fan with two standard V-belts. Image Credit: Jesse Dean (NREL)
Figure 4 – CV Exhaust Fan with single Synchronous drive belt. Image Credit: Jesse Dean (NREL)
Synchronous and Cogged Belt Evaluation Page 13
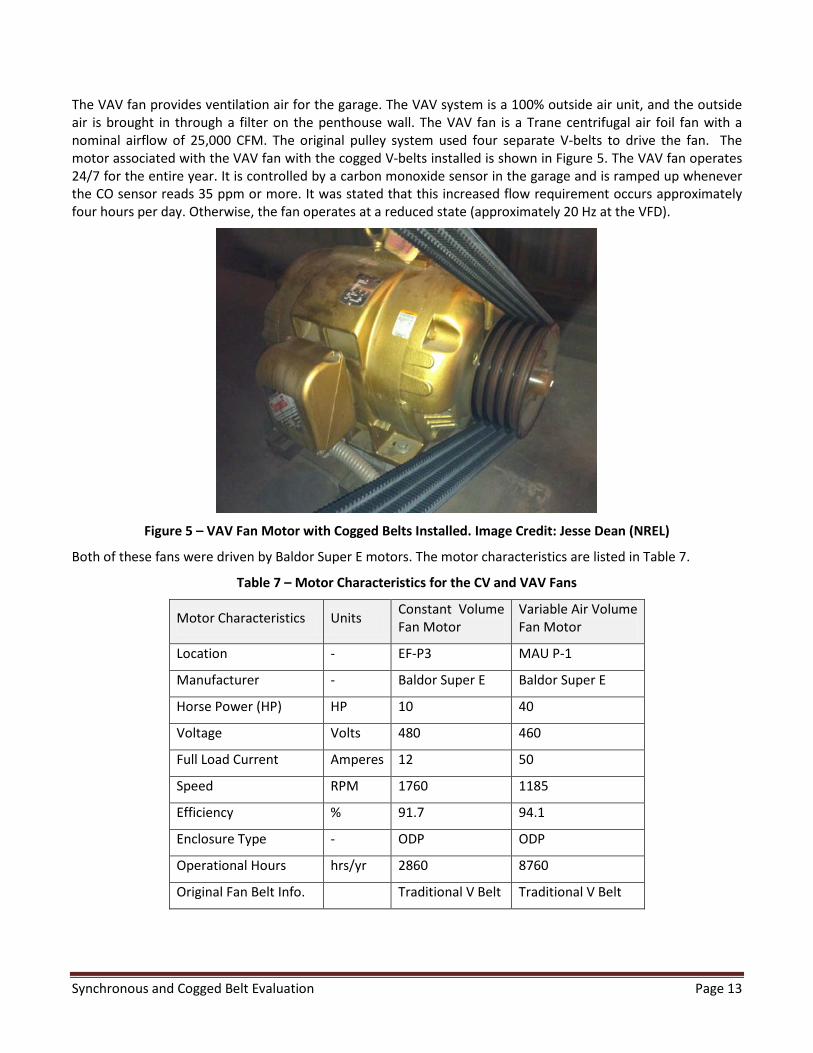
The VAV fan provides ventilation air for the garage. The VAV system is a 100% outside air unit, and the outside air is brought in through a filter on the penthouse wall. The VAV fan is a Trane centrifugal air foil fan with a nominal airflow of 25,000 CFM. The original pulley system used four separate V-belts to drive the fan. The motor associated with the VAV fan with the cogged V-belts installed is shown in Figure 5. The VAV fan operates 24/7 for the entire year. It is controlled by a carbon monoxide sensor in the garage and is ramped up whenever the CO sensor reads 35 ppm or more. It was stated that this increased flow requirement occurs approximately four hours per day. Otherwise, the fan operates at a reduced state (approximately 20 Hz at the VFD).
Figure 5 – VAV Fan Motor with Cogged Belts Installed. Image Credit: Jesse Dean (NREL)
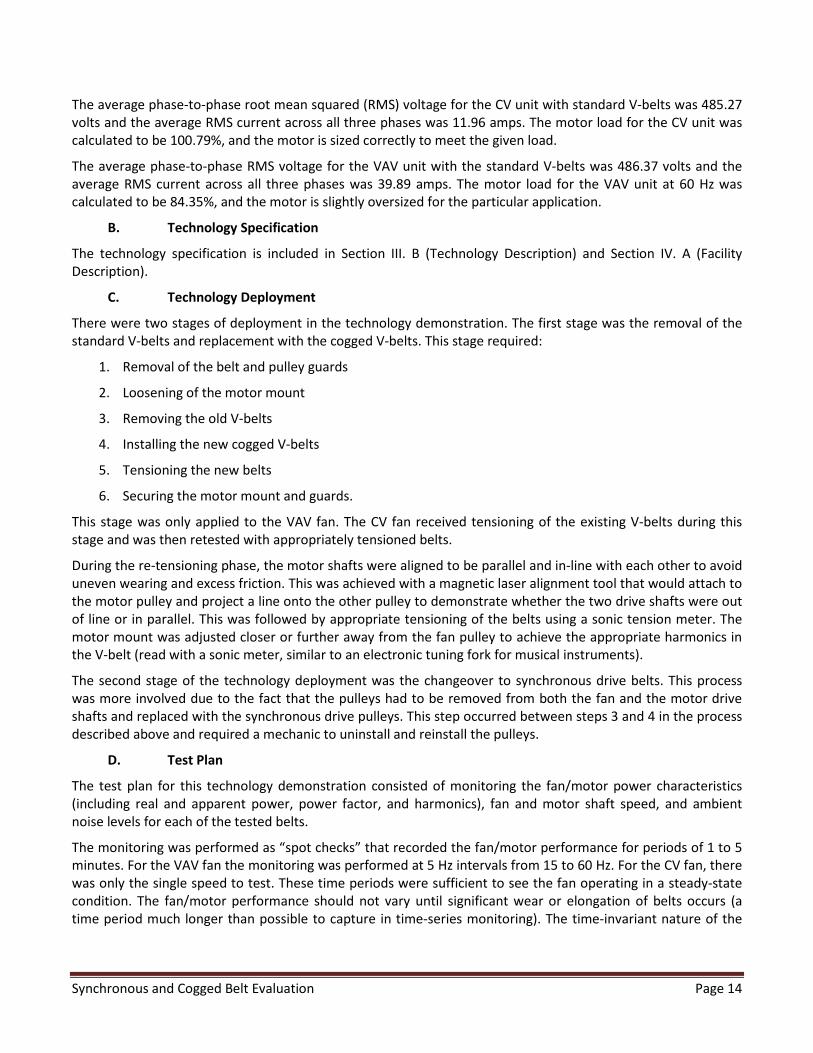
Both of these fans were driven by Baldor Super E motors. The motor characteristics are listed in Table 7.
Table 7 – Motor Characteristics for the CV and VAV Fans
Motor Characteristics Units Constant Volume Fan Motor
Variable Air Volume Fan Motor
Location - EF-P3 MAU P-1
Manufacturer - Baldor Super E Baldor Super E
Horse Power (HP) HP 10 40
Voltage Volts 480 460
Full Load Current Amperes 12 50
Speed RPM 1760 1185
Efficiency % 91.7 94.1
Enclosure Type - ODP ODP
Operational Hours hrs/yr 2860 8760
Original Fan Belt Info. Traditional V Belt Traditional V Belt
Synchronous and Cogged Belt Evaluation Page 14
The average phase-to-phase root mean squared (RMS) voltage for the CV unit with standard V-belts was 485.27 volts and the average RMS current across all three phases was 11.96 amps. The motor load for the CV unit was calculated to be 100.79%, and the motor is sized correctly to meet the given load.
The average phase-to-phase RMS voltage for the VAV unit with the standard V-belts was 486.37 volts and the average RMS current across all three phases was 39.89 amps. The motor load for the VAV unit at 60 Hz was calculated to be 84.35%, and the motor is slightly oversized for the particular application.
B. Technology Specification
The technology specification is included in Section III. B (Technology Description) and Section IV. A (Facility Description).
C. Technology Deployment
There were two stages of deployment in the technology demonstration. The first stage was the removal of the standard V-belts and replacement with the cogged V-belts. This stage required:
1. Removal of the belt and pulley guards
2. Loosening of the motor mount
3. Removing the old V-belts
4. Installing the new cogged V-belts
5. Tensioning the new belts
6. Securing the motor mount and guards.
This stage was only applied to the VAV fan. The CV fan received tensioning of the existing V-belts during this stage and was then retested with appropriately tensioned belts.
During the re-tensioning phase, the motor shafts were aligned to be parallel and in-line with each other to avoid uneven wearing and excess friction. This was achieved with a magnetic laser alignment tool that would attach to the motor pulley and project a line onto the other pulley to demonstrate whether the two drive shafts were out of line or in parallel. This was followed by appropriate tensioning of the belts using a sonic tension meter. The motor mount was adjusted closer or further away from the fan pulley to achieve the appropriate harmonics in the V-belt (read with a sonic meter, similar to an electronic tuning fork for musical instruments).
The second stage of the technology deployment was the changeover to synchronous drive belts. This process was more involved due to the fact that the pulleys had to be removed from both the fan and the motor drive shafts and replaced with the synchronous drive pulleys. This step occurred between steps 3 and 4 in the process described above and required a mechanic to uninstall and reinstall the pulleys.
D. Test Plan
The test plan for this technology demonstration consisted of monitoring the fan/motor power characteristics (including real and apparent power, power factor, and harmonics), fan and motor shaft speed, and ambient noise levels for each of the tested belts.
The monitoring was performed as “spot checks” that recorded the fan/motor performance for periods of 1 to 5 minutes. For the VAV fan the monitoring was performed at 5 Hz intervals from 15 to 60 Hz. For the CV fan, there was only the single speed to test. These time periods were sufficient to see the fan operating in a steady-state condition. The fan/motor performance should not vary until significant wear or elongation of belts occurs (a time period much longer than possible to capture in time-series monitoring). The time-invariant nature of the
Synchronous and Cogged Belt Evaluation Page 15
fan/motor operation makes it possible to draw conclusions on future performance from the spot testing taken during site visits.
A baseline test was conducted on both the CV and the VAV fans to establish the performance of the standard V-belts that were in place before the study commenced. This established the baseline power consumption and characteristics as well as the shaft speeds that needed to be matched for the synchronous drive belt installs.
For the VAV fan, the baseline test was followed by a replacement of the V-belts with cogged V-belts. Once the cogged V-belts were installed and properly tensioned, they followed an identical test procedure of spot tests at each 5 Hz interval from 15 to 60 HZ. The cogged V-belts were then removed and replaced by the synchronous drive belts. The synchronous drive belts received the identical test procedure as previously described.
For the CV fan, the baseline test was followed by accurate tensioning of the existing V-belts. The performance of the tensioned belts was recorded. The V-belts were then removed and replaced by the synchronous drive belts. The synchronous drive belts were tested in an identical manner to the baseline and tensioned belts.
E. Instrumentation Plan
The power monitoring was done at the electrical boxes for the CV and VAV fans. All of the power metering was done by a Fluke Power Logger 1735. The Fluke Power Logger records:
• Minimum, maximum, and average RMS voltage, RMS current, real power, reactive power, apparent power, power factor, and total harmonic distortion for each of the three phases;
• Minimum, maximum, and average total real, total reactive, total apparent power, and total power factor;
• Frequency.
All of the variables listed above are collected on a one-second time interval and recorded in a text file that can either be viewed in Fluke software or imported into Excel. For this study, the raw data was imported into Excel files.
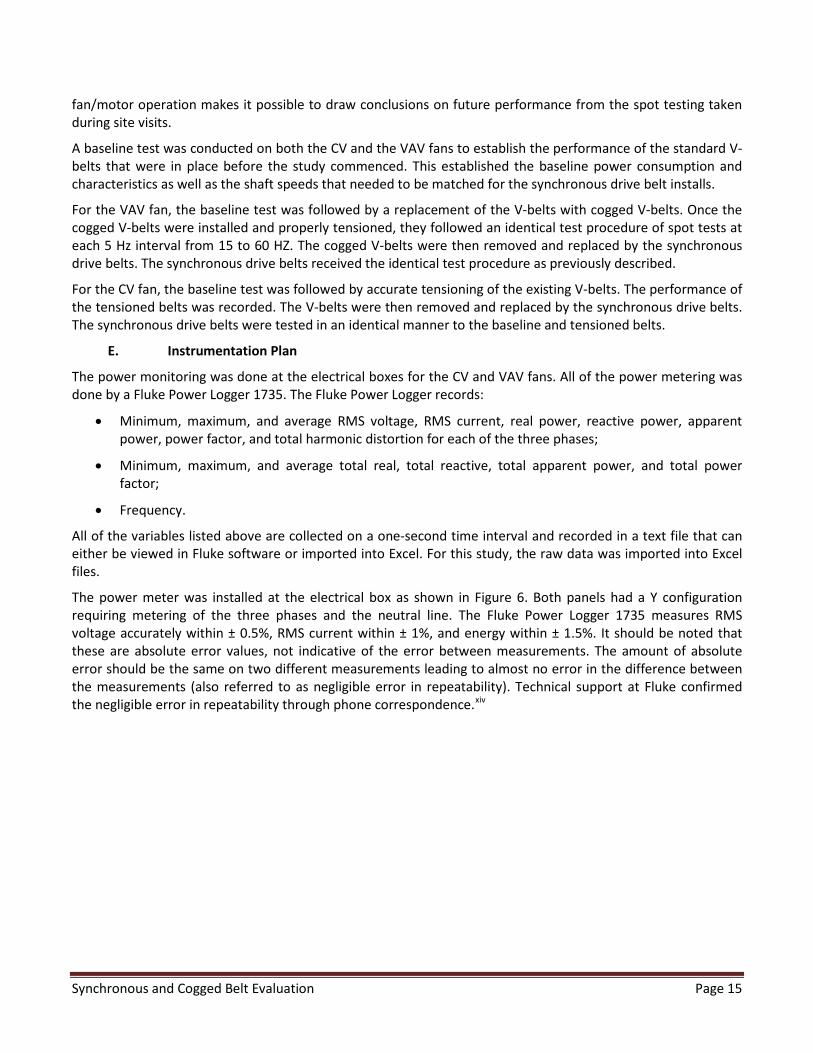
The power meter was installed at the electrical box as shown in Figure 6. Both panels had a Y configuration requiring metering of the three phases and the neutral line. The Fluke Power Logger 1735 measures RMS voltage accurately within ± 0.5%, RMS current within ± 1%, and energy within ± 1.5%. It should be noted that these are absolute error values, not indicative of the error between measurements. The amount of absolute error should be the same on two different measurements leading to almost no error in the difference between the measurements (also referred to as negligible error in repeatability). Technical support at Fluke confirmed the negligible error in repeatability through phone correspondence.xiv
Synchronous and Cogged Belt Evaluation Page 16
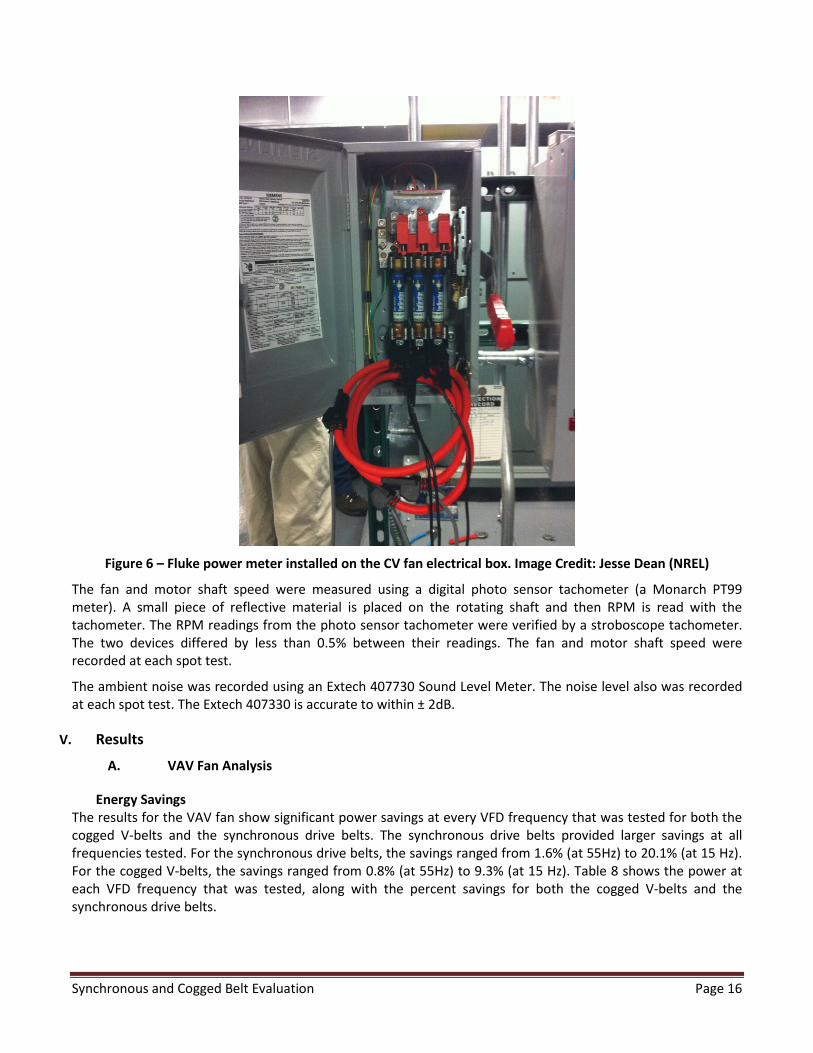
Figure 6 – Fluke power meter installed on the CV fan electrical box. Image Credit: Jesse Dean (NREL)
The fan and motor shaft speed were measured using a digital photo sensor tachometer (a Monarch PT99 meter). A small piece of reflective material is placed on the rotating shaft and then RPM is read with the tachometer. The RPM readings from the photo sensor tachometer were verified by a stroboscope tachometer. The two devices differed by less than 0.5% between their readings. The fan and motor shaft speed were recorded at each spot test.
The ambient noise was recorded using an Extech 407730 Sound Level Meter. The noise level also was recorded at each spot test. The Extech 407330 is accurate to within ± 2dB.
V. Results
A. VAV Fan Analysis
Energy Savings The results for the VAV fan show significant power savings at every VFD frequency that was tested for both the cogged V-belts and the synchronous drive belts. The synchronous drive belts provided larger savings at all frequencies tested. For the synchronous drive belts, the savings ranged from 1.6% (at 55Hz) to 20.1% (at 15 Hz). For the cogged V-belts, the savings ranged from 0.8% (at 55Hz) to 9.3% (at 15 Hz). Table 8 shows the power at each VFD frequency that was tested, along with the percent savings for both the cogged V-belts and the synchronous drive belts.

Synchronous and Cogged Belt Evaluation Page 17
Table 8 - VAV Weather-Adjusted and Fan-Speed-Normalized Savings in Real Power Consumption over Standard V-Belt
Predicted Power Percent Savings
VFD Frequency [Hz]
Fan Speed [RPM]
Baseline [W]
Cogged [W]
Synchronous [W] Baseline Cogged Synchronous
15 130 770.7 698.8 615.9 NA 9.3% 20.1%
20 173 1,548.8 1,492.2 1,422.8 NA 3.7% 8.1%
25 216 2,712.6 2,636.4 2,588.7 NA 2.8% 4.6%
30 262 4,465.1 4,378.5 4,354.4 NA 1.9% 2.5%
35 303 6,821.0 6,494.0 6,483.9 NA 4.8% 4.9%
40 348 9,883.4 9,548.9 9,538.4 NA 3.4% 3.5%
45 391 13,748.7 13,302.1 13,267.9 NA 3.2% 3.5%
50 434 18,587.7 17,986.4 17,898.1 NA 3.2% 3.7%
55 478 24,058.4 23,863.2 23,679.9 NA 0.8% 1.6%
60 521 31,167.2 30,782.0 30,459.4 NA 1.2% 2.3%
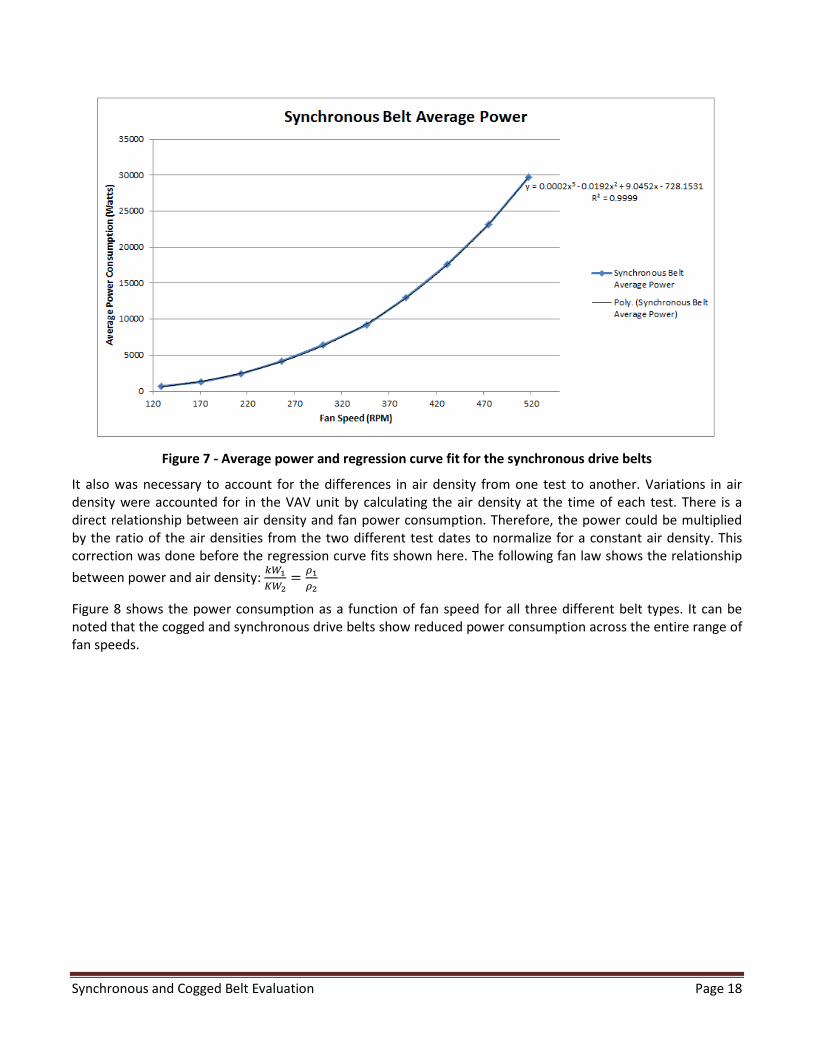
The power consumption must be normalized for fan speed. Regression based curve fits were developed to calculate power consumption as a function of fan speed. The regression based curve fit for the synchronous drive belts is provided in Figure 7 (regression plot for the standard V-belts and the cogged V-belts are provided in the appendix). The regression curve fits for the cogged V-belts and the synchronous drive belts were then used to predict the power consumption at the exact fan speeds at which the baseline data was recorded. These values are shown in Table 8 and were used to calculate the percent savings in the table.
This normalization is especially important because power varies with the cube of the fan speed according to the fan affinity laws: 𝑘𝑊1
𝐾𝑊2= (𝑅𝑃𝑀1
𝑅𝑃𝑀2)3. A doubling of fan RPM leads to eight times larger power consumption (23 = 8).
Therefore, it is critical to evaluate the savings of the replacement belts at the same fan speed as the baseline test. It can be noted that the cubic nature of the fan law is clearly represented in the measured data shown in Figure 7, and the relationship results in the very high R2 value associated with the 3rd order polynomial regression line.
It also can be noted that the regression curve fit shown in Figure 7 is a third order polynomial, not a straight cubic function. This fit was used for two reasons: the third order term dominates the polynomial (showing the agreement with the fan laws), and the main objective of the curve fit was to be able to predict accurate power consumption at points not measured during the spot testing. Due to the fact that the third order polynomial had a higher R2 value than the cubic fit (0.99994 vs. 0.9997), this curve was utilized in the normalization process.
Synchronous and Cogged Belt Evaluation Page 18
Figure 7 - Average power and regression curve fit for the synchronous drive belts
It also was necessary to account for the differences in air density from one test to another. Variations in air density were accounted for in the VAV unit by calculating the air density at the time of each test. There is a direct relationship between air density and fan power consumption. Therefore, the power could be multiplied by the ratio of the air densities from the two different test dates to normalize for a constant air density. This correction was done before the regression curve fits shown here. The following fan law shows the relationship between power and air density: 𝑘𝑊1
𝐾𝑊2= 𝜌1
𝜌2
Figure 8 shows the power consumption as a function of fan speed for all three different belt types. It can be noted that the cogged and synchronous drive belts show reduced power consumption across the entire range of fan speeds.

Synchronous and Cogged Belt Evaluation Page 19
Figure 8 – VAV fan Average Power Consumption vs. Fan Speed (shown for each belt type)
To calculate the average power consumed at each VFD speed, the power spikes and variation at the beginning of each change in fan speed were discarded. The remaining period of steady state operation at each VFD frequency was then averaged to get a single power value for each VFD frequency.
An example of the recorded power consumption of the fan equipped with a synchronous drive belt is shown below. Note the spike in power consumption at the beginning of each increase in fan speed.
Figure 9 – Testing data for the VAV fan with Synchronous Belt (Power Consumption vs. Time)

Synchronous and Cogged Belt Evaluation Page 20
B. Economic Analysis
The expected life of each belt, as well as the method of economic analysis, are important to understanding the reported economic findings. The life of the V-belt, the synchronous drive belt, and the cogged V-belt are all 3 years for the life-cycle analysis. Conversations with a senior engineer at one of the principal belt manufacturers did not identify any established trends in either absolute lifetimes or relative lifetimes (between different belt types). In general, belts can be expected to last between 1 and 3 years, but this was established only as a very rough estimate. The specific installation will dictate belt lifetime, and belts should be monitored multiple times each year to evaluate appropriate replacement schedules. Manufacturers also estimate a longer lifespan for synchronous drive belts. The 3-year lifespan was selected to represent the longer belt-life. The economic analysis was conducted with identical lifespans for each belt and should, therefore, conservatively estimate life-cycle cost savings for the synchronous drive belts (no extra belt replacements were assumed for the standard V-belts). In reality, belt life is dependent on the rated belt load carrying capacity, the duty cycle of the fan that the belt is driving, and maintenance. A generalized estimation of belt lifespan is not feasible.
The life-cycle analysis is conducted over a 9-year period. Nine years was chosen for the period of analysis, because it includes three full life-cycles for each belt. The life-cycle cost analysis analyzes the total cost of ownership of each belt over the 9-year period, converting future costs to a present value based on the expected inflation rate and electricity escalation rate. Replacement costs are incurred at the beginning of years 4 and 7. The belt with the lowest life-cycle cost is economically the best decision for GSA over a 10-year period, assuming the rates used in this analysis are consistent with future trends.
To calculate annual electricity savings, an average daily profile was documented for the VAV fan. The linear regressions were then used to predict the power consumed at each frequency that the fan encountered throughout the 24-hour period. It was noted by the facility manager that the garage ventilation fan operates 24 hours a day, 365 days per year. The fan was stated to operate at 20 Hz for the majority of the day and cycle up to maximum speed (60 Hz) for approximately four hours a day when the carbon monoxide sensor delivers a reading that exceeds 35 ppm. Thus, the daily schedule was modeled as 20 hours per day at 20 Hz and 4 hours per day at 60 Hz. The calculated energy and cost savings are shown in Table 9.
Table 9 – Electricity and Costs Savings for the Tested VAV Fan
Belt Type Savings Per Day [kWh]
Savings Per Year [kWh]
Annual Utility Savings [$]
Cogged V-Belts 2.67 976 $82
Synchronous Drive Belt 5.35 1953 $164
All life-cycle analyses conducted in this report were calculated according to NIST Handbook 135xv and are presented in Table 10. The life-cycle analysis covers a period of 9 years. A discount rate of 3% for commercial buildings located in Colorado was used to conduct the analysis. The blended electric utility rate for the Byron Rogers Courthouse of $0.084/kWh was used in the calculations. The life-cycle analysis shows that electricity costs play an important role in determining the cost effectiveness of belt replacements. Synchronous drive belts also have lower O&M costs, due to the fact that they do not require re-tensioning over time, which improves the total life-cycle cost. In this study, one synchronous drive belt replaced four V-belts, making the replacement costs very competitive. The one synchronous drive belt replacement is far less expensive than installing four cogged V-belts at the end of the product life.
Synchronous and Cogged Belt Evaluation Page 21
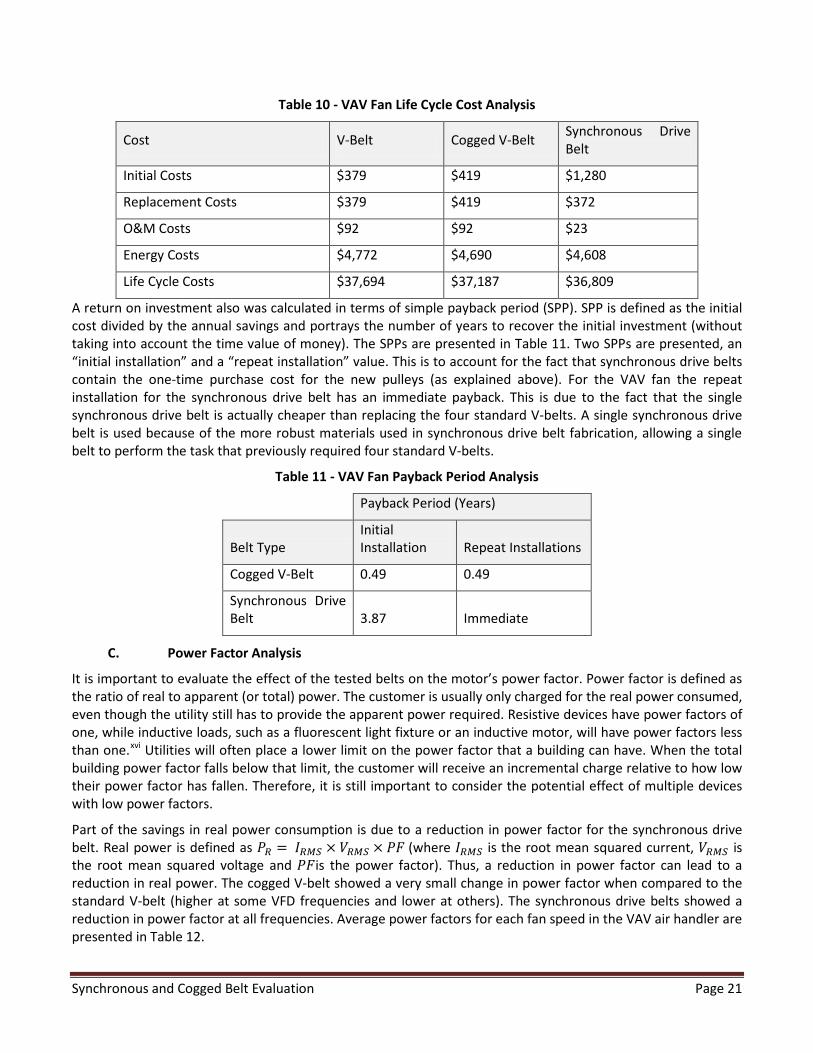
Table 10 - VAV Fan Life Cycle Cost Analysis
Cost V-Belt Cogged V-Belt Synchronous Drive Belt
Initial Costs $379 $419 $1,280
Replacement Costs $379 $419 $372
O&M Costs $92 $92 $23
Energy Costs $4,772 $4,690 $4,608
Life Cycle Costs $37,694 $37,187 $36,809
A return on investment also was calculated in terms of simple payback period (SPP). SPP is defined as the initial cost divided by the annual savings and portrays the number of years to recover the initial investment (without taking into account the time value of money). The SPPs are presented in Table 11. Two SPPs are presented, an “initial installation” and a “repeat installation” value. This is to account for the fact that synchronous drive belts contain the one-time purchase cost for the new pulleys (as explained above). For the VAV fan the repeat installation for the synchronous drive belt has an immediate payback. This is due to the fact that the single synchronous drive belt is actually cheaper than replacing the four standard V-belts. A single synchronous drive belt is used because of the more robust materials used in synchronous drive belt fabrication, allowing a single belt to perform the task that previously required four standard V-belts.
Table 11 - VAV Fan Payback Period Analysis
Payback Period (Years)
Belt Type Initial Installation Repeat Installations
Cogged V-Belt 0.49 0.49
Synchronous Drive Belt 3.87 Immediate
C. Power Factor Analysis
It is important to evaluate the effect of the tested belts on the motor’s power factor. Power factor is defined as the ratio of real to apparent (or total) power. The customer is usually only charged for the real power consumed, even though the utility still has to provide the apparent power required. Resistive devices have power factors of one, while inductive loads, such as a fluorescent light fixture or an inductive motor, will have power factors less than one.xvi Utilities will often place a lower limit on the power factor that a building can have. When the total building power factor falls below that limit, the customer will receive an incremental charge relative to how low their power factor has fallen. Therefore, it is still important to consider the potential effect of multiple devices with low power factors.
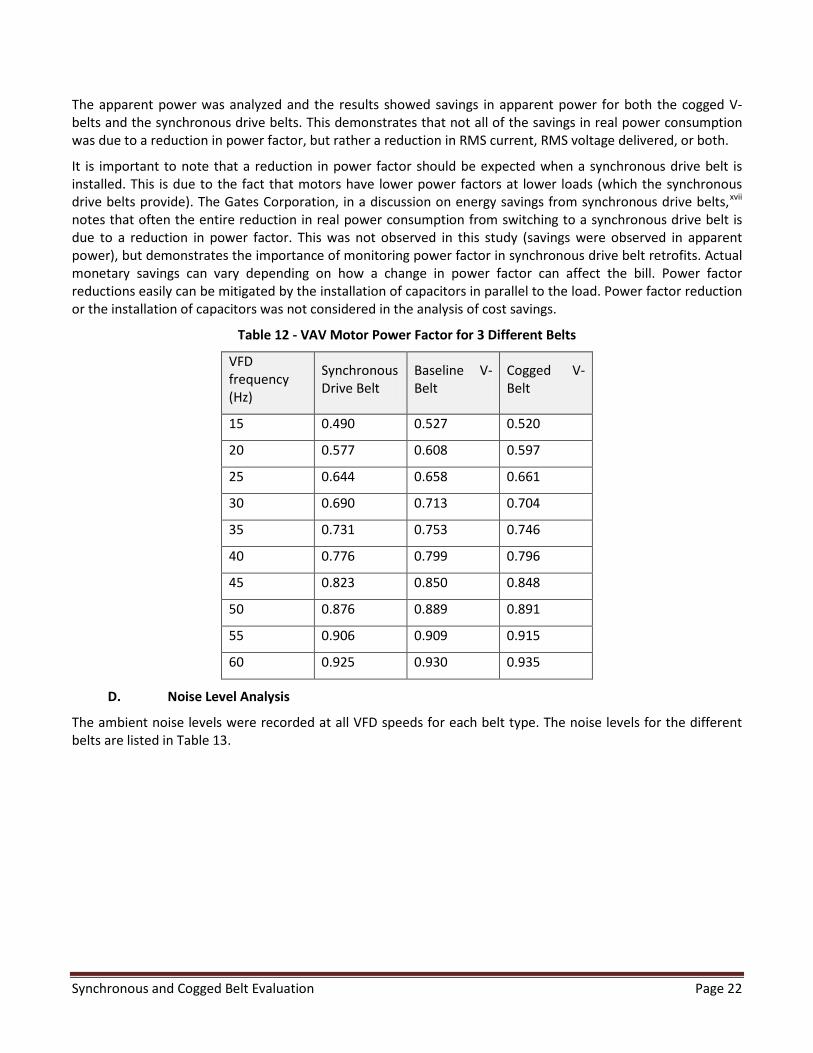
Part of the savings in real power consumption is due to a reduction in power factor for the synchronous drive belt. Real power is defined as 𝑃𝑅 = 𝐼𝑅𝑀𝑆 × 𝑉𝑅𝑀𝑆 × 𝑃𝐹 (where 𝐼𝑅𝑀𝑆 is the root mean squared current, 𝑉𝑅𝑀𝑆 is the root mean squared voltage and 𝑃𝐹is the power factor). Thus, a reduction in power factor can lead to a reduction in real power. The cogged V-belt showed a very small change in power factor when compared to the standard V-belt (higher at some VFD frequencies and lower at others). The synchronous drive belts showed a reduction in power factor at all frequencies. Average power factors for each fan speed in the VAV air handler are presented in Table 12.
Synchronous and Cogged Belt Evaluation Page 22
The apparent power was analyzed and the results showed savings in apparent power for both the cogged V-belts and the synchronous drive belts. This demonstrates that not all of the savings in real power consumption was due to a reduction in power factor, but rather a reduction in RMS current, RMS voltage delivered, or both.
It is important to note that a reduction in power factor should be expected when a synchronous drive belt is installed. This is due to the fact that motors have lower power factors at lower loads (which the synchronous drive belts provide). The Gates Corporation, in a discussion on energy savings from synchronous drive belts,xvii notes that often the entire reduction in real power consumption from switching to a synchronous drive belt is due to a reduction in power factor. This was not observed in this study (savings were observed in apparent power), but demonstrates the importance of monitoring power factor in synchronous drive belt retrofits. Actual monetary savings can vary depending on how a change in power factor can affect the bill. Power factor reductions easily can be mitigated by the installation of capacitors in parallel to the load. Power factor reduction or the installation of capacitors was not considered in the analysis of cost savings.
Table 12 - VAV Motor Power Factor for 3 Different Belts
VFD frequency (Hz)
Synchronous Drive Belt
Baseline V-Belt
Cogged V-Belt
15 0.490 0.527 0.520
20 0.577 0.608 0.597
25 0.644 0.658 0.661
30 0.690 0.713 0.704
35 0.731 0.753 0.746
40 0.776 0.799 0.796
45 0.823 0.850 0.848
50 0.876 0.889 0.891
55 0.906 0.909 0.915
60 0.925 0.930 0.935
D. Noise Level Analysis
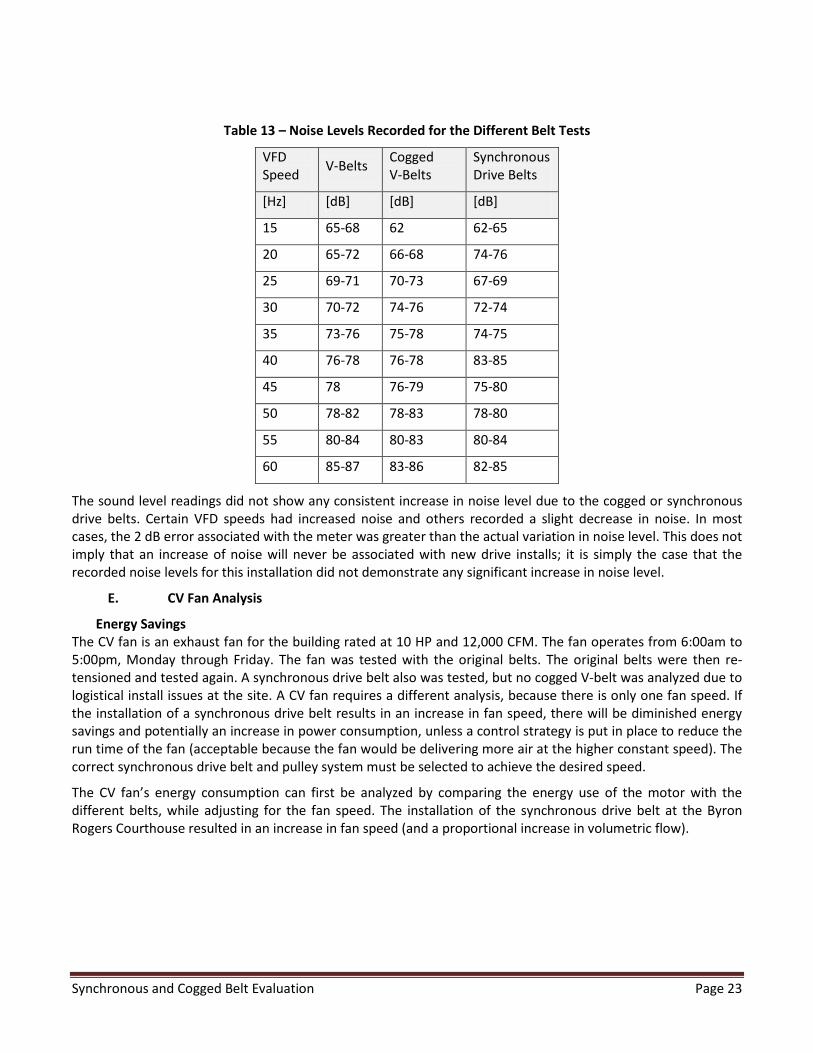
The ambient noise levels were recorded at all VFD speeds for each belt type. The noise levels for the different belts are listed in Table 13.
Synchronous and Cogged Belt Evaluation Page 23
Table 13 – Noise Levels Recorded for the Different Belt Tests
VFD Speed V-Belts Cogged
V-Belts Synchronous Drive Belts
[Hz] [dB] [dB] [dB]
15 65-68 62 62-65
20 65-72 66-68 74-76
25 69-71 70-73 67-69
30 70-72 74-76 72-74
35 73-76 75-78 74-75
40 76-78 76-78 83-85
45 78 76-79 75-80
50 78-82 78-83 78-80
55 80-84 80-83 80-84
60 85-87 83-86 82-85
The sound level readings did not show any consistent increase in noise level due to the cogged or synchronous drive belts. Certain VFD speeds had increased noise and others recorded a slight decrease in noise. In most cases, the 2 dB error associated with the meter was greater than the actual variation in noise level. This does not imply that an increase of noise will never be associated with new drive installs; it is simply the case that the recorded noise levels for this installation did not demonstrate any significant increase in noise level.
E. CV Fan Analysis
Energy Savings The CV fan is an exhaust fan for the building rated at 10 HP and 12,000 CFM. The fan operates from 6:00am to 5:00pm, Monday through Friday. The fan was tested with the original belts. The original belts were then re-tensioned and tested again. A synchronous drive belt also was tested, but no cogged V-belt was analyzed due to logistical install issues at the site. A CV fan requires a different analysis, because there is only one fan speed. If the installation of a synchronous drive belt results in an increase in fan speed, there will be diminished energy savings and potentially an increase in power consumption, unless a control strategy is put in place to reduce the run time of the fan (acceptable because the fan would be delivering more air at the higher constant speed). The correct synchronous drive belt and pulley system must be selected to achieve the desired speed.
The CV fan’s energy consumption can first be analyzed by comparing the energy use of the motor with the different belts, while adjusting for the fan speed. The installation of the synchronous drive belt at the Byron Rogers Courthouse resulted in an increase in fan speed (and a proportional increase in volumetric flow).

Synchronous and Cogged Belt Evaluation Page 24
Table 14 – CV Fan and Motor Speeds for Tested Belts
Belt Type Motor Speed (RPM) Fan Speed (RPM)
Loose V-Belt 1778 1161.5
Tensioned V-Belt 1777 1164
Synchronous drive belt 1778 1183
The equivalent power in the table below is the power consumed if no changes are made to the efficiency of the belt drive system. This value accounts for only changes in the fan speed, and no changes in the belt drive efficiency. It is calculated using the cube of the fan speed ratio in accordance with the fan affinity laws. While the synchronous drive belt case actually consumes more power (due to the higher RPM with the new belts), its power consumption (at the higher fan speed) is less than the original belts would have consumed at that higher fan speed. This results in the percent increase in efficiency noted in Table 15.
During the testing of the synchronous drive belt, some abnormal fluctuations in power consumption were observed, which were discarded. This analysis also ignores the initial spike in electricity consumption as the motors are turned on.
Table 15 – CV Fan Average, Normalized Power Consumption
Belt Type Fan Speed
(RPM) (RPM1/RPM2)3 Equivalent Power
Consumption (W)
Actual Average Power Consumption (W)
Percent Increase in Efficiency
Original V-Belt 1161.5 1 7,107.4 7,107.4 NA
Tensioned V-Belt 1164 0.9935 7153.3 7,153.3 0.001%
Synchronous drive belt 1183 0.9464 7509.4 7,368.9 1.871%
Table 15 shows that the installation of the synchronous drive belt led to an increase in fan speed, and an increase in power consumption (shown in the actual average power consumption). Without adjustments to the fan control, the retrofit will result in increased power consumption and increased volumetric air flow through the fan.
F. Economic Analysis
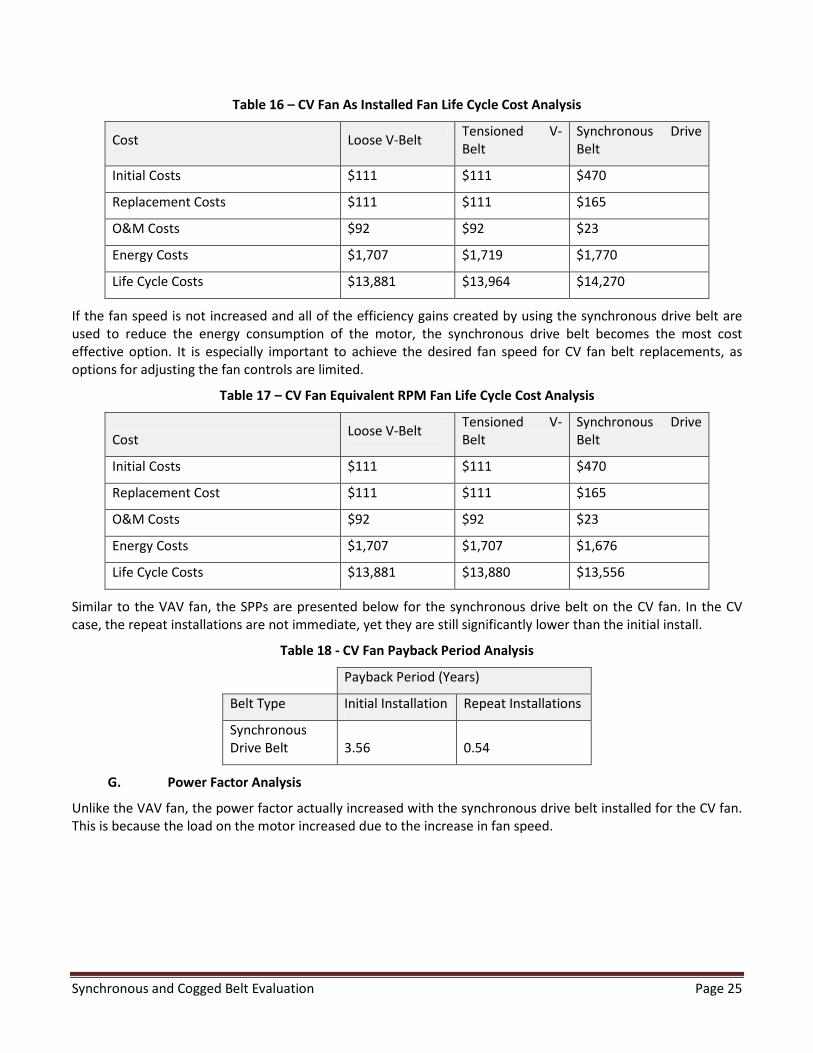
Two life-cycle cost analyses are presented below. The synchronous drive belt, as installed, actually increases the cost of operating the exhaust fan, despite more efficiently transferring power from the motor to the fan.
Synchronous and Cogged Belt Evaluation Page 25
Table 16 – CV Fan As Installed Fan Life Cycle Cost Analysis
Cost Loose V-Belt Tensioned V-Belt
Synchronous Drive Belt
Initial Costs $111 $111 $470
Replacement Costs $111 $111 $165
O&M Costs $92 $92 $23
Energy Costs $1,707 $1,719 $1,770
Life Cycle Costs $13,881 $13,964 $14,270
If the fan speed is not increased and all of the efficiency gains created by using the synchronous drive belt are used to reduce the energy consumption of the motor, the synchronous drive belt becomes the most cost effective option. It is especially important to achieve the desired fan speed for CV fan belt replacements, as options for adjusting the fan controls are limited.
Table 17 – CV Fan Equivalent RPM Fan Life Cycle Cost Analysis
Cost Loose V-Belt Tensioned V-Belt
Synchronous Drive Belt
Initial Costs $111 $111 $470
Replacement Cost $111 $111 $165
O&M Costs $92 $92 $23
Energy Costs $1,707 $1,707 $1,676
Life Cycle Costs $13,881 $13,880 $13,556
Similar to the VAV fan, the SPPs are presented below for the synchronous drive belt on the CV fan. In the CV case, the repeat installations are not immediate, yet they are still significantly lower than the initial install.
Table 18 - CV Fan Payback Period Analysis
Payback Period (Years)
Belt Type Initial Installation Repeat Installations
Synchronous Drive Belt 3.56 0.54
G. Power Factor Analysis
Unlike the VAV fan, the power factor actually increased with the synchronous drive belt installed for the CV fan. This is because the load on the motor increased due to the increase in fan speed.
Synchronous and Cogged Belt Evaluation Page 26
Table 19 – CV Motor Power Factor for the Tested Belts
Belt Type Power Factor
Original V-Belt 0.706
Tensioned V-Belt 0.705
Synchronous Drive Belt 0.716
H. Maximum Power at Start-Up
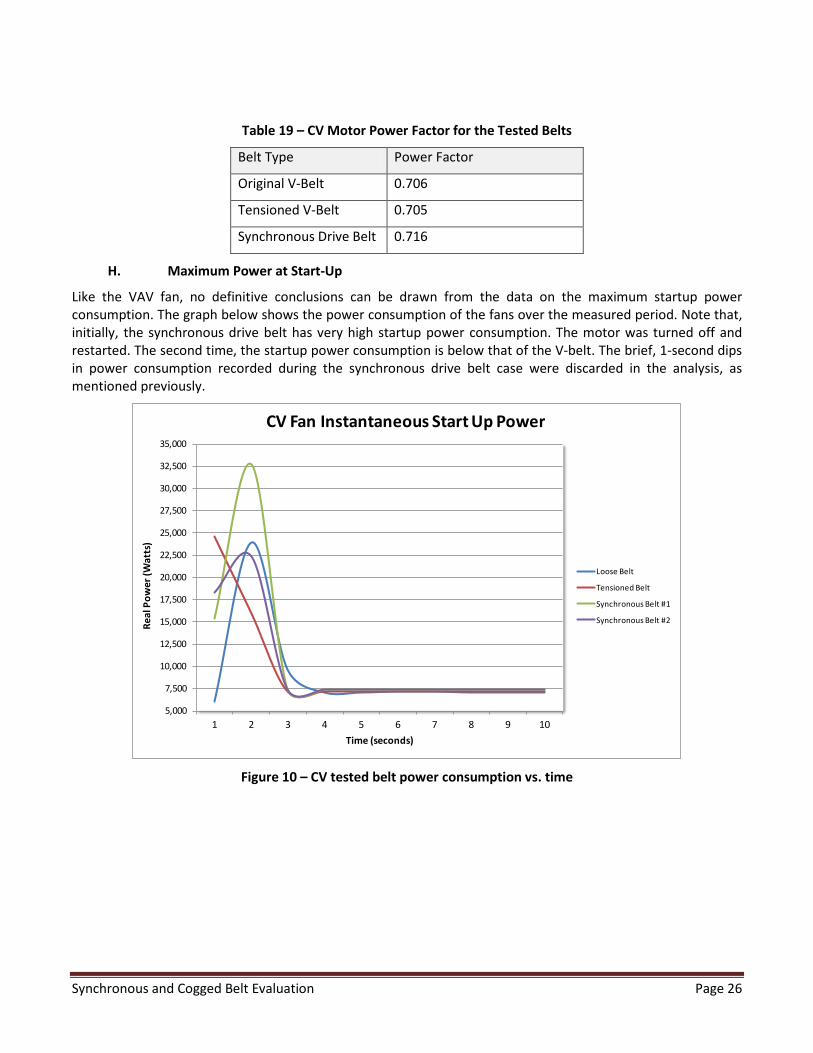
Like the VAV fan, no definitive conclusions can be drawn from the data on the maximum startup power consumption. The graph below shows the power consumption of the fans over the measured period. Note that, initially, the synchronous drive belt has very high startup power consumption. The motor was turned off and restarted. The second time, the startup power consumption is below that of the V-belt. The brief, 1-second dips in power consumption recorded during the synchronous drive belt case were discarded in the analysis, as mentioned previously.
Figure 10 – CV tested belt power consumption vs. time
5,000
7,500
10,000
12,500
15,000
17,500
20,000
22,500
25,000
27,500
30,000
32,500
35,000
1 2 3 4 5 6 7 8 9 10
Real
Pow
er (W
atts
)
Time (seconds)
CV Fan Instantaneous Start Up Power
Loose Belt
Tensioned Belt
Synchronous Belt #1
Synchronous Belt #2
Synchronous and Cogged Belt Evaluation Page 27
VI. Conclusions
A. Overall Technology Assessment at Demonstration Facility
It has been shown in this study that both cogged V-belts and synchronous drive belts can provide a reduction in energy consumption over the incumbent V-belt technology. This was demonstrated for the synchronous drive belts on both a CV and VAV fan, and for the cogged V-belts on the VAV fan. The savings were greater on the VAV fan and were highest at lower fan speeds. For the cogged V-belts on the VAV fan, they realized percent savings ranging from 1.2% (at 60 Hz) to 9.3% (at 15 Hz). The synchronous drive belts on the VAV realized percent savings from 2.3% (at 60 Hz) to 20.1% (at 15 Hz). For the CV fan, the synchronous drive belts showed potential savings of 1.9% (once the data was normalized for fan speed variation).
It should be noted that the synchronous drive belts as installed on the CV fan actually consumed more energy than the existing belts due to the fan running at a higher RPM. This is an issue that will need to be addressed with all new synchronous drive belt installs. A qualified installer will be required to size the pulley/belt combinations so that the current fan speed is maintained. With the VAV system, the sizing issue is somewhat less crucial due to the fact that the system is self-correcting if the control logic is working properly; a higher fan speed will deliver more air to the space, yet the control sensor should command the fan to turn down more quickly due to the higher fan speed, resulting in savings. It should be noted that the fan still needs to provide a similar amount of air at full capacity due to the fact that the fan was originally sized for a certain maximum air flow rate.
The synchronous drive belts showed lower LCC than both the cogged V-belts and the baseline (standard V-belts) on the VAV fan. They also showed the lowest LCC on the CV fan when using potential energy savings. The lower LCCs were due to a combination of reduced energy consumption and lower operation and maintenance costs. For this analysis, the belts were all assumed to have equivalent lifetimes. It the manufacturer claims for longer lifespans are accurate, this would only improve the synchronous drive belt economics.
It is recommended that GSA pursue implementation of synchronous drive belts on VAV systems. While the cogged V-belts were tested on the VAV fan only, the fact that they showed savings at all fixed speeds indicates that they would perform well on CV fans. GSA should target cogged V-belts for CV systems where GSA should replace standard V-belts with cogged V-belts when the standard belts are due for replacement.
The first fans that should be addressed are fans with high operating hours (leading to more energy savings). VAV fans show greater opportunity for savings (at a variety of loads) and they also have less risk associated with the replacement due to the self-correcting nature of the VFD system (avoiding the potential increased speed issue). The VAV fans also generally undergo fewer high-torque starts, which can damage the synchronous drive belts.
B. Best Practice
It has been shown that the switch-over to synchronous drive belts is a cost-effective way to address fan energy use in the GSA building portfolio. The synchronous drive belts demonstrated energy savings in all cases that were tested, and should be considered as a technology that can reduce electricity usage across GSA’s portfolio.
The three most significant variables that need to be considered and addressed when evaluating a new belt installation are:
• Fan runtime (operating hours and speed)
• Type of fan (VAV versus CV)
• Fan/Motor dimensions, and measured operating speeds for accurate sizing.
The fan runtime will directly impact the amount of energy and money saved. Fans that serve a more constant load will result in quicker paybacks and more electricity saved. The fan speed also should be considered. This

Synchronous and Cogged Belt Evaluation Page 28
report showed greater percent savings at lower fan speeds, yet this may not result in greater absolute savings due to smaller total power consumption at the lower speeds. Due to larger total savings with fans that operate at higher fan speed, fans that operate at higher fan speeds should be pursued first.
The type of fan also should be considered. The VAV fan demonstrated a greater opportunity for savings in this study and should be selected before a CV fan, given the opportunity. It also is important to consider the controls that are dictating the operation of a VAV fan. Fully continuous controls that maintain the fan at a certain set point (such as a static pressure sensor in ductwork) are ideal for this technology and will ensure that all potential savings are obtained. Control systems such as the one monitored in this study (a single setting under a certain threshold and another setting until that threshold has been re-achieved) are not as ideal due to the fact that any changes in fan RPM will not be automatically adjusted for. This is a secondary effect (and only an issue if sizing leads to higher fan speeds), but one worth considering.
The cogged V-belt replacement should target CV fans where the standard V-belt was installed on sheave diameters that are at or below the minimum recommended sheave diameter for that specific belt. This will lead to more efficiency gains, as reductions in the bending resistance will be greater on small diameter sheaves.
The final variable affects both installation and operation of the technology. It is critical to ensure that an experienced installer takes the appropriate measurements (both diameters/lengths and RPM of the fan and motor) and accurately sizes the pulley/belt combination. If the pulleys and drives are not sized such that the motor mount can be adjusted to receive the new belt, significant labor hours may be required and parts may need to be reordered. Assuming the install is successful, it is still critical to have selected the pulley/belt combination that matches the measured RPM of the previous system. This will ensure that the new belt does not drive the fan at higher RPM, consuming more rather than less energy. This applies most directly to the CV fan, yet can impact VAV fan performance as well.
Finally, motor bases should be rigid and non-compliant. They should not be spring or flex mounted, as belt operating tensions will overcome the springs and allow belt slippage. They also should utilize twin adjustment screws for versatility in aligning the motor and applying belt installation tension.
C. Barriers and Enablers to Adoption
There should be no significant barriers preventing the adoption of synchronous drive belt switchover. It is a proven technology that is offered by multiple manufacturers. It will be important to source a qualified and knowledgeable installer for installations at GSA buildings. This will help ensure correct belt/pulley sizing and ensure that the potential savings are captured.
Further observation of the cogged and synchronous drive belts should be undertaken to evaluate their installed lifespans. This will have to take place over a number of years to determine if their lifespans are longer than the typical V-belt. If the manufacturer’s estimates of longer lifespans for synchronous drive belts are substantiated, this would improve the economics outlined in this report and further substantiate widespread deployment of the technology.
It also should be noted that the synchronous drive belts will require larger investment on the initial changeover from standard V-belts. This is due to the required pulley changeover. After this initial investment, only belt replacement will be necessary. This difference between initial cost and incremental cost was taken into account in all of the economic analysis presented in this report.
D. Market Potential within the GSA Portfolio
Synchronous belt driven fans have the potential to be cost effectively deployed across the country. The O&M savings and potentially longer lifetime of synchronous drive belts are as important as energy savings when

Synchronous and Cogged Belt Evaluation Page 29
considering the economics. Due to these considerations, a simple payback does not accurately assess the economic benefits of the retrofit.
To provide an example of the impact of fan operation and varying utility rates on the economic benefits of synchronous and cogged V-belts, the performance characteristics of the tested VAV fan were applied to different operating scenarios. With less operation, the monetary savings become smaller, and more reliant on O&M savings and competitive installation costs. With higher electricity prices, the savings become more and more positive and the synchronous drive belt further differentiates itself from the cogged V-belt.
Figure 11 and Figure 12 present the net present value of the belt replacements for the VAV fan. A positive net present value indicates positive, inflation-adjusted savings over the baseline V-belt over the 9-year period of analysis. The cogged V-belt becomes more cost-effective than the baseline V-Belt at $0.015/kWh, and the synchronous drive belt is more cost-effective than the baseline V-belt at $0.024/kWh. At electric rates higher than $0.032/kWh, the synchronous drive belt is more cost-effective than the cogged V-belt. For fan runtime, the cogged V-belt is more cost-effective than the baseline V-belt if the fan runs at least 4.3 hours/day, and the synchronous drive belt is more cost-effective if the fan runs 6.8 hours per day.
Figure 11 - Net present value of belt replacement as a function of electricity rate

Synchronous and Cogged Belt Evaluation Page 30
Figure 12 – Net present value of belt replacement as a function of operating hours
These graphics should help GSA determine which sites and which fans are most appropriate for belt drive retrofits. As previously noted, synchronous drive belts have been shown to provide greater savings for VAV fans, and CV fans should receive appropriately installed cogged V-belts as the standard V-belts need replacement.
E. Recommendations for Installation, Commissioning, Training, and Change Management
Cogged V-belts are a straightforward technology that essentially replaces the standard V-belt with almost no difference in operation, commissioning, or maintenance. These belts should be installed in place of standard V-belts in situations where the sheave diameters are below the listed minimum for the standard V-belt. This will ensure the largest efficiency savings. Maintenance and commissioning are identical to the standard V-belt.
The synchronous drive belts present a slightly more complicated installation. This is due to the fact that the motor and fan sheaves need to be replaced by the synchronous pulleys. To facilitate a successful installation, it is critical that an experienced installer measure the pre-existing diameters, belt length, and fan/motor shaft speeds. This will allow the installer to select the appropriate pulley/belt combination and ensure a successful install. The range of mobility in the motor mount also should be considered; due to different belt/pulley sizes, the motor may be required to move more or less to accommodate the synchronous belt drive. If synchronous drive belts are to be installed on CV fans, a soft start should be investigated for concurrent installation. The soft start will reduce the initial torque on the system and reduce the chance for tooth jump and increased wear on the synchronous drive belt.
The synchronous belt drive should actually require less maintenance than the standard V-belt. The synchronous drive belt does not stretch due to extended operation; therefore, yearly re-tensioning of belts is not required with this technology. Periodic inspection of belt performance and wear is still required.
The useful lifetime of both the cogged and synchronous drive belts is a difficult metric to define. This is due to the individual characteristics of each different motor/fan scenario, the different runtimes associated with different fan uses, and multiple other variables. Conversations with a senior engineer at one of the principal belt manufacturers did not identify any established trends in either absolute lifetimes or relative lifetimes (between different belt types). In general, belts can be expected to last between 1 and 3 years, but this was established
Synchronous and Cogged Belt Evaluation Page 31
only as a very rough estimate. The specific installation will dictate belt lifetime, and belts should be monitored multiple times each year to evaluate appropriate replacement schedules.
This technology should not present any issues with on-going operation, change management for tenants/occupants, or public perception.

Synchronous and Cogged Belt Evaluation Page 32
Appendices
A. Research Details
The regression curve fits for the cogged V-belt and standard V-belt on the VAV fan are presented below.
Figure 13 – Curve Fit for the cogged V-belt for power consumption as a function of fan speed
y = 15.802x3 + 118.37x2 + 313.76x + 313.31 R² = 0.9999
0
5000
10000
15000
20000
25000
30000
35000
130 173 216 262 303 348 391 434 478 521
Aver
age
Pow
er C
onsu
mpt
ion
(Wat
ts)
Fan Speed (RPM)
Baseline V Belt Average Power
Baseline V Belt Average Power
Poly. (Baseline V Belt AveragePower)
Synchronous and Cogged Belt Evaluation Page 33
B. References
[1] Buildings Energy Data Book. http://buildingsdatabook.eren.doe.gov/TableView.aspx?table=3.1.4 Accessed 7/20/12.
[2] Synchronous Belt Noise Problems. The Gates Corporation. http://www.gates.com/facts/documents/Gf000185.pdf. Accessed 26 June 2012.
[3] Energy Savings from Synchronous drive belts. The Gates Corporation. http://www.gates.com/ptPartners/file_display_common.cfm?thispath=Gates%2Fdocuments_module&file=Energy%20Savings%20from%20Synchronous%20Belt%20Drives.pdf&location_id=3427. Accessed 26 June 2012.
[4] Energy Tip Sheet #5. Motor Systems. Industrial Technologies Program. Office of Energy Efficiency and Renewable Energy. Department of Energy. September 2005. http://www1.eere.energy.gov/manufacturing/tech_deployment/pdfs/replace_vbelts_motor_systemts5.pdf. Accessed 26 June 2012
[5] GSA Portal. http://www.gsa.gov/portal/content/104501 Accessed 7/10/12.
[6] http://www.gatesprograms.com/ptsavings/rollerchain?sid=gnothingtougher. It should be noted that that Gates®, Poly Chain®, GT® are registered trademarks of Gates Corporation.
[7] Technology Readiness Levels Presentation http://www1.eere.energy.gov/femp/pdfs/ns/ntwg_032012_livingood.pdf. Accessed 6/12/12.
[8] Cost and Energy Savings with Cogged V-belts. http://utilities.fm.virginia.edu/UtilityDocuments/energy/pdf/V-belt%20case%20study.pdf. Accessed 27 June 2012.
[9] Phone correspondence with Fluke technical support (1(800) 443-5853). 8/25/12.
[10] Energy Price Indices and Discount Factors for Life-Cycle Cost Analysis – 2011. Annual Supplement to Handbook 135 and NBS Publication 709. U.S Department of Commerce. http://www1.eere.energy.gov/femp/pdfs/ashb11.pdf
[11] Krarti, M. Energy Audit of Building Systems. CRC Press LLC, 2000
[12] Product Application Notes: Energy Savings and the Relationship of Power. The Gates Corporation. November, 2006. http://www.gates.com/ptpartners/file_display_common.cfm?thispath=Gates%2Fdocuments_module&file=Vol%2053%20No%209%20Energy%20Savings%20and%20power.pdf. Accessed 27 June 2012.
C. Glossary
CV – Constant Volume
HVAC – Heating, Ventilation, and Air Conditioning
LCC – Life-cycle Cost, taking into account discount rates and inflation
O&M – Operations and Maintenance
PF – Power Factor, the ratio between real and apparent power
RPM – Revolutions per minute
Sheave – Fan/motor pulley used with standard and cogged V-belts
SPP – Simple payback period defined as initial cost divided by annual savings
VAV – Variable Air Volume
VFD – Variable Frequency Drive
Synchronous and Cogged Belt Evaluation Page 34
i All images in Figure 1 are from Gates® Corporation ii Buildings Energy Data Book. http://buildingsdatabook.eren.doe.gov/TableView.aspx?table=3.1.4 Accessed 7/20/12. iii Synchronous Belt Noise Problems. The Gates Corporation. http://www.gates.com/facts/documents/Gf000185.pdf. Accessed 26 June 2012. iv Energy Savings from Synchronous drive belts. The Gates Corporation. http://www.gates.com/ptPartners/file_display_common.cfm?thispath=Gates%2Fdocuments_module&file=Energy%20Savings%20from%20Synchronous%20Belt%20Drives.pdf&location_id=3427. Accessed 26 June 2012. v Energy Tip Sheet #5. Motor Systems. Industrial Technologies Program. Office of Energy Efficiency and Renewable Energy. Department of Energy. September 2005. http://www1.eere.energy.gov/manufacturing/tech_deployment/pdfs/replace_vbelts_motor_systemts5.pdf. Accessed 26 June 2012 vi GSA Portal. http://www.gsa.gov/portal/content/104501 Accessed 7/10/12. vii Energy Savings from Synchronous Belts. The Gates Corporation. http://www.gates.com/ptPartners/file_display_common.cfm?thispath=Gates%2Fdocuments_module&file=Energy%20Savings%20from%20Synchronous%20Belt%20Drives.pdf&location_id=3427. Accessed 26 June 2012. viii Energy Tip Sheet #5. Motor Systems. Industrial Technologies Program. Office of Energy Efficiency and Renewable Energy. Department of Energy. September 2005. http://www1.eere.energy.gov/manufacturing/tech_deployment/pdfs/replace_vbelts_motor_systemts5.pdf. Accessed 26 June 2012. ix Energy Savings from Synchronous Belts. The Gates Corporation. http://www.gates.com/ptPartners/file_display_common.cfm?thispath=Gates%2Fdocuments_module&file=Energy%20Savings%20from%20Synchronous%20Belt%20Drives.pdf&location_id=3427 x http://www.gatesprograms.com/ptsavings/rollerchain?sid=gnothingtougher. It should be noted that that Gates®, Poly Chain®, GT® are registered trademarks of Gates Corporation. xi All images in Figure 2 are from Gates® Corporation xii Technology Readiness Levels Presentation http://www1.eere.energy.gov/femp/pdfs/ns/ntwg_032012_livingood.pdf. Accessed 6/12/12. xiii Cost and Energy Savings with Cogged V-belts. http://utilities.fm.virginia.edu/UtilityDocuments/energy/pdf/V-belt%20case%20study.pdf. Accessed 27 June 2012. xiv Phone correspondence with Fluke technical support (1(800) 443-5853). 8/25/12. xv Energy Price Indices and Discount Factors for Life-Cycle Cost Analysis – 2011. Annual Supplement to Handbook 135 and NBS Publication 709. U.S Department of Commerce. http://www1.eere.energy.gov/femp/pdfs/ashb11.pdf xvi Krarti, M. Energy Audit of Building Systems. CRC Press LLC, 2000 xvii Product Application Notes: Energy Savings and the Relationship of Power. The Gates Corporation. November, 2006. http://www.gates.com/ptpartners/file_display_common.cfm?thispath=Gates%2Fdocuments_module&file=Vol%2053%20No%209%20Energy%20Savings%20and%20power.pdf. Accessed 27 June 2012.