Embed Size (px)
Citation preview

Symposium 2010
IMG216-L: OpsCenter and OpsCenter Analytics Hands On Lab
Description In this hands-on-lab we will walk you through creating basic, operational reports using OpsCenter similar to what a NetBackup admin would be asked to do on a weekly basis. We will outline how to customize the reports, email them automatically and create alerts.
Then we will move forward into functionality available in OpsCenter Analytics.
This lab assumes you are familiar with NetBackup and have a minor understanding of backups and what a typical backup admin would need to do on week to week basis by way of managing, reporting and alerting on a NetBackup solution.
At the end of this lab, you should be able to
Understand OpsCenter and OpsCenter Analytics navigation Be able to use the built in reports either by default or using
customization to understand what is happening in a NetBackup environment
Have the knowledge to create custom reports from scratch to suit your needs
Know how to configure alerting to proactively notify you about problems in your environment
Save, schedule, and share reports you’ve created. Understand the concept of Views and how to create them
manually, and in an automated fashion
Notes The lab will be self paced based on the instructions in this
document. Instructors are available to answer questions if you get stuck.
The lab focuses mostly on OpsCenter Analytics however the initial part of the lab is needed to help you become familiar with OpsCenter navigation (and to show you how cool OC is!)
After completing the tasks in this lab, feel free to “play” with other options to familiarize yourself with the OpsCenter options
Be sure to ask your instructor any questions you may have. Thank you for coming to our lab session
Starting up the Virtual Machines
Follow the instructions in the lab room for loading the OpsCenter Virtual Machine.
Login to the HOL OpsCenter Master Windows interface is: Administrator with no password.

2 of 21
The OpsCenter Server – Basic Overview
The first part of this lab is about Reporting and Alerting on OpsCenter and could be done by customers without a key. The functionalty in this section is all part of the OpsCenter base product which is included with NetBackup.
Note: This HOL is using the OpsCenter 7.0.1 code reporting on a variety of versions of NetBackup
To begin the Lab, log into the OpsCenter Master Server (OpsCenter Master Interlock) using the credentials above
1. Double-click on the “WebUI Login” icon on the screen (bottom left, bright yellow icon) a. Wait for the UI to load
2. The login and password should be filled in for you. Click on “Log On” (leave the Domain as OpsCenterUsers(vx)
a. If not, the login is “admin” and the password is “password”. This is the default login/password
3. There are a number of Masters shown on the left hand side. None of these are “live” Masters. They were used to gather a good database.
Once logged in, you are looking at the Monitor screen. This screen has been tailored to give a NetBackup admin a quick overview of what has happened in the backup environment over the last 24 hours.
Note: The lab machine has been forced to start up on August 30, 2010 to give the best reporting options.
Overview – Checking out some of the Monitor Options
The first thing that most people notice when they get into the OpsCenter Master is the Monitor Screen. Below the Monitor there are a number of tabs. Overview, Jobs, Services, Policies, Media, Devices, Hosts and Alerts. Much of what an Admin would do on a daily basis revolves around this portion of the GUI. We will hit reporting in the next step, but lets get to know this portion of the GUI in a quick five minutes.
Click on Jobs. o Since this is a test machine with a test database the information is not up to
date but using the Filter drop down an Admin can quickly see what jobs have failed in the last backup session. There are quite a few other options to see job status as well.
Next, lets jump to Policies o Typically you would need to filter by Master in a large environment however in
the test environment only one Master shows up. This is where an Admin could start a Manual Backup of a Policy.
Now click on Media o This is pulling the media information from all of the Masters and their media
servers in our test database. Lots of media available to report on. Note on the far right the Used Capacity. If you use the Filter it is very easy to highlight a Media Server and see the status of the media.
Finally click on Devices

3 of 21
o Again, pulling information from all of the masters and media servers in our test environment. Using filtering would allow the Admin to see what drives were up/down and give them the ability to reset them.
All in all for many of the mundane day to day tasks across multiple Masters, the Admin can use OpsCenter instead of logging into each Master. While the ability to create/edit Policies and do restores is not yet part of the functionality of OpsCenter, it will be in the future so an Admin who is familiar with OpsCenter now will benefit in the future.
We are not going to spend a whole lot of time on basic OpsCenter however take a minute before jumping into the lab to poke around on the Reports tab. Some of the reports don’t return data (Enterprise Vault reporting) since we don’t have an EV system to report on, and other return data but it is hard to know what you are actually seeing (like the dedupe reporting). This next section will make you familiar with editing the canned reports to produce reports that make more sense.
OpsCenter Case Study – Why will you need Reporting and Alerting?
This HOL is based on a case study where you are the NetBackup Admin for Widgets Inc. You have been asked by your management to provide a number of daily and weekly reports about the health of the NetBackup environment. These reports are:
How many jobs were run last week on all Masters - emailed weekly
Overall success rate for all Masters over the last month - emailed monthly
A “View” report on how many Jobs the Western region is completing every month
compared to the Eastern region - emailed monthly
o Note: This report requires setting up a “View” that allows you to put whatever
grouping of information that makes sense to you together. For the lab we will
assume some of the Masters are in a West Coast data center and some are in an
East Coast data center
In order to make your life easier, you would like to automate the process of creating and emailing these reports to management.
In addition to the above reports, you want to get proactive about some of the issues you have seen, so you want to create some alerts for yourself:
When your catalog disk only has 5GB of free space
When a group of important Policies that back up the Finance Servers completes each
night with a Status Code other than “0” ( i.e. they failed)
This part of the lab is based on OpsCenter and can be run without an Analytics key. This part of the lab will walk you through creating these reports and automatically sending them, as well as creating alerts and Views and should take about 20 minutes to go through. The rest of the time will be spent on the Analytics portion.

4 of 21
Creating The Reports
Reports are used to gather information. You can use the “canned” reports, you can customize a canned report for your own use or you can create reports from scratch. This section of the lab will demonstrate using canned reports and editing the canned reports options. All report steps assume you are starting from the Reports page. Click on the Report Icon if you get lost.
1. Report 1 - Number of Jobs ran last week on all Masters
1. Click on Reports Icon 2. Expand Backup folder by clicking on the + 3. Expand Job Activity folder by clicking on the + 4. Single click on Job Count hyperlink 5. Hover over the Pie Chart to see the number of jobs per Media Server for the last
two weeks 6. Click on Show Chart as Table to show the total jobs per Media Server for the last
two weeks 7. Click on Edit Report 8. Change Relative TimeFrame to Previous 1 Weeks 9. Click Next 10. Click Next 11. Click Next 12. Under Report Name type “Weekly Jobs Total” 13. Click Public Reports to highlight it 14. Click Save 15. Click Finish
2. Overall success rate of all Masters each month
1. Click on Reports Icon 2. Expand Backup folder by clicking on the + 3. Expand Success and Status Rate folder by clicking on the + 4. Expand the Success Rate folder by clicking on the + 5. Single click on Success Rate – All Attempts hyperlink 6. Click on “Show Chart as Table” hyperlink below the Pie Chart 7. Click on Edit Report 8. Change Relative TimeFrame to Previous 1 Months 9. Click Next 10. Click Next 11. Click Next 12. Under Report Name type “Success Rate – Past Month” 13. Click Public Reports to highlight it 14. Click Save 15. Click Finish
3. A View into how many jobs were run in the West cost datacenter vs. the East coast data center.
1. Click on the Settings Icon next to Reports 2. Click on Views 3. Click on Add

5 of 21
4. Type “Data Centers” in the Name: box 5. Change View Type to Master Server 6. In the Description Box type “West Coast vs East Coast Jobs per month” 7. Check the Make the View Public box 8. Click OK 9. Click on “Manage Nodes and Objects” 10. Click on Add above “Data Centers” on the left 11. For Node Name type in “West Coast” 12. Click OK 13. Click Add above Data Centers again 14. For Node Name type in “East Coast” 15. Click OK 16. Click on East Coast to highlight it 17. Click on “Unassigned Objects” tab next to Objects on Node tab 18. Check the boxes next to nbu_mas22026 and nbu_mas17297. These will then be
designated as your masters in your “East Coast” data center. 19. Click Add to Node button 20. Click on West Coast to highlight it 21. Check the boxes next to selenium, scotch and mastermedia. These will then be
designated as your masters in your “West Coast” data center. 22. Click Add to Node button 23. Click Finish 24. Put a check in the box next to Data Centers 25. Click on the “Edit View Level Alias” button on the top bar 26. Change View Level 1 to “Region” and View Level 2 to “State”
This has successfully created a “View” called Data Centers and added Masters to both the West Coast “datacenter” and the East Coast “datacenter”. We can use this new View to create reports now:
1. Click on Reports Icon 2. Expand Backups folder by clicking on the + 3. Expand Job Activity folder by clicking on the + 4. Single click on Job Count hyperlink 5. Click on Edit Report 6. Change Relative TimeFrame to Previous 1 Months 7. Under Filters change Select View Name from “ALL MASTER SERVERS” to “Data
Centers” in drop down box 8. Note that boxes for East and West Coast are checked 9. Click Next 10. Change “Report On:” to “Region” by scrolling all the way to the bottom of the box
under “Views” 11. Click Next 12. Click Historical for a better looking bar chart 13. Click Next 14. Enter “Data Centers Jobs Report” in Report Name field 15. Highlight Public Reports 16. Click Save

6 of 21
17. Click Finish
Now, if you look on the left hand bar, you will see My Reports > Private and Public Reports and under Public Reports you will see the six reports you created. Clicking on those reports at any time will run a new report which can give you a quick overview of the information in the report. You can click on Historical for a different Bar Chart view if you like.
Creating Reporting Email Schedules
This section will walk you through creating a Monthly report and a weekly report and adding the reports you have created to each schedule, then adding a list of email recipients to send the reports to. Please note – we do not have a SMTP server set up, so you wont be able to actually email the reports. In the real world you would need to set up your an SMTP server by clicking on Settings > Configuration > SMTP Server.
1. To create the Monthly Report email schedule to send the number of jobs per Data Center report that we just created, do the following steps:
1. Click on Reports Icon 2. Click Schedules 3. Make sure “Report Schedules” tab is highlighted (default) 4. Click Add 5. Type “Monthly Report Emails” in Report Schedule Name 6. Choose PDF format
i. Note the other options available for sending the email reports 7. Click Next 8. Make sure “Create new Time Schedule” is checked 9. Click Next 10. Under Schedule Name type “NetBackup - Monthly Jobs Report” 11. Leave Select Format option set to “PDF” 12. Click Next 13. Leave check box in “Create new Time Schedule” 14. Click Next 15. Add Monthly Email to “Schedule Name:” box 16. Change Schedule Time to 08:00 17. Under Schedule Pattern click Monthly
i. Default is The 1st day of every 1 month(s) 18. Under Range of Recurrence select a start date of todays date and leave “No
end date” checked 19. Click Next 20. Check box next to Email
i. Note the other choice of exporting the report to disk 21. Add an email address of your choice (see note above about no SMTP server) 22. Add a Subject and Message of your choice 23. Click Next 24. Under Public Reports section, select the following Monthly reports
i. Data Centers Jobs Report ii. Success Rate – Past Month
25. Click Next, then Save then Finish
This has created a schedule so that on the first of the month at 08:00 these two reports will be run, converted to PDF and emailed to the recipients.

7 of 21
Similar steps would be used to create the weekly reports. If you have time after finishing the HOL, try to use the Monthly report steps above to create a weekly report and add the first report we created to it.
Creating Alerts
Alerts are similar to Reports except they are used to notify someone when a specific “thing” happens. Most OpsCenter (and previously NOM) customers used Alerts to let them know when the Catalog disk space was getting too full or when too many drives were down. This section will walk you through setting up a number of Alerts and sending them to an email address. The following Alerts will be created:
When your catalog disk only has 5GB of free space
When a group of important Policies that back up the Finance Servers completes
each night
o Note: This Alert can be used to monitor a select number of Clients to
make sure that they back up successfully each night. A good example
would be critical servers, or servers that have been having backup issues.
1. To create the Catalog Disk Space Alert
1. Click on Manage Icon 2. Default Tab is “Alert Policies” 3. You will see a default License Capacity Alert already created 4. On the right side, click Add 5. In the Name: area, type “Catalog Space Low Alert”. Enter a Description if you
like 6. Under Alert Condiiton select “Catalog Space Low” under Catalog area 7. Click Next 8. Under Threshold Value change to 5 and select GB from dropdown 9. Click Next 10. Check box next to ALL MASTER SERVERS 11. Click Next 12. Add an Email Recipient 13. Choose Major from dropdown box next to Alert Severity 14. Note the other options 15. Choose Major under Severity of emai/trap sent for cleared alert 16. Note the other options 17. Default is “Activate the Policy” 18. Click Save 19. Click Finish
Now, the next time the Catalog space has less than 5GB you will receive an email alert. Pretty cool eh?
2. To create the Job Completion Alert, perform the following.
1. Since you are still on the Alert Page, simply click Add 2. In the Name: area, type “Finance Servers Job Failure Alert” 3. Enter a Description if you like 4. Under Alert Condiiton select “Job Finalized” under Alert Condition area 5. Click Next

8 of 21
6. Leave the check box next to All 7. Typically in this scenario you would only want to know when jobs finish
without a “0” status (i.e. they failed), so type “0” in the Exit Status to Exclude box at the bottom
8. Click Next 9. To limit the Alert to a number of specific Policies, click on the + next to the
master called “mastermedia” to show the Policies associated with that master
10. Click on “Finance_Systems_Backup” policy 11. Click Next 12. Add an email recipient 13. Click Save
Now, any time this Policy runs and exits with any Status Code other than 0, you will receive an email so you can troubleshoot.
Client Coverage Reports
We have a lot of customers who want to know if they are currently protecting all of their Clients. We can “Sort of” do this, and it is pretty cool. When we say “sort of” it is because we need help from a third party of some type since we need to compare a list of Clients to a list of Clients that NBU (and thus OC) knows about. Most customers have a method of tracking Clients whether it is using CMDB, an Asset Management program or a simple spread sheet. OpsCenter can use a CSV file to compare all Clients included in a Policy vs. the Clients that should be included. This part of the lab will walk you through this.
1. Click on Reports 2. Click on Client Reports > Risk Analysis > Client Coverage 3. Click on Browse and locate the file Client Coverage.csv on the Desktop 4. Click on OK
The report that is generated is nice, but there is too much information in it. If you look at the “Message” column you will notice the first few entries state “In Backup and not in External List” and there are 35+ pages. Not helpful. So lets narrow it down a bit.
5. Click on Edit Parameters at the top left 6. Change Client Selection Criteria to “In external list and not in backup”
a. Bascially we are trying to see which Clients in the list are not part of any backup
7. Click Apply 8. You will now see four Clients that were in the list (out of six) that do not have any
Policies for backing them up. Obviously this report would need some “care and feeding” from the customer, and there is no way of knowing if the clients are actually being protected (there are other reports for that) but this is a very good way to match an Asset Tracking system to protecting of the clients being added.
OpsCenter - Final Thoughts
OpsCenter, and all the reporting/alerting you have seen in this Lab is free and included with NetBackup 7 as a separate installation. Since OpsCenter is free, we hope you will

9 of 21
encourage your customers to install it and use it to make managing NetBackup easier. It is recommended that OpsCenter be installed on a separate system if you are monitoring more than one Master, or if your Master is busy.

10 of 21
OpsCenter Analytics Lab To get you familiar with OpsCenter Analytics, here are the main differences between OpsCenter and OpsCenter Analytics:
OpsCenter OpsCenter Analytics
Can only report on a maximum of 60 days worth of job data.
Unlimited report time range.
Can create or modify the 100+ canned reports.
On top of the configurable out of the box reports, you can create reports from scratch using the custom report wizard, or through direct SQL access to the database.
Chargeback Reports
View building is done in the WebUI View Builder application can be used to create or automate creation of views.
Can report on NetBackup, NetBackup Puredisk, Backup Exec, and Enterprise Vault
Can additionally report on IBM Tivoli, and EMC Networker.
Creating Reports
There are three different ways of creating reports in OpsCenter Analytics. In order of increasing complexity, these are:
1. Use a canned report, and modify it to fit your needs as appropriate. 2. Create a report from scratch using the custom report wizard. 3. Create a report using custom SQL.
Since the OpsCenter HOL already focused on number one above, we will focus this lab on number 2 – using the custom report wizard – and go deeper into “Views” to really highlight the power of OpsCenter Analytics reporting beyond the “free” version. While Custom SQL is beyond the scope of this Lab there is a section on how to use a couple of scripts that have been created by the team in the SQL report creation area later on.
Views
Business level reporting is one of the key values of OpsCenter Analytics. Being able to move from clients, policies, master and media server-centric reporting to one where you look at your data protection environment from a business context is done through a concept called “Views”.
Views are basically a hierarchical grouping of hosts, policies or master servers that can be used when running reports to aggregate at, and/or filter at any such grouping. You can create many views, and a host, policy, or master server can appear in as many

11 of 21
views as you want. You are free to create a view to represent your data protection environment in any way you choose.
An example of a View would be a customer that has data centers (or remote sites) all over the world, but wants to be able to see what is going on at each “at a glance”. This part of the HOL demonstrates that by having hundreds of Clients lumped into geographic order. Check it out:
There have been three example views already created for you in this demo environment to demonstrate how they could be used and then a Hands On example on how they are created follows.
A “Geography” based view where hosts have been grouped into Continent->Country->City hierarchies. To see this information, perform the following steps:
1. Click Settings > Views 2. Click box next to Geography 3. Click Manage Nodes and Objects 4. Click on the + to expand folders
12 of 21
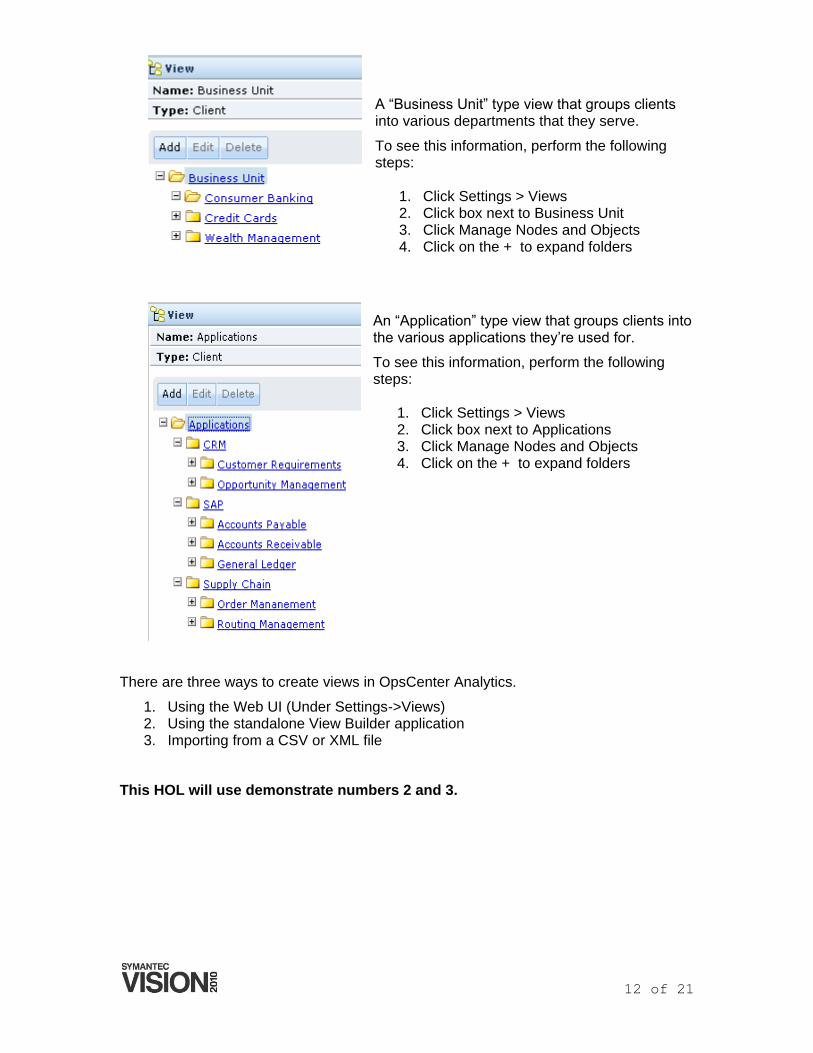
A “Business Unit” type view that groups clients into various departments that they serve.
To see this information, perform the following steps:
1. Click Settings > Views 2. Click box next to Business Unit 3. Click Manage Nodes and Objects 4. Click on the + to expand folders
An “Application” type view that groups clients into the various applications they‟re used for.
To see this information, perform the following steps:
1. Click Settings > Views 2. Click box next to Applications 3. Click Manage Nodes and Objects 4. Click on the + to expand folders
There are three ways to create views in OpsCenter Analytics.
1. Using the Web UI (Under Settings->Views) 2. Using the standalone View Builder application 3. Importing from a CSV or XML file
This HOL will use demonstrate numbers 2 and 3.

13 of 21
Viewbuilder Overview
View Builder is a java application that you can install on your desktop, and remotely connect to the OpsCenter server to create and modify views.
At this point, minimize your browser window, and click on the OpsCenter View Builder shortcut on the desktop. Start the application and login using the same credential you used for the WebUI (Username: admin Password: password in the OpsCenterUsers domain) Since the application can be used from a remote host, we need to also specify the hostname of the OpsCenter server (localhost). This should all be filled in for you.
Once you‟ve logged in, the first view that is available to your user will be automatically selected (Applications) but you will not see its layout until you hit the “Load Current View” icon in the menu bar.
Let‟s take a look at the “Geography” view.
1. Select “Geography” from the Views dropdown in the left pane. 2. Click “Load Current View” from the menu bar 3. Expand the view hierarchy by clicking on the + icons next to each
Continent/Country/City grouping 4. Click the “Unassigned Objects” tab on the right pane. 5. Click “Load Unassigned View” in the right pane.
a. You will see the “Information being processed” pop up as the data builds into the View
Lets say you had added more Clients to the overall NBU environment and you wanted to add them to their respective geography/data center. You can modify this view by dragging and dropping different Clients from the right hand pane, into the appropriate grouping on the left hand pane. Though entities can be put under any grouping within any level in the view, it usually makes sense to have all your assets in the lowest grouping in a hierarchy (City in this case)
1. Expand the view so you get to Americas->US->Chicago 2. Select multiple clients from the right hand pane by either holding down
Control key and select individual clients by clicking on them, or hold down the Shift key to select a range of hosts.
3. Drag and drop the hosts you‟ve selected under “Chicago”
Viewbuilder Excercise
Let‟s assume for the purposed of this Lab that we are a service provider that backs up all servers for all hotels in Las Vegas. Let‟s see how we can create a view called “Las Vegas”, where we categorize each backup client in categories such as “Hotel Rating” and “Hotel Name”.
1. Click on “Create View” icon on the menu bar. 2. Enter “Las Vegas” for the View Name. 3. Leave View Type as “Client” 4. Click OK 5. Right click on the blue “Las Vegas” entry on the left pane. 6. Click “Create Object” 7. Enter “5 Star” as Object name and hit OK 8. Right click on the blue “Las Vegas” entry on the left pane again.

14 of 21
9. Click “Create Object” 10. Enter “4 star” as Object name and hit OK 11. Repeat steps 8-10 to create “3 star” category 12. Right click on “5 star” and click “Create Object” 13. Enter “MGM Grand” and hit OK 14. Right click on “5 star” and click “Create Object” 15. Enter “Bellagio” and hit OK 16. Repeat steps 14-15 to fill in the following categories
a. “4 star” => “Flamingo” b. “4 star” => “Planet Hollywood” c. “4 star” => “Paris” d. “3 star” => “Sahara” e. “3 star” => “Tropicana”
17. Click on “Unassigned Objects” and drag and drop 10-20 hosts under each hotel.
18. NOTE: You will notice that as you drag them they are no longer “unassigned” so they disappear from the list.
This has demonstrated how easy it is to create groups of systems, areas, whatever you want to group using View Builder. Now that the View has been created, you would be able to use it in OCA as a method to pull reports on just those Clients.
Note: Obviosly from a customer perspective they would need to be familiar with this functionality and know what they wanted to report on before they started building custom Views but this demonstrates the flexibility and granularity of OC/OCA when it comes to creating customizations.
Importing Views
Creating views by hand with the View Builder was quick and easy, but you can see how this process can be slow when you have to deal with thousands of objects, especially if you already know how each host is to be categorized because you have a CMDB that keeps this information in a central place.
Let‟s see how View Builder can Import a view based on a CSV file.
On your desktop you will notice a “telco.csv” file. Go ahead and double click to open it. In this example, this would be a comma separate file listing out the location of a host, who is used in different aspects of a new Telecommunications division.
To import this view called “Telco” into our OpsCenter Analytics server, we simply go back to the view builder and do the following
1. Click on Actions in the menu bar 2. Click Import 3. Click Import Views 4. Browse to the Desktop and choose Telco.csv 5. Click Open
We wait a bit while the system finds the appropriate hosts that will make up the view and put them into appropriate categories.

15 of 21
Once done, you‟ll be able to select the “Telco” view and hit “Load Current View” to see its contents. You can use this import functionality to automate the entire view creation process.
Report on a View
Now that we‟ve created a couple of views, let‟s see how they can be used in our reports by going back to the Geography view that was already created and populated for you for demonstration purposes during this HOL. Nearly all of the reports in OpsCenter can have a View context applied to it. We are going to create a custom report showing the amount in GB restored for each country for “Americas” in our Geography View and compare that with the number of clients that have been restored. This “dual axis” report will show us data for the past 6 months grouped by month. This could be a very real report that a customer would want to create for their data centers if they charged by GB Restored (for example). If it not still active, restart the OpsCenter WebUI login by clicking on the icon.
1. Click on Reports icon. 2. Click Create New Report 3. Choose “Create a custom report” 4. Click Next 5. Choose “Backup/Recovery” in the Category selection 6. Choose “Backup Job/Image/Media” in Subcategory selection 7. Choose Historical in Report View Type 8. Click Next 9. Choose Relative Timeframe of last 6 months 10. Choose Time Frame Grouping of 1 month 11. Choose the “Geography” view in the “View” section 12. Leave all options checked 13. Choose “Job” in the filter section under View 14. Select “Job Type” in the Column dropdown, and choose “Restore” under
Value, then hit Add 15. Click Next 16. Change the “Report On:” drop down to “Continent” 17. Add in a Description if you like 18. Under X-Axis add a Display Name of “Month” 19. Make sure Report Data is set to “Job End Time” 20. Under the Y1-Axis, type “Restore Size” in Display Name 21. Change Report Data: to “Backup Job Size ” and the field next to it to “Total” 22. Leave Display Unit at GB and Chart Type as Stack Bar Chart 23. Uncheck “Show Forecast” and “Show trend” line 24. Check the “Y2-Axis” box 25. Type “Number of Hosts Restored” in the “Display Name:” box 26. Choose “Client Name” in the “Report Data” box and choose “Distinct” in the
second box. 27. Choose “Line Chart” for Y2-Axis Chart Type. 28. Click Next
a. You will now see the report you have created. The next steps will save it for future use.

16 of 21
29. Click Next 30. Under Report Name type “Restores By Continents” 31. Click Public Reports to highlight it 32. Click Save 33. Click Finish
If done correctly, what you should end up seeing is a chart like this one below:
What this is showing us is that, for example, in November 2009 we restored over 9TB of data (9,000+ GB) in the Americas back to about 42 Clients. A report like this could be very beneficial if a customer is trying to figure out how to allocate personnel resources between the continents.
Tabular Reports
One of the most powerful features of OpsCenter Analytics is the ability to build custom “Tabular Reports”. This method of reporting allows nearly complete customizable control of the report, however it is very difficult to understand until you have done a few of them and understand the options. It is, quite possibly, the second most powerful report generator besides custom SQL, but custom SQL is hard to understand.
You start with an “empty” report and add Columns that report on various bits of data. The filtering levels can get very granular with the reporting. This is both good and bad as adding too much data to the report without the proper safeguards (like reducing the amount of time for the report) can create a report that either takes a very long time to run, or will time out.
Please note! For some reason running Tabular Reports in a VM fails in many cases. They will run fine on a physical machine but fail in a VM. We are not sure why but this is one of the reasons we do not recommend running OC/OCA in a VM. Be careful when you try to demo this on your laptop VM in front of a customer.

17 of 21
Lets take a look at building a simple custom Tabular report for a customer. The case study will be a customer that wants the following information in a column report:
Know what jobs were successful in the past week for a specific Master and show the amount of time the backup took, and how large it was.
Obviously this is a very, very simple report but running anything more complex on a VM simply wont work. This will give you a feel for the power of the Tabular Report.
1. Click on Reports 2. Click on Create New Report 3. Click on Create a Custom Report 4. Leave the Report Category and Subcategory at default. If you like,
click on the down arrows for each to see the options. 5. Under Report View Type select” Tabular” and click Next 6. Change Relative Time Frame to Previous 1 Weeks 7. Under Filters, select Job 8. In the Column area, click the down arrow and scroll down till you see
“Job Type”. Choose it, the use the “=” Operator and choose a Value of “Backup”
9. Click Add to the right of the Value column to add another option 10. Back under the Column heading, choose “Job Status” leave the
Operator at “=” and choose “Successful” as the value 11. Click Add again to choose a final option 12. Back under the Column heading, choose “Master Server”, leave the
Operator at “=” and choose “STC Master Server” as the value i. Basically what we have done is limit the time to a week, only show
Backup jobs, only show jobs that completed with a Successful status and only show jobs from a specific Master
13. Click Next 14. Change the Time Basis to “Job Start Time” 15. Add a description if you like. Since the Master we are reporting on is
doing small backups, change the Display Unit to MB 16. Since the backups don‟t run for long, change the “Time Duration” to
“Minutes” 17. On the left under Available Columns choose all of the following and
click Add >> to move them under the Selected Columns area i. Client Name ii. Job Duration iii. Backup Job Size
1. Note – if you add them in a different order, you can use the “Move Up” and “Move Down” buttons to rearrange them
18. Now move to the right hand side where the fields were added for the next steps.
i. For Name click on Sort Order and change to Ascending ii. For Backup Job Size click on Sort Order and change to
“Descending” and click on Operation and change to “Total” iii. For Job Duration click on Operation and change to Total
19. Leave the rest at default and click on Next. It will take at least 30 – 45 seconds to return the report since it is going in and pulling information from the SQL database, then formatting it.

18 of 21
You should end up with a report that looks something like the one below. As you can see, on a physical system where Tabular Reporting works well there are many possibilities for report generation for our customers. This is one of the best reasons to buy OCA.
Custom SQL Reporting
OpsCenter Analytics offers the ability to use custom SQL scripting to pull reports. This is pretty advanced stuff and requires the customer to understand the SQL database structure, command calls and know how to make use of the Schema that we publish. Not for the faint hearted. While it is beyond the scope of this HOL to show you how to create a custom SQL report, we did want to show you what one looks like. If you are interested in doing this, follow these steps which should take just a few minutes.
Most customers who run dedupe are asking about “dedupe savings”. Is it really worth it? While the canned OC reports can show this at a glance, it doesn‟t really drill down into the data to truly show a nice table breakdown of the savings. Check out these custom SQL queries that really show it off.
1. Click on Reports 2. Click on Create New Report 3. Select Create a report using SQL Query 4. Click Next 5. On your desktop, locate a file named “OCA Custom SQL 1.txt and
open it with notepad 6. There is information about the script and what it will be doing to pull
the information in the top part of the .TXT file. Read it. 7. Highlight the text in the second paragraph starting at SELECT „Last 24
hours‟ all the way to the end 8. Copy this information and paste it into the SQL Report box 9. Click Next
What you will see is a report showing the dedupe information from the last 24 hours, seven days and a total. It shows how much information was “Pre Dedupe” and the breaks it down to how much was actually backed up. This is a powerful report for a customer who wants to know how much storage space is being saved by dedupe.
Now, lets say they want to see it per Policy. Check this out.
1. Click Back to get back to the box you pasted the report into 2. Open OCA Custom SQL 2.txt from the desktop

19 of 21
3. Copy the last paragraph starting again at the SELECT statement and paste it into the SQL report box
4. Click Next
This report shows you how much dedupe rate is being achieved per Policy. Pretty cool eh? As you can see, Custom SQL queries are very powerful, however they require a level of expertise with SQL that many of our customers do not have. Nor do we really have internal resources to help them figure it out. Our recommendation is to look at some of the samples, obtain our Schema and a SQL book and start playing with it. Attending a SQL class would also be beneficial if they are interested in really deep reports.
Extra Credit - Creating a Chargeback Report
If you still have time in the Lab, quite a few customers are interested in Chargeback reports. Chargeback reports are a great way to get insight into the true cost of data protection even if your internal practices don‟t allow you to bill your business unit for data protection services. Understanding costs is the first step in helping stakeholders people choose a rational level of service for their data protection needs.
1. Click the top level “Settings” tab. 2. Choose the “Chargeback” sub tab 3. Choose the currency from your home country.
a. Note: If your favorite currency is not listed, click “Edit Currency List” and add a currency. To add a currency highlight a currency in the “Global Currency” list on the left and click “Add” in the middle control. Then click “OK”. Click “Save” to retain your currency setting.
4. Click on “Cost Variable” tab, then click Add 5. Enter the variable name, “Backup Job Size”. Select Variable Metric “Job Size”,
and choose “Backup” as the “Job Type”. Leave the rest of the settings at default. 6. Select 01/01/2010 (January 1, 2010) as the “Date Range Start” and “Never” for
the “Date Range Ends” and keep the rate at 1.00 unit 7. Click “OK” to save. 8. While still in the “Cost Variable” tab, click Add again 9. Enter the variable name, “Restore Job Size”. Select Variable Metric “Job Size”,
and choose “Restore” as the “Job Type”. Leave the rest of the settings at default. 10. Select 01/01/2010 (January 1, 2010) as the “Date Range Start” and “Never” for
the “Date Range Ends” and keep the rate at 1.00 unit 11. Click OK to save
a. You should now see a Backup Job Size and Restore Job Size under Cost Variable
12. Click the Cost Formulae tab 13. Click “Add” to create a new formulae. 14. Enter “Visionary Formula” for the “Formula Name” 15. Select the Cost Variable of “Backup Job Size” and click “Add new cost variable”. 16. Select “Restore Job Size” and click “OK”. 17. Now let‟s make a report. Click on the Reports tab. 18. Expand the “Chargeback Reports” folder and choose the “Backup Chargeback”
report 19. You will be prompted for a Formula to use. Use the dropdown and choose
“Visionary Formula” and click “OK”.

20 of 21
20. The report displayed will show you one row per client, per day. While this is useful information, let‟s edit the report and see a more interesting view of the world. Click the “Edit Report” button.
21. Choose, “Previous 1 month” for the timeframe and group by “1 Month” in the “Time Frame Grouping” and choose the “Geography” view and click “Next”.
22. Choose Report on, “Continent” and then click “Run Report”. 23. Click “Show Chart as Table”.
You should end up with something like this which shows how much the backups are costing per month on each Continent based on how much we have told OpsCenter Analytics a backup is worth.
Final Thoughts
OpsCenter was available originally with NetBackup 7 – but you can also collect data from previous versions of NetBackup while you are in the process of upgrading. NetBackup 7.0.1 updated a lot of information available in the product as well as fixing a few bugs. While there is still some work to be done, the report names should not change in future versions. While there is a great deal of information available in the “free” version, to really unlock the power of reporting a customer will need to purchase OCA. If you have additional time please explore the OpsCenter user interface by clicking on the Monitor or Manage tabs. You should be able to create custom alerts, start and stop jobs, view policy history and freeze/unfreeze media on multiple servers, all from one user interface. We believe that reporting, alerting and monitoring can enable management by exception and proactive planning which can make your environment more manageable and predictable. As you leave, take a moment to reflect on the reports which would make it easier to manage your environment.
P.S. The NBU Product Management team at Symantec has scheduled webcasts for many of its product offerings that any customer (or SE for that matter) can register and

21 of 21
attend. Once a month we have an OpsCenter/OpsCenter Analytics live demo. Please visit www.netbackupdemo.com to register.