Embed Size (px)
Citation preview


SYMPHONY CCD Detection System
User’s Manual
Part Number 81071 Revision -

Copyright © July, 03 Jobin Yvon Inc., Optical Spectroscopy Division. All rights Reserved. Portions of the software described in this document Copyright © Microsoft Corporation. All rights Reserved.
No part of this document may be reproduced, stored in a retrieval system, or transmitted in any form by any means, including electronic or mechanical, photocopying and recording without prior written permission of Jobin Yvon Inc., Optical Spectroscopy Division. Requests for permission should be submitted in writing.
Information in this document is subject to change without notice and does not represent a commitment on the part of the vendor.
ii

Contents
PREFACE...................................................................................................................................VII
CHAPTER 1: SYSTEM DESCRIPTION AND SPECIFICATIONS.......................................1
CHAPTER 2: SYSTEM REQUIREMENTS ..............................................................................5 Input Power Requirements .......................................................................................................... 5 Environmental Requirements ...................................................................................................... 5 Ventilation Requirements ............................................................................................................ 5 Grounding and Safety Requirements........................................................................................... 6 Computer Requirements .............................................................................................................. 6 General Maintenance Requirements............................................................................................ 6
CHAPTER 3: DETECTOR SYSTEM INSTALLATION .........................................................7 Unpacking and Equipment Inspection......................................................................................... 8 Installing a 10/100 Network Interface Card (NIC).................................................................... 10 Configuring the NIC Internet Protocol (IP) Connection ........................................................... 11 Mounting the Symphony Detector to a Spectrograph ............................................................... 12 Connecting Electrical Interface Cables ..................................................................................... 13
CHAPTER 4: INITIAL POWER-UP AND OPERATION .....................................................17 Initial Power-up ......................................................................................................................... 17 CCD Focus and Alignment on the Spectrograph ...................................................................... 20 Modes of Data Acquisition........................................................................................................ 21
CHAPTER 5: TRIGGERING WITH A SYMPHONY CONTROLLER ..............................25 TTL Output 1: START EXPERIMENT.................................................................................... 25 TTL Output 2: SHUTTER or READOUT ................................................................................ 25 Synchronized Triggering to an External Event ......................................................................... 26
CHAPTER 6: TEMPERATURE CONTROL ..........................................................................29
CHAPTER 7: DETECTOR SYSTEM COMPONENT DESCRIPTION ..............................31
Symphony CCD Detectors ........................................................................................................ 31 Symphony Controller ................................................................................................................ 36 Controller External Interfaces ................................................................................................... 42 Shutter........................................................................................................................................ 47 Software..................................................................................................................................... 47
CHAPTER 8: POWERING DOWN AND DISASSEMBLY OF THE SYSTEM .................49
Power Down Procedure ............................................................................................................. 49 Disassembly of the Detection System ....................................................................................... 49
iii

Contents
CHAPTER 9: OPTIMIZATION AND TROUBLESHOOTING............................................51
Optical Optimization ................................................................................................................. 51 Spatial Optimization .................................................................................................................. 51 Reducing the Number of Conversions....................................................................................... 52 Environmental Noise Reduction................................................................................................ 52 Cooling ...................................................................................................................................... 53 Shutter........................................................................................................................................ 53 Power Interruption..................................................................................................................... 53 Software Cannot Recognize Hardware Configuration .............................................................. 54
APPENDIX A: MECHANICAL INTERFACE DRAWINGS ................................................57
APPENDIX B: CE COMPLIANCE MATRIX.........................................................................63
APPENDIX C: SHUTTER OPTIONS.......................................................................................65
APPENDIX D: PERFORMING ROUTINE PROCEDURES WITH SYNERJY.................69 CCD Focus and Alignment on the Spectrograph ...................................................................... 69 Triggering .................................................................................................................................. 72
APPENDIX E: LIQUID NITROGEN PRECAUTIONS & FILLING INSTRUCTIONS....75
SERVICE POLICY .....................................................................................................................77
RETURN AUTHORIZATION...................................................................................................78
WARRANTY................................................................................................................................79
GLOSSARY OF TERMS............................................................................................................81
INDEX...........................................................................................................................................93
iv

Contents
FIGURES
Figure 1. Symphony System Components...................................................................................8 Figure 2. Sample IP Configuration Properties Screen ...............................................................11 Figure 3. View of Symphony STE Detector Mounted to a Triax 320.......................................12 Figure 4. View of Symphony LN2 Detector Mounted to a Triax 320 .......................................12 Figure 5. Symphony STE CCD Detection System Electrical Interconnect Diagram................14 Figure 6. Symphony LN2 CCD Detection System Electrical Interconnect Diagram ................15 Figure 7. Example of a Focused and Aligned CCD...................................................................21 Figure 8. Timing Diagram for an Externally Triggered Single Acquistion Experiment ...........27 Figure 9. Timing Diagram for an Externally Triggered Multi-accumulation Experiment ........28 Figure 10. High Performance, Air-Cooled STE Series Symphony CCD Detector ...................32 Figure 11. High Performance LN2 Symphony CCD Detector.................................................. 33 Figure 12. Symphony Controller ...............................................................................................36 Figure 13. Illustration of 2 x 2 Binning Operation on a 4 x 4 CCD Array ................................41 Figure 14. Symphony Controller Front and Rear External Interfaces .......................................46 Figure 15. Symphony Controller ...............................................................................................57 Figure 16. STE CCD Detector Head..........................................................................................58 Figure 17. 1 Liter Side Mount LN2 Dewar for CCD Detectors .................................................59 Figure 18. STE Head Mounting Flange.....................................................................................60 Figure 19. LN2 Head Mounting Flange .....................................................................................61 Figure 20. Shutter Model 227MCD Diagram............................................................................65 Figure 21. Shutter Model MSL-TSHCCD Diagram..................................................................66 Figure 22. Shutter Model 1425MCD Diagram..........................................................................67 Figure 23. Shutter Model 23009030 Diagram ...........................................................................68
TABLES
Table I. System Level Specifications for the Symphony CCD Detection System ......................3 Table II. Individual Components for the Symphony CCD Detection System.............................9 Table III. State of System Status LEDs on Power-up................................................................17 Table IV. State of System Status LEDs After Symphony Firmware Initialization ...................19 Table V. Gain Options at 20 kHz Conversion Speed ................................................................38 Table VI. Gain Options at 1 MHz Conversion Speed ...............................................................38 Table VII. Symphony Controller SDRAM DIMM Module Offerings......................................39 Table VIII. Shutter Models ........................................................................................................48 Table IX. CE Compliance Tests and Standards.........................................................................63
v

Contents
vi

Preface
This manual explains how to install, operate, troubleshoot and maintain your Symphony CCD (Charge Coupled Device) Detection System, as well as describes salient features and overall system specifications. Information is also provided regarding the minimum system requirements necessary for successful system operation and optimum performance.
A glossary section, providing definitions of terms and essential topics related to array detection of spectra, is included at the end of the manual. The user is encouraged to read this section in its entirety.
Depending on the purchased system configuration, your system may contain more than one Jobin Yvon operating manual. The general guidelines presented below may assist you in finding the specific manual that is the most informative on a particular subject:
• Each manual generally covers a specific product along with the features and accessories particular to and/or contained within that product.
• Accessories that can be applied to other products are normally covered by separate documentation.
• Software that is exclusively used with one instrument or system is covered in the manual for that product.
• Software that can be used with a number of products is covered in its own manual.
• If you are reading about a product that interacts with other products, you will be referred to additional documentation as necessary.
vii

viii

Chapter 1: System Description and Specifications
Introduction Symphony CCD Detection Systems include a family of array detectors designed and manufactured by Jobin Yvon. These systems provide two-dimensional photo-detection, while offering outstanding sensitivity, high speed, low noise, ruggedness, durability and high reliability for a wide range of spectroscopic applications that include:
• Absorption spectroscopy
• Emission spectroscopy
• Extremely low signal level applications
• Raman spectroscopy
• Fluorescence
• Photoluminescence
• Recording spectra from multiple sources or locations that are imaged along the height of the spectrograph entrance slit
The primary components making up the Symphony CCD Detection System are:
• CCD Detector
• Detector Controller
• Spectroscopic Application Software
Jobin Yvon’s Symphony CCD Detectors utilize high quality scientific-grade sensors which offer an extensive selection of chip formats and sensor characteristics to meet the intended spectroscopic application. These CCD detectors are available with two cooling options:
• Super Thermoelectrically Cooled (STE series)
• Cryogenically Cooled (LN2 series).
1
System Description and Specifications
Coordination of all Symphony Detector functions is provided by the Symphony Controller, which supplies power, array temperature regulation, digital readout control and signal output conditioning for the CCD detector. The controller offers a modular, high technology architecture that is targeted for extremely low read noise and high-speed spectral/image acquisitions, allowing users to obtain optimum results in minimum time. Communication between the Symphony Controller and the host computer is achieved via a 10/100 Ethernet link, which guarantees 100% data transmission integrity. Additionally, the controller platform provides flexibility in selection and storage of detector parameters for X and Y binning, area definition, selection of various gains and pixel processing speeds and synchronization of data acquisition to an external system event via Trigger In/Out controls.
Integration of the Symphony Detector and Controller is provided by SynerJY™, Jobin Yvon’s spectroscopic application software. SynerJY is general-purpose data analysis and data acquisition software that provides a wide range of spectral and image acquisition modes while offering complete experimental control. Through this intuitive, user-friendly application software, end-users can easily conduct and define experiments, establish preferred settings, adjust hardware parameters and evaluate and analyze data.
Table I, on the following page, summarizes the system level capabilities of the Symphony CCD Detection System. A more detailed discussion of Symphony Controller and Detector Head options, as well as SynerJY software is provided in Chapter 7.
All Symphony equipment bears the international CE mark indicating compliance with the EMC Directive, 89/336/EEC and the Low Voltage Directive for Safety, 6950. This CCD detection system was tested to the above mentioned standards, and was found to comply with all specified requirements. Jobin Yvon (JY) guarantees the product line’s CE compliance only when original JY supplied parts are used. Appendix B provides a table of all CE Compliance tests and standards used to qualify this product.
2

System Description and Specifications
Table I. System Level Specifications for the Symphony CCD Detection System
System Parameter Units / Description Sensor
STE Series -70 °C (203 K) or better LN2 Series -133 °C (140 K) or better Resolution Step Size 0.1 °C
Operating Temperature
Long Term Stability ± 0.1 °C
Noise See Notes 1 and 2 Non-Linearity ± 1 % Full Well Capacity See Notes 1 and 2 Effective Dynamic Range See Notes 1 and 2 Dark Current See Notes 1 and 2
Pixel Processing ADC Precision 16 Bit ADC Dynamic Range 65, 535 maximum Data Conversion Speed 20 kHz to 1 MHz programmable via software Gain Settings (Note 3) 0.6X, 1X, 2X, 4X and 8X programmable via software Binning and ROI Supports flexible binning patterns and areas programmable via software Exposure Time 0.001 s minimum to 49.71 days maximum Vertical Clock Speeds 12 µs – 48 µs programmable via software, See Note 2
Electrical Interfaces Host Communication Link 10/100 Ethernet providing 100% Guaranteed Data Integrity Supporting
full/half duplex modes with auto-negotiation
Detector Video Control SCSI-type interface for Detector Head power, CCD digital control and video output analog conditioning.
Detector Cooling Control D-style connector interface for cooler power, shutter control, temperature sensing and fan power.
External Trigger Input TTL level signal, programmable rising/falling edge triggering via software
TTL Output 1 TTL level signal, configurable output and polarity via software Signal 1: Start Experiment
TTL Output 2 TTL level signal, configurable output and polarity via software Signal 1: Shutter Signal 2: Readout
3
System Description and Specifications
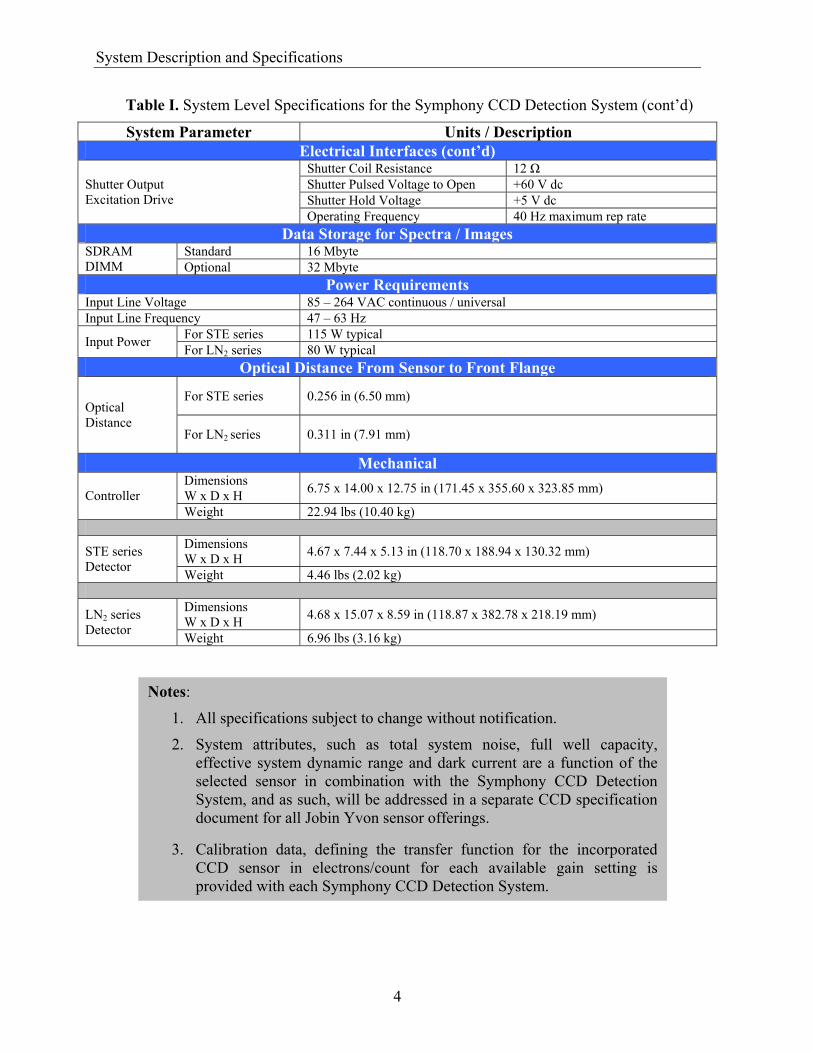
Table I. System Level Specifications for the Symphony CCD Detection System (cont’d)
System Parameter Units / Description Electrical Interfaces (cont’d)
Shutter Coil Resistance 12 Ω Shutter Pulsed Voltage to Open +60 V dc Shutter Hold Voltage +5 V dc
Shutter Output Excitation Drive
Operating Frequency 40 Hz maximum rep rate Data Storage for Spectra / Images
Standard 16 Mbyte SDRAM DIMM Optional 32 Mbyte
Power Requirements Input Line Voltage 85 – 264 VAC continuous / universal Input Line Frequency 47 – 63 Hz
For STE series 115 W typical Input Power For LN2 series 80 W typical Optical Distance From Sensor to Front Flange
For STE series 0.256 in (6.50 mm) Optical Distance
For LN2 series 0.311 in (7.91 mm)
Mechanical Dimensions W x D x H 6.75 x 14.00 x 12.75 in (171.45 x 355.60 x 323.85 mm) Controller Weight 22.94 lbs (10.40 kg)
Dimensions W x D x H 4.67 x 7.44 x 5.13 in (118.70 x 188.94 x 130.32 mm) STE series
Detector Weight 4.46 lbs (2.02 kg)
Dimensions W x D x H 4.68 x 15.07 x 8.59 in (118.87 x 382.78 x 218.19 mm) LN2 series
Detector Weight 6.96 lbs (3.16 kg)
Notes:
1. All specifications subject to change without notification.
2. System attributes, such as total system noise, full well capacity,effective system dynamic range and dark current are a function of theselected sensor in combination with the Symphony CCD DetectionSystem, and as such, will be addressed in a separate CCD specificationdocument for all Jobin Yvon sensor offerings.
3. Calibration data, defining the transfer function for the incorporatedCCD sensor in electrons/count for each available gain setting isprovided with each Symphony CCD Detection System.
4

Chapter 2: System Requirements
The Symphony CCD Detection System has minimum system requirements that are necessary for successful operation and optimum performance. Issues related to system attributes such as input power, physical environment, ventilation, grounding/safety, host computer requirements and general maintenance are covered in detail.
The user is encouraged to read this chapter in its entirety prior to installing and powering up the detection system.
Input Power Requirements The Symphony Controller operates from universal AC single-phase input power over the range of 85 to 264 VAC with a line frequency of 47 to 63 Hz.
This AC power is applied to an input power entry module located on the rear controller panel. A 10 Amp Slow Blow fuse is incorporated in this entry module to protect against line disturbances/anomalies outside of the above mentioned input power range.
The power consumption for the complete Symphony CCD Detection System is nominally 115 watts with STE series thermoelectric detector heads and 80 watts typical for LN2 detector head variants.
Environmental Requirements • Storage temperature from -25 °C to +85 °C
• Operating ambient temperature range +25 °C ± 5 °C
• Relative humidity ≤ 80% non-condensing
Ventilation Requirements Fans are incorporated in both the Symphony Controller and Detector Head to cool the enclosed electronics and maintain optimum system performance. Care should be taken to ensure that the ventilation slots on both the detector head and controller are free from obstruction in order to maintain an adequate level of air flow for proper operation.
5

System Requirements
Grounding and Safety Requirements The following precautions should be observed to prevent possible damage to the Symphony CCD Detection System:
• The detection system should only be operated indoors.
• Prior to the application of power, ensure that the ground prong on the controller’s input power cord is properly connected to a wall outlet or power strip that provides for a protective earth ground connection.
• Never connect or disconnect any cables to or from the controller/detector head while the system power is on.
Computer Requirements The Symphony CCD Detection System is configured and controlled via Jobin Yvon’s SynerJY software. To successfully install SynerJY, the end-user’s computer system must be equipped with the following:
Software • Windows 2000 or Windows XP operating system
Hardware • Meets minimum requirements for running Windows 2000 or Windows XP
• 128 Mbyte RAM
• 200 Mbyte disk space
• One free, dedicated Ethernet Network Interface Card (NIC) connection (no hubs)
General Maintenance Requirements Users are recommended to periodically clean the Symphony Detector and Controller by wiping them down with a clean, damp cloth. From an electro-static discharge (ESD) perspective, this procedure should only be performed on external surfaces after all supplied ESD covers for both units have been re-affixed to their respective electrical interfaces. Do not use any solvents, soaps, or abrasives when cleaning components as these products can damage surface finishes.
6

Chapter 3: Detector System Installation
Before the operational power-up phase of Chapter 4, you will need to go through the process of successfully installing and setting up your Symphony CCD Detection System. It is recommended that you read this chapter thoroughly and follow the outlined steps exactly as specified to ensure success.
This chapter discusses the following installation tasks in the order listed:
• Unpacking and Equipment Inspection
• Installing a 10/100 Network Interface Card (NIC)
• Configuring the NIC Internet Protocol (IP) connection
• Installing SynerJY spectroscopic application software
• Mounting the Symphony Detector to a spectrograph
• Connecting electrical interface cables
.
CAUTION
Electrostatic discharge (ESD) may damage components of the Symphony CCD Detection System if proper precautions are not taken. The sensor, detector head electronics and controller are all very sensitive to ESD. Jobin Yvon recommends that the installer stand on a conductive mat and wear a grounded ESD wrist strap during installation. The computer must be turned off; however, its power cord should be connected to a grounded outlet to provide a proper chassis to earth ground.Note:
It must be emphasized that the Jobin Yvonwarranty on the Symphony CCD DetectionSystem does not cover damage to the sensor orthe system’s electronics that arises as a result ofimproper handling including the effects ofelectrostatic discharge (ESD).
7

Detector System Installation
Unpacking and Equipment Inspection Carefully unpack your new Symphony CCD Detection System, examining each component for possible shipping damage. Figure 1 below depicts all system components, including the manual and interconnecting cables that make up a Symphony STE CCD Detection System.
--------
Controller
----------------------------------------------------------------------------------------
Detector Video Cable
TE Cooler/Shutter Cable
AC Power Cord
Ethernet Crossover Cable
BNC Shutter Cable
SynerJY Software
User’s Manual
Network Interface Card
STE Detector Head
Figure 1. Symphony System Components
8

Detector System Installation
Symphony CCD Detection Systems consist of the following parts specified in Table II below:
Table II. Individual Components for the Symphony CCD Detection System Item
# Component Description Jobin Yvon Part Number
20 kHz only Symphony – Solo 1 Symphony Controller 20 kHz – 1 MHz Symphony – Solo – Fast
For STE version CCD-XXX-XXX-STE 2 Symphony CCD Detector Head For LN2 version CCD-XXX-XXX-1LS
Desktop 973078 3 10/100 Ethernet Network Interface Card Laptop 973079
For STE version 980058 4 Detector Video Cable, 6 Ft For LN2 version 980059
For STE version 400424 5 TE Cooler / Shutter Cable, 6 Ft For LN2 version 400493
6 Ethernet Crossover Cable, 6 Ft 980047
7 SynerJY Spectroscopic Application Software CSW-SYNERJY
110 V 98015 8 AC Power Cord 220 V 98020
4 ft Standard 352470 8 ft 30646 9 BNC Shutter Cable 2 ft 31936
10 Symphony User’s Manual 81071
9

Detector System Installation
Installing a 10/100 Network Interface Card (NIC) In order for the PC to communicate with the Symphony Controller, a dedicated 10/100 Ethernet Network Interface Card (NIC) must be installed in the host computer. If you are connected to your company’s Local Area Network (LAN), installation of a 2nd NIC is required. The following procedure explains how to install a NIC in the operating PC. Please review the documentation for the operating computer and NIC prior to installation. Refer to the Ethernet NIC manual for additional instructions and information.
Note: Symphony Controller software is only supportedby Windows 2000 and Windows XP.
PCI 10/100 Ethernet Card Installation – Desktop PC 1. Make sure that the PC power is turned off.
2. Unplug the PC power cord.
3. Remove the PC cover.
4. Place the open computer frame on its side with the motherboard facing up.
5. Looking at the motherboard, locate the PCI expansion slots.
6. Locate an empty PCI slot and remove the slot cover.
7. Carefully insert the NIC into the empty PCI slot. Press firmly to ensure that the card is fully seated in the slot.
8. Replace the PC cover and plug in the power cord.
PCMCIA 10/100 Ethernet Card Installation – Notebook/Laptop PC 1. Make sure that the PC power is turned off.
2. Unplug the PC power cord.
3. Locate the PCMCIA slots on the side of the computer.
4. Carefully insert the PCMCIA NIC into the top or bottom PCMCIA slot. Press firmly to ensure that the card is fully seated in the slot.
5. Plug in the power cord.
10

Detector System Installation
Configuring the NIC Internet Protocol (IP) Connection To configure your NIC for the Symphony CCD you must access the TCP/IP configuration (after NIC installation):
1. From the operating PC, click the Start menu and select Settings.
2. Click Control Panel and select Network Connections.
3. Right-click Local Area Connection then select Properties. Click TCP/IP Configuration.
The Symphony controller has the IP address 172.16.0.1. Enter 172.16.0.2 as the IP address for your computer network card which is dedicated to communication with the Symphony Controller (NOT your local network). If necessary, the last digit of the computer network card IP address can be changed from 2 to any digit other than 1. See Figure 2 below for an example of how your IP Configuration Properties screen should look.
Figure 2. Sample IP Configuration Properties Screen
Note:
Verification of proper Network ConfigurationSet-up (just performed) is discussed in Chapter 4as part of the initial Power-up procedure.
11

Detector System Installation
Mounting the Symphony Detector to a Spectrograph Symphony array detectors can be fitted to most Jobin Yvon or Spex spectrometers that are equipped with a spectrograph exit port. The detector must be mounted in the correct orientation in order to perform properly. The following is a standard procedure for mounting a Symphony detector to a Triax or M-Series spectrograph. Other spectrograph models may require a different mounting orientation. Please contact Jobin Yvon customer service if you need assistance mounting your Symphony Detector to a spectrograph.
To mount the detector to the spectrograph:
1. Remove the protective plastic cap from the front flange of the detector head.
2. Prepare the spectrograph for mounting of the detector by loosening the mounting screw on the multi-channel adapter mount.
3. For STE systems, carefully pick up the detector head so that the blue Symphony name panel, located on the side of the detector head, is horizontal with text facing upright. For LN2 systems, carefully pick up the detector head so that the blue Symphony name panel, lo-cated on the side of the detector head is vertical with text facing upright. Make sure that the outermost part of the flange is even with the adaptor mount and that the sensor is aligned along the optical axis of the spectrometer. Figure 3. View of Symphony STE Detector
Mounted to a Triax 320
Figure 4. View of Symphony LN2 Detector Mounted to a Triax 320
12

Detector System Installation
4. Slightly tighten the mounting screw so that the detector head is securely
positioned at the focal plane of the spectrometer. To fine-tune this adjustment, refer to the section on Focusing and Alignment.
Connecting Electrical Interface Cables Electrical connections are defined below for interconnecting the major components of the Symphony CCD Detection System, as well as the required interface connections to the host computer and spectrometer.
It is recommended that the end-user follow the interconnection steps listed below in the order given and adhere to the ESD precautions specified in the beginning of this chapter.
1. Connect the AC power cord to the Input Power Entry Module located on the rear of the Symphony Controller.
2. Connect the wall outlet end of the AC power cord into a properly grounded outlet to provide a proper chassis to earth ground. Do not turn power on to the unit.
3. With the host computer off, connect the communication link between controller and computer by inserting one end of the Ethernet Crossover Cable (P/N 980047) into the 10/100 Ethernet RJ-45 connector located on the rear of the Symphony Controller and the other end into the computer’s RJ-45 connector located on the dedicated Network Interface Card (NIC) installed earlier in this chapter.
4. Remove the ESD protective caps on the interface connectors for the Symphony Detector and on the controller’s CH 1 Detector Cooling and CH 1 Video interfaces.
CAUTION
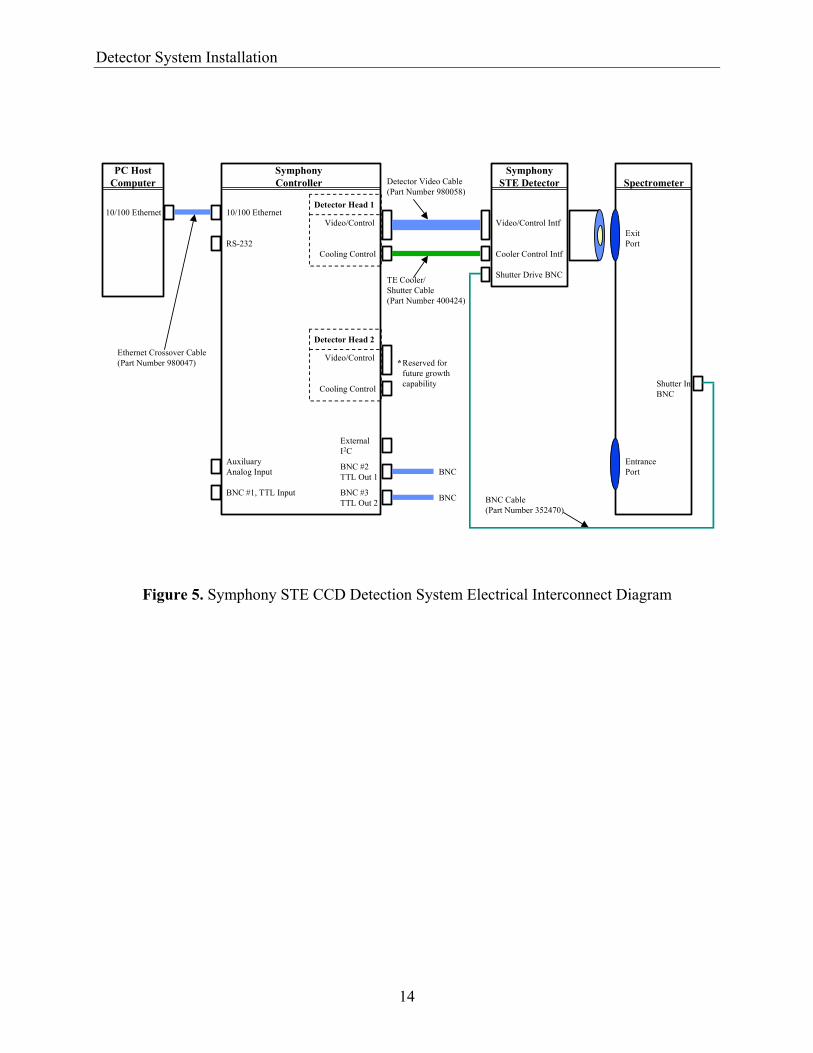
The provided ESD protective caps should be placed on the Symphony Controller and Detector units whenever they are disconnected to prevent Electrostatic Discharge (ESD) damage.5. Connect the 68-pin Detector Video Cable between the controller and detector as illustrated in Figures 5 and 6.
6. Connect the 25-pin TE Cooler/Shutter Cable between the controller and detector as illustrated in Figures 5 and 6. Tighten all screws and/or slide the locking mechanism latch on each connector to ensure a tight connection to the interfacing unit.
7. Connect the BNC Shutter Cable (P/N 352470) to the Detector Head’s BNC port. Connect the remaining end to the BNC receptacle on the spectrograph as illustrated in Figures 5 and 6.
13
Detector System Installation
PC HostComputer
SymphonyController
10/100 Ethernet
RS-232
AuxiluaryAnalog Input
BNC #1, TTL Input
Video/Control
Cooling Control
Detector Head 1
Video/Control
ExternalI2C
BNC #2TTL Out 1
BNC #3TTL Out 2
BNC
BNC
SymphonySTE Detector
Video/Control Intf
Cooler Control Intf
Shutter Drive BNC
10/100 Ethernet
Detector Head 2
Cooling Control
Reserved for future growth capability
* Ethernet Crossover Cable(Part Number 980047)
TE Cooler/Shutter Cable(Part Number 400424)
Spectrometer
Shutter InBNC
ExitPort
EntrancePort
Detector Video Cable(Part Number 980058)
BNC Cable(Part Number 352470)
Triax 320
Figure 5. Symphony STE CCD Detection System Electrical Interconnect Diagram
14

Detector System Installation
PC HostComputer
SymphonyController
10/100 Ethernet
RS-232
AuxiluaryAnalog Input
BNC #1, TTL Input
Video/Control
Cooling Control
Detector Head 1
Video/Control
ExternalI2C
BNC #2TTL Out 1
BNC #3TTL Out 2
BNC
BNC
10/100 Ethernet
Detector Head 2
Cooling Control
Reserved for future growth capability
* Ethernet Crossover Cable(Part Number 980047)
Right Angle TE Cooler/Shutter Cable(Part Number 400493)
Spectrometer
Shutter InBNC
ExitPort
EntrancePort
Right Angle Detector Video Cable(Part Number 980059)
BNC Cable(Part Number 352470)
SymphonyLN2
DetectorHead
Triax 320
Figure 6. Symphony LN2 CCD Detection System Electrical Interconnect Diagram
15

Detector System Installation
16

Chapter 4: Initial Power-up and Operation
This chapter serves to acquaint the end-user with the steps necessary to initially power-up and successfully begin to acquire spectra with the Symphony CCD Detection System. In addition, detector head issues related to proper CCD focusing and alignment to a spectrograph are discussed in detail.
A brief summary of the various data acquisition modes available to the end-user is also provided.
Operation of the Symphony CCD Detection system is predominantly controlled by software, and as such, requires experimental setup and equipment configuration via SynerJY application software. Please refer to the SynerJY documentation for information related to proper experiment set-up if needed.
Initial Power-up 1. Check that all system cables interfacing to and from the overall detection system
are properly connected.
2. Verify that the Symphony Controller, computer, spectrograph and any additional supporting equipment are connected properly to AC input power.
3. Turn power on to the Symphony Controller by pressing in the power switch located on the controller’s front panel.
Once the power switch is activated, system status LEDs located on the front panel of the Symphony Controller will be on for approximately 30 seconds as specified in Table III below. After this initial 30 second interval, the LEDs will begin to blink at a 1 Hz rate, providing visual indication to the end-user that the Symphony CCD Detection System is awaiting the download of its firmware as described in step 6.
Tabl
System Status LE
Power
STE serieTE1
Status LN2 serie
Ext Trigger Read
Note:
This 1 Hz “LED blinking” mode of operation isnormal and should not be interpreted as a systemanomaly.
e III. State of System Status LEDs on Power-up D State Status Description
GREEN Indicates power to the Symphony CCD Detection System is on.
s s RED Indicates thermoelectric cooling is OFF
y OFF Function disabled
17

Initial Power-up and Operation
4. Turn power on to the Host computer, spectrograph and any other additional
supporting equipment.
5. Verify a proper network configuration set-up for the controller (the network connection was configured in Chapter 3).
Proper network configuration can be verified by performing a name or address test (Ping) to see if there is an IP-based connection between the host computer and the named/addressed device.
• From the Start menu of the operating computer, click Run.
• Confirm the address of the Symphony Controller by typing “ping 172.16.0.1” at the command prompt. Successful network configuration will be indicated by the response:
Reply from 172.16.0.1 = bytes =32 time < 1ms TTL =255 Reply from 172.16.0.1 = bytes =32 time < 1ms TTL =255 Reply from 172.16.0.1 = bytes =32 time < 1ms TTL =255 Reply from 172.16.0.1 = bytes =32 time < 1ms TTL =255
Note: If a proper “ping” response is not obtained whenquerying the Network IP address or device name,please return to Configuring the IP Connection ofChapter 3.
6. Prior to starting SynerJY software, you must run the Hardware Initialization program. This program loads the firmware to Symphony and should be initialized for every power-up cycle of the instrument. To run the Symphony Initialization program:
• Select Programs from the Start menu of the operating computer.
• Click Jobin Yvon then select Symphony Initialization to run the program.
Note:
Prior to running the Symphony Initializationprogram, the system status LEDs located on thefront panel of the Symphony Controller will blinkat a 1 Hz rate. It must be emphasized that failureto run the Hardware Initialization program priorto starting SynerJY application software willresult in a “Hardware Device Not Found”message since the software cannot recognize avalid hardware connection.
18

Initial Power-up and Operation
Upon execution of the Symphony Initialization program, the controller’s front panel LEDs will blink at a faster rate during the actual download period. Once the firmware has been successfully loaded, the system status information provided by these LEDs will be as specified in Table IV below.
Table IV. State of System Status LEDs After Symphony Firmware Initialization
System Status LED State Status Description
Power GREEN Indicates power to the Symphony CCD Detection System is on.
STE series GREEN Indicates thermoelectric cooling is enabled and functioning properly TE1
Status LN2 series RED Indicates thermoelectric cooling is OFF. Please note that this is normal since TE cooling is not required for LN2 operation.
OFF Function not enabled via SynerJY software
Ext Trigger Ready GREEN Indicates that the system is ready to receive an external trigger.
7. Start SynerJY application software.
8. If the CCD Detection System includes an LN2 Detector Head, carefully fill the dewar with LN2. The dewar should only be filled after power has been applied to the controller and SynerJY has initialized the overall detection system.
Liquid Nitrogen requires special handling and should only be handled by trained users. Please read Appendix E in its entirety for LN2 precautions and filling instructions.
Note:
For LN2 Cooled Detector Heads, it will takeapproximately 30 to 40 minutes from the start ofdetector cooling until it reaches its targettemperature. Symphony STE Cooled DetectorHeads will reach their operating temperature in15 to 20 minutes. It should be also noted that theabove mentioned time durations will varysomewhat according to the size of the CCD chip.For the best results with the most demandingmeasurements, it is best to allow 60 to 90 minutesfor the CCD chip temperature to stabilizecompletely.
CAUTION
19

Initial Power-up and Operation
CCD Focus and Alignment on the Spectrograph The Symphony CCD detector can be mounted on most standard imaging spectrographs. Consult your spectrometer manual to determine the correct mounting orientation. Refer to Appendix D for a more detailed focus and alignment procedure using SynerJY software.
Before starting this procedure, make sure that:
1. Software is installed and running
2. CCD detector head is properly mounted on the spectrograph
3. CCD detector is cooled to the correct operating temperature
1. Attach a spectral line source, such as a mercury lamp, to the instrument entrance slit.
2. Using the software, make the slit as narrow as possible on the detector. This will allow determination of the best focus.
3. From the software, enter a reference wavelength. Set the detector to Spectral Acquisition mode. Set the data to display as signal intensity (Y-axis) vs. pixel position (X-axis).
4. Set the Integration Time to 0.1 second or less, and run continuous spectral acquisition. While continuously running, adjust the Integration Time until the observed signal is approximately 40,000 counts.
5. View the spectra. A focused, aligned CCD will provide a distinct peak of large amplitude, generally symmetrical to the limits of the design of the spectrometer. The peak should be less than or equal to 5 pixels wide across the Full Width of Half the Maximum height (FWHM). Excessive asymmetry of the peak is a sign that the slit image is not aligned to the pixel columns; diminished shape and magnitude are symptomatic of defocusing.
6. Stop the acquisition
7. Set the Area List to five equal areas.
8. Run the experiment continuously at the initial reference wavelength.
9. When aligned, the 5 spectra will overlap, displaying similar intensity. Each pixel should be 5 pixels wide at FWHM (see Figure 7 on the following page). If alignment must be adjusted, loosen the multi-channel adaptor mounting screw and rotate the detector head right or left in the focal plane, continuously acquiring spectra until the desired result is observed.
20

Initial Power-up and Operation
10.Once the CCD has been focused and aligned, tighten the CCD adaptor mounting screw to securely position the detector head.
Figure 7. Example of a Focused and Aligned CCD
Modes of Data Acquisition The Symphony CCD Detection System allows for a variety of data acquisition modes. The correct acquisition mode will depend on the experiment being performed and the data format required by the user. Data acquisition modes and experimental parameters are selected by the end-user via SynerJY software.
This section contains a brief description of the acquisition modes currently supported by Symphony systems. Also provided, is a description of acquisition parameters required to run each type of experiment. The following page provides a detailed description of the acquisition parameters.
Center Wavelength In a Center Wavelength experiment, the spectrometer is set to a specific grating position by the software. When the experiment is run, the CCD collects data only from the wavelengths of light that reach the CCD detector. Each column of the CCD is then mapped to a single wavelength. This data can be viewed as spectral or image data.
Spectral Data
Spectral experiments can be defined to have multiple areas of interest on the CCD array. In such experiments, each area produces a single spectrum.
Center Wavelength spectral data is obtained when the signal is binned or summed along each column in a selected area during acquisition. The resulting data set is a spectrum with a signal intensity value for each column of pixels or group of binned columns. The intensities are then recorded and displayed according to the user’s preference as either a function of pixel number or as a function of the wavelength assigned to each pixel.
21

Initial Power-up and Operation
Required Parameters: Areas, X-Binning, Integration Time, Accumulations, Gain and ADC Speed.
Image Data
Image experiments can be defined to have multiple areas of interest on the CCD. In such experiments, each area results in a separate image.
Center Wavelength image data is collected by recording the signal of each individual pixel or binned group of pixels on the CCD array. The resulting set of data is a 3-Dimensional plot of Intensity as a function of X position and Y Position. For the Symphony CCD Detection system, the X axis corresponds to wavelength and data can be recorded and displayed on the X axis as a function of pixels or wavelength. The Y axis represents the height position along the entrance slit of the spectrometer.
Required Parameters: Areas, X-Binning, Y-Binning, Integration Time, Accumulations, Gain and ADC Speed.
CCD Range In a CCD Range experiment, the spectrometer is set to acquire data throughout a wavelength range which is selected by the end-user via SynerJY software. When the experiment is run, the spectrometer’s grating rotates to collect data in sections, with each section representing a different wavelength range. There is a small overlap at the edges of each section. Once all data is collected by the detector, the individual sections are combined to produce a single spectrum.
Required Parameters: Areas, X-Binning, Integration Time, Accumulations, Gain and ADC Speed.
Note: CCD Range mode experiments are onlysupported under SynerJY software. For moreinformation, please refer to the SynerJY softwaremanual.
Time Based Experiment Time Based experiments collect data as a function of time. The experiment itself is identical to a Center Wavelength experiment, except that the experiment is repeated throughout a specified time period and the data stored as a function of time.
Required Parameters: Areas, X-Binning, Y-Binning, Integration Time, Accumulations, Gain, ADC Speed and Time Interval.
22

Initial Power-up and Operation
Triggering External Triggers may be used to synchronize experiments. Triggers can be implemented to start an experiment sequence or can be used on each individual accumulation. Please refer to Chapter 5 for a more detailed discussion on triggering with the Symphony CCD Detection System.
Acquisition Mode Parameters
•
•
•
•
•
•
•
•
Areas – definition of the active sections of the CCD detector. Signals that encounter sections of the CCD that are not part of an active area are not recorded. Once an area is specified, the area definitions refer to the number of areas and the size of the areas.
X Binning – number of columns combined to form a single data point. By combining columns, a greater signal level can be detected; however, this results in a decrease in resolution.
Y Binning – number of rows combined to form a single data point. By combining rows, a greater signal level can be detected; however, this results in a decrease in resolution.
Integration Time – amount of time the CCD is exposed to light and acquires data.
Accumulations – number of repetitions for which the detector collects data and averages the results to obtain a better signal-to-noise ratio.
Gain – sets the ratio of actual photoelectrons recorded by the detector to the reported number of counts by the detector system.
ADC Speed selection– sets the rate at which the data is read off the CCD detector. For maximum signal to noise, the ADC speed should be set to 20 kHz. For maximum frame rates, the ADC speed selection should be set to 1 MHz.
Time Interval – the elapsed time between the start of one accumulation to the start of the next accumulation. The Time Interval, Integration Time and Readout Time of the CCD detector have the following relationship:
t interval ≥ t integration + t read
23

Initial Power-up and Operation
24

Chapter 5: Triggering with a Symphony Controller
The Symphony CCD Detection System provides a versatile platform with respect to synchronizing to the end user’s experimental equipment. All Symphony Controllers provide three TTL level I/O signals, via BNC connectors on the rear of the unit, for monitoring and/or control of various user accessories.
Two of the three available BNC connectors are dedicated for TTL output signals, while the remaining BNC connector is associated with the TTL level Trigger input function. Each BNC output connector provides the end user with the ability to select, via Jobin Yvon’s SynerJY software, one of two available signals for use in the experiment as follows:
TTL Output 1: START EXPERIMENT The START EXPERIMENT signal indicates the start of an experiment. Upon receipt of a “Start Acquisition” command, this output goes to its active state after completion of its present CCD array cleaning cycle. For time based operation, this output remains active until all spectra have been taken and then returns to its inactive state.
TTL Output 2: SHUTTER or READOUT SHUTTER The SHUTTER signal provides status with respect to shutter operation and is activated during the interval when the CCD is being exposed to light.
READOUT The READOUT signal indicates when the CCD is being read out. Upon completion of the CCD integration (expose) period, this output goes to its active state and remains there until the CCD has been completely read out.
Note:
Refer to Appendix DTTL level I/O signals.
Each selected output signal can also beconfigured, via software, for a specific polaritywhere the active state can be either a logic high(5V) or logic low (0V) to meet the needs of theexperiment.
for additional information regarding enabling/configuring these
25

Triggering with a Symphony Controller
Synchronized Triggering to an External Event Acquisition of image or spectral data can be initiated and synchronized to an external system event by using the Symphony Controller’s Trigger Input capability. This TTL input line uses edge triggering, which is user programmable via software control to recognize positive or negative edge triggered events. This external triggering capability can be used to activate the start of each experiment, as well as, to initiate each acquisition of an experiment involving multi-acquisitions.
In conjunction with the external trigger capability offered by the Symphony CCD Detection System, the Symphony Controller provides an “Ext Trigger Ready” status LED for the end user while in this mode of operation. When illuminated, this status indicator provides visual confirmation that the system is ready to accept an external trigger input pulse.
It should be noted that once the Symphony Controller has recognized a valid external trigger pulse, any and all subsequent activity on this external input will be ignored until the integration period and CCD readout time have completed for the acquisition at hand.
For experiments involving multiple acquisitions, the allowable repetition rate (t rep rate) associated with this external triggering function is governed by the sum of the CCD expose time (t expose) and subsequent data processing readout time (t readout) as follows:
t rep rate ≥ t expose + t readout
Figure 8, on the following page, illustrates the relative timing associated with an external trigger input waveform and the subsequent expose (i.e. shutter) and readout timing information available via TTL BNC Output 2. Figure 8 depicts an externally triggered single acquisition experiment using positive edge triggering for the Trigger Input signal and active high logic levels (5V) all output signals shown.
26

Triggering with a Symphony Controller
SE(
Sele
ctab
le fo
r BN
C O
utpu
t 2
External Trigger Input
E(
R
t
t Rep Rate
Expose
xpose Shutter)
tart xperiment
BNC Output 1)
eadout Readoutt
The Start Experiment signal activates after the experiment is set up via SynerJY software and the RUN button is pressed.
Figure 8. Timing Diagram for an Externally Triggered Single Acquisition Experiment Using Positive Edge Triggering
27

Triggering with a Symphony Controller
Figure 9 below illustrates the relative timing associated with another externally triggered experiment. Here, the experiment is set-up for a multi-accumulation acquisition of 2 spectra using a negative edge triggered Trigger Input signal and active low logic levels (0V) for all TTL BNC output signals available to the end-user.
Start Experiment (BNC Output 1)
Sele
ctab
le fo
r BN
C O
utpu
t 2
External Trigger Input
E(
R
t Rep Rate
xpose Shutter)
t
eadout
t Expose
Readout
The Start Experiment signal activates after the experiment is set up via SynerJY software and the RUN button is pressed.
Figure 9. Timing Diagram for an Externally Triggered Multi-accumulation Acquisition Using Negative Edge Triggering
28

Chapter 6: Temperature Control
The Symphony Controller monitors and regulates the array’s set point temperature via its cooler power and thermostatic control circuitry.
Array temperature setability is provided in steps of 0.1 °C resolution. Once thermal equilibrium has been reached, the controller’s cooler power and thermostat control circuitry ensure that the array temperature will not drift more than ± 0.1 °C from the commanded value.
At the present time, Symphony Detectors are available with two cooling options:
• “Super” thermoelectrically cooled (STE series)
• Cryogenically cooled (LN2 series)
For optimum array performance with respect to dark current, quantum efficiency and signal-to-noise ratio, the Symphony CCD Detection System typically provides default cooling set point temperatures of -133 °C (140 K) for LN2 type detector heads and -70 °C (203 K) for STE type variants.
29

30

Chapter 7: Detector System Component Description
The primary components making up a Symphony CCD Detection System are:
• Symphony CCD Detector
• Symphony Detector Controller
• SynerJY software
In addition to the primary components listed above, all Symphony CCD Detection Systems are provided with one mechanical shutter and an associated interface cable. A number of shutter options are available for interfacing to various Jobin Yvon spectrometers as discussed herein.
Symphony CCD Detectors All Symphony detectors use high quality scientific grade CCD array formats specifically designed for spectroscopic applications. Choosing the most appropriate format for your detection system is dependent on the intended spectroscopic application.
Detector Head Cooling Options Symphony CCD detectors are available with two cooling options: “super” thermoelectrically cooled (STE series) and cryogenically cooled (LN2 series).
The STE series of Symphony CCD detector heads offers high-performance thermoelectrically cooled units that achieve temperatures better than -70 °C (203 K) without the use of LN2. Thus, this series of detectors provides very low dark current, allowing for good signal-to-noise ratio and long integration times.
The LN2 series of Symphony CCD detector heads are targeted for applications that require extremely low noise and dark level. Array temperatures of -133 °C (140 K) may be obtained with LN2 heads, and as such; offer the ultimate cooling performance resulting in the lowest possible noise level.
A more detailed discussion of each detector head type follows on the next page.
31

Detector System Component Description
Super Thermoelectrically Cooled (STE) Head
The STE thermoelectrically cooled CCD detector head employs a multi-stage Peltier cooling device that is thermally coupled to the CCD array inside an evacuated chamber. Heat is drawn away from the array’s surface as current is passed through the Peltier device. The heat transfer process continues in succession thru the Peltier stages to a heat spreader located on the atmospheric side of the detector, where it is then air-cooled via an accessory fan. Figure 10 depicts this high per-formance, air-cooled STE series Symphony CCD Detector Head.
Figure 10. High Performance, Air-Cooled STE Series Symphony CCD Detector
All STE cooled CCD detector heads can run continuously at their set operating temperature of -70 °C (system default setting) without maintenance. It should be noted that air-cooled detector heads, such as this STE variant, only require freely circulating, ambient room temperature air (+25 °C ± 5 °C) to cool and maintain the array’s operating set temperature. Failure to stay within the specified ambient operating temperature range of +25 °C ± 5 °C may cause an increase in array temperature resulting in higher dark current.
All STE series Symphony Detector Heads incorporate temperature sensors that continuously monitor the Peltier’s hot side sink temperature. This protective circuitry prevents possible damage to the array by disabling the cooler power supply when its internal, preset temperature is exceeded due to faults such as inadvertent restricted airflow. Under such a fault condition, the TE 1 STATUS LED, located on the front panel of the Symphony Controller, will transition from a GREEN illumination state (indicating that thermo electric cooling is operational and functioning properly) to a RED illuminated state (indicating that cooling has been automatically disabled due to a fault condition).
The physical dimensions of the STE detector head are 118.70 mm (4.67 in) wide x 188.94 mm (7.44 in) deep x 130.32 mm (5.13 in) high with an associated weight of 2.02 kg (4.46 lbs).
The optical distance between the CCD chip and the external flange is 6.50 mm (0.256 in) for this STE cooled detector. Dimensioned drawings for the STE series of Symphony CCD detector heads are provided in Appendix A.
32

Detector System Component Description
LN2 Cooled Head
The LN2 series of Symphony CCD detector heads, which offer the ultimate cooling performance, are mounted in one of three types of liquid nitrogen dewar configurations:
• Side-looking
• Down-looking
• All-position
At present, each of the dewar configurations listed above are available in 1-liter versions. Figure 11 depicts the standard side-looking dewar associated with the LN2 series of Symphony CCD detector heads.
From a cooling capacity perspective, the 1-liter dewar utilized in the “side” and “down” looking positions are designed to maintain the CCD array temperature at -133 °C (140 K) for a minimum period of 24 hours before requiring liquid nitrogen refill. The all-position 1-liter
F
igure 11. High Performance LN2 Symphony CCD Detector
dewar has a cooling hold time typically in the 15 hour range.
The physical dimensions of the 1-liter LN2 detector head are 118.87 mm (4.68 in) wide x 382.78 mm (15.07 in) deep x 218.19 mm (8.59 in) high with an associated weight of 3.16 kg (6.96 lbs).
The optical distance between the CCD chip and the external flange is 7.91 mm (0.311 inches). Dimensioned drawings for the LN2 series of Symphony CCD detector heads with dewar positional variations are provided in Appendix A herein.
Note: The TE 1 STATUS LED, located on the front
panel of the Symphony Controller, illuminatesRED during operation of Symphony DetectionSystems that incorporate a LN2 series detector.This system status information indicates that thethermoelectric (TE) cooling circuitry is disabled(i.e. off). The end-user should consider this statusinformation as “normal”, since TE cooling is notrequired for LN2 detector heads.
33

Detector System Component Description
Detector Head Chamber and Cooling Effectiveness All Symphony CCD Detector Heads have an integral high vacuum chamber in which the CCD sensor resides. This chamber, along with other insulating measures, isolates the chip from the ambient temperature. Each CCD detector head is evacuated at the factory and is designed to maintain insulating properties for a minimum of one year between pumping cycles. Deterioration of the head’s vacuum seal will result in a decrease in the insulating capability of the head and a loss of cooling effectiveness. If a vacuum leak does occur, thermoelectrically cooled STE heads will be unable to achieve their rated operating temperatures and the sensors will have higher associated dark currents. For LN2 detector heads, vacuum deterioration will result in a rapid consumption of liquid nitrogen that may cause frost to form on the exterior of the dewar. In either case, condensation may form on the array during cool down cycles, degrading optical performance and fostering corrosion. Under such conditions, the end-user may notice spreading of light to nearby pixels or spectral features that may become blurred. In addition, although rare, vacuum leaks may cause physical damage to the CCD sensor as well.
If the head cannot maintain operating temperature, contact Jobin Yvon to arrange for re-pumping the vacuum. Attempting to evacuate the Symphony head at user locations is not recommended, since some types of vacuum pumps can backstream oil, causing irreparable damage to the CCD electronics.
Detector Head Electrical Interfaces Both Symphony Detector Head variants provide the following external interface connections for proper system operation:
• Video Control
• Cooling Control
• Shutter Drive
The Detector Head Video Control interface provides for: detector head power, CCD digital control and CCD video output. For system operation, this detector head interface connects directly to the Symphony Controller’s CH 1 Detector Video interface connector via the Detector Video Cable (STE P/N 980058 or LN2 P/N 980059).
The Detector Head Cooling Control interface provides for: cooler power, shutter control, temperature sense/monitor and fan power. For system operation, this detector head interface is connected directly to the Symphony Controller’s CH 1 Detector Cooling interface connector via the TE Cooler/Shutter Cable (STE P/N 400424 or LN2 P/N 400493).
34

Detector System Component Description
The Detector Head Shutter Drive interface is provided via a BNC connector and serves to drive a single electro-mechanical shutter having the following characteristics:
• Coil resistance: 12 Ω
• Pulsed voltage to open: +60 V dc
• Hold voltage: +5 V dc
• Operating frequency: 40 Hz maximum rep rate
35

Detector System Component Description
Symphony Controller The Symphony Controller provides co-ordination of all Symphony Detector functions including power distribution, array temperature regulation, digital readout control and CCD video output conditioning and digitization of pixel information. Figure 12 depicts Jobin Yvon’s Symphony Controller. Refer to Appendix A to view a mechanical drawing of the controller.
The controller incorporates a sophisticated surface mount electronics platform, centered around a 32-bit PowerPC processor, that provides a modular, high technology architecture targeted for high performance and high-speed spectral/image acquisition. F
Highlight features of this high performance controller inc
• 16-bit pixel processing rates from 20 kHz to 1 MH
• Negligible electronics noise
• Supports control/readout of Full Frame and Frame
• Selectable gains programmable via software
• Interfaces to LN2 and TE detectors
• Fully integrated TE power supply eliminating the
• Onboard memory storage for spectral/image data
• 10/100 Ethernet Communication link providing 10
• Universal AC power input
• Complete image readout
• Flexible readout patterns and pixel skipping for in
• Supports XY binning
• Incorporates enhanced triggering capability progra
• Automatic detector recognition for head interchan
• Integrated built-in-test diagnostics to validate syst
• Fully integrated with SynerJY Spectroscopic appl
The physical dimensions of the Symphony Controller a355.60 mm (14.00 in) deep x 323.85 mm (12.75 in) hig10.40 kg (22.94 lbs).
36
igure 12. Symphony Controller
lude:
z (model version dependent)
Transfer CCD Architectures
need for external power
0% data integrity to Host
creased throughput
mmable via software
geability
em’s health
ication software
re 171.45 mm (6.75 in) wide x h with an associated weight of

Detector System Component Description
A more detailed description follows for each of these features offered by the Symphony Controller platform.
Symphony Controller Models The Symphony Controller is offered in two different models in an effort to best meet the end-user’s application:
• Symphony-Solo (optional)
• Symphony-Solo-Fast (standard)
A brief description follows for each controller model with respect to this important pixel processing performance parameter.
Symphony-Solo
Symphony-Solo offers end-users the lowest noise and highest dynamic range possible by processing pixel information at a 20 kHz ADC rate. Jobin Yvon’s proprietary low noise 16-bit analog circuitry contributes negligibly to the overall system noise, which is dominated by the CCD sensor’s read noise typically in the 3-4 electron range. This slow scan mode of operation is ideal for the most demanding spectroscopic applications and offers unprecedented sensitivity.
Symphony-Solo-Fast
Symphony-Solo-Fast offers end-users an additional 16-bit high-speed image/spectral acquisition mode in addition to the 20 kHz slow scan mode that offers the ultimate in low noise performance. This controller model provides end-users with the ability to almost seamlessly process pixel information at speeds between 20 kHz and 1 MHz through software control, with 16-bit resolution. This high-speed mode of operation is useful in quickly resolving focus and alignment issues, as well as, acquiring data fast. Typical system noise for the 1 MHz scientific grade CCDs currently being offered by Jobin Yvon is better than ~25 electrons rms; specific system noise values are chip dependent. This typical noise range takes into account the system’s electronics noise and the read noise of the sensor itself.
Gain Selections For the spectroscopic 20 kHz mode of operation, the Symphony-Solo and Symphony-Solo-Fast Controller offerings provide the end-user with 16-bit pixel processing capability that includes five gain options selectable via SynerJY software as specified in Table V.
37

Detector System Component Description
Table V. Gain Options at 20 kHz Conversion Speed
Gain Setting System Transfer Function (Electrons / ADC Count)
0.6 X 0.7 typical 1.0 X 1.0 typical 2.0 X 2.0 typical 4.0 X 4.0 typical 8.0 X 8.0 typical
With this gain setting capability, low light level applications would take advantage of the high sensitivity mode offered by the 0.6 X gain setting, while the 8.0 X setting would be used for high light level experiments to take full advantage of the CCD sensor’s linear full well capability.
For the high speed 1 MHz mode of operation provided with the Symphony-Solo-Fast Controller, only three gain options are available to the end-user as denoted in Table VI below.
Table VI. Gain Options at 1 MHz Conversion Speed
Gain Setting System Transfer Function (Electrons / Count)
0.6 X 0.7 typical 2.0 X 2.0 typical 8.0 X 8.0 typical
Data StoragAll Symphonyand/or image specified in Tab
Note: Calibration data is provided with each SymphonyCCD Detection System defining the transferfunction in electrons/count for the incorporatedCCD sensor for each available gain setting.
e for Spectra / Images Controllers provide on-board memory storage for storing 16-bit spectral data. Memory size options available for the Symphony Controller are le VII on the following page.
38

Detector System Component Description
Table VII. Symphony Controller SDRAM DIMM Module Offerings
Memory Size Memory Configuration Controller Feature
16 Mbytes 4 Mbytes x 32 Standard 32Mbytes 8 Mbytes x 32 Optional
Detector Auto-Recognition All Symphony Controllers incorporate circuitry to automatically poll the attached detector head during the system’s power-on initialization routine. This “polling” capability allows the controller to determine the CCD type and any other pertinent information related to that detector and then set-up the detection system’s electronics for optimized sensor performance. This system architecture feature allows for quick field upgrades and/or servicing by allowing easy detector head interchangeability.
Built-In-Test Diagnostic Capability All Symphony Controllers incorporate built-in-test (BIT) circuitry that provides a comprehensive level of testability to support the manufacturing process, as well as, field maintainability. This BIT circuitry provides automated test capability via resident diagnostic firmware routines exercised by the controller’s 32-bit processor to ensure the operational health of the controller and validate the detection system’s performance.
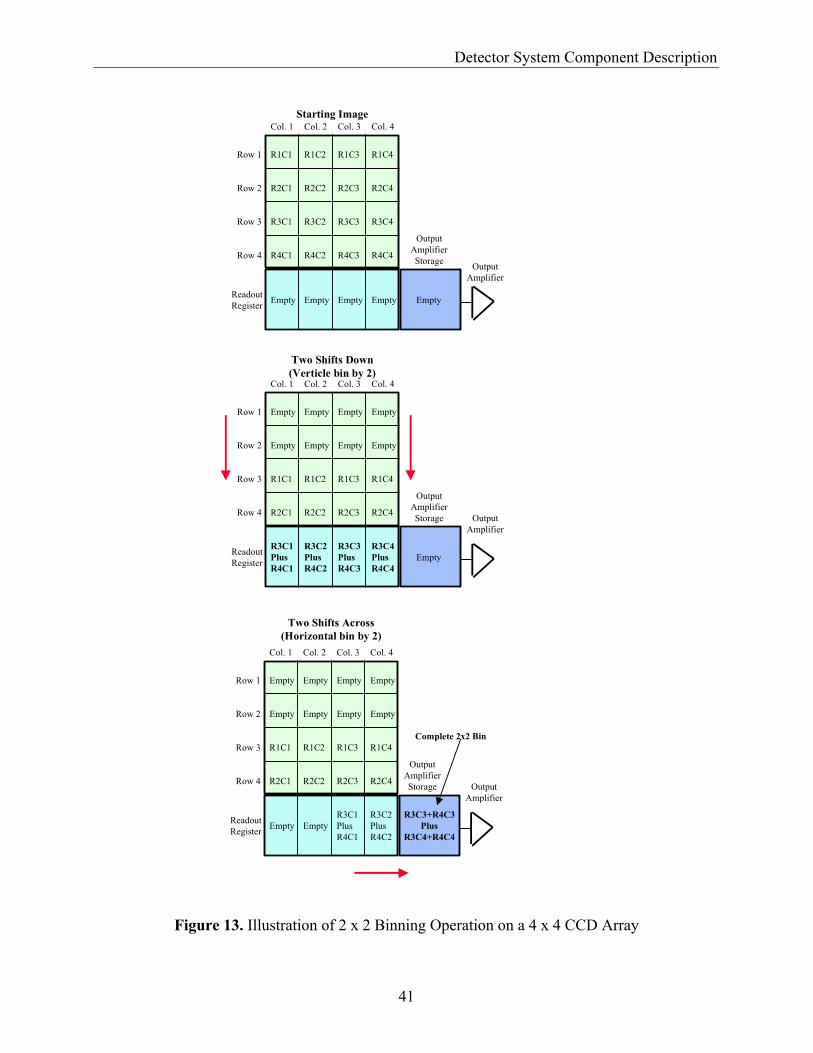
CCD Hardware Binning Control Adding neighboring CCD pixels together to form a single pixel is a technique known as binning. Binning can be accomplished in hardware (Symphony Controller) during the readout process or thru software intervention (SynerJY) after the data has been collected from the CCD. With the aide of the Symphony Controller, this binning process can be exercised at the hardware level in both the horizontal (x) and vertical (y) directions for multiple areas of interest in a given readout as previously set-up in the SynerJY software.
Figure 13 illustrates a basic 2 x 2 binning operation on a 4 x 4 CCD array. This successful binning operation consists of two vertical clocking operations followed by two horizontal clocking transfers that effectively shifts the summed pixel information into the output amplifier’s storage node prior to pixel readout and digitization. This “super pixel”, once digitized, actually represents 4 pixels of the CCD array.
It should be noted that binning does reduce resolution capability; however, it increases sensitivity and improves (i.e. lowers) the overall CCD readout time. End-users are cautioned that there is a limit to the effectiveness of hardware binning as a result of the horizontal serial shift register and output node not having infinite capacity to store charge. This physical limitation is best exemplified for applications that have a very small signal superimposed on a large background. In practice, the pixels associated with the horizontal register have twice the full well capacity of their light sensitive counterparts, while the output node usually can hold four times that of the photosensitive area. Thus, experiments where the summed charge exceeds either the full well capability of the
39

Detector System Component Description
horizontal shift register and/or the output node will be lost from a data processing point of view.
CCD Exposure Control The Symphony Controller precisely controls the CCD exposure time using a 1 kHz expose clock frequency that provides flexible integration times of 0.001 to 4,294,967.296 sec (49.71 days). End-users can set the desired exposure time with SynerJY application software.
Universal AC Input Power The Symphony Controller accepts universal AC single-phase input power over the range of 85 to 264 VAC with an associated line frequency range of 47 to 63 Hz. This AC power enters the controller via an input power entry module located on the rear of the unit and is subsequently converted into the necessary DC bias voltages required by the controller to operate properly. From a system power distribution standpoint, the controller also develops and distributes the power required by the Symphony Detector Head electronics.
Integrated TE Power Supply All Symphony Controllers incorporate resident circuitry that provides thermoelectric (TE) cooling power for use when interfacing to the STE series of Symphony Detectors. This TE cooling circuitry monitors and regulates the STE Detector’s array set point temperature with less than ± 0.1 °C drift.
It should be noted that the Symphony Controller’s robust and versatile TE cooling circuitry eliminates the need for any external power source requirements with respect to peltier cooling.
40
Detector System Component Description
Row 1
Row 2
Row 3
Row 4
ReadoutRegister
Col. 1 Col. 2 Col. 3 Col. 4
R1C1 R1C2 R1C3 R1C4
R2C1 R2C2 R2C3 R2C4
R3C1 R3C2 R3C3 R3C4
R4C1 R4C2 R4C3 R4C4
Empty Empty Empty Empty
OutputAmplifierStorage Output
Amplifier
Empty
Row 1
Row 2
Row 3
Row 4
ReadoutRegister
Col. 1 Col. 2 Col. 3 Col. 4
R1C1 R1C2 R1C3 R1C4
R2C1 R2C2 R2C3 R2C4
R3C1 R3C2 R3C3 R3C4
R4C1 R4C2 R4C3 R4C4
Empty Empty Empty Empty
OutputAmplifierStorage Output
Amplifier
Empty
Empty Empty Empty Empty
Plus Plus Plus Plus
Starting Image
Two Shifts Down(Verticle bin by 2)
Row 1
Row 2
Row 3
Row 4
ReadoutRegister
Col. 1 Col. 2 Col. 3 Col. 4
R1C1 R1C2 R1C3 R1C4
R2C1 R2C2 R2C3 R2C4
R3C1 R3C2
R4C1 R4C2
Empty Empty Empty Empty
OutputAmplifierStorage Output
Amplifier
Empty Empty Empty Empty
Plus Plus Plus
Two Shifts Across(Horizontal bin by 2)
Empty EmptyR3C3+R4C3
R3C4+R4C4
Complete 2x2 Bin
Figure 13. Illustration of 2 x 2 Binning Operation on a 4 x 4 CCD Array
41

Detector System Component Description
Controller External Interfaces The Symphony Controller provides external interfaces for the following functions:
• Communication
• TTL Input / Output
• Detector Head Control
• LED Status Indication
Communication Interfaces • 10/100 Ethernet
10/100 Ethernet
The Symphony Controller incorporates a 10/100 Ethernet interface which complies with the following IEEE 802.3 standards:
• 10Base-T
• 100Base-TX
The Ethernet interface is used to communicate with the host computer. It possesses “auto-negotiation” capability, sustaining bit rates of either 10 Mbit/sec or 100 Mbit/sec in both directions for full and half duplex modes. Data transferred over the controller-host Ethernet link includes “I/O Read/Write commands,” as well as, digitized pixel information representing full image or spectral readouts. A dedicated RJ-45 connector is used with this interface with an associated host-controller cable meeting the unshielded twisted pair (UTP) Category 5 standards of TIA/EIA 568-A and ISO-IEC 11801.
Note: Successful communication between the Sym-phony Controller and the Host computer requiresuse of an Ethernet Crossover Cable.
42

Detector System Component Description
TTL Input/Output Three versatile TTL level Input/Output signals are available for monitoring and/or control of various user accessories via BNC connectors located on the rear of the controller. Two of the three available BNC connectors are allocated for TTL Output signal usage, while the remaining BNC connector is used for the Trigger Input function. The digital logic associated with each BNC output connector provides a multiplexed pathway, making two TTL output signals per BNC available (selectable via SynerJY software) to the end-user. A brief description of the functionality associated with each TTL BNC interface follows:
TTL Input (Trigger Input)
The TTL Input BNC of the Symphony Controller provides for the Trigger In function. Selection of the “External Trigger” mode of operation enables the controller to synchronize data acquisition to external events. This input provides for either positive or negative edge triggering and is selected by the user via software.
TTL Output 1:
TTL Output 1 provides the START EXPERIMENT digital output signal via software selection. Definition of this signal is provided below.
Signal Name: START EXPERIMENT
The START EXPERIMENT signal indicates the start of an experiment. Upon receipt of a “Start Acquisition” command, this output will go to its active state after completing its present CCD array cleaning cycle. For time based operation, this output remains active until all spectra have been taken and then returns to its inactive state.
TTL Output 2:
TTL Output 2 provides the SHUTTER or READOUT digital output signal via software selection. Definition of these signals is provided below.
Signal Name: SHUTTER
The SHUTTER signal provides status with respect to shutter operation and is activated during the interval when the CCD is being exposed to light.
Signal Name: READOUT
The READOUT signal indicates when the CCD is being read out. Upon completion of the CCD integration (expose) period, this output goes to its active state and shall remain there until the CCD has been completely read out.
43

Detector System Component Description
Note:
Detector Head CThe Symphony Concommand/control of a
• Detector Video
• Detector Cooli
Detector Video Contro
The Detector Head Vidcapability:
• Detector head p
• Inter-Integrated
• CCD Digital C
• Analog conditi
Detector Cooler Contr
The Detector Head Cofunctionality:
• Cooler power
• Shutter control
• Temperature S
• Fan Power
Each selected output signal can also beconfigured, via software, for a specific polaritywhere the active state can be either a logic high(5V) or logic low (0V) to meet the needs of theexperiment. Refer to Appendix D for additionalinformation regarding enabling/configuring theseTTL level I/O signals.
ontrols troller design incorporates a two-connector interface for the Detector Head as follows:
Control
ng Control
l
eo Control interface provides the following detector head
ower
Circuit (I2C) interface
ontrol
oning of the CCD video output
ol
oler Control interface provides the following detector head
ense/Monitor
44

Detector System Component Description
LED Status Indicators The Symphony Controller provides LED status indicators regarding the overall health of the Symphony CCD Detection System for the end-user. It should be noted that the Symphony controller has inherent capability to disable all LED indicators via software control. This “shut-down” feature is extremely important in instances where LED illumination could potentially degrade or compromise the end-user’s experiment /application. A brief description of each status LED follows.
Controller front panel LEDs:
POWER Illumination of the POWER LED indicates that the unit has been powered.
EXT TRIGGER READY
The EXT TRIGGER READY LED is specifically used in the system’s External Trigger mode of operation. When illuminated, it indicates to the end-user that the system is ready to begin subsequent acquisitions.
TE 1 STATUS LED The TE1 STATUS LED utilizes a bi-color LED that will illuminate RED upon power-up to indicate that thermo-electric cooling is disabled / off. Once the end-user has initialized the system, via SynerJY software, thermo-electric cooling is enabled as indicated by the GREEN illumination of this LED.
It is important to note that the TE STATUS LED indicates whether or not thermo-electric cooling is operational and does not provide any status information regarding whether the commanded CCD array set temperature has been reached.
Controller rear panel LEDs:
LINK VALID When illuminated, the LINK VALID LED, indicates that a valid Ethernet communication link has been established between the controller and the host computer.
10/100 SPEED The 10/100 SPEED LED indicates whether the link is operating in 10Base-T or 100Base-TX mode. Illumination of this LED indicates 100Base-TX operation.
45

Detector System Component Description
Front Rear
.
Ext Trigger Ready
TE1 Status
Power
AUX INPUT
INPUT POWER85-250 VAC/50-60 Hz/3AMAXFUSE: 250 VAC@10 AMPS
DETECTORCOOLING
DETECTORVIDEO
CH 2 CH 1 CH 1 CH 2
EXT I C2
TRIGGER INPUT
TTL OUTPUT 1
TTL OUTPUT 2
LINK VALID
10/100 SPEED
10/100 ETHERNET
RS-232
Figure 14. Symphony Controller Front and Rear External Interfaces
46

Detector System Component Description
Shutter An electro-mechanical shutter is supplied with every Symphony detection system. A variety of shutters are available from Jobin Yvon. Depending on the model type, the shutter may be mounted inside or outside of the spectrograph. Table VIII (on the following page) lists some commonly used spectrographs and the shutters with which they are compatible.
Refer to the appropriate spectrograph manual for detailed installation instructions. Note that one shutter and one shutter cable are provided with each Symphony CCD system. Additional shutters may be purchased separately. Contact the Jobin Yvon Service Department for shutter installation assistance (see Service Policy page 77).
Software Jobin Yvon’s SynerJY software facilitates the operation of your Symphony CCD Detection system. This software, designed for ease-of-use, allows for complete control over every aspect of your spectroscopic system. Using SynerJY, you can conduct and define experiments, establish preferred settings, adjust hardware parameters, and evaluate and analyze data. In addition, the software is equipped to automate repetitive functions and permits the user to define and save experimental parameters. SynerJY offers a variety of ways to view data, allowing for quick and powerful interpretation. Please refer to the documentation provided with the software for user instructions.
47

Detector System Component Description
Table VIII. Shutter Models
Spectrograph Location Shutter Part #
BNC Cable Part #
Triax180/190 Front Only MSL-TSHCCD
Triax320 Triax550
Front (axial) Side (lateral) alone Side (lateral) both
227MCD MSL-TSHCCD MSL-TSCCD2
500M 750M 1000M 1250M
Front (axial) Side (lateral) alone Side (lateral) both
1425MCD 1425MCD-B 1425MCD-C
750I Front (axial) 227MCD
CP140 CP200 External Only
23009030
HR460 Front (axial) 23024630
HR640 External Only 23009030
THR1000 External Only 23009030
THR1500 Contact Factory
U1000 Contact Factory
1403 1404 Front (axial)
1425MCD
1870 1877 Front (axial)
1425MCD
352470, 4 ft Standard Cable
Depending on the system configuration, one of the following may be provided in place of the standard BNC shutter cable: 30646, 8 ft 31936, 2 ft
48

Chapter 8: Powering Down and Disassembly of the System
This chapter provides the end-user with the necessary steps to methodically and safely power down your new Symphony CCD Detection System. In addition, information is presented that details the proper disassembly process for this detection system.
Power Down Procedure 1. Exit the application software.
2. Turn off the detection system power by pressing the power switch located on the front panel of the Symphony Controller.
DisassemIn instances whshould be taken
1. Exit the
Fefd
2. Turn of
front pa
3. RemoveSymphointerfac
4. Immedielectrica
Note: It is safe to leave the Symphony Detector un-powered and mounted to the spectrometer as longas all system cables interfacing betweencontroller and detector remain securely con-nected.
bly of the Detection System ere the experiment set-up needs to be disassembled, the following steps in the order specified:
application software.
CAUTION
or LN2 Detectors, ensure that the liquid nitrogen has vaporated from the dewar (approximately 24 hours rom the fill time) before attempting to disassemble the etector head from the spectrometer.f the detection system power by pressing the power switch located on the nel of the Symphony Controller.
the Detector Video and TE Cooler/Shutter Cables connecting the ny Detector and Controller units, as well as, the BNC Shutter Cable
ing between the spectrometer and detector.
ately place the ESD protective caps on both the detector and controller l interface connectors to prevent Electrostatic Discharge (ESD) damage.
49

Powering Down and Disassembly of the System
Note: The Jobin Yvon warranty on the Symphony CCD
Detection System does not cover damage to thesensor or the system’s electronics that arise as aresult of improper handling including the effectsof Electrostatic Discharge.
5. Remove the Symphony Detector Head from the spectrometer by loosening the mounting screw and carefully pulling the detector towards you, out of the mount.
6. Unplug the AC power cord and the Ethernet Crossover Cable from the Symphony Controller.
50

Chapter 9: Optimization and Troubleshooting
Following installation, some applications may require special attention in order to obtain optimal system performance. The system optimization and troubleshooting tips below have been provided to help the end-user maximize experimental results and troubleshoot potential problems.
Optical Optimization The best way to increase the signal to noise ratio of a measurement is to increase signal strength at the detector by increasing optical power at the source or by increasing the integration time of the detector.
In cases where this is not possible, additional optical signal can usually be coupled into the system by minimizing the losses in the optical coupling from the source to the sample and/or from the sample to the spectrograph entrance slit. Checking the coupling optics for correct alignment and focus will often increase the signal level.
Incorrect f/# matching may cause stray light inside the spectrometer and be collected by the detector. Use correctly aligned and focused f/# matching optics to eliminate this possibility. For more information on f/# matching and coupling optics, please refer to The Optics of Spectroscopy at www.jobinyvon.com/jy/oos/oos1.htm.
Stray light entering the spectrometer system through methods other than the entrance slit may interfere with the measurement. Reduce the possibility of stray light by securing all covers and closing all unused entrance or exit ports. When running any experiments, turn off all unnecessary room lights, including computer monitors.
Spatial Optimization Often the optical signal of interest that is imaged on to the array occupies only part of the total array area. Sections of the array that are not illuminated will only add noise to the measurement. Taking advantage of the Area selection capabilities of Symphony, select a reduced portion of the CCD active area and reduce the dark signal and associated noise from the unused area. Susceptibility to cosmic rays will be reduced proportionately as well.
The best way to match the portion where the signal is located is to acquire a full-chip image of the signal. With the image, the area can be easily defined to just include the section of the CCD that is illuminated. If the actual signal is too weak to be seen in an image, increase the integration time or try to approximate the signal using the exact same collection optical setup, but substitute a brighter signal. Refer to your software manual for instructions on defining the active area(s).
51

Optimization and Troubleshooting
Reducing the Number of Conversions Each time an analog to digital conversion is made, some read noise is introduced. For spectra that are imaged as essentially vertical slit images on the array, the pixels illuminated in their vertical columns can be binned into superpixels, to be combined before conversion to data points. Likewise, when spectral resolution is not a limiting factor, the signals can also be horizontally binned into two-dimensional superpixels. The limit on this is that the combined signal intensity for the most intense superpixel should not exceed the ADC dynamic range. However, when signal levels in some pixels are at or near the saturation level, acquiring a series of spectra using integrations of shorter duration and summing them digitally provides a means to avoid saturation.
Please refer to your software manual for instructions on setting up binning.
Environmental Noise Reduction Because of the extreme low internal noise characteristics of the liquid nitrogen and thermo-electrically cooled sensors, precautions to minimize noise pickup from external sources is recommended.
Although shielded, the detector head and cables can still be sensitive to strong electromagnetic fields. For best results, the detection system should be isolated from devices generating such fields. In instances where external field sources may be hampering the detection system’s optimum performance, Jobin Yvon recommends the following:
• Electromagnetic interference (EMI) from a variety of sources may be picked up by the detection system’s sensitive analog conditioning circuitry. Try isolating any other apparatus suspected to be a noise source by turning it off while monitoring the CCD signal in real time. Typical sources of EMI are high power lasers, vacuum pumps, and computer monitors. If possible, connect offending equipment to power sources separate from the detector controller and re-route cables away from interfering devices.
• Note that the room lights may radiate EMI based on the (50 or 60 Hz) power line frequency. A battery-powered flashlight will not.
• If turning off the spectrometer power switch reduces noise, rearrange power connections to be sure the spectrometer, source, and detector are tied to the same ground and, if possible, the same power circuit.
• In extreme cases, such as working with or around high powered pulsed lasers or other high energy apparatus, it may be helpful to construct RFI / EMI shields or cages to contain the noise at its source, or to isolate the detection system from the noise. In these cases, colleagues who are working with a similar apparatus may be your best resource for noise control suggestions.
52

Optimization and Troubleshooting
Cooling If the detector starts to exhibit higher than normal dark current levels in the same controlled experimental set-up, one of the following problems may have occurred:
• The cable connections between the controller and detector may need to be secured.
• The detector head may need re-pumping due to vacuum deterioration. For evacuated heads, the level of vacuum required is beyond the capabilities of mechanical vacuum pumps. User re-pumping is not recommended. The user’s responsibility in this regard is simply to monitor the baseline dark current value on a periodic basis for a given experimental set-up. Detector heads that exhibit higher than normal/expected dark current levels for the experiment at hand, indicate that the vacuum seal has been compromised, thus effecting the system’s capability to cool the CCD array to rated levels. In the event of loss of vacuum, please contact Jobin Yvon Customer Service.
Shutter If the shutter should fail to actuate, verify that all cables are correctly connected. Contact Jobin Yvon for further assistance.
Power Interruption For thermoelectrically cooled heads, restart as normal. If power is interrupted while an LN2 detector is cooled, perform the following steps to restore the system to normal operations:
• Restart the system.
• Reinitialize the detector
• Allow enough time for the sensor to return to normal operating temperature. The sensor may be at a lower than normal operating temperature due to loss of thermostat control while unpowered.
• Run a series of full area readouts with short integration time. This will flush most charges from the sensor. For most cases, normal operation can be resumed at this point.
For cases where very long integration times are used, an increase in dark charge may be noticeable. To correct this, the CCD should be allowed to warm to room temperature and then restarted as normal to clear all trapped charges.
53

Optimization and Troubleshooting
Software Cannot Recognize Hardware Configuration
• If a hardware device is not found, make sure that you have selected an appropriate hardware configuration for your system.
• If you have selected an appropriate hardware configuration for your system and a device is still not found during initialization, verify that all cables are correctly connected and that power is turned on.
• When checking cable connections, make sure that the TE Cooler/Shutter and Detector Video Cables are connected to the CH 1 Detector Cooling and CH 1 Detector Video interfaces respectively.
• Verify a proper network configuration set-up for the Symphony Controller (the network connection was configured in Chapter 3).
A proper network configuration can be verified by performing a name or address test (Ping) to see if there is an IP-based connection between the host computer and the named/addressed device.
1. From the Start menu of the operating computer, click Run.
2. Ping the address of the Symphony Controller by typing “ping 172.16.0.1” at the command prompt. Successful network configuration will be indicated by the response:
Reply from 172.16.0.1 = bytes =32 time < 1ms TTL =255 Reply from 172.16.0.1 = bytes =32 time < 1ms TTL =255 Reply from 172.16.0.1 = bytes =32 time < 1ms TTL =255 Reply from 172.16.0.1 = bytes =32 time < 1ms TTL =255
Note: If a proper “ping” response is not obtained whenquerying the Network IP address or device name,please return to Configuring the IP Connection ofChapter 3.
54

Optimization and Troubleshooting
• Prior to starting SynerJY software, you must run the Hardware Initialization program. This program loads the firmware to Symphony and should be initialized for every power-up cycle of the instrument. To run the Symphony Initialization program:
1. Select Programs from the Start menu of the operating computer.
2. Click Jobin Yvon then select Symphony Initialization to run the program.
Note: Failure to run the Hardware Initialization
program prior to starting SynerJY applicationsoftware will result in a “Hardware Device NotFound” message since the software cannotrecognize a valid hardware connection.
55

Optimization and Troubleshooting
56

Appendix A: Mechanical Interface Drawings
Note: All Mechanical Interface Drawings are shown ininches unless otherwise indicated.
Figure 15. Symphony Controller
57

Appendix A: Mechanical Interface Drawings
Figure 16. STE CCD Detector Head
58

Appendix A: Mechanical Interface Drawings
Figure 17. 1-Liter Side Mount LN2 Dewar for CCD Detectors
59

Appendix A: Mechanical Interface Drawings
Note: The Bolt patterns on the LN2 version mountingflanges have six through-hole slots, so that thedetector can be mounted in either of 2orientations by selecting the group of 3 slots(with an angle of 120o between them). Adjacentslots have an angle of 30o between them. Asecond flange variation found on TE units usesthree threaded holes and three through-hole slotsto allow maximum mounting flexibility. Thethree slots/ threaded holes and mechanicaldimensions conform to the accepted ‘OMA’flange pattern.
FOCAL PLANE
Figure 18. STE Head Mounting Flange
60
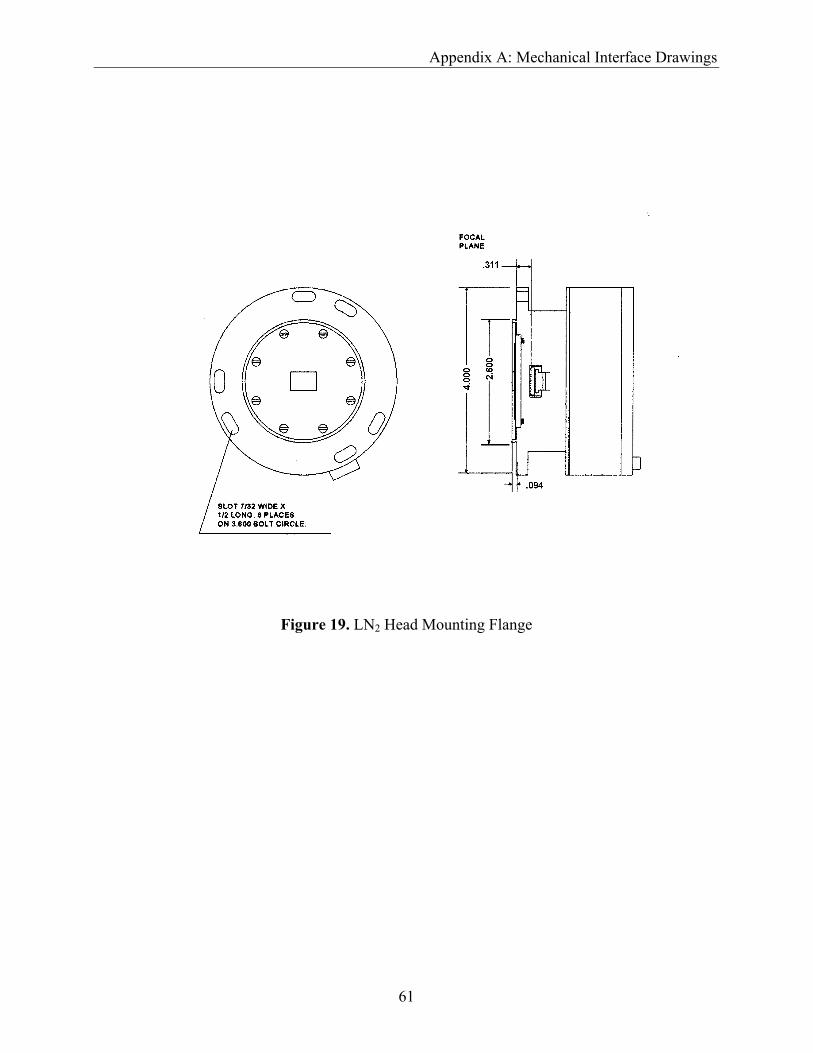
Appendix A: Mechanical Interface Drawings
Figure 19. LN2 Head Mounting Flange
61

Appendix A: Mechanical Interface Drawings
62

Appendix B: CE Compliance Matrix
Table IX. CE Compliance Tests and Standards
Tests Standards
Emissions, Radiated/Conducted EN 55022: 1998, Class A
Radiated Immunity EN 61000-4-3: 1996
Conducted Immunity EN 61000-4-6: 1996
Electrical Fast Transients EN 61000-4-4: 1995
Electrostatic Discharge EN 61000-4-2: 1995
Voltage Interruptions EN 61000-4-11: 1995
Surge Immunity EN 61000-4-5: 1995
Magnetic Field Immunity EN 61000-4-8: 1995
Harmonics IEC 61000-3-2: 2001
Flicker IEC 61000-3-3: 2001
63

64

Appendix C: Shutter Options
CAUTION Please contact Jobin Yvon Customer Service for
assistance with mounting a shutter to a spectrometer. It is extremely important that none of the spectrometer’s optics are disturbed during shutter installation. Any damage that results from attempting to install a shutter unassisted is not covered under Warranty.
See the appropriate spectrograph manual for detailed shutter installation instructions. Call Jobin Yvon Customer Service for assistance with shutter installation.
Shutter model 227MCD for use with TRIAX320, TRIAX550, 750I and 270M spectrographs.
Figure 20. Shutter Model 227MCD Diagram
65

Appendix C: Shutter Options
Shutter Model MSL-TSHCCD Diagram for use with Triax320, Triax550 and Triax180/190 Spectrographs.
Figure 21. Shutter Model MSL-TSHCCD Diagram
66

Appendix C: Sutter Options
Shutter model 1425MCD(series) for use with 500M, 750M, 1000M,1250M, 1269, 1403, 1404, 1870 and 1877 Spectrographs.
INSTRUMENT WALL
CLEARANCE HOLESFOR 10-32 X 1/4"FOR 1681, 340 SERIES
1/4-20 X 3/8" HEX SOCKETCAP SCREWS FOR 500M,1250M1403,1404 AND 1877 (2)
Figure 22. Shutter Model 1425MCD Diagram
67

Appendix C: Shutter Options
Shutter model 23009030 for use with CP140, CP200, HR640 and THR1000 Spectrographs
FEMALETHREAD
28 X 1mmMALETHREAD
BNC CONNECTORFOR SHUTTER DRIVE
Figure 23. Shutter Model 23009030 Diagram
Contact the JY Service Department for assistance in shutter selection and installation.
68

Appendix D: Performing Routine Procedures with SynerJY
CCD Focus and Alignment on the Spectrograph 1. Attach a spectral line source, such as a mercury lamp, to the instrument
entrance slit.
2. Start SynerJY. In Experiment Setup, select Monos from the General tab.
3. Enter an entrance slit width of 13 µm (.0130 mm) then manually close the height limiter to 1 mm.
4. Click the Detectors icon from the General tab. Click the Active check box to activate the detector and select Spectra as the Acquisition Mode. Select MCD Position as the experiment Type and enter a reference Center Wavelength (such as Hg line at 546 nm).
5. Click the Advanced button to view the Advanced Multi-channel Parameters screen. Set the data to display as signal intensity (Y-axis) vs. pixel position (X-axis). Click OK to close the window.
69

Appendix D: Performing Routine Procedures with SynerJY
6. Click the Preview button to open Data Preview mode. Set the Integration Time to 0.1 second or less, and select the Continuous spectral acquisition check box.
7. Run continuous spectral acquisition. While continuously running, adjust the Integration Time until the observed signal is approximately 40,000 counts.
8. Click Stop.
9. Zoom in on the central peak.
10. Observe the spectra. A focused, aligned CCD will provide a distinct peak of large amplitude, generally symmetrical to the limits of the design of the spectrometer. The peak should be less than or equal to 5 pixels wide across the Full Width of Half the Maximum height (FWHM). Excessive asymmetry of the peak is a sign that the slit image is not aligned to the pixel columns; diminished shape and magnitude are symptomatic of defocusing.
70

Appendix D: Performing Routine Procedures with SynerJY
11 While in Data Preview, select Detectors and set 5 equal areas in the Free Form Area list. Click the Reformat button to display the areas then click Apply to apply the area change as a parameter.
12. Select Continuous and Run the experiment.
13. Adjust the CCD orientation by rotating the detector head right or left in the focal plane while in continuous acquisition. To rotate the detector head, first loosen the multi-channel adaptor mounting screw, then slightly rotate the detector head right or left in the focal plane.
14. When aligned the 5 spectra will overlap and display similar intensity. Each spectrum should be less than 5 pixels wide at FWHM.
15. Once the CCD has been focused and aligned, tighten the CCD adaptor mounting screw to securely position the detector head.
16. Reformat the chip to 1 area and Run to check that the peak is less than 5 pixels wide at FWHM. This will confirm that the CCD is focused and aligned.
71
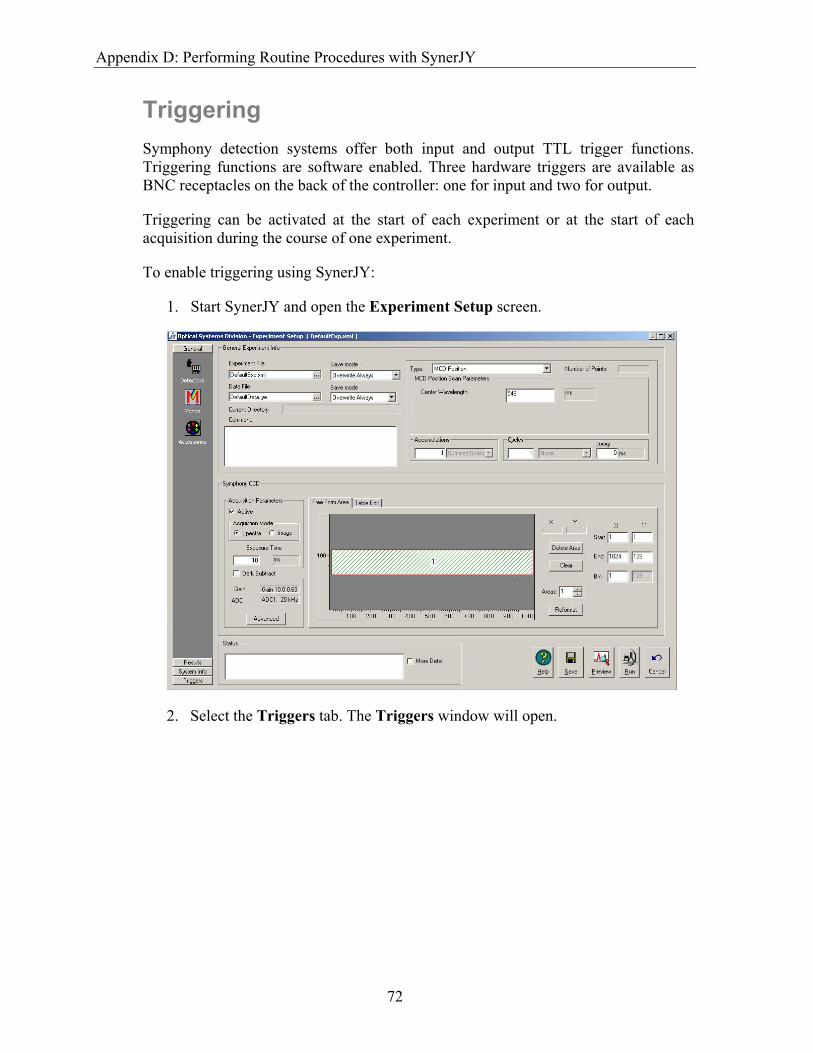
Appendix D: Performing Routine Procedures with SynerJY
Triggering Symphony detection systems offer both input and output TTL trigger functions. Triggering functions are software enabled. Three hardware triggers are available as BNC receptacles on the back of the controller: one for input and two for output.
Triggering can be activated at the start of each experiment or at the start of each acquisition during the course of one experiment.
To enable triggering using SynerJY:
1. Start SynerJY and open the Experiment Setup screen.
2. Select the Triggers tab. The Triggers window will open.
72

Appendix D: Performing Routine Procedures with SynerJY
3. From the Input Trigger heading, click Enable to activate the Input Trigger.
4. Select the appropriate Input Trigger parameters. Event allows the user to specify whether the Trigger will be enabled once, at the start of the experiment or at the start each acquisition (for multiple acquisition experiments). Select a Signal Type to indicate TTL Rising Edge or TTL Falling Edge.
5. From the Output Trigger heading click Enable to activate an Output Trigger.
6. Select the appropriate Output Trigger parameters. TTL Output 1 can be used for Experiment Running functions. TTL Output 2 can be used for Each Shutter Open or Chip Readout functions. Either TTL Active Low or TTL Active High can be selected as the Signal Type.
7. Click Run to start the experiment.
73

Appendix D: Performing Routine Procedures with SynerJY
74

Appendix E: Liquid Nitrogen Precautions and Filling Instructions
CAUTION
Liquid Nitrogen requires special handling, and should be used by trained users only. Review this section carefully before filling the dewar.Ventilation In confined spaces lacking adequate ventilation, nitrogen gas can displace air to the extent that it can cause asphyxiation. Always use and store liquid nitrogen in well-ventilated spaces.
Extreme Cold The boiling point of liquid nitrogen at atmospheric pressure is 77.3 K (about -196 oC). This extreme cold can cause tissue damage similar to a severe burn. Therefore, exposure of the skin or eyes to the liquid, cold gas, or liquid-cooled surfaces must be avoided.
The liquid should be handled so that it will not splash or spill. Lab coats, Cryogenic gloves, and chemical splash goggles or a laboratory face shield should be worn when handling the liquid. Feet can be protected by wearing rubber boots that are covered by trousers (without cuffs).
Storage and Transfer Liquid nitrogen should always be stored in vacuum-insulated dewars. Dewars should be loosely covered but not sealed. Covering prevents moisture from condensing out of the air and forming ice which may cause blockage inside the dewar.
CAUTIONNEVER ATTEMPT TO SEAL THE MOUTH OF THE DEWAR!
Sealing results in pressure buildup. The gas-to-liquid volume ratio is about 680:1. All containment vessels must therefore be fitted with exhaust vents to allow evaporating gas to escape safely. If these vents are sealed, pressure will build up rapidly and may result in containment vessel explosion.
75

Appendix E: Liquid Nitrogen Precautions and Filling Instructions
LN2 Filling Instructions Using a pressurized storage vessel:
1. Remove the cap and insulating plug from the detector dewar.
2. Insert the fill tube, and let the nitrogen flow into the dewar.
The company providing the pressurized storage vessel can instruct you on vessel use and storage.
Using a funnel and transfer dewar:
1. Insure that the funnel has ribs to provide gaps to vent the boiled off vapor inside the camera dewar as the liquid nitrogen is added. Set the funnel into the mouth of the dewar.
2. Slowly pour the liquid nitrogen into the funnel from the transfer dewar until the detector dewar is full.
The dewar is full when the liquid nitrogen reaches the bottom of the narrow neck of the dewar. A probe such as a clean wooden dowel may be inserted and removed to reveal a frost line indicating the nitrogen level.
Periodic Filling:
The larger, 2.8-liter dewar permits continuous cooled operation of the detector by virtue of its 72-hour hold time. The smaller, 1-liter dewar, with a hold time of 24 hours, is designed for more intermittent operations.
Replace the cap when the dewar is full. The cap is insulated to help extend the interval between fills. It also minimizes moisture condensation into the dewar. The loose fit of the cap prevents pressure buildup in the dewar by allowing evaporating nitrogen to escape.
When filling the dewar, an initial period of nitrogen boiling and overflow occurs until the internal components of the dewar have cooled to liquid nitrogen temperature. After this initial boil-off period, refill the dewar as needed to extend the cold temperature hold time.
76

Service Policy
If you need assistance in resolving a problem with your instrument, contact our Customer Service Department directly, or if outside the United States, through our representative or affiliate covering your location.
Often it is possible to correct, reduce, or localize the problem through discussion with our Customer Service Engineers.
All instruments are covered by warranty. The warranty statement is printed on the inside back cover of this manual. Service for out-of-warranty instruments is also available, for a fee. Contact Jobin Yvon or your local representative for details and cost estimates.
If your problem relates to software, please verify your computer's operation by running any diagnostic routines that were provided with it. Please refer to the SynerJY Help File for troubleshooting procedures. If you must call for Technical Support, please be ready to provide the software serial number, as well as the software version and firmware version of any controller or interface options in your system. The software version can be determined by selecting the software name at the right end of the menu bar and clicking on “About.” Also knowing the memory type and allocation, and other computer hardware configuration data from the PC's CMOS Setup utility may be useful.
In the United States, customers may contact the Customer Service department directly. From other locations worldwide, contact the representative or affiliate for your location. In the USA: Jobin Yvon Inc 3880 Park Ave, Edison, New Jersey, 08820 USA Tel: +1-732-494-8660 Ext. 185 Fax: +1-732-549-5125 Email: [email protected]
In France: Jobin Yvon SAS 16-18 rue du Canal 91165 Longjumeau Cedex France Tel: +33 (0) 1 64 54 13 00 Fax: +33 (0) 1 69 09 93 19
Worldwide: 1-877-JYHoriba China: +86 (0) 10 6849 2216 Germany: +49 (0) 89 462317-15 Italy: +39 (0) 2 57603050 Japan: +81 (0) 3 58230141 UK: +44 (0) 20 8204 8142
If an instrument or component must be returned, the method described on the following page should be followed to expedite servicing and reduce your downtime.
77

Return Authorization
All instruments and components returned to the factory must be accompanied by a Return Authorization Number issued by our Customer Service Department.
To issue a Return Authorization number, we require:
• The model and serial number of the instrument
• A list of items and/or components to be returned
• A description of the problem, including operating settings
• The instrument user's name, mailing address, telephone, and fax numbers
• The shipping address for shipment of the instrument to you after service
• Your Purchase Order number and billing information for non-warranty services
• Our original Sales Order number, if known
• Your Customer Account number, if known
• Any special instructions
78

Warranty
For any item sold by Seller to Buyer or any repair or service, Seller agrees to repair or replace, without charge to Buyer for labor or materials or workmanship of which Seller is notified in writing before the end of the applicable period set forth below, beginning from the date of shipment or completion of service or repair, whichever is applicable:
a. New equipment, product and laboratory apparatus: 1 year with the following exceptions:
i) Computers and their peripherals
ii) Glassware and glass products.
b. Repairs, replacements, or parts – the greater of 30 days and the remaining original warranty period for the item that was repaired or replaced.
c. Installation services – 90 days.
The above warranties do not cover components manufactured by others and which are separately warranted by the manufacturer. Seller shall cooperate with Buyer in obtaining the benefits of warranties by manufacturers of such items but assumes no obligations with respect thereto.
All defective items replaced pursuant to the above warranty become the property of Seller.
This warranty shall not apply to any components subjected to misuse due to common negligence, adverse environmental conditions, or accident, nor to any components which are not operated in accordance with the printed instructions in the operations manual. Labor, materials and expenses shall be billed to the Buyer at the rates then in effect for any repairs or replacements not covered by this warranty.
This warranty shall not apply to any Jobin Yvon manufactured components that have been repaired, altered or installed by anyone not authorized by Jobin Yvon in writing.
THE ABOVE WARRANTIES AND ANY OTHER WARRANTIES SET FORTH IN WRITING HERIN ARE IN LIEU OF ALL OTHER WARRANTIES OR GUARANTEES EXPRESSED OR IMPLIED, INCLUDING WARRANTIES OF MERCHANTABILITY, FITNESS FOR PURPOSE OR OTHER WARRANTIES.
The above shall constitute complete fulfillment of all liabilities of Seller, and Seller shall not be liable under any circumstances for special or consequential damages, including without limitation loss of profits or time or personal injury caused.
79

Warranty
The limitation on consequential damages set forth above is intended to apply to all aspects of this contract including without limitation Seller’s obligations under these standard terms.
80

Glossary of Terms
The discussion of light detection with Charge Coupled Devices (CCDs) requires some familiarity with the terminology used. This section includes definitions specific to this context for some familiar terms, as well as several unique terms, abbreviations and acronyms.
Accumulations
Accumulations are the number of repetitions for which the detector collects data and averages the results to obtain a better signal-to-noise ratio.
ADC An Analog to Digital Converter (ADC) converts a sample of an analog voltage or current signal to a digital value. The value may then be communicated, stored, and manipulated mathematically. The value of each conversion is generally referred to as a data point.
Advanced Inverted Mode Operation (AIMO) Advanced Inverted Mode Operation (AIMO) is a mode of operation specific to E2V CCD chips that significantly reduces dark current generation, thereby allowing thermo-electric cooling of the sensor to be more than adequate for most applications. This mode of operation is also referred to as MPP, which is also discussed in this glossary section.
Areas
Areas are defined as the active sections of the CCD detector. Signals that encounter sections of the CCD that are not part of an active area are not recorded. Once an area is specified, the area definitions refer to the number of areas and the size of the areas.
Back-thinning Back-thinning is a process where the CCD substrate is etched down to be very thin (≈ 10 µm), so that incident light can be focused on the backside of the chip where its depletion layer is not obstructed by the chip’s physical gate structure. This thinning technique increases the CCD’s photon sensitivity as illustrated by the higher quantum efficiency (QE) exhibited by these back-illuminated devices. It should be noted that back-thinned chips are sensitive to etaloning effects from the 700 nm to 1100 nm wavelength range (see Etaloning).
81
Glossary of Terms
Binning Binning is the process of combining charge from adjacent pixels and can be performed in both the vertical (Y) and horizontal (X) directions. For example, a binning factor of 2 x 2 corresponds to the combination of two pixels in both the X and Y directions producing one “super” pixel equivalent to the total charge of the four original pixels. It should be noted that binning does reduce resolution capability; however, it increases sensitivity and improves (i.e. lowers) the overall CCD readout time. End-users are cautioned that there is a limit to the effectiveness of hardware binning as a result of the horizontal serial shift register and output node not having infinite capacity to store charge. This physical limitation is best exemplified for applications that have a very small signal superimposed on a large background. In practice, the pixels associated with the horizontal register have twice the full well capacity of their light sensitive counterparts, while the output node usually can hold four times that of the photosensitive area. Thus, experiments where the summed charge exceeds either the full well capability of the horizontal shift register and/or the output node will be lost from a data processing point of view.
Charge Coupled Device A Charge Coupled Device (CCD) is a light sensitive silicon chip that is used as a two-dimensional photo-detector in digital cameras for both imaging and spectroscopic applications. With respect to spectroscopic applications, the CCD simultaneously measures intensity, X-position (wavelength) and Y-position (slit height) differences projected along the spectrograph image plane.
CCD sensors are offered by a number of manufacturers and come in a variety of sizes, chip architectures and performance grades to best meet the application at hand.
Charge Transfer Efficiency (CTE) The percentage of charge moved from one pixel to the next is the charge transfer efficiency. The CCD has a high CTE if the pixels are read out slowly. As the speed at which the charge is transferred is increased, increasing amounts of the charge is left behind. The residual charge combines with the charge of the next pixel as it is moved into the cell. Therefore, using too high a transfer rate deforms the image shape; it smears the charge over the pixels that follow in the readout cycle. Temperature also affects CTE. Under normal operation the CTE is approximately 99.9995%. Below –140 °C the movement of the charges becomes sluggish, and, again, the image becomes smeared.
Correlated Double Sampling (CDS) This sampling method utilizes a differential measurement technique to achieve a higher precision measurement for each pixel processed during the during the CCD readout cycle. This difference measurement (B-A) is accomplished by making two voltage measurements for each pixel processed as follows:
82

Glossary of Terms
• Measurement A: Residual output amplifier charge during CCD reset time
• Measurement B: Real charge associated with the current pixel being processed
Electronic circuitry that employs this CDS measurement technique is especially important to properly characterize pixel response at low signals levels, since a minute residual charge always remains present on the CCD output node even after the CCD’s reset gate has been activated once a pixel has been read out. Thus, this process ensures that only the true charge associated with the current pixel being processed is measured.
Cosmic Ray Events Cosmic Rays are high-energy particles from space, mostly attributed from the sun. They will generally be detected by a scientific grade detection system, since the cooled CCD offers extremely low dark signal level. In the active area of a typical array, about 5 events per minute per sensor cm2 may occur. Compared to very weak signals from the experiment at hand, detected comic ray events can be quite distracting. To minimize the effects of these rays, the end-user can utilize the smallest section of the chip required by the experiment, as well as, use the smallest integration time possible. In addition, mathematical treatment of the data can also be used to remove these spurious spikes in the spectra. Please refer to the SynerJY software manual for more information about cosmic ray spike removal.
Dark Signal Dark signal is generated by thermal agitation. This signal is directly related to exposure time and increases with temperature. The dark signal doubles with approximately every 7 oC increase in chip temperature. The more the dark signal, the less dynamic range will be available for experimental signal. This signal accumulates for the entire time between readouts or flushes, regardless of whether the shutter is open or closed. Dark signal is also generated during the charge transfer cycles of the CCD. The problem is not necessarily the dark signal, but the noise in measuring the signal that adversely affects the data.
Dark Signal Nonuniformity (DSNU) Dark signal nonuniformity (DSNU) is the peak-to-peak difference between the dark signal generation of the pixels on a CCD detector in a dark exposure.
Dynamic Range Dynamic Range is the ratio of the maximum and minimum signal measurable. For a 16-bit detection system, the ideal / optimum dynamic range would be represented by 65,535:1. With respect to a CCD, this performance figure of merit corresponds to the ratio of a pixel’s full well saturation charge to the output amplifier’s read noise. It
83

Glossary of Terms
should be noted that the pixel’s full well saturation charge correlates directly to the CCD’s well capacity and varies with the device’s pixel size and overall structure.
A more useful calculation of dynamic range, so far as a CCD sensor is concerned, centers around the “effective system” dynamic range. This system level parameter corresponds to the ratio of a CCD pixel’s “linear” full well saturation charge to the total system noise level.
Effective System Dynamic Range = Pixel Linear Full Well Saturation Charge Total System Noise
Here, the total system noise takes into account the CCD array’s read noise, as well as, the noise contribution from the detector system’s electronics as follows:
e Total System Noise = e CCD Read Noise 2 + e Electronics Noise 2
It is important to note that the above calculation for total system noise assumes a 1 ms integration time and ignores the noise contributions from the array’s dark current shot noise and the signal itself (i.e. shot noise).
Electrons/Count Electrons per count is a system level “transfer function” parameter or gain related value that equates the number of electrons required to generate a single ADC count.
Etaloning When a very thin piece material is used as an optical component, multiple interference patterns may be observed. This effect is called Etaloning. When the thickness of the material is on the order of the wavelength of light passed through, etaloning may prevent the detector from distinguishing an actual signal from the interference pattern. Etaloning is problematic with backthinned CCD chips in the wavelength range 700 nm to 1100 nm.
Felgett's Advantage: Multi-channel detection provides an improvement in signal to noise ratio, as compared to single channel (scanned) spectral detection. Because the multi-channel detection acquires a number of spectral elements simultaneously, the S/N is improved by a factor proportional to the square root of the number of channels acquired given the experiment times are equal.
Flush To reduce noise and maximize dynamic range at the CCD, the dark charge that has accumulated on the chip can be rapidly removed by flushing. The effect of flushing
84

Glossary of Terms
the array is similar to a readout cycle in that the charges are cleared from the pixels. A flush is much faster than a frame readout since it dumps the charges without conversion. Flushing is only necessary when there is an appreciable time between readouts.
Full Well Capacity Full well capacity is the measure of how much charge can be stored in an individual pixel. This specification varies for each chip type. It depends on the doping of the silicon, architecture and pixel size. The quantum well capacity is usually around 300,000 electrons. The greater the well, the greater the Dynamic Range. A chip with a larger full well capacity can record a higher signal level before saturating. See also Variable Gain.
Gain Gain is the conversion between electrons generated in the CCD to counts reported in the software. Gain is typically set to be just below the read noise for most low light measurements, or set to take advantage of the full dynamic range for larger signals. Typically, because CCDs are extremely low noise devices, meaningful gains as low as 1 –2 electrons per count can be achieved. See also Variable Gain.
Integration Time
The amount of time for which the CCD is exposed to light and acquires data.
Linearity When photo response is linear, if the light intensity doubles, the detected signal will double in magnitude as well. Nonlinear response at medium to high intensities is usually due to amplifier problems, and at very low light levels poor charge transfer efficiency. A CCD’s response is linear, once the bias is subtracted.
Multi Phase Pinning (MPP) Multi Phase Pinning (MPP) is a mode of operation specific to certain CCD brand names, such as E2V and Hamamatsu, that offer extremely low dark current operation. See also AIMO.
Noise Noise is common to all detectors and associated camera systems. The total amount of real signal that exists in an experiment is less important than the ratio of the signal’s magnitude to the total system noise that exists. This signal to noise ratio (S/N) is more commonly referred to as the system’s effective dynamic range (see also Dynamic Range). Thus, for detector systems with a high S/N figure, a signal peak can be discerned even though signal counts per second may be low. A detector system’s
85

Glossary of Terms
total system noise is comprised of the noise sources listed below and is defined as follows:
e Total System Noise = e CCD Read Noise 2 + e Electronics Noise 2 + e CCD Read Noise 2 + e Electronics Noise 2
It should be noted that for applications that have high intensity signals, the shot noise from the signal itself dominates the system’s total noise. Conversely, for experiments that involve the detection of very weak signals, the system’s total noise is dominated by the CCD related read noise and dark noise along with the ever present electronics noise source.
• Electronics Noise ( e electronics noise)
Noise that is introduced in the process of electronically amplifying and conditioning the detector signal, as well as, the ADC conversion noise associated with digitizing the pixel information.
• CCD Read Noise ( e ccd read noise )
Noise that is generated by the CCD’s on-chip output amplifier. This noise parameter is frequency dependent and will increase with increased pixel processing times.
• CCD Dark Noise ( e ccd dark noise )
Noise that is generated due to the random statistical variations of the dark current and is equal to the square root of the dark current. It should be noted that dark current can be subtracted from an image or spectra and will not contribute to the total system noise; however, the dark noise remains. In addition, cooling the array can significantly reduce the accumulation of dark current and its associated dark noise. This is exemplified by the LN2 cooled CCD detector head, which typically yields less than one electron/pixel/hour of dark signal.
• CCD Shot Noise ( e ccd shot noise ):
Noise that is generated due to the random statistical variations associated with light. Shot noise is equal to the square root of the number of electrons generated.
Photoelectric Effect Some materials respond to light by releasing electrons. When light of sufficient energy hits a photosensitive material, an electron is freed from being bound to a specific atom. Such materials include the P-N junctions of the silicon photodiodes used in CCD arrays. The energy of the light must be greater than or equal to the binding energy of the electron to free an electron. The shorter the wavelength, the higher the energy the light has.
86

Glossary of Terms
Photoelectron A photoelectron is an electron that is released through the interaction of a photon with the active element of a detector. The photoelectron could be released either from a junction to the conduction band of a solid-state detector, or from the photocathode to the vacuum in a PMT. A photoelectron is indistinguishable from other electrons in any electrical circuit.
Photo Response Nonuniformity (PRNU) PRNU is the peak-to-peak difference in response between the most and least sensitive elements of an array detector, under a uniform exposure giving an output level of VSat/2. These differences are primarily caused by variations in doping and silicon thickness.
Quantum Efficiency (QE) The efficiency of a detector’s photoelectric effect is quantified by the ratio of the number of photoelectrons produced to the number of photons impinging on the CCD’s photoactive surface. For example, a QE of 20% would indicate that one photon in five would produce a distinguishable photoelectron.
The quantum efficiency of a detector is determined by several factors that include: (1) the material’s intrinsic electron binding energy or band gap, (2) the surface reflectivity and thickness and (3) the energy of the impinging photon. It should also be noted that QE varies with the wavelength of the incident light, as illustrated by the fact that standard “front illuminated” CCDs generally have a peak QE of 45-50% at around 750 nm. Back-thinned CCDs typically have improved QE curves, compared with their “front illuminated” counter-parts, that produce peak QE’s in the 80-85% range. Additionally, the QE at short wavelengths can be improved by coating the chip with a fluorescent dye that converts UV light to longer wavelengths where the quantum efficiency of the CCD is higher.
Readout Time The readout time of a CCD is the interval required to move the charges from their photo-sensitive locations to the readout register, sample and amplify the charges and then digitize them into discrete digital data points. Included in this readout time is the correlated double sampling (CDS) technique, which generally requires more processing time per pixel compared with other less accurate measuring methods. It should be noted that faster readout times increase the total system noise thereby reducing the effective system dynamic range. See also Correlated Double Sampling and Dynamic Range.
87

Glossary of Terms
Responsivity Responsivity is the absolute QE sensitivity given in units of amps/watt. CCDs are typically characterized by performance factors such as QE, counts and gain (specified in electrons/count) instead of responsivity.
Saturation Level The maximum signal level that can be accommodated by a device is its saturation level. At this point, further increase in input signal does not result in a corresponding increase in output. This term is often used to describe the upper limit of a detector element, an amplifier, or an ADC.
Spectral Response Most detectors will respond with higher sensitivity to some wavelengths than to others. The spectral response of a detector is often expressed graphically in a plot of responsivity or QE versus wavelength.
Time Interval
The elapsed time between the start of one accumulation to the start of the next accumulation. The Time Interval, Integration Time and Readout Time of the CCD detector have the following relationship:
t interval ≥ t integration + t read
UV Overcoating (Enhancement) The depth of penetration into silicon is very shallow for UV light. With this shallow penetration, the probability of a UV photon penetrating to the depletion zone is less than for longer wavelength photons. Thus the QE is lower in the UV than in the visible and NIR region.. By coating the chip with a fluorescent dye that converts UV light to longer wavelengths, the probability of photon detection is increased. Lumigen is a phosphor coating used for UV enhancement.
Variable Gain Variable Gain is the ability to match the range of the ADC to the usually larger range of the CCD without losing valuable information.
Signal can be extracted from the noise baseline by statistical treatment. Oversampling of this noise will make this extraction more accurate, so the gain can be electronically adjusted to quantize this small signal at high resolution, typically 1 or 2 electrons per count. Since stronger signals saturate the ADC quicker, low electrons per count is considered high gain (a small signal produces a large response).
88

Glossary of Terms
Conversely, large optical signals can tax the full dynamic range available on the chip, which may be in excess of the ADC dynamic range. In this case, a lower gain of typically 4 – 6 electrons per count will report a smaller count value versus a high gain setting, and allow the range of the ADC to cover the maximum charge of the CCD. Statistical information in the baseline is generally not the limiting factor of an acquisition with full range signals present, and thus can be traded off without penalty.
X Binning X Binning is the combining of columns of pixels to form a single data point. By combining columns, a greater signal level can be detected; however, this results in a decrease in resolution. See Binning.
Y Binning Y Binning is the combining if rows of pixels to form a single data point. By combining rows, a greater signal level can be detected; however, this results in a decrease in resolution. See Binning.
89

Glossary of Terms
90

Notes
91

Notes
92

Index
10/100 Ethernet hardware interface, 42
AC Input Power, 40 Acquisition Mode Parameters, 23 Acquisition Modes, 21 CCD range, 22 center wavelength, 21 time based, 22
Auto-Recognition, 39 CE Compliance, 2 tests and standards, 63
Components, 9 Computer Requirements, 6 Controller, 36 Detector Heads, 31 CCD array, 31 chamber, 34 cooling options, 1, 31
Detector Video Control, 44 Disassembly, 49 Electrical connections, 13 Electrical Interconnect Diagram LN2, 15 STE, 14
Electrical Interfaces controller, 42 detector head, 34
Electrons/Count, 84 Environmental Requirements, 5 Felgett’s Advantage, 84 Flush, 84, 85 Focus and Alignment, 20 with SynerJY, 69
Full Well Capacity, 85 Gain options 1 M Hz, 38 options 20 kHz, 38
Gain Selections, 37 Hardware Binning, 39 Input Power, 5 Interface Drawings 1 L Side Mount LN2, 59 LN2 Head Mounting Flange, 61
STE CCD Detector Head, 58 STE Head Mounting Flange, 60 Symphony Controller, 57
LEDs state on power up, 17
Linearity, 85 Liquid Nitrogen precautions, filling instructions, 75
Maintenance, 6 Network Interface Card Configuration, 11 Installtion, 10
Network Verification ping, 54
Photo Response Nonuniformity, 87 Photoelectric Effect, 86 Photoelectron, 87 Ping network verification, 18, 54
Powering Down, 49 Power-up, 17 Quantum Efficiency, 87 Readout Time, 87 Responsivity, 88 Return Authorization, 78 Safety Requirements, 6 Saturation Level, 88 Shutter diagrams, 65 models, 47
Shutter Mounting Model 1425MCD, 67 Model 227MCD, 65 Model 23009030, 68 Model MSL-TSHCCD, 66
Specifications, 3 Spectral Response, 88 Spectrograph mounting dectector to, 12
Symphony-Solo, 37 Symphony-Solo-Fast, 37 System Optimization environmental noise reduction, 52
93

optical, 51 spatial, 51
TE Power Supply, 40 Temperature Control, 29 Triggering, 25 to an external event, 26 with SynerJY software, 72
Troubleshooting, 51 UV Overcoating, 88 Variable Gain, 88 Ventilation Requirements, 5 Warranty, 79
94

[Design Concept]
The HORIBA Group application images are collaged in the overall design.Beginning from a nano size element, the scale of the story develops all the way to the Earth with a gentle flow of the water.
3880 Park Avenue, Edison, New Jersey 08820-3012, USA