Embed Size (px)
Citation preview
Symmetry 2011, 3, 246-264; doi:10.3390/3020246OPEN ACCESS
symmetryISSN 2073-8994
www.mdpi.com/journal/symmetry
Article
Similar Symmetries: The Role of Wallpaper Groups in
Perceptual Texture Similarity
Alasdair D. F. Clarke 1;?, Patrick R. Green 2, Fraser Halley 1 and Mike J. Chantler 1
1 School of Mathematical and Computer Sciences, Heriot-Watt University, Edinburgh, EH14 4AS,
Scotland, UK; E-Mails: [email protected](F.H.); [email protected](M.J.C.)2 School of Life Sciences, Heriot-Watt University, Edinburgh, EH14 4AS, Scotland, UK;
E-Mail: [email protected]
? Author to whom correspondence should be addressed; E-Mail: [email protected];
Tel.: +44-131-451-4166; Fax: +44-131-451-3327.
Received: 1 March 2011; in revised form: 15 April 2011 / Accepted: 19 May 2011 /
Published: 25 May 2011
Abstract: Periodic patterns and symmetries are striking visual properties that have been
used decoratively around the world throughout human history. Periodic patterns can be
mathematically classi�ed into one of 17 differentWallpaper groups, and while computational
models have been developed which can extract an image's symmetry group, very little work
has been done on how humans perceive these patterns. This study presents the results from
a grouping experiment using stimuli from the different wallpaper groups. We �nd that while
different images from the same wallpaper group are perceived as similar to one another,
not all groups have the same degree of self-similarity. The similarity relationships between
wallpaper groups appear to be dominated by rotations.
Keywords: wallpaper groups; texture similarity; pattern recognition; texture classi�cation
1. Introduction
Symmetry and tilings have been used in art and architecture throughout human history [1�3].
Two-dimensional periodic patterns can be classi�ed into 17 different wallpaper groups based on the
Euclidean plane isometries (translations, re�ections, rotations and glides) that they possess. Islamic,
Moorish and Egyptian architecture (see Figure 1) and the art of M. C. Escher are rich with ornate
Symmetry 2011, 3 247
examples. The Alhambra palace contains examples of most, if not all, of the wallpaper groups [4,5].
These patterns are also used throughout everydayWestern architecture (see Figure 2 for some examples).
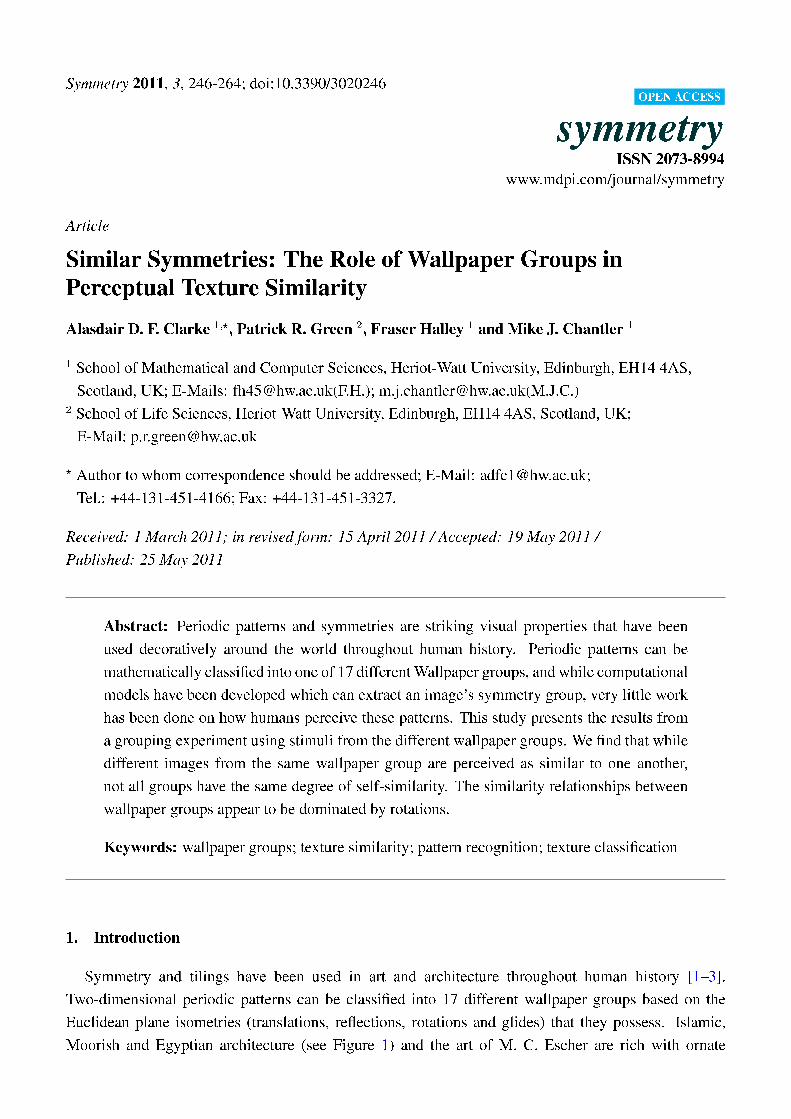
Figure 1. Some examples of ornate symmetrical patterns.
(a) P3M1 (b) P2 (c) P4G
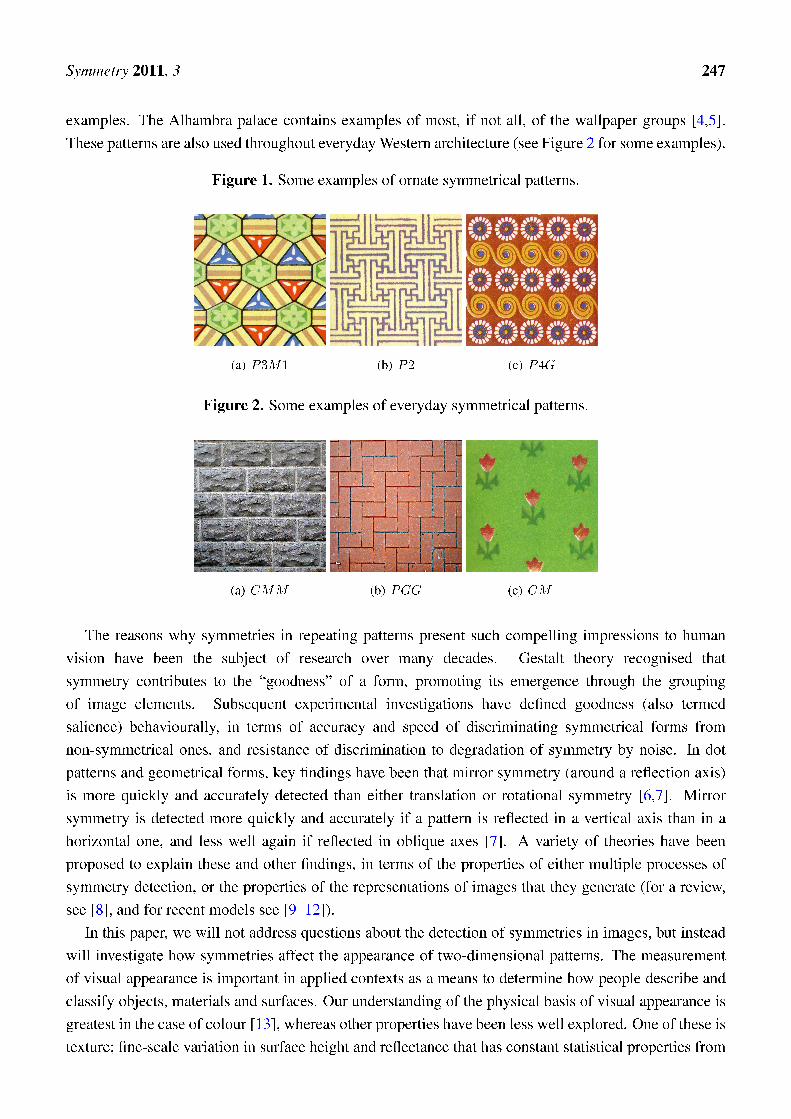
Figure 2. Some examples of everyday symmetrical patterns.
(a) CMM (b) PGG (c) CM
The reasons why symmetries in repeating patterns present such compelling impressions to human
vision have been the subject of research over many decades. Gestalt theory recognised that
symmetry contributes to the �goodness� of a form, promoting its emergence through the grouping
of image elements. Subsequent experimental investigations have de�ned goodness (also termed
salience) behaviourally, in terms of accuracy and speed of discriminating symmetrical forms from
non-symmetrical ones, and resistance of discrimination to degradation of symmetry by noise. In dot
patterns and geometrical forms, key �ndings have been that mirror symmetry (around a re�ection axis)
is more quickly and accurately detected than either translation or rotational symmetry [6,7]. Mirror
symmetry is detected more quickly and accurately if a pattern is re�ected in a vertical axis than in a
horizontal one, and less well again if re�ected in oblique axes [7]. A variety of theories have been
proposed to explain these and other �ndings, in terms of the properties of either multiple processes of
symmetry detection, or the properties of the representations of images that they generate (for a review,
see [8], and for recent models see [9�12]).
In this paper, we will not address questions about the detection of symmetries in images, but instead
will investigate how symmetries affect the appearance of two-dimensional patterns. The measurement
of visual appearance is important in applied contexts as a means to determine how people describe and
classify objects, materials and surfaces. Our understanding of the physical basis of visual appearance is
greatest in the case of colour [13], whereas other properties have been less well explored. One of these is
texture; �ne-scale variation in surface height and re�ectance that has constant statistical properties from
Symmetry 2011, 3 248
one patch of a surface to another. The main perceptual dimensions along which people classify images
of textures have been identi�ed [14,15], and include roughness, directionality and regularity. However,
progress has only been made in identifying the mathematical properties of surfaces that underlie these
dimensions in a few speci�c cases, such as roughness in random-phase surfaces [16], and the effects of
phase randomisation on the appearance of phase-rich surfaces [17].
Since the visual textures used in the creation or decoration of arti�cial surfaces often contain
periodically repeating elements, it is interesting to ask how the symmetries present in such textures
in�uence human perception of their appearance. Previous work on the appearance of patterns containing
symmetries has tested their effects on aesthetic impressions, showing that there is a correlation between
symmetric patterns and judgements of �beauty� in a pattern [18], or on perceived complexity. In the
second case, [19] used �band� (or �frieze�) patterns consisting of a simple geometric form repeated
(translated) along a single axis, with combinations of re�ections, rotations and glide re�ections de�ned
by the seven symmetry groups that are possible for such a pattern. They concluded that processes of
grouping these elements into larger perceived �motifs� partially overrode the effects of symmetry on
judgements of complexity.
Here, we aim to use two-dimensional periodic patterns made up from patches of random-dot noise
to measure the perceived similarity of exemplars from each of the wallpaper groups to other exemplars
of the same group, and to exemplars of the other groups. To this end, a free-sorting experiment will
be described in which observers were asked to sort a set of 85 patterns (i.e., 5 examples from each of
the 17 groups) into subsets of similar appearance. Similarity matrices obtained by this sorting method
have previously been used to identify the dimensions underlying human classi�cation of visual textures
(e.g., [14,15]). it is important to emphasise that observers in our experiment were not instructed to
classify the stimulus patterns into subsets according to the symmetries present in them, and nor was their
attention drawn to the fact that the patterns contained multiple symmetries or that they were relevant to
the experiment. Computer vision models that can extract a pattern's symmetry group from an image
have been developed [20�22], but this is likely to be a highly skilled task for humans, completely unlike
the judgements of visual similarity that we sought to obtain.
2. The 17 Wallpaper Groups
There are four Euclidean plane isometries: translation, rotation, re�ection and glide. A translation
involves shifting a plane by a displacement vector v. As we are dealing with periodic patterns, then
for each wallpaper group P , there exists a v 2 R2 such that P is invariant under the translation Tv.
(Note: this is only strictly true for patterns that repeat in�nitely in two directions). A rotation, Rc;�,
involves rotating around a point c by an angle of � result and a re�ection FL involves re�ecting the
pattern in the line L (mirror symmetry). Finally a glide GL;d is a combination of a translation along the
line L by distance d, followed by FL. The 17 different wallpaper groups all possess different Euclidean
plane isometries, and a summary is given in Table 1. We use the standard Crystallographic notation for
wallpaper groups [23]. For more details, see [24,25].
Symmetry 2011, 3 249
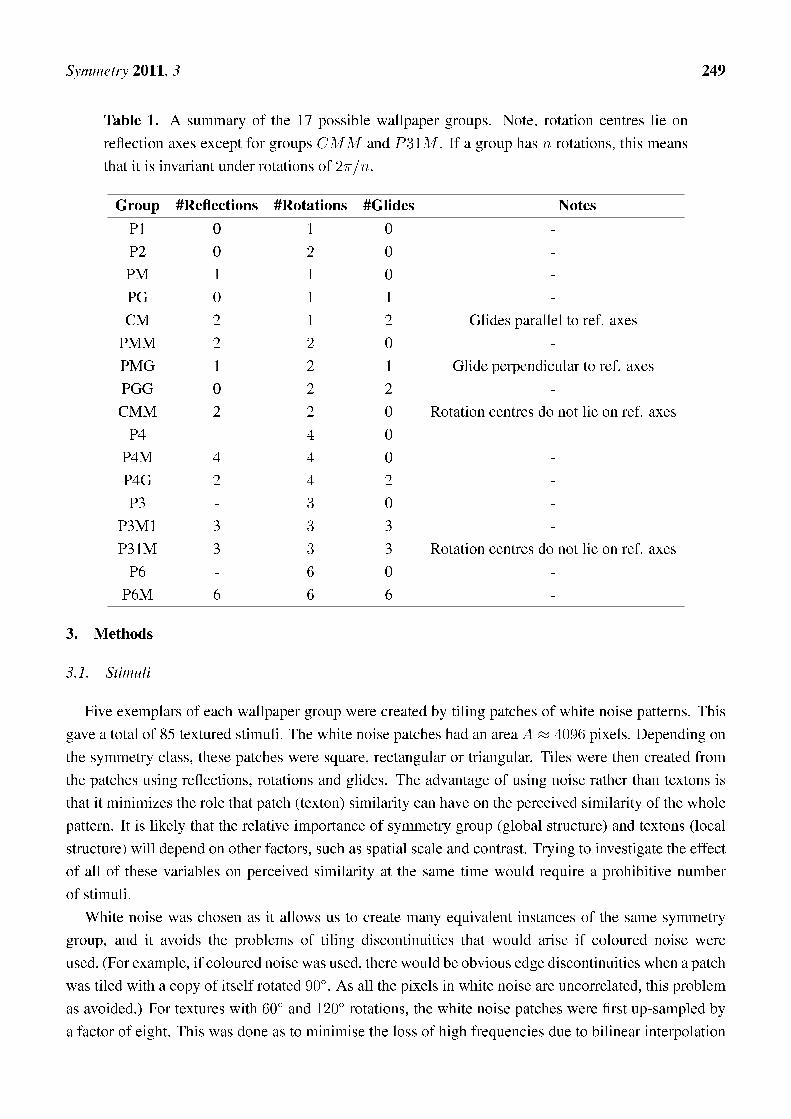
Table 1. A summary of the 17 possible wallpaper groups. Note, rotation centres lie on
re�ection axes except for groups CMM and P31M . If a group has n rotations, this means
that it is invariant under rotations of 2�=n.
Group #Re�ections #Rotations #Glides Notes
P1 0 1 0 -
P2 0 2 0 -
PM 1 1 0 -
PG 0 1 1 -
CM 2 1 2 Glides parallel to ref. axes
PMM 2 2 0 -
PMG 1 2 1 Glide perpendicular to ref. axes
PGG 0 2 2 -
CMM 2 2 0 Rotation centres do not lie on ref. axes
P4 - 4 0 -
P4M 4 4 0 -
P4G 2 4 2 -
P3 - 3 0 -
P3M1 3 3 3 -
P31M 3 3 3 Rotation centres do not lie on ref. axes
P6 - 6 0 -
P6M 6 6 6 -
3. Methods
3.1. Stimuli
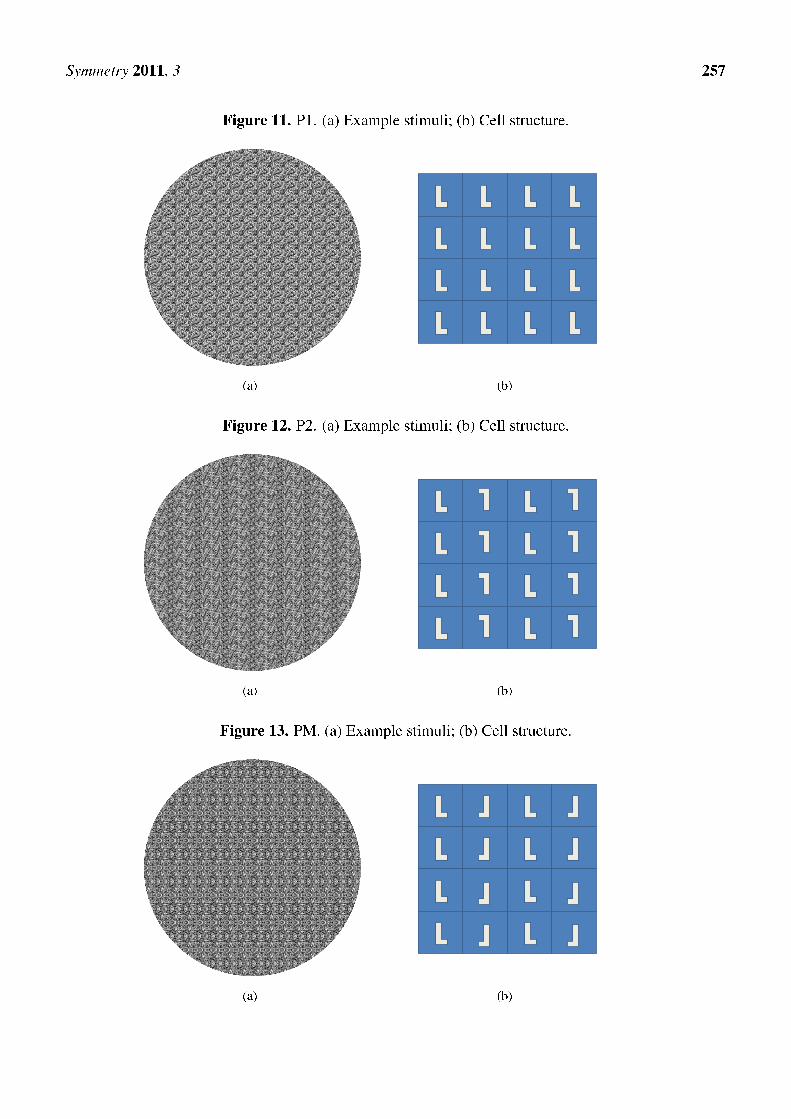
Five exemplars of each wallpaper group were created by tiling patches of white noise patterns. This
gave a total of 85 textured stimuli. The white noise patches had an area A � 4096 pixels. Depending on
the symmetry class, these patches were square, rectangular or triangular. Tiles were then created from
the patches using re�ections, rotations and glides. The advantage of using noise rather than textons is
that it minimizes the role that patch (texton) similarity can have on the perceived similarity of the whole
pattern. It is likely that the relative importance of symmetry group (global structure) and textons (local
structure) will depend on other factors, such as spatial scale and contrast. Trying to investigate the effect
of all of these variables on perceived similarity at the same time would require a prohibitive number
of stimuli.
White noise was chosen as it allows us to create many equivalent instances of the same symmetry
group, and it avoids the problems of tiling discontinuities that would arise if coloured noise were
used. (For example, if coloured noise was used, there would be obvious edge discontinuities when a patch
was tiled with a copy of itself rotated 90�. As all the pixels in white noise are uncorrelated, this problem
as avoided.) For textures with 60� and 120� rotations, the white noise patches were �rst up-sampled by
a factor of eight. This was done as to minimise the loss of high frequencies due to bilinear interpolation
Symmetry 2011, 3 250
when rotating the white noise patches. Once the tiled image had been created it was down-sampled back
to its original scale. Finally a Gaussian �lter (� = 1:5 pixels) was applied to all of the resulting tiled
images in order to remove any high frequency artifacts that may have been introduced by the rotation
operations. The standard deviation of pixel intensities was � 0:132 prior to printing.
These images were then printed onto card and cut into circles. This was done in order to encourage
observers to choose their own preferred orientation for each image. An example image from each group
is shown in Figures 11�27.
3.2. Participants
15 participants (10 male, 5 female), ranging in age between 23 and 58 years, took part in the
study. Some were familiar with experiments involving free sorting of textured images, but none with
experiments on symmetrical patterns. They did not receive payment for their participation.
3.3. Procedure
Participants were presented with all the 85 images laid out randomly on a large table, and were
instructed to classify them into as many subsets as they wished, by placing them into piles of any
size. They were free to take as long as they wished to complete the task, and to move images between
subsets until they were satis�ed with their classi�cation. They were not asked to group by symmetry,
only that their subsets should consist of similar images. The experiment was carried out in a corner
of a large of�ce, screened from natural light and illuminated by normal overhead room lighting (two
�uorescent tubes).
4. Results
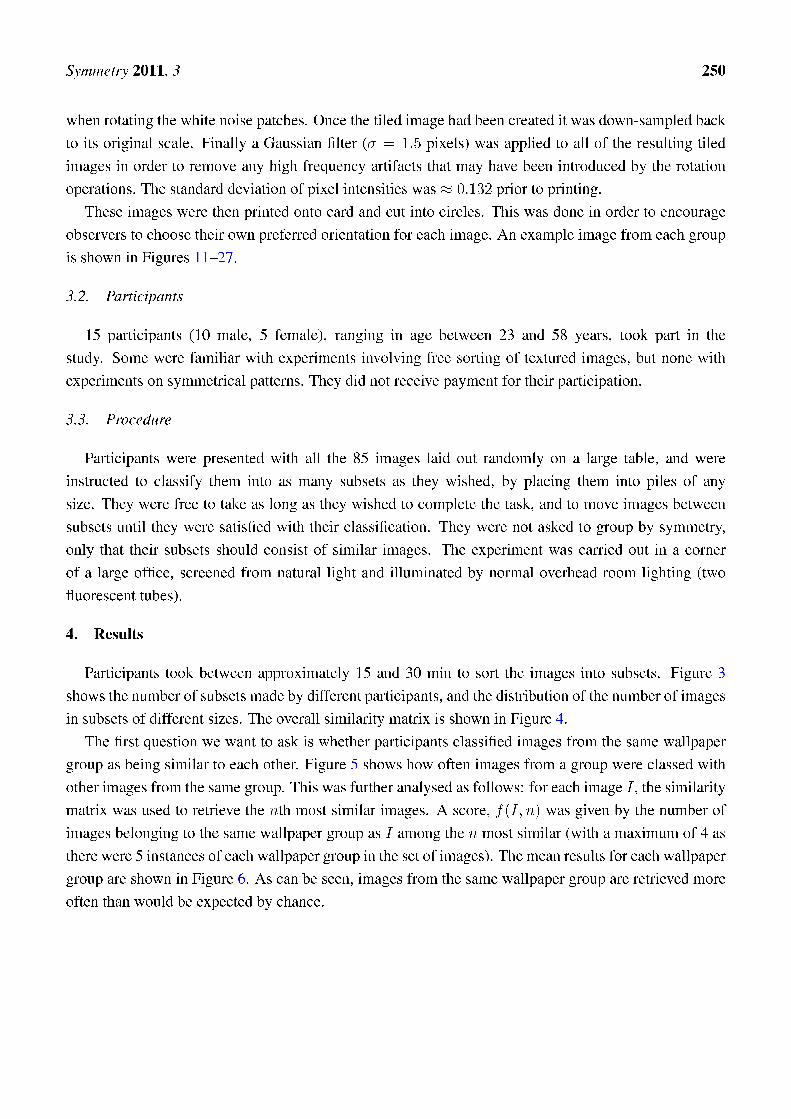
Participants took between approximately 15 and 30 min to sort the images into subsets. Figure 3
shows the number of subsets made by different participants, and the distribution of the number of images
in subsets of different sizes. The overall similarity matrix is shown in Figure 4.
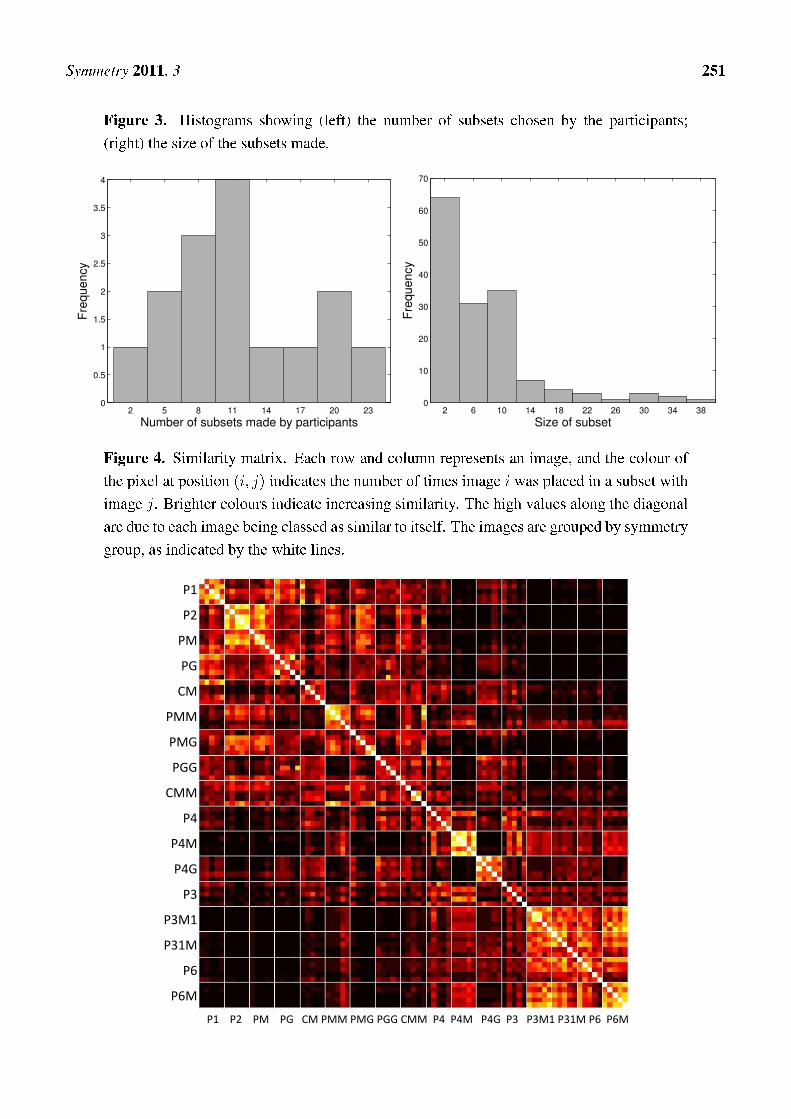
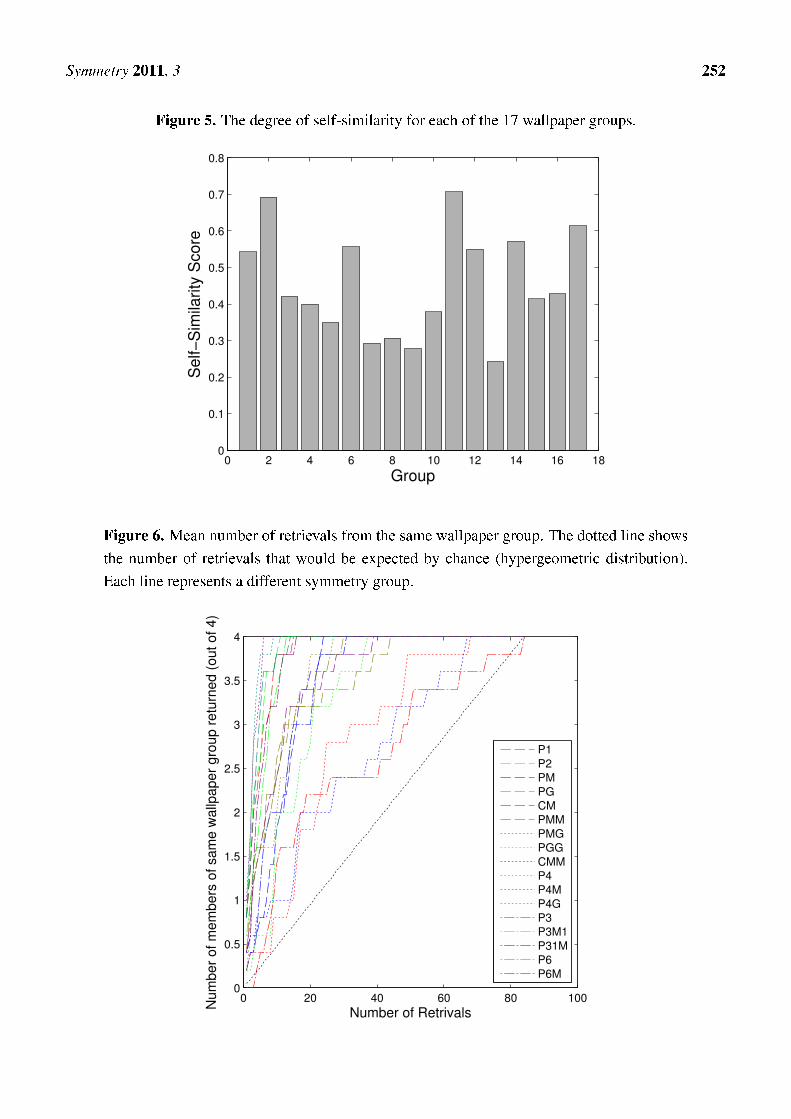
The �rst question we want to ask is whether participants classi�ed images from the same wallpaper
group as being similar to each other. Figure 5 shows how often images from a group were classed with
other images from the same group. This was further analysed as follows: for each image I , the similarity
matrix was used to retrieve the nth most similar images. A score, f(I; n) was given by the number of
images belonging to the same wallpaper group as I among the n most similar (with a maximum of 4 as
there were 5 instances of each wallpaper group in the set of images). The mean results for each wallpaper
group are shown in Figure 6. As can be seen, images from the same wallpaper group are retrieved more
often than would be expected by chance.
Symmetry 2011, 3 251
Figure 3. Histograms showing (left) the number of subsets chosen by the participants;
(right) the size of the subsets made.
2 5 8 11 14 17 20 230
0.5
1
1.5
2
2.5
3
3.5
4
Number of subsets made by participants
Fre
quency
2 6 10 14 18 22 26 30 34 380
10
20
30
40
50
60
70
Size of subset
Fre
qu
en
cy
Figure 4. Similarity matrix. Each row and column represents an image, and the colour of
the pixel at position (i; j) indicates the number of times image i was placed in a subset with
image j. Brighter colours indicate increasing similarity. The high values along the diagonal
are due to each image being classed as similar to itself. The images are grouped by symmetry
group, as indicated by the white lines.
P1 P2 PM PG CM PMM PMG PGG CMM P4 P4M P4G P3 P3M1 P31M P6 P6M
P1
P2
PM
PG
CM
PMM
PMG
PGG
CMM
P4
P4M
P4G
P3
P3M1
P31M
P6
P6M
Symmetry 2011, 3 252
Figure 5. The degree of self-similarity for each of the 17 wallpaper groups.
0 2 4 6 8 10 12 14 16 180
0.1
0.2
0.3
0.4
0.5
0.6
0.7
0.8
Se
lf−
Sim
ilarity
Sco
re
Group
Figure 6. Mean number of retrievals from the same wallpaper group. The dotted line shows
the number of retrievals that would be expected by chance (hypergeometric distribution).
Each line represents a different symmetry group.
0 20 40 60 80 1000
0.5
1
1.5
2
2.5
3
3.5
4
Number of Retrivals
Num
ber
of m
em
bers
of sam
e w
allp
aper
gro
up r
etu
rned (
out of 4)
P1
P2
PM
PG
CM
PMM
PMG
PGG
CMM
P4
P4M
P4G
P3
P3M1
P31M
P6
P6M
Symmetry 2011, 3 253
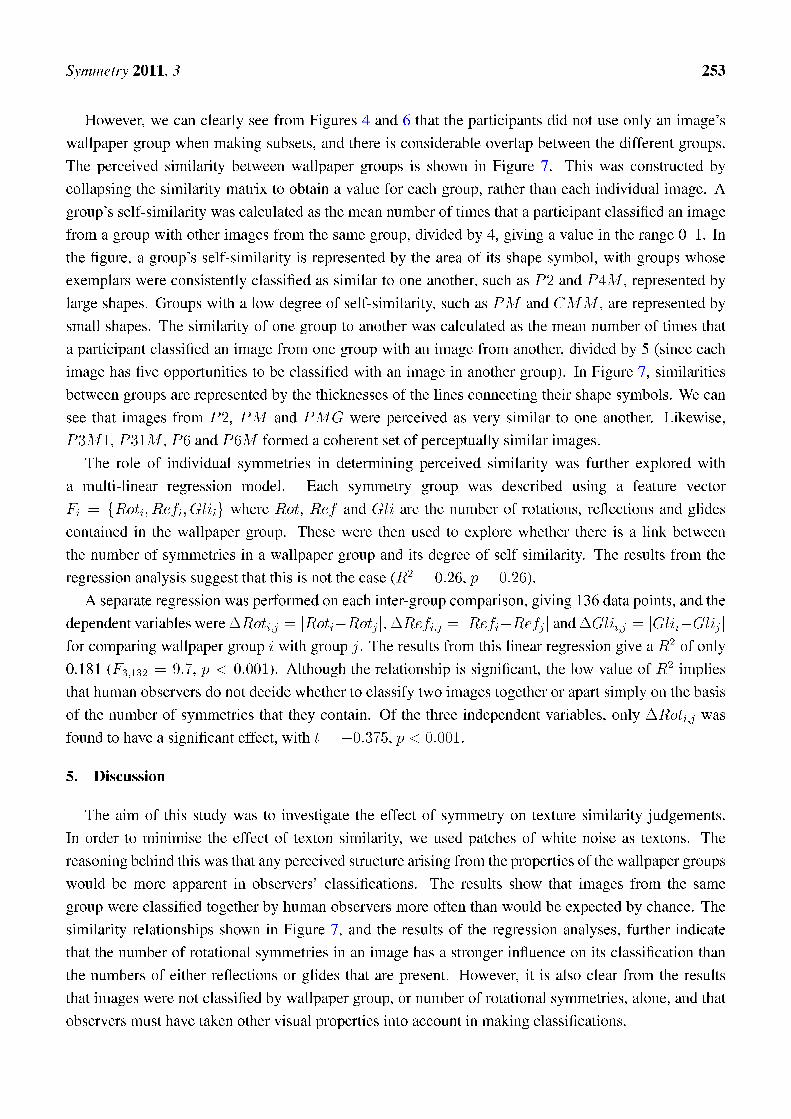
However, we can clearly see from Figures 4 and 6 that the participants did not use only an image's
wallpaper group when making subsets, and there is considerable overlap between the different groups.
The perceived similarity between wallpaper groups is shown in Figure 7. This was constructed by
collapsing the similarity matrix to obtain a value for each group, rather than each individual image. A
group's self-similarity was calculated as the mean number of times that a participant classi�ed an image
from a group with other images from the same group, divided by 4, giving a value in the range 0�1. In
the �gure, a group's self-similarity is represented by the area of its shape symbol, with groups whose
exemplars were consistently classi�ed as similar to one another, such as P2 and P4M , represented by
large shapes. Groups with a low degree of self-similarity, such as PM and CMM , are represented by
small shapes. The similarity of one group to another was calculated as the mean number of times that
a participant classi�ed an image from one group with an image from another, divided by 5 (since each
image has �ve opportunities to be classi�ed with an image in another group). In Figure 7, similarities
between groups are represented by the thicknesses of the lines connecting their shape symbols. We can
see that images from P2, PM and PMG were perceived as very similar to one another. Likewise,
P3M1, P31M , P6 and P6M formed a coherent set of perceptually similar images.
The role of individual symmetries in determining perceived similarity was further explored with
a multi-linear regression model. Each symmetry group was described using a feature vector
Fi = fRoti; Refi; Gliig where Rot, Ref and Gli are the number of rotations, re�ections and glides
contained in the wallpaper group. These were then used to explore whether there is a link between
the number of symmetries in a wallpaper group and its degree of self similarity. The results from the
regression analysis suggest that this is not the case (R2 = 0:26, p = 0:26).
A separate regression was performed on each inter-group comparison, giving 136 data points, and the
dependent variables were�Roti;j = jRoti�Rotjj,�Refi;j = jRefi�Refjj and�Glii;j = jGlii�Glijj
for comparing wallpaper group i with group j. The results from this linear regression give a R2 of only
0.181 (F3;132 = 9:7, p < 0:001). Although the relationship is signi�cant, the low value of R2 implies
that human observers do not decide whether to classify two images together or apart simply on the basis
of the number of symmetries that they contain. Of the three independent variables, only �Roti;j was
found to have a signi�cant effect, with t = �0:375, p < 0:001.
5. Discussion
The aim of this study was to investigate the effect of symmetry on texture similarity judgements.
In order to minimise the effect of texton similarity, we used patches of white noise as textons. The
reasoning behind this was that any perceived structure arising from the properties of the wallpaper groups
would be more apparent in observers' classi�cations. The results show that images from the same
group were classi�ed together by human observers more often than would be expected by chance. The
similarity relationships shown in Figure 7, and the results of the regression analyses, further indicate
that the number of rotational symmetries in an image has a stronger in�uence on its classi�cation than
the numbers of either re�ections or glides that are present. However, it is also clear from the results
that images were not classi�ed by wallpaper group, or number of rotational symmetries, alone, and that
observers must have taken other visual properties into account in making classi�cations.
Symmetry 2011, 3 254
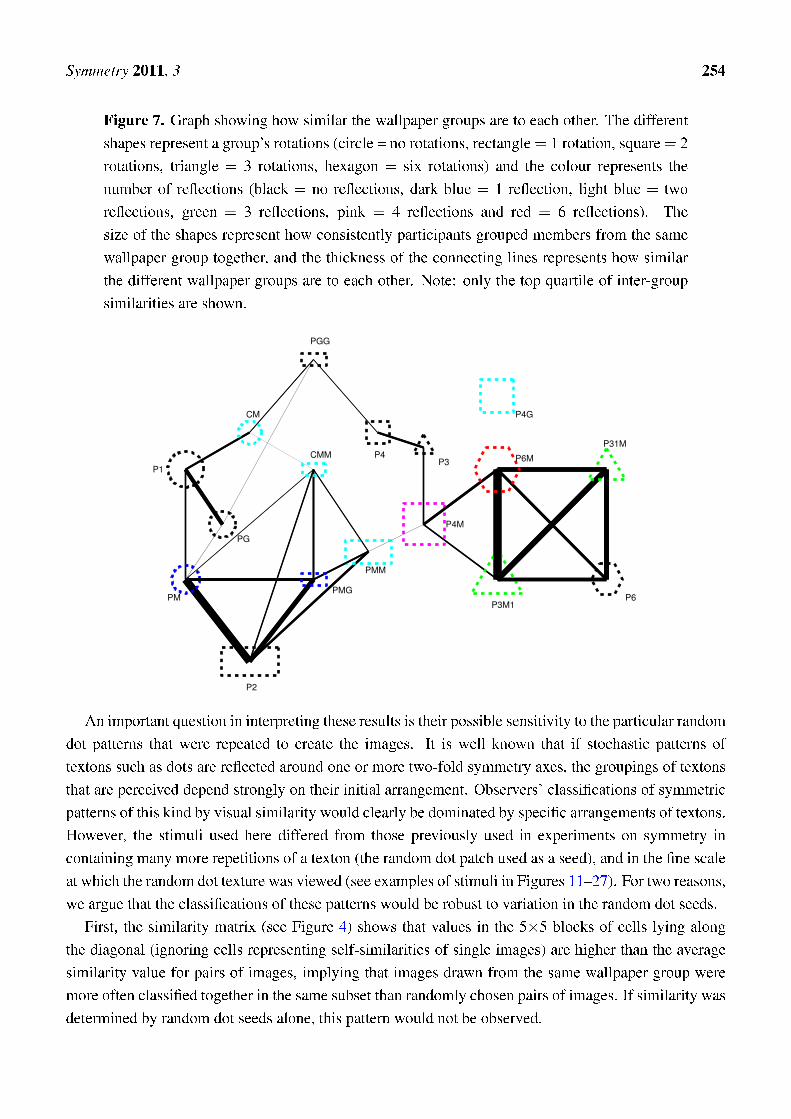
Figure 7. Graph showing how similar the wallpaper groups are to each other. The different
shapes represent a group's rotations (circle = no rotations, rectangle = 1 rotation, square = 2
rotations, triangle = 3 rotations, hexagon = six rotations) and the colour represents the
number of re�ections (black = no re�ections, dark blue = 1 re�ection, light blue = two
re�ections, green = 3 re�ections, pink = 4 re�ections and red = 6 re�ections). The
size of the shapes represent how consistently participants grouped members from the same
wallpaper group together, and the thickness of the connecting lines represents how similar
the different wallpaper groups are to each other. Note: only the top quartile of inter-group
similarities are shown.
P1
P2
PM
PG
CM
PMM
PMG
PGG
CMM P4
P4M
P4G
P3
P3M1
P31M
P6
P6M
An important question in interpreting these results is their possible sensitivity to the particular random
dot patterns that were repeated to create the images. It is well known that if stochastic patterns of
textons such as dots are re�ected around one or more two-fold symmetry axes, the groupings of textons
that are perceived depend strongly on their initial arrangement. Observers' classi�cations of symmetric
patterns of this kind by visual similarity would clearly be dominated by speci�c arrangements of textons.
However, the stimuli used here differed from those previously used in experiments on symmetry in
containing many more repetitions of a texton (the random dot patch used as a seed), and in the �ne scale
at which the random dot texture was viewed (see examples of stimuli in Figures 11�27). For two reasons,
we argue that the classi�cations of these patterns would be robust to variation in the random dot seeds.
First, the similarity matrix (see Figure 4) shows that values in the 5�5 blocks of cells lying along
the diagonal (ignoring cells representing self-similarities of single images) are higher than the average
similarity value for pairs of images, implying that images drawn from the same wallpaper group were
more often classi�ed together in the same subset than randomly chosen pairs of images. If similarity was
determined by random dot seeds alone, this pattern would not be observed.
Symmetry 2011, 3 255
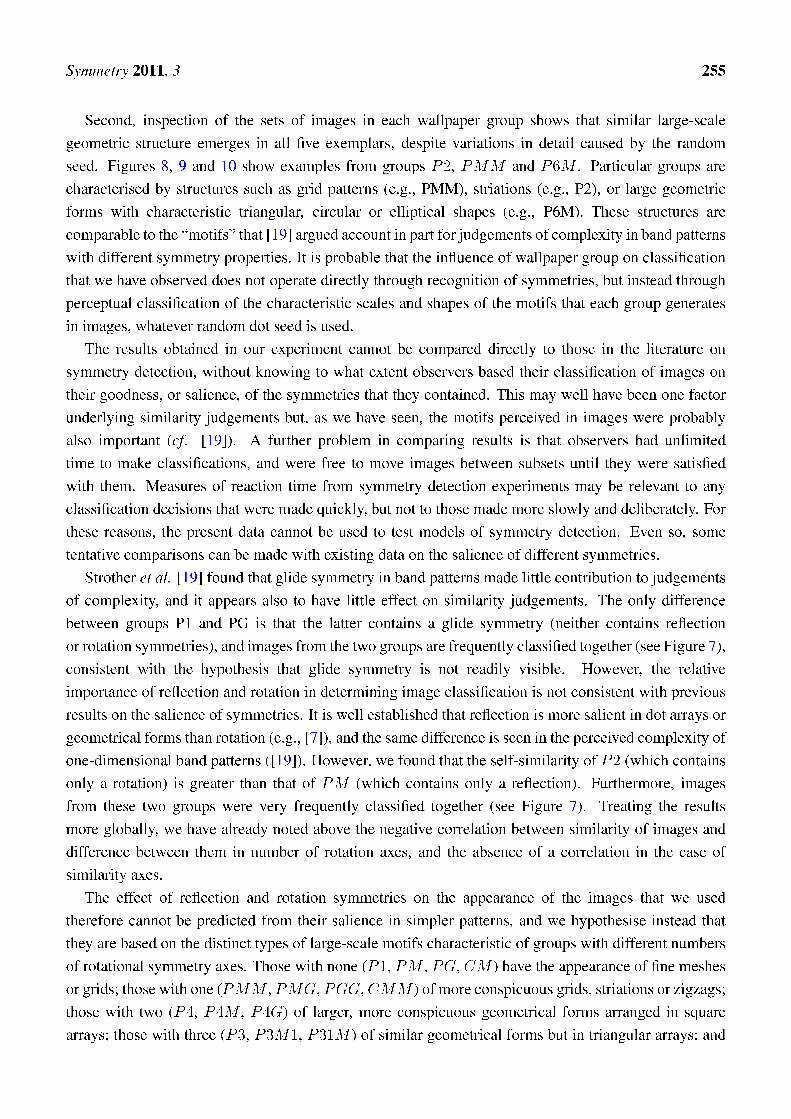
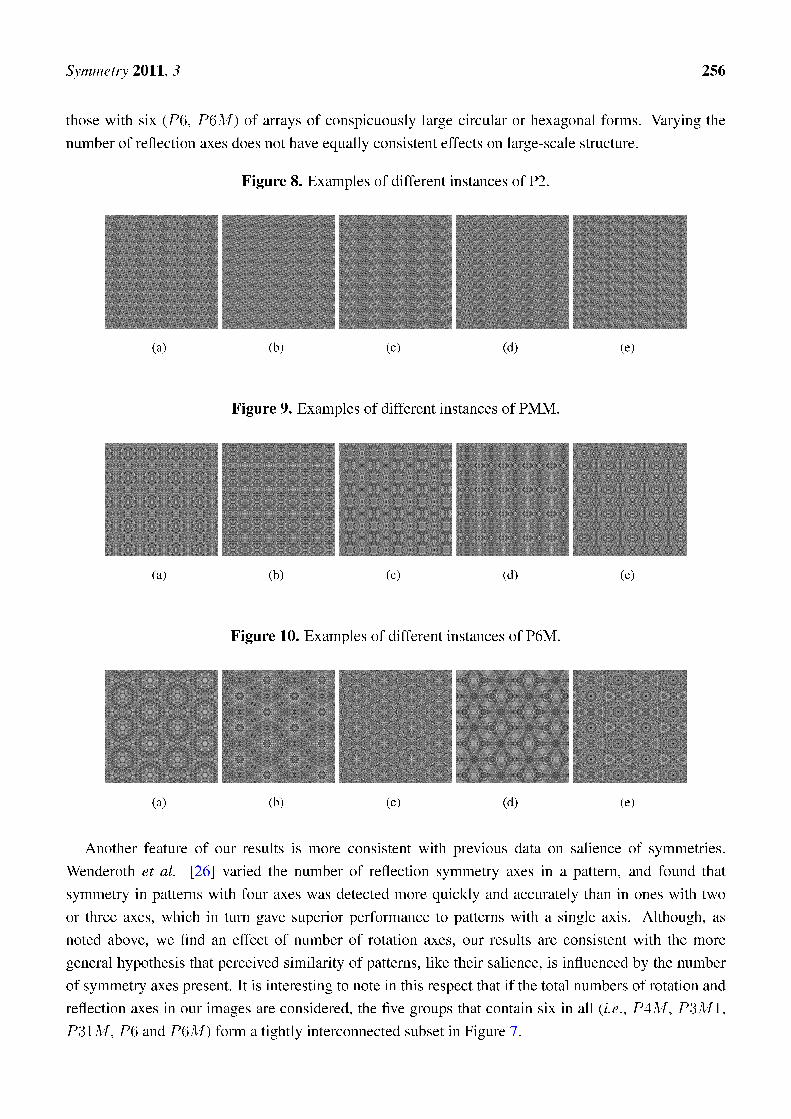
Second, inspection of the sets of images in each wallpaper group shows that similar large-scale
geometric structure emerges in all �ve exemplars, despite variations in detail caused by the random
seed. Figures 8, 9 and 10 show examples from groups P2, PMM and P6M . Particular groups are
characterised by structures such as grid patterns (e.g., PMM), striations (e.g., P2), or large geometric
forms with characteristic triangular, circular or elliptical shapes (e.g., P6M). These structures are
comparable to the �motifs� that [19] argued account in part for judgements of complexity in band patterns
with different symmetry properties. It is probable that the in�uence of wallpaper group on classi�cation
that we have observed does not operate directly through recognition of symmetries, but instead through
perceptual classi�cation of the characteristic scales and shapes of the motifs that each group generates
in images, whatever random dot seed is used.
The results obtained in our experiment cannot be compared directly to those in the literature on
symmetry detection, without knowing to what extent observers based their classi�cation of images on
their goodness, or salience, of the symmetries that they contained. This may well have been one factor
underlying similarity judgements but, as we have seen, the motifs perceived in images were probably
also important (cf. [19]). A further problem in comparing results is that observers had unlimited
time to make classi�cations, and were free to move images between subsets until they were satis�ed
with them. Measures of reaction time from symmetry detection experiments may be relevant to any
classi�cation decisions that were made quickly, but not to those made more slowly and deliberately. For
these reasons, the present data cannot be used to test models of symmetry detection. Even so, some
tentative comparisons can be made with existing data on the salience of different symmetries.
Strother et al. [19] found that glide symmetry in band patterns made little contribution to judgements
of complexity, and it appears also to have little effect on similarity judgements. The only difference
between groups P1 and PG is that the latter contains a glide symmetry (neither contains re�ection
or rotation symmetries), and images from the two groups are frequently classi�ed together (see Figure 7),
consistent with the hypothesis that glide symmetry is not readily visible. However, the relative
importance of re�ection and rotation in determining image classi�cation is not consistent with previous
results on the salience of symmetries. It is well established that re�ection is more salient in dot arrays or
geometrical forms than rotation (e.g., [7]), and the same difference is seen in the perceived complexity of
one-dimensional band patterns ([19]). However, we found that the self-similarity of P2 (which contains
only a rotation) is greater than that of PM (which contains only a re�ection). Furthermore, images
from these two groups were very frequently classi�ed together (see Figure 7). Treating the results
more globally, we have already noted above the negative correlation between similarity of images and
difference between them in number of rotation axes, and the absence of a correlation in the case of
similarity axes.
The effect of re�ection and rotation symmetries on the appearance of the images that we used
therefore cannot be predicted from their salience in simpler patterns, and we hypothesise instead that
they are based on the distinct types of large-scale motifs characteristic of groups with different numbers
of rotational symmetry axes. Those with none (P1, PM , PG, CM ) have the appearance of �ne meshes
or grids; those with one (PMM , PMG, PGG, CMM ) of more conspicuous grids, striations or zigzags;
those with two (P4, P4M , P4G) of larger, more conspicuous geometrical forms arranged in square
arrays; those with three (P3, P3M1, P31M ) of similar geometrical forms but in triangular arrays; and
Symmetry 2011, 3 256
those with six (P6, P6M ) of arrays of conspicuously large circular or hexagonal forms. Varying the
number of re�ection axes does not have equally consistent effects on large-scale structure.
Figure 8. Examples of different instances of P2.
(a) (b) (c) (d) (e)
Figure 9. Examples of different instances of PMM.
(a) (b) (c) (d) (e)
Figure 10. Examples of different instances of P6M.
(a) (b) (c) (d) (e)
Another feature of our results is more consistent with previous data on salience of symmetries.
Wenderoth et al. [26] varied the number of re�ection symmetry axes in a pattern, and found that
symmetry in patterns with four axes was detected more quickly and accurately than in ones with two
or three axes, which in turn gave superior performance to patterns with a single axis. Although, as
noted above, we �nd an effect of number of rotation axes, our results are consistent with the more
general hypothesis that perceived similarity of patterns, like their salience, is in�uenced by the number
of symmetry axes present. It is interesting to note in this respect that if the total numbers of rotation and
re�ection axes in our images are considered, the �ve groups that contain six in all (i.e., P4M , P3M1,
P31M , P6 and P6M ) form a tightly interconnected subset in Figure 7.
Symmetry 2011, 3 257
Figure 11. P1. (a) Example stimuli; (b) Cell structure.
(a) (b)
Figure 12. P2. (a) Example stimuli; (b) Cell structure.
(a) (b)
Figure 13. PM. (a) Example stimuli; (b) Cell structure.
(a) (b)
Symmetry 2011, 3 258
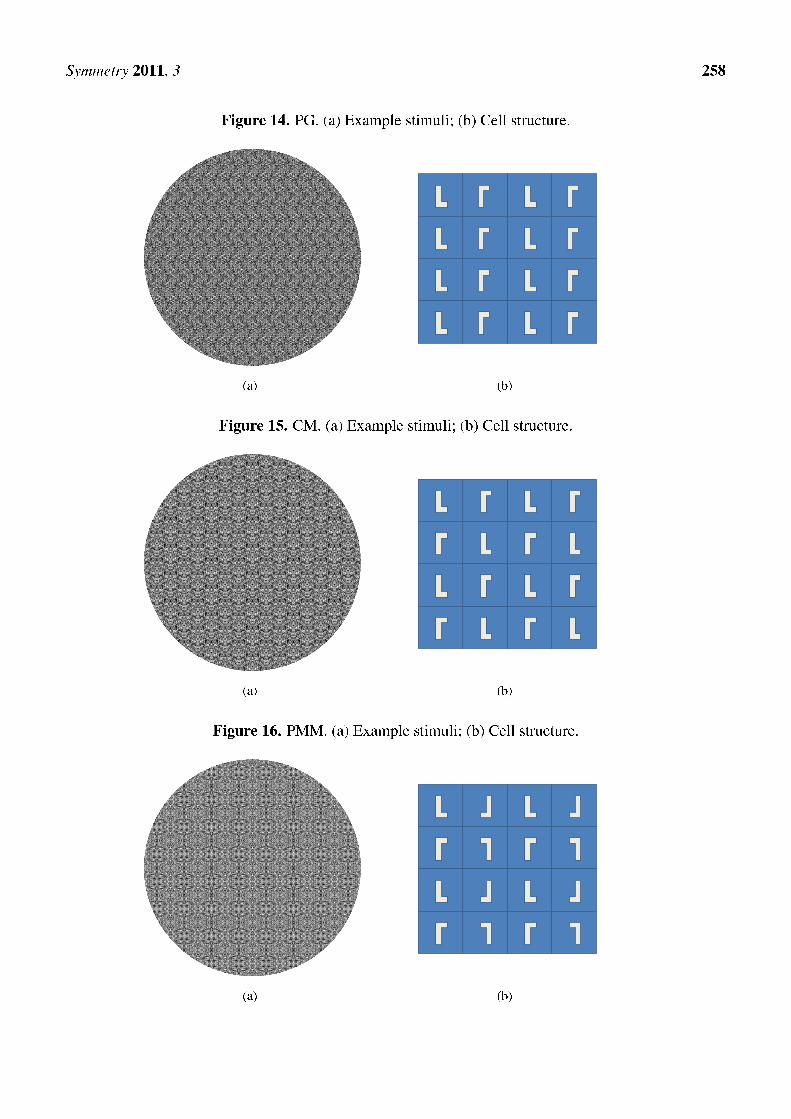
Figure 14. PG. (a) Example stimuli; (b) Cell structure.
(a) (b)
Figure 15. CM. (a) Example stimuli; (b) Cell structure.
(a) (b)
Figure 16. PMM. (a) Example stimuli; (b) Cell structure.
(a) (b)
Symmetry 2011, 3 259
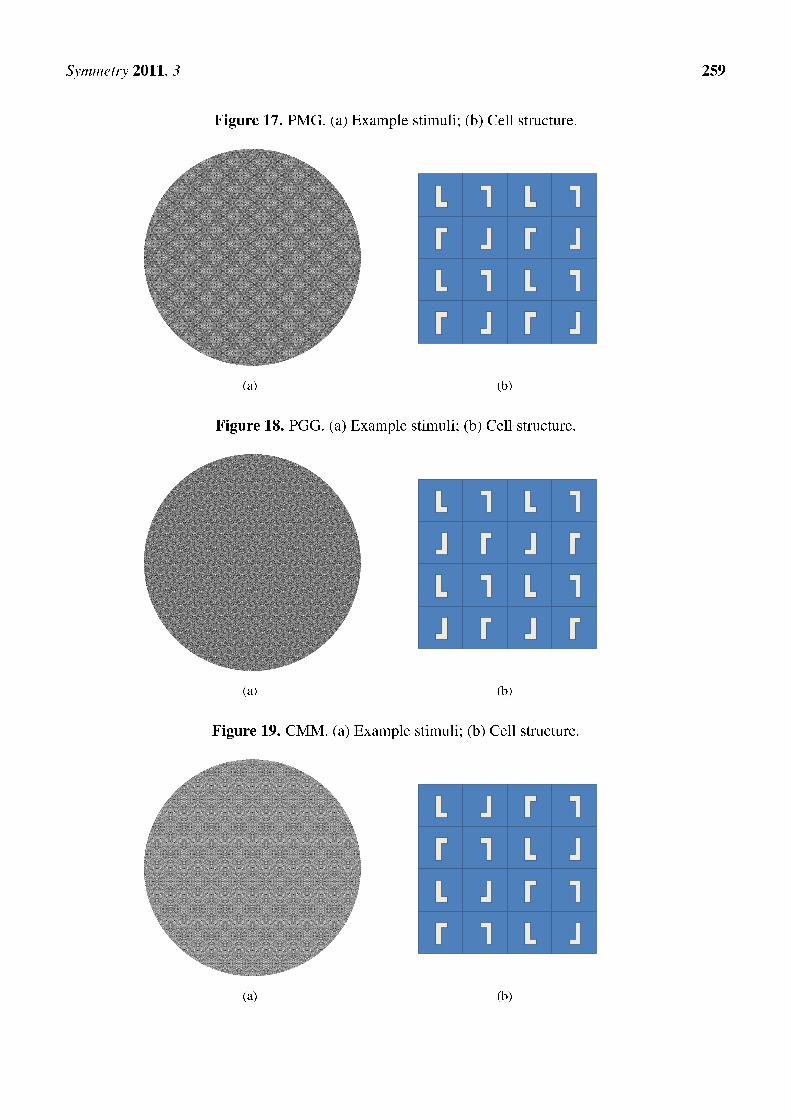
Figure 17. PMG. (a) Example stimuli; (b) Cell structure.
(a) (b)
Figure 18. PGG. (a) Example stimuli; (b) Cell structure.
(a) (b)
Figure 19. CMM. (a) Example stimuli; (b) Cell structure.
(a) (b)
Symmetry 2011, 3 260
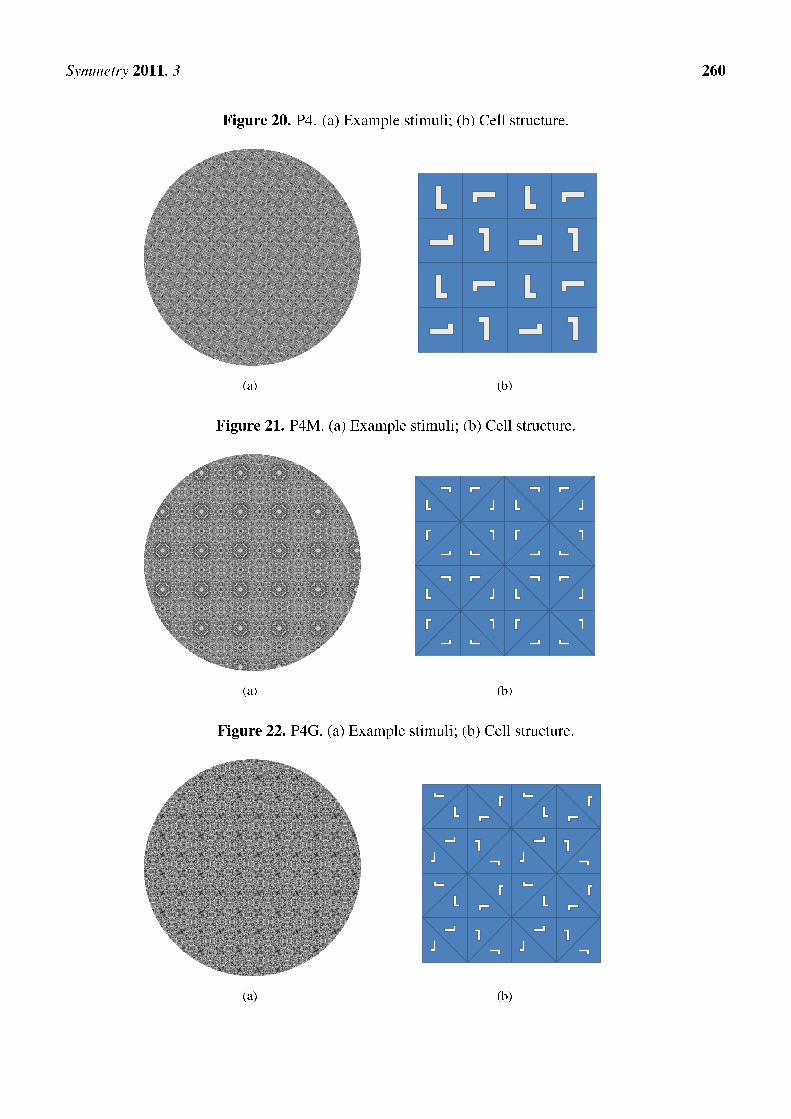
Figure 20. P4. (a) Example stimuli; (b) Cell structure.
(a) (b)
Figure 21. P4M. (a) Example stimuli; (b) Cell structure.
(a) (b)
Figure 22. P4G. (a) Example stimuli; (b) Cell structure.
(a) (b)
Symmetry 2011, 3 261
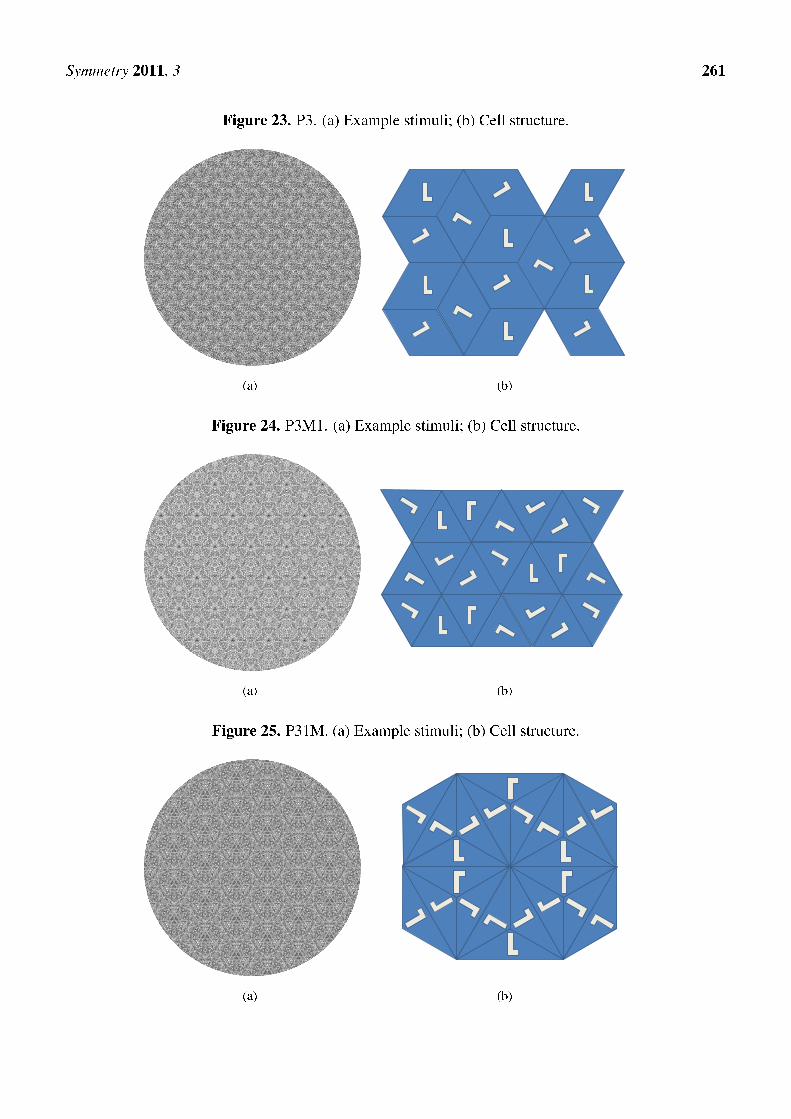
Figure 23. P3. (a) Example stimuli; (b) Cell structure.
(a) (b)
Figure 24. P3M1. (a) Example stimuli; (b) Cell structure.
(a) (b)
Figure 25. P31M. (a) Example stimuli; (b) Cell structure.
(a) (b)
Symmetry 2011, 3 262
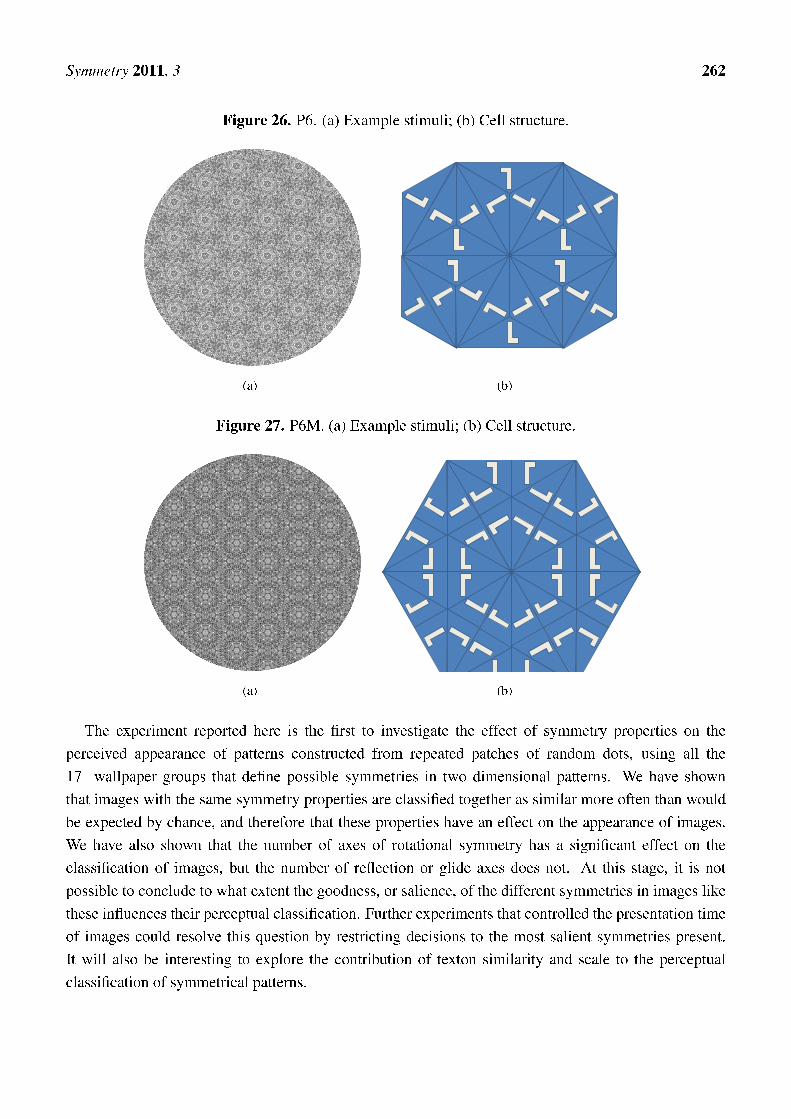
Figure 26. P6. (a) Example stimuli; (b) Cell structure.
(a) (b)
Figure 27. P6M. (a) Example stimuli; (b) Cell structure.
(a) (b)
The experiment reported here is the �rst to investigate the effect of symmetry properties on the
perceived appearance of patterns constructed from repeated patches of random dots, using all the
17 wallpaper groups that de�ne possible symmetries in two dimensional patterns. We have shown
that images with the same symmetry properties are classi�ed together as similar more often than would
be expected by chance, and therefore that these properties have an effect on the appearance of images.
We have also shown that the number of axes of rotational symmetry has a signi�cant effect on the
classi�cation of images, but the number of re�ection or glide axes does not. At this stage, it is not
possible to conclude to what extent the goodness, or salience, of the different symmetries in images like
these in�uences their perceptual classi�cation. Further experiments that controlled the presentation time
of images could resolve this question by restricting decisions to the most salient symmetries present.
It will also be interesting to explore the contribution of texton similarity and scale to the perceptual
classi�cation of symmetrical patterns.
Symmetry 2011, 3 263
References and Notes
1. Abas, S.J.; Salman, A.S. Symmetries of Islamic Geometrical Patterns; World Scienti�c Publishing
Company: Toh Tuck Link, Singapore, 1994.
2. Rønning, F. Geometry and Islamic Patterns. Available online: http://people.exeter.ac.uk/PErnest/
pome24/index.htm (accessed on 23 May 2011).
3. Tyler, C.W. The human expression of symmetry: Art and neuroscience. Available online: http:
//www.ski.org/CWTyler_lab/CWTyler/Art%20Investigations/Symmetry/Symmetry.html (accessed
on 23 May 2011).
4. Grünbaum, B.; Grünbaum, Z.; Shephard, G.C. Symmetry in moorish and other ornaments.
Comput. Math. Appl. 1986, 12, 641�653.
5. Grünbaum, B. What symmetry groups are present in the Alhambra? Not. AMS 2010, 53, 670�673.
6. Bruce, V.; Morgan, M. Violations of symmetry and repetition in visual patterns. Perception 1975,
4, 239�249.
7. Palmer, S.; Hemenway, K. Orientation and symmetry: Effects of multiple, rotational and near
symmetries. J. Exp. Psychol. Hum. Percept. Perform. 1978, 4, 691�702.
8. van der Helm, P.; Leeuwenberg, E. Goodness of visual regularities: A nontransformational
approach. Psychol. Rev. 1996, 103, 429�456.
9. Treder, M.S. Behind the looking-glass: A review on human symmetry perception. Symmetry 2010,
1, 1510�1543.
10. Scognamillo, R.; Rhodes, G.; Morrone, C.; Burr, D. A feature-based model of symmetry detection.
Proc. Biol. Sci. 2003, 270, 1727�1733.
11. Dry, M.J. Using relational structure to detect symmetry: A Voronoi tessellation based model of
symmetry perception. Acta Psychol. 2007, 128, 75�90.
12. Poirier, F.J.A.M.; Wilson, H.R. A biologically plausible model of human shape symmetry
perception. J. Vis. 2010, 10, 1�16.
13. Fairchild, M.D. Color Appearance Models, 2nd ed.; Wiley-IS&T: Chichester, UK, 2005.
14. Rao, A.; Lohse, G. Towards a texture naming system: Identifying relevant dimensions of texture.
Vis. Res. 1996, 36, 1649�1669.
15. Heaps, C.; Handel, S. Similarity and features of natural textures. J. Exp. Psychol: Hum. Percept.
Perform. 1999, 25, 299�320.
16. Padilla, S.; Drbohlav, O.; Green, P.; Spence, A.; Chantler, M. Perceived roughness of 1=f�
surfaces. Vis. Res. 2008, 48, 1791�1797.
17. Emrith, K.; Chantler, M.; Green, P.; Maloney, L.; Clarke, A. Measuring perceived differences in
surface texture due to changes in higher order statistics. J. Opt. Soc. Am. A Opt. Image Sci. Vis.
2010, 27, 1232�1244.
18. Jacobsen, T.; Höfel, L. Descriptive and evaluative judgment processes: Behavioral and
electrophysiological indices of processing symmetry and aesthetics. Cogn. Affect. Behav.
Neurosci. 2003, 3, 289�299.
19. Strother, L.; M.Kubovy. Perceived complexity and the grouping effect in band patterns. Acta
Psychol. 2003, 114, 229�244.
Symmetry 2011, 3 264
20. Liu, Y.; Collins, R.T.; Tsin, Y. A computational model for periodic pattern perception based on
frieze and wallpaper groups. IEEE Trans. Pattern Anal. Mach. Int. 2004, 26, 354�371.
21. Chetverikov, D. Pattern orientation and texture symmetry. Lect. Notes Comput. Sci. 1995,
970, 222�229.
22. Park, H.; Martin, G.R.; Bhalerao, A.H. Structural Texture Segmentation using Af�ne Symmetry.
In Proceedings of International Conference on Image Processing , San Antonio, TX, USA,
September 16�October 19, 2011; pp. II-49�II-52.
23. Zwillinger, D. CRC Standard Mathematical Tables and Formulae, 31st ed.; Chapman and Hall,
CRC: Boca Raton, FL, USA, 2002.
24. We can also recommend the wikipedia page (http://en.wikipedia.org/wiki/Wallpaper_group) as an
excellent resource for examples and an accessible introduction as to why there are only 17 unique
wallpaper groups.
25. Schattschneider, D. The plane symmetry groups: Their recognition and notation. Am. Math. Mon.
1978, 85, 439�450.
26. Wenderoth, P.; Welsh, S. Effects of pattern orientation and number of symmetry axes on the
detection of mirror symmetry in dot and solid patterns. Perception 1998, 27, 965�976.
c 2011 by the authors; licensee MDPI, Basel, Switzerland. This article is an open access article
distributed under the terms and conditions of the Creative Commons Attribution license
(http://creativecommons.org/licenses/by/3.0/.)