Embed Size (px)
Citation preview

2017
Swiss Healthcare and Pharmaceutical Market

Editor’s notice 4th edition, published in 2017 by
InterpharmaAssociation of research-based pharmaceutical companies in SwitzerlandPetersgraben 35P.O. Box4009 BaselPhone: 061 264 34 00Email: [email protected]
The content of the brochure can also be found on the website of Interpharma at www.interpharma.ch. Readers are free to download and use the charts in their latest version for their own purposes provided the sources are properly quoted.
Interpharma editorial team:Samuel Enderli, Sara Käch, Carolin Lorber, Heiner Sandmeier
Cover picture:© iStockphoto
© Interpharma, 2017 BaselCopying of the brochure is encouraged provided the sources are duly quoted.

Swiss Healthcare and Pharmaceutical Market
2017

2
Contents
Public HealthThe Swiss healthcare system . . . . . . . . . . . . . . . . . . . . . . . . . . 4Life expectancy in Switzerland and other countries . . . . . . . . 11The two main causes of death . . . . . . . . . . . . . . . . . . . . . . . . 13Deaths caused by cancer . . . . . . . . . . . . . . . . . . . . . . . . . . . . 15Comparison of cancer survival rates in Europe . . . . . . . . . . . 17Resources in health service . . . . . . . . . . . . . . . . . . . . . . . . . . 19Healthcare costs broken down by services . . . . . . . . . . . . . . 21Cost of healthcare according to services . . . . . . . . . . . . . . . . 23Healthcare costs by international standards . . . . . . . . . . . . . . 25Funding streams in the health system . . . . . . . . . . . . . . . . . . . 27Price indices of the health system . . . . . . . . . . . . . . . . . . . . . 29Health insurers: number of people insured and forms of insurance . . . . . . . . . . . . . . . . . . . . . . . . . . . . . . 31Benefits of mandatory health insurance by cost category . . . . 33
Public OpinionSatisfaction with the health service . . . . . . . . . . . . . . . . . . . . . 35Attitude towards cost-cutting measures . . . . . . . . . . . . . . . . . 37
Pharmaceutical MarketPharmaceutical market in Switzerland . . . . . . . . . . . . . . . . . . 39Pharmaceutical market by reimbursability . . . . . . . . . . . . . . . 41Generics . . . . . . . . . . . . . . . . . . . . . . . . . . . . . . . . . . . . . . . . 43Sales outlets by turnover and inventory . . . . . . . . . . . . . . . . . 45Biotech and gene tech products . . . . . . . . . . . . . . . . . . . . . . . 47Market share of medicines by indication area . . . . . . . . . . . . . 49Approval of medicines / number of approved medicines . . . . . 51Medicines in the Specialties List (SL) . . . . . . . . . . . . . . . . . . . 53
3
Composition of the price of a medicine . . . . . . . . . . . . . . . . . 55Prices of medicines: foreign-price comparison . . . . . . . . . . . . 57Price comparisons of European states . . . . . . . . . . . . . . . . . . 59Switzerland as reference country . . . . . . . . . . . . . . . . . . . . . . 61
Economic ImpactTrade balance of pharmaceutical products . . . . . . . . . . . . . . . 62Pharmaceutical trade balance compared with other countries . . . . . . . . . . . . . . . . . . . . . . . . . . . . . . . . 65Workplace productivity and number of employees in the pharmaceutical industry / overall economy . . . . . . . . . . 67Key figures of Interpharma companies in Switzerland . . . . . . . 69Key figures of Interpharma companies worldwide . . . . . . . . . . 70Interpharma companies: spending on R&D worldwide; sales, R&D and exports in Switzerland . . . . . . . . . 72Swiss innovation system compared with other countries . . . . 75
Research and DevelopmentPharmaceutical patents at the European Patent Office . . . . . . 77Funding of R&D in Switzerland . . . . . . . . . . . . . . . . . . . . . . . . 79Scientific impact by country . . . . . . . . . . . . . . . . . . . . . . . . . . 81Laboratory animal statistics . . . . . . . . . . . . . . . . . . . . . . . . . . 83Clinical research in Switzerland . . . . . . . . . . . . . . . . . . . . . . . 85

4
Public Health
The Swiss healthcare system
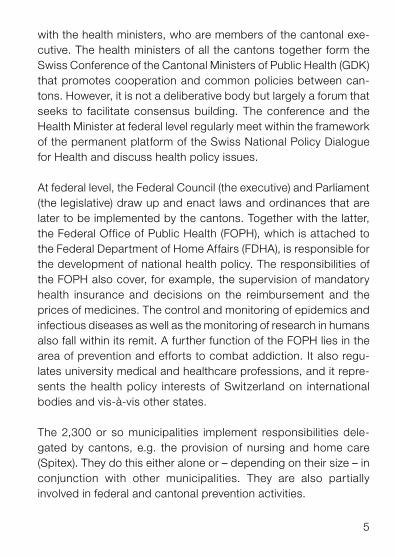
Governance of the health systemSwitzerland is characterized by a highly federalist structure with its federal government, cantons and communes or municipalities, which are each responsible for different functions. The principle of subsidiarity also plays an important role, according to which pub-lic services that can be provided at a given political level should not be undertaken at a higher level or instance. Consequently the federal level is comparatively lean.
Responsibility for the provision and funding of healthcare lies mainly with the 26 cantons, also in fields that are regulated by the federal government. Therefore, the federal state’s competencies are limited. The cantons maintain and, together with the manda-tory health insurance, co-finance hospitals and nursing homes, which they also supervise. Most hospitals are owned or controlled by cantons and municipalities. The cantons secure healthcare by means of hospital planning, emergency and rescue services. Together with the federal government and local municipalities, they are responsible for prevention and the promotion of health. The cantons also monitor licensing for medical and paramedical professions and finance the training of doctors through the can-tonal universities. Furthermore, they assess and adjust premium reductions for economically vulnerable persons. At cantonal level, the cantons can autonomously implement and enforce the laws and ordinances enacted by the federal government. The federal provisions are partly supplemented by cantonal implementation laws. The cantons have autonomy in the implementation and enforcement of the law. Responsibility for this implementation lies
5
with the health ministers, who are members of the cantonal exe-cutive. The health ministers of all the cantons together form the Swiss Conference of the Cantonal Ministers of Public Health (GDK) that promotes cooperation and common policies between can-tons. However, it is not a deliberative body but largely a forum that seeks to facilitate consensus building. The conference and the Health Minister at federal level regularly meet within the framework of the permanent platform of the Swiss National Policy Dialogue for Health and discuss health policy issues.
At federal level, the Federal Council (the executive) and Parliament (the legislative) draw up and enact laws and ordinances that are later to be implemented by the cantons. Together with the latter, the Federal Office of Public Health (FOPH), which is attached to the Federal Department of Home Affairs (FDHA), is responsible for the development of national health policy. The responsibilities of the FOPH also cover, for example, the supervision of mandatory health insurance and decisions on the reimbursement and the prices of medicines. The control and monitoring of epidemics and infectious diseases as well as the monitoring of research in humans also fall within its remit. A further function of the FOPH lies in the area of prevention and efforts to combat addiction. It also regu-lates university medical and healthcare professions, and it repre-sents the health policy interests of Switzerland on international bodies and vis-à-vis other states.
The 2,300 or so municipalities implement responsibilities dele-gated by cantons, e.g. the provision of nursing and home care (Spitex). They do this either alone or – depending on their size – in conjunction with other municipalities. They are also partially involved in federal and cantonal prevention activities.

6
Financing healthcareIn Switzerland, mandatory health insurance, the basic social insur-ance, is regulated by the Health Insurance Act (LAMal), which came into force in 1996. The basic principle consists in guarantee-ing that all persons resident in Switzerland have access to good medical care. In the event of an illness, the basic health insurance ensures that the cost of medical treatment is covered. Since 1996 everyone living in Switzerland has been required to conclude a basic health insurance. Everyone is individually insured and is free to choose his or her health insurer from around 60 privately organ-ized health insurers that offer basic insurance coverage. The health insurers have to accept everyone regardless of health and age. Monthly per capita premiums are payable for all persons. The level of the premium depends on where the person lives and also differs from one health insurer to another, but within these differ-ences the level is the same for each age group and for both sexes. The premiums are also not dependent on income. The insured persons pay all their premiums themselves. There are no employ-er contributions. Economically vulnerable people can request a premium reduction, which is paid by the Federation and the canton in which they live. Besides the basic health insurance, cantons co-finance hospital and nursing home costs. These two payers account for the majority of healthcare expenditure, but also out-of-pocket costs – either through cost-sharing or directly from a person, e.g. for non-reimbursed medicines – contribute signifi-cantly to the health system. All services (incl. medicines) included in the catalogue of benefits are fully covered by the mandatory health insurance and are subject to a co-insurance of 10% with an annual cap.

7
The catalogue of benefits covered by the mandatory insurance is quite extensive by comparison with other countries: The insurance covers most outpatient and inpatient procedures, maternity bene-fits and those medicines that the FOPH includes in the so-called Specialties List (SL). Procedures and methods used in comple-mentary medicine are also covered to some extent. The insurers may offer different models (HMO, Managed Care, etc.). Insured persons have a wide choice at their disposal with regard to the deductible and have the option every year of changing their health insurer or the insurance model or deductible within their insurance. Supplementary health insurance plans also exist. They can be concluded on a voluntary basis and cover benefits that are not covered by the mandatory insurance. Since the benefits catalogue of mandatory health insurance is very comprehensive, however, supplementary health insurance plans primarily cover benefits regarding greater freedom, for example in the choice of doctor or hospital or certain methods used in complementary medicine. Top-up insurance of this kind is usually offered by insurers that also offer mandatory insurance.
Delivering health servicesThe Swiss healthcare system allows patients to see a specialist directly (free choice of doctor). But normally the family doctor or general practitioner (GP) is the first point of contact when there are medical problems. If the GP cannot treat the disease, the patient is referred to a specialist and/or a hospital. Specialists work both in their own private practices and also in hospitals. In most can-tons, both are allowed to dispense medicines themselves from their own practice-based pharmacy. In other cantons, prescription medicines can only be obtained in pharmacies on medical pre-scription.

8
Since 2012, all patients in Switzerland have been free to choose their hospital. The hospitals are financed both by the cantons and by the mandatory health insurance. By comparison with other countries, the separation of hospitals into an inpatient and an outpatient section occupies a special position. In the outpatient section treatments are fully covered by the mandatory insurance. In the case of inpatient hospital treatments, however, 45% of costs are covered by the man-datory insurance and 55% by the cantons. Since 2012 these treat-ments are financed via case-based payments according to diagno sis- related groups (DRG) that also include the cost of medicines as well as diagnostic and therapeutic services, unless otherwise negotiated. Most hospital doctors and health professionals are salaried, where-as GPs and specialist doctors working in ambulatory care settings are paid on a fee-for-service basis.
Approval of medicinesSince Switzerland is not a member of the European Union, it has its own drug regulatory authority and is not affiliated to the Euro-pean Medicines Agency (EMA). The Swiss agency Swissmedic is responsible for the approval of new medicines and for monitoring of the pharmaceutical market in Switzerland. Swissmedic works closely with foreign agencies. Medicines are not automatically covered by the mandatory insurance once marketing authorization has been granted. Before reimbursement is possible, pharmaceut-ical companies first have to apply to the FOPH for inclusion in the SL and to provide evidence that the medicines are effective, suit-able and efficient. Prices are determined by means of therapeutic referencing and a comparison with prices in other countries. Once medicines have been included in the SL, prices are reviewed every three years. For non-reimbursed medicines, companies are free to price their medicines as they wish.

10
Very high life expectancy in Switzerland
Switzerland has one of the highest life expectancy rates in the world at 83.3 years. Of the OECD countries, only Japan enjoys an even higher life expectancy.
The average life expectancy of a newborn infant in Switzerland has steadily increased since the beginning of the last century. It is thanks to improved hygiene, a higher standard of living and good-quality healthcare that we have seen such a marked increase. In 2015 life expectancy at birth stood at 84.9 years for women and 80.7 years for men. The difference between female and male life expectancy that widened in the second half of the 20th century has narrowed in the last few years. At the beginning of the 1990s, life expectancy for women was still above seven years longer than for men. After this, male life expectancy rose more steeply than female life expectancy, resulting in a narrower difference between the sexes. In 2015 this difference was around four years.

11
Life expectancy compared with other countries
Life expectancy of total population at birth (in years), 2014
78 79 80 81 8382 84
USDKDEGBATNLSEFRIT
ESCHJP
83.383.7
83.383.2
82.883.3
81.881.6
81.481.2
80.878.8
© In
terp
harm
a
Mean life expectancy at birth
In years
Men Women
1900 1920 1940 1960 1980 20152000
84.9
80.7
40455055606570758085
© In
terp
harm
a
Source: Swiss Statistical Encyclopedia, Federal Statistical Office, 2016.
Source: OECD Health Data 2016.

12
Most common causes of death: diseases of the circulatory system and cancer
Diseases of the circulatory system (ischemic heart disease, cere-brovascular diseases, etc.) are the most common cause of death in Switzerland, followed by cancer. In some comparative countries, such as Denmark, the Netherlands, France and Japan, the exact reverse is the case. In 2014, 216 of 100,000 people in Switzerland died of a disease of the circulatory system. This mortality rate is less than half what it was in 1990. In the other comparative coun-tries, similar levels of decline have been reported. This is due amongst other things to innovative medicines and a healthier life-style.
In the case of cancer, the number of deaths has likewise fallen in the last twenty years, albeit less sharply than in the case of car-dio-vascular disease. In 2014, nearly 176 of 100,000 people in Switzerland died of cancer. In 1990, there were over 30% more deaths from cancer. This marked decrease is the biggest reduc-tion seen in all the comparative countries. The reason for the decrease is to be found in better, modern treatment options and – in many types of cancer – early diagnosis of disease, which increase the chances of a cure.

13
The two main causes of death
Deaths per 100,000 population (standardized rates),2014 or nearest year available
Source: OECD Health Data 2016.
n Cancer 2014n Cancer 1990
0 100 200 300 400 500 600 700
«1990»
JPFRNLDKGBCHUSSEIT
DEAT
«1990»
CHJPSEUSATDEFRIT
GBNLDK
«2014»
«2014»
603.5302.3285.9 607.9
255.0253.1 517.6
479.8252.8215.6 447.9
523.8213.0212.2 544.7
432.7314.6158.0
208.8
157.8 349.2
246.1224.3221.9
205.4197.7197.2197.2
189.5184.6179.0175.9
293.0279.6
280.7259.2
254.2257.4261.1
250.2215.1
207.9253.5
469.3
n Diseases of the circulatory system 2014n Diseases of the circulatory system 1990 ©
Inte
rpha
rma

14
Cancer as second most common cause of death
In Switzerland, cancer is the second most common cause of death. The mortality rate varies from one type of cancer to an other. Internationally there are considerable differences in cancer mor-tality, both overall and also between different types of cancer. On the one hand this may be related to the prevailing living conditions that either favour or tend to prevent certain types of cancer. On the other hand, however, prevention, early diagnosis and access to modern treatment, such as antibody therapies, also play an impor-tant role.
Marked differences in mortality are apparent over time. In breast cancer, for example, the mortality rate in 1990 stood at 44.8 of 100,000 women. It had thus decreased by nearly 44% in 2014. In the framework of early detection programmes for breast cancer, the cost of mammography screening in Switzerland has been covered by health insurers since 2009, provided the investigation is carried out as part of a programme with quality assurance and in women with an increased risk for breast cancer in the family history. Until now, mammography programmes have been intro-duced in Cantons Bern, Basel-Stadt, Fribourg, Geneva, Graubünden, Jura (including the Bernese Jura), Neuchâtel, St. Gallen, Ticino, Thurgau, Vaud and Valais. In all other cantons mammography screening is done in consultation with the doctor.

15
Deaths caused by cancer
Deaths per 100,000 population (standardized rates)¹,2014 or nearest year available
© In
terp
harm
a
Source: OECD Health Data 2016.
¹ In prostate and breast cancer the rates refer to 100,000 men and women respectively.
n Respiratory organs n Prostate n Breast
0 10 20 30 40 50 60
JPIT
FRATDENLGBCHDKSE
JPSECHATIT
FRDEGBNLDK
SECHJPATDEFRIT
GBNLDK
53.9
48.7
59.0
41.1
40.9
40.3
38.1
34.9
33.8
30.4
46.4
46.1
36.1
35.6
34.9
29.4
27.7
26.7
21.7
13.7
32.6
30.6
29.1
28.4
27.226.7
26.1
25.3
22.0
14.2
16
Differences in access to innovative cancer treatments
Thanks to new diagnostic opportunities and medicines such as modern antibody treatments, cancer in many cases today can be diagnosed earlier, treated better or even cured altogether.
In Europe, there are substantial differences in access to new can-cer treatments and in waiting times for new medicines. This has an impact on the survival rate of cancer patients, because prompt access to new treatment options and medicines is important for the success of treatment in cancer. Thus the relative 5-year sur-vival rate is much higher for many types of cancer in Switzerland than it is in other European countries. These rates are lower par-ticularly in East European countries such as Poland.
The relative 5-year survival rate indicates the mortality of people with cancer compared with the mortality of people without cancer. This measure thus takes into account the fact that only part of the mortality among cancer patients is attributable to cancer, because a certain mortality is also to be expected among people without cancer. A value of 100% means that mortality in people with can-cer is just as high as mortality in people without cancer. A rate of 61% as in the case of colorectal cancer in Switzerland is thus to be understood as showing that the proportion of people with colorectal cancer surviving for five years after diagnosis corres-ponds to 61% of the expected proportion of survivors in the total population without colorectal cancer. The likelihood of people with cancer still being alive five years after diagnosis is reduced by 39% compared with the population without cancer.

17
© In
terp
harm
a
Comparison of cancer survival rates in Europe
Relative 5-year survival rates (in %)
0 20 40 60 80 100
Magenkrebs
PLDKGBNLSEFRATDECH
IT
Dickdarmkrebs
PLGBDKNLFRIT
SEAT
CHDE
Brustkrebs
PLGBDKATDENLCH
ITSEFR 86.1
86.085.5
84.684.5
83.682.1
81.579.3
71.6
62.261.461.261.160.8
59.758.1
53.651.3
46.7
31.631.331.0
26.321.7
20.417.0
16.015.6
32.4
Source: Cancer survival in Europe 1999–2007 by country and age: results of EUROCARE-5 – a population-based study, Roberta De Angelis et al., The Lancet Oncology, Volume 15(1), 2014.
n Breast cancer n Colorectal cancer n Stomach cancer

18
Healthcare industry as a major employer
In Switzerland, more than 422,000 people work in the healthcare industry, including the pharmaceutical sector. This is around one in twelve of the working population. Overall, Switzerland has a well-equipped healthcare system, although there are regional differences in the healthcare provided. For example, certain rural regions suffer from a shortage of doctors, while in the urban centres there tends to be a surfeit of general practitioners and specialists. There is also a very high density of small hospitals, which offer little specialization and a wide range of medical services.
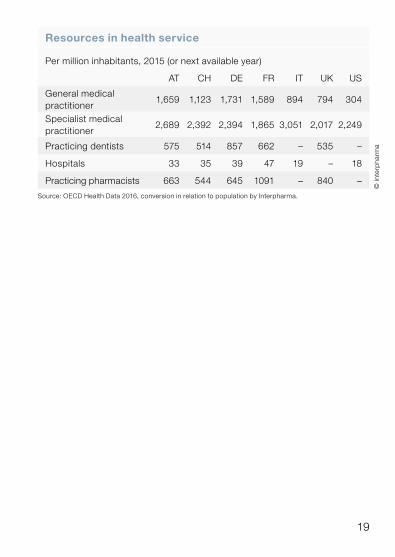
By comparison with other countries, there are differences in the structure of medical care. Switzerland has a relatively low density of general practitioners compared with neighbouring countries: for every million inhabitants in Switzerland there are only 1,123 gen eral practitioners, whereas there are far more in Austria, France and Germany. Since doctors are also allowed to dispense medicines directly in many cantons of Switzerland, the density of pharmacies is comparatively low.
19
Resources in health service
Per million inhabitants, 2015 (or next available year)
AT CH DE FR IT UK US
General medical practitioner
1,659 1,123 1,731 1,589 894 794 304
Specialist medical practitioner
2,689 2,392 2,394 1,865 3,051 2,017 2,249
Practicing dentists 575 514 857 662 – 535 –
Hospitals 33 35 39 47 19 – 18
Practicing pharmacists 663 544 645 1091 – 840 –
Source: OECD Health Data 2016, conversion in relation to population by Interpharma.
© In
terp
harm
a
20
Medicines as a proportion of healthcare costs: 8.9%
While Switzerland has one of the most expensive healthcare sys-tems in the world, it also offers high-quality outcomes. The cost of the healthcare system has increased by 3.0% compared with 2013 and amounted to around 71.3 billion Swiss francs in 2014. The cost increase was thus slightly higher than in the previous year, when the growth amounted to 2.5%. Healthcare costs in 2014 also grew more strongly than economic output: its share of gross domestic product rose from 10.9% in 2013 to 11.4% in 2014. The cost of medicines as a proportion of healthcare costs fell from 9.1% in 2013 to 8.9%, after stabilizing at just over 10% for several years before eventually falling below 10% for the first time in 2010. In particular, more intensive price reviews of medicines already established in the Specialties List (SL) led to a sharp fall in the index of drug prices.
Over a prolonged period, expenditure on health goods as a share of healthcare costs has also shown a marked decline: whereas spending in this sector amounted to 24.4% of healthcare costs in 1960, it had fallen to 10.4% in 2014.
In contrast to the cost of medicines, which as a share of healthcare costs has remained stable and even fallen in recent years, the cost of outpatient and inpatient care has increased substantially. Com-pared with 2013, too, spending especially in the outpatient care sector showed an above-average increase of 5.0%. At the same time, new treatments are improving the quality of life and increas-ing the chances of a cure and survival. Today, six of ten people with cancer are still alive five years after the initial diagnosis.

21
© In
terp
harm
a
Health cost trends by services
Services as a proportion of healthcare costs (in %)
0
80
100
20
40
60
1960 1970 1980 1990 2000 2014
Source: Costs and funding of healthcare, Federal Statistical Office, 2016.
1 Including other services.
Outpatient care1
Inpatient care
Prevention / administration Healthcare goods / medicines
Healthcare costs broken down by services
Total costs 2014: CHF 71,335 million (100%)
© In
terp
harm
a
Source: Costs and funding of healthcare, Federal Statistical Office, 2016.
1 Including medicines.2 Including medicines dispensed in hospital for outpatients.
n Inpatient care1
44.7% (CHF 31,880 million)
n Outpatient care2 34.9% (CHF 24,889 million)
n Medicines3
8.9% (CHF 6,352 million)
n Prevention / administration 6.4% (CHF 4,593 million)
n Other services 5.1% (CHF 3,621 million)
3 At retail prices, excluding hospital.

22
Healthcare costs show greatest increase in the outpatient sector
In 2014, the cost of inpatient treatments amounted to around 31.9 billion Swiss francs, whereas the cost of outpatient treatments amounted to 24.9 billion francs. Expenditure on medicines stood at 6.4 billion francs, while administration generated costs of almost 3 billion francs, and 1.6 billion francs went on prevention.
Since the Health Insurance Act (LAMal) was introduced in 1996, costs have increased in all areas. The greatest increase occurred in the outpatient sector, especially in the last few years.
Compared with the previous year, spending on medicines increased by 0.7%. The cost of medicines dispensed in phar-macies and drugstores as a proportion of overall costs has fallen by 1.5 percentage point since 1996.

23
© In
terp
harm
a
Cost of healthcare according to services
Type of service (in CHF millions)
Source: Costs and funding of healthcare, Federal Statistical Office, 2016.
1 Including medicines. 2 Including psychiatry. 3 Including rehabilitation. 4 Excluding medicines. 5 Laboratory tests, radiology, therapeutic apparatus, transport
and ambulance services. 6 Cost to social insurance scheme, including private insurance plans,
and to private households.
1996 2000 2010 2013 2014
Inpatient treatment¹ 17,744 19,787 28,364 31,312 31,880
– Acute² 11,310 12,140 16,600 18,127 18,341
– Chronic 4,429 5,195 8,137 9,212 9,415
– Others³ 2,006 2,452 3,627 3,973 4,124
Outpatient treatment 10,933 12,926 20,335 23,695 24,889
– Doctors4 5,306 6,183 8,901 10,336 10,956
– Hospitals1 1,423 2,150 4,852 6,043 6,306
– Dentists 2,682 2,845 3,790 4,001 4,103
– Physiotherapists 506 569 793 890 1,003
– Psychotherapists 125 149 212 244 257
– Spitex 773 889 1,585 1,951 2,021
– Other paramedical services 118 141 201 231 243
Other services5 2,002 2,263 3,291 3,390 3,621
Medicines6 3,808 4,642 6,055 6,311 6,352
– Pharmacies and drugstores 2,812 3,298 4,207 4,363 4,365
– Self-dispensing doctors 996 1,345 1,848 1,948 1,987
Prevention 967 1,014 1,471 1,536 1,569
Administration 2,015 2,210 2,979 2,983 3,024
Total 37,469 42,843 62,495 69,227 71,335
24
High proportion of inpatient care
Inpatient care in Switzerland was responsible for the largest share of total healthcare costs in 2014 at more than 44%. Outpatient care accounted for around 30% of total spending. Medicines ac -counted for approximately 10%. By international standards, almost all other countries spent less on inpatient care. By contrast, medicines were responsible for a much lower proportion of spend-ing in Switzerland at 10.3% of healthcare costs than in the bench-mark countries (AT, BE, DE, FI, FR, JP, SE and US). This includes medicines dispensed in pharmacies, in drugstores, by self-dis-pensing doctors and in outpatient clinics. In many comparative countries, however, the medicines dispensed in hospital (for out-patients or inpatients) are not included in this calculation. Of all 34 OECD countries, only in Denmark, Iceland, Luxembourg, the Netherlands, Norway and Sweden was the percentage spent on medicines lower than in Switzerland.
If healthcare spending is compared with healthcare costs abroad (OECD countries), Switzerland lies in second place at 11.4% of gross domestic product (GDP) behind the USA. In the USA, healthcare spending in 2014 amounted to 16.6% of GDP.

25
Development of healthcare spending
Healthcare spending as a proportion of GDP (in %)
US NL1
DE1
FR1 CH GB
© In
terp
harm
a
Source: OECD Health Data 2016.
1 Data not available for several years.
01970 1980 1990 2000 2014
3
6
9
12
15
18NL
FR
UK
US
DE¹
CH
16.6
11.411.111.010.9
9.9
© In
terp
harm
a
Healthcare costs by international standards
Services as a proportion of total healthcare costs (in %), 2014
Source: OECD Health Data 2016.
¹ Data for 2013.
n Inpatient care n Outpatient care n Medicines
200 40 60 80 100
US
FI
DE
FR
SE
JP¹
AT
BE
CH
26
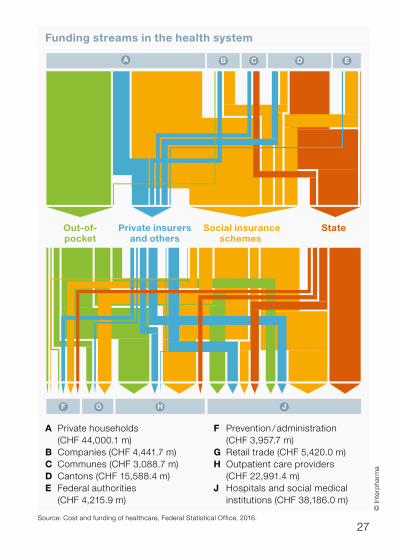
Private households cover more than 60% of healthcare costs
The healthcare costs of around 71.3 billion Swiss francs are cov-ered through various channels. In 2014, more than 60% was financed by private households. The largest proportion was paid into the social insurance systems. Around a fifth was used to pay directly for benefits that were not covered by the insurance (out-of-pocket payments). More than 32% was financed directly by the public purse (federal, cantonal and municipal).
More than 42% of the costs accrued are paid by the social insur-ance schemes. Federal, cantonal and municipal authorities pay slightly more than 20% of costs. Most of this is paid by the cantons to inpatient facilities (14%), which are financed both by the cantons and through the premiums. This is evident in the flow of payments. The new hospital-financing scheme, according to which the can-tons have to cover at least 55% and the health insurers at most 45% of hospital costs, came into force at the beginning of 2012.
27
Funding streams in the health system
Out-of-pocket
Private insurersand others
Social insuranceschemes
State
A B C D E
F G H J
A Private households (CHF 44,000.1 m)B Companies (CHF 4,441.7 m)C Communes (CHF 3,088.7 m)D Cantons (CHF 15,588.4 m)E Federal authorities (CHF 4,215.9 m)
© In
terp
harm
a
F Prevention / administration (CHF 3,957.7 m)G Retail trade (CHF 5,420.0 m)H Outpatient care providers (CHF 22,991.4 m)J Hospitals and social medical
institutions (CHF 38,186.0 m)
Source: Cost and funding of healthcare, Federal Statistical Office, 2016.

28
Price index for medicines steadily falling
Since the introduction of the Health Insurance Act (LAMal) in 1996 the dentist index has shown the biggest increase at 16 points. The price index of medical services has remained quite stable since 1996, whereas the price index for medicines has steadily and substantially fallen. In 2016, it lay well below all the other health-care indices at around 62 points. This development is attributable above all to the price comparison for new reimburs able medicines with the average price in economically comparable states of Europe (AT, BE, DE, DK, FI, FR, GB, NL and SE). The prices of medicines in Switzerland have thus fallen in line with those in the reference countries. Newly launched medicines in Switzerland today are no more expensive than in other European countries that are comparable with Switzerland.
The European comparison shows that prices for health services in Switzerland have remained practically unchanged since 2005. In the Netherlands and Great Britain, however, prices over the same period have increased more than 30%.

29
Price indices of the health system in Switzerland
Index: 1996 = 100
Hospitals Dentists
Consumption Healthcare
Doctors Medicines
© In
terp
harm
a
Source: Consumer Price Index, Federal Statistical Office, 2017; conversion of index by interpharma on the basis of 1996.
70
60
80
90100110
120
1998 2000 2002 20041996
115
102
62
2014 20162010 201220082006
104110
116
Price indices of the health system compared with other countries
Harmonized Index of Consumer Prices, subindex of health (index: 2005 = 100)
NL GB
BE CH
FR DE
SE DK
AT FI
© In
terp
harm
a
Source: Eurostat, 2017.
201620152014201320122011201020092008200720062005
100
110
120
130135
130126126
115114111110106
97

30
Marked increase in alternative insurance models In 2015, a total of 58 privately organized health insurers offered mandatory health insurance, the basic social insurance, in Swit-zerland. All people living in Switzerland can thus choose from a wide variety of health insurers, which they are also free to change every year. The insurers are required to accept all persons, regard-less of their health, age or gender. Since the law on mandatory insurance came into force in 1996, there has been a sharp reduc-tion in the number of insurers. In addition, the trend is now away from a large number of insurers with a small number of insured members to a small number of insurers with a large number of insured members.
Most insurers offer their clients a variety of insurance models. They choose a deductible according to which the level of monthly pre-miums is calculated. The higher the deductible, the lower the premium. Only when this is exceeded does the health insurer pay, although the insured person still has to pay 10% of costs up to a maximum of 700 francs himself. The insured persons pay all pre-miums themselves. There are no employer contributions. Besides the classical insurance models, alternative insurance models are also popular. They account for more than half of insurance agree-ments concluded. In these models, the insured person commits to always seeing a defined service provider (e.g. general practition-er) first, in return for which he or she pays lower premiums.

31
Number of insurers according to number of insured members
Number offering mandatory health insurance
1996 2015
1996 2000 2005 2010 2015
Total recognized insurers 159 110 90 86 64
Health insurers(mandatory insurance) 145 101 85 81 58
Source: Mandatory health insurance statistics, Federal Office of Public Health, various years.
Number of insured persons
0
40
80
11 10 121420 69 6 17 3 5
90
1–5,000 5,001–10,000
10,001–50,000
50,001– 100,000
100,001– 500,000
More than 500,000
© In
terp
harm
a
Insured members broken down by type of insurance
Adult insured members 2015: 6,705,299 (100%)
Source: Mandatory health insurance statistics 2015, Federal Office of Public Health, 2017.
1 HMO models, gatekeeper models, bonus insurance, etc.
a
bc
de
f
g
g
f
e
d
c
b
a
Ordentl. Franch.
© In
terp
harm
a
n Standard deductible 19.3%
n Selectable deductible 16.5% a Deductible CHF 500 6.7% b Deductible CHF 1,000 1.2% c Deductible CHF 1,500 3.2% d Deductible CHF 2,000 0.5% e Deductible CHF 2,500 4.9%
n Other types of insurance1 64.2% f With standard deductible 24.7% g With selectable deductible 39.4%

32
Compulsory health insurance benefits according to cost categories
Total benefits 2015: CHF 30,122 million (100%)
a
b c
Source: Mandatory health insurance statistics 2014, Federal Office of Public Health, 2016.
1 Excluding medicines dispensed in hospital for outpatient.
© In
terp
harm
a
Medicines as a reduced proportion of costs
As in past years, outpatient treatment accounted for the highest gross benefits paid out under mandatory health insurance in 2015. It accounted for 50.5% of total benefits. At 29.0% the benefits for inpatient treatment accounted for the second highest share, fol-lowed by medicines with a share of 20.5% – compared with 2014, this proportion rose slightly by 0.1 percentage point. Compared with the previous year, the growth in overall costs was twice as high as in 2014 at 5.2%. Medicines showed a 5.7% growth versus the previous year and outpatient care an increase of 6.5%. Lower growth was reported for the cost of inpatient care at 2.6%.
n Outpatient1 50.5%
n Inpatient2 29.0%
n Medicines3 20.5%
a Pharmacy 11.5% b Doctors 6.2% c Hospital outpatient 2.8%
2 Including medicines. 3 Excluding inpatient treatment.

33
© In
terp
harm
a
Mandatory health insurance benefits according to cost categories
Cost categories (in CHF millions)
2011 2012 2013 2014 2015
Outpatient 11,873 12,431 13,406 14,292 15,218
Doctor 5,566 5,806 6,242 6,633 7,007
Hospital¹ 3,443 3,671 4,003 4,161 4,186
Laboratory 749 794 846 913 1,122
Physiotherapy 636 655 698 787 897
Spitex 583 628 671 736 794
Aids and articles 382 377 439 473 612
Chiropractic 74 76 77 79 83
Others² 439 424 431 465 518
Inpatient3 7,600 7,821 8,695 8,498 8,723
Hospital 5,696 5,937 6,816 6,662 6,880
Nursing Home 1,847 1,846 1,838 1,796 1,799
Others 57 38 42 40 44
Medicines4 5,458 5,649 5,825 5,848 6,181
Doctors 1,621 1,663 1,727 1,762 1,863
Pharmacy 3,169 3,253 3,299 3,274 3,461
Hospital outpatient 669 732 800 812 857
Total 24,932 25,901 27,926 28,639 30,122
Source: Mandatory health insurance statistics, Federal Office of Public Health, various years.
1 Excluding medicines.2 Complementary medicine, ergotherapy, speech therapy, health insurance
benefits covering dentists, transportation and rescue costs.³ Including medicines.4 Excluding inpatient treatment.

34
Public Opinion
High degree of satisfaction with the health system
Twenty years after the Health Insurance Act (LAMal) came into force, the health system as a whole enjoys a high degree of acceptance among the Swiss public, 78% of whom have a fairly positive to very positive impression of the system. This suggests that there are currently no grounds for further major reforms in the health system without clearly discernible benefits to patients or customers.
The view of the electorate is that the ideal health system in Swit-zerland should allow freedom of choice and provide high-quality services and benefits in sufficient quantity. At the same time, the last few years have seen an ever larger proportion of people who want greater state control of the health system, the largest propor-tion in favour of this being recorded in 2014 at 45%. Almost the same level of support for this view was again recorded in 2017 at 44%. The proportion of the electorate that approved of a mar-ket-oriented health system steadily increased from 2003 onwards until it reached a maximum of 75% in 2010. Since then, the pro-portion of people in favour of greater state influence has steadily increased with the exceptions of 2015 and 2016.

35
More market or more state
Proportion of electorate (in %), 2017
“What kind of a health system would you like in Switzerland? Would you like a health system in Switzerland where the market rules more than the state or where the state rules more than the market?”
n Very heavily market orientedn Heavily market orientedn Largely market orientedn Neither nor
n Largely state orientedn Heavily state orientedn Very heavily state oriented
Source: Health Monitor 2017, gfs.bern (N = 1,200), 2017.
© In
terp
harm
a
302520151050
181621
1
1618
10
Taking stock of the Health Insurance Act
Proportion of electorate (in %), 2017
“Taking stock of the health system 21 years after the enactment of the LAMal, is your impression of the health system in Switzerland…?”
n Very negativen Fairly negative
n Don’t know / no answer
n Fairly positiven Very positive
Source: Health Monitor 2017, gfs.bern (N = 1,200), 2017.
© In
terp
harm
a
60
4050
70
3020100 3
127
18
60
36
Access to new medicines should be ensured
Unhindered access to new medicines is important to the Swiss: 54% of the electorate would not on any account want to be deprived of this access. There continues to be a substantial lack of understanding, for example, when it comes to restrictions in cancer medicine.
By contrast, four other cost-cutting measures were no longer taboo in 2017: At 66% a clear majority would be prepared to do without a free choice of hospital for cost reasons. Here, the pro-portion of those who make this dependent on the level of cost reduction is relatively high at 49%. Further, 60% of respondents said they would accept a restriction on the freedom of treatment in order to cut costs. Here again, however, the willingness to accept such restrictions was dependent on the level of cost reduc-tion for a high 46% of respondents. The majorities were less clear-cut as regards restricting the the range of healthcare services covered by the insurance, which was accepted by 54% of respondents, and restricting the free choice of the doctor, which was accepted by 52%. But with these two measures as well, the proportion of those who make them dependent on the level of cost reduction is relatively high at around 40% in each case.

37
Attitude towards cost-cutting measures
Proportion of electorate (in %), 2017
“Which of the following measures would you be prepared to accept if it led to a reduction in costs in the health system? Please say whether you would be prepared to accept it whatever the cost reduction, would be prepared to accept it depending on the scale of the cost reduction, or would not be prepared to accept it on any account.”
Source: Health Monitor 2017, gfs.bern (N = 1,200), 2017.
0% 20% 40% 60% 80% 100%
No free choice of hospital
No freedom of treatment
No free choice of doctor
Reduction in catalogue of benefits
Restricted access to new medicines
n Whatever the cost reductionn Depending on the scale of cost reduction
© In
terp
harm
a
n On no accountn Don’t know / no answer
38
Pharmaceutical Market
Pharmaceutical market grows in 2016 thanks to new, innovative medicines
In Switzerland, medicines are dispensed in pharmacies, hospitals, drugstores and, in certain cantons, also by doctors. Non-prescrip-tion medicines may be sold in drugstores, while prescription medicines can only be dispensed in the other outlets. In 2016, the pharmaceuticals market in Switzerland grew 4.6% over the previ-ous year to around 5.6 billion francs. In 2015, a slightly higher growth was recorded.
The growth is due in particular to the launch of new and innovative medicines – especially for cancer, but also for multiple sclerosis. Together with certain antiviral medicines, the growth achieved by this group of products accounted for around half of the entire market growth.
The number of packs sold increased by 0.3% to 188 million units.

39
Pharmaceutical market in Switzerland by volume
Market volume 2016: 187.5 million packs (100%)
© In
terp
harm
a
Source: Interpharma with database QuintilesIMS Switzerland, 2017.
© In
terp
harm
a
Source: Interpharma with database QuintilesIMS Switzerland, 2017.
Pharmaceutical market in Switzerland by value
Market volume 2016: CHF 5,594.8 million (at ex-factory prices, 100%)
n Pharmacies 51.3% (CHF 2,870.7 million)
n Self-dispensing doctors 24.6% (CHF 1,379.0 million)
n Hospitals 22.9% (CHF 1,279.0 million)
n Drugstores 1.2% (CHF 66.2 million)
n Pharmacies 64.7% (121.2 million packs)
n Self-dispensing doctors 22.1% (41.4 million packs)
n Hospitals 9.4% (17.6 million packs)
n Drugstores 3.8% (7.2 million packs)

40
Most medicines are reimbursed Around 67% of all medicine packs sold in Switzerland were reim-bursable in 2016. Most of these were prescription-only medicines. Around a quarter of all reimbursable medicines were non-prescrip-tion drugs. But these products are only reimbursed through the mandatory health insurance if a medical prescription is provided. If no such prescription is provided, these medicines can be sold freely, but patients then have to pay the full price themselves.
In the case of medicines not reimbursed through the mandatory health insurance, around one eighth were prescription-only med-icines. These include, for example, contraceptives. Most of the medicines not reimbursed were non-prescription products. Many of these non-reimbursable products are covered to some extent by the optional top-up insurance plans.
In terms of value, more than 83% of the total pharmaceutical mar-ket consisted of reimbursable medicines in 2016, most of which were prescription-only products at the same time. Non-reimbursed products accounted for less than one-fifth of total pharmaceutical sales. The market for reimbursable medicines increased by 5.5% compared with the previous year. This is mainly due to the intro-duction of new, highly innovative medicines against cancer and multiple sclerosis. In terms of volume, reimbursable medicines showed a 2.0% increase in 2016 compared with 2015.

41
Pharmaceutical market by reimbursability according to value
Market volume 2016: CHF 5,594.8 million (at ex-factory prices, 100%)
Pharmaceutical market by reimbursability according to volume
Market volume 2016: 187.5 million packs (100%)
© In
terp
harm
a©
Inte
rpha
rma
n Reimbursable products 83.8% (CHF 4,689.0 million)
n Prescription only 79.3% (CHF 4,439.6 million)
n Over the counter 4.5% (CHF 249.4 million)
n Non-reimbursable products 16.2% (CHF 905.8 million)
n Prescription only 6.9% (CHF 386.7 million)
n Over the counter 9.3% (CHF 519.1 million)
Source: Interpharma with database QuintilesIMS Switzerland, 2017.
Source: Interpharma with database QuintilesIMS Switzerland, 2017.
n Reimbursable products 66.7% (125.0 million packs)
n Prescription only 49.5% (92.8 million packs)
n Over the counter 17.2% (32.2 million packs)
n Non-reimbursable products 33.3% (62.5 million packs)
n Prescription only 4.2% (7.8 million packs)
n Over the counter 29.1% (54.7 million packs)

42
Strong growth of generics market
Reimbursable generics achieved sales of 666 million Swiss francs in 2016. Compared with the previous year, the growth amounted to 4.6%. In terms of volume, generics showed a 1.5% increase. The value of the generics market has more than doubled since 2005.
In the generics-eligible market, the proportion of generics has increased in the last few years. This market includes both generics and also original products whose patents have expired and for which generics exist. In addition, there are also original products for which there are no generics because, amongst other reasons, the price is already so low that they are not financially attractive for generics producers. The market volume of this product group amounted to around 474 million francs in 2016.
In the case of the twenty biggest-selling active ingredients whose patents have expired, generics accounted for 75% in terms of volume in 2016. Thus, three of four counting units (tablets, cap-sules, etc.) sold were generics. In 2005, only around one in two units took the form of a generic. One reason for the marked increase in the proportion of generics between 2005 and 2006 lies in the introduction of the differentiated co-payment rule. According to this rule, the insured person makes a co-payment amounting to 20% of the cost of the original product, but only 10% in the case of generics.

43Source: Interpharma with database QuintilesIMS Switzerland, 2017.
1 Number of tablets, capsules, millilitres, etc. sold.
Generics-eligible market
Generics-eligible active ingredients, top 20 (by value),defined on a monthly basis
Generics as a proportion of the generics-eligible market (in %, on the basis of counting units1)
Generics market
Generics market (in CHF millions, at ex-factory prices)
© In
terp
harm
a
0
600
700
500
400
300
200
100
1614 15131211100908070605
261.2
666.5
Source: Interpharma with database QuintilesIMS Switzerland, 2017.
© In
terp
harm
a
100
80
60
40
20
0201620152014201320122011201020092008200720062005
49.7
50.3
70.3
29.7
71.1
28.9
71.6
28.4
70.7
29.3
70.9
29.1
72.4
27.6
72.0
28.0
75.6
24.4
78.5
21.5
79.2
20.8
75.0
25.0
n Generics n Originals whose patents have expired and for which generics exist

44
Pharmacies remain the most important sales outlet Pharmaceutical sales in pharmacies grew in 2016 compared with the previous year. The 1,792 pharmacies in Switzerland accounted for 51% of medicines sold in terms of value. They were thus the most important sales outlet for medicines. Mail-order pharmacies are becoming increasingly important. Drugstores saw a decrease in sales compared with the previous year.
In Switzerland, doctors are also allowed to dispense medicines directly to their patients in certain regions. In 2016, there were around 5,800 practitioners in Switzerland with a patient pharmacy, also known as self-dispensing (SD) doctors. This group thus accounted for around 32% of all medical practitioners. Since the sale of medicines by SD doctors is regulated differently from one canton to another, the proportions of self-dispensing differ between regions. The density of pharmacies also varies from one canton to another. The cantons with a high proportion of SD doc-tors (Basel-Landschaft, Appenzell Outer Rhodes and Schwyz) generally show a much lower density of pharmacies compared with the other cantons. The sharp increase in 2010 is due to the fact that, since 2010, the data has been gathered according to cantonal regulations. Moreover, a new source of data has been in use since 2011. The figures from 2009 to 2011 are therefore only comparable with each other to a limited extent.

45
Sales outlets by turnover
In CHF millions, at ex-factory prices
© In
terp
harm
a
96
831
1,023
2,266
66
1,379
1,279
2,871
Drogerien
Spitäler
SD-Ärzte¹
Apotheken
2,500
2,000
1,500
1,000
500
006 07 08 09 10 11 12 13 14 15 16
Sales outlets by inventory
Number of self-dispensing doctors1, pharmacies, drugstores and hospitals
© In
terp
harm
a
568
659
1,692
3,857
Drogerien
Spitäler
SD-Ärzte¹
Apotheken
7,000
6,000
5,000
4,000
3,000
2,000
1,000
006 07 08 09 10 11 12 13 1514 16
517344
1,792
5,830
Source: Interpharma with database QuintilesIMS Switzerland, 2017.
Pharmacies Self-dispensing doctors1
Hospitals Drugstores
Pharmacies Self-dispensing doctors1
Hospitals Drugstores
Source: Interpharma with database QuintilesIMS Switzerland; Cegedim Switzerland SA, Zurich branch; Medizinalberuferegister; pharmaSuisse, 2017.
1 Doctors with their own pharmacy are described as self-dispensing doctors.

46
Successful use of biotech and gene tech products
Unlike classical chemical compounds, most active ingredients that are produced in genetically modified organisms using biotechno-logical methods are substances that are complex, large and high-molecular-weight proteins. In 2016, their value at ex-factory prices amounted to 1,060 million Swiss francs, which is nearly 19% of the total market.
Biotechnologically produced medicines are being successfully used for the treatment of severe or life-threatening diseases such as multiple sclerosis and blood disorders and especially for cancer and diabetes. Precisely in the field of oncology, there is a steady increase in the proportion of gene tech products. Gene technolo-gy methods today are used not only in the production process itself, but also in the research and development of almost every new medicine.
A particular feature of biopharmaceuticals is that it is not possible to produce generics with absolutely identical active ingredients. After the patent has expired, similar copies of the highly complex biopharmaceuticals, known as biosimilars, may be approved. A special procedure has been established for these approvals, in which tests of efficacy and tolerability have to be carried out in the laboratory and in clinical studies. However, the producer of biosimi-lars requires a smaller programme of studies for regulatory approval than has to be provided by the original producer.

47
Indications for biotech and gene tech products
Market volume 2016: CHF 1,060.2 millions (at ex-factory prices, 100%)
Market of biotech and gene tech products
Market development (in CHF millions, at ex-factory prices)
© In
terp
harm
a©
Inte
rpha
rma
Source: Interpharma with database QuintilesIMS Switzerland, 2017.
Source: Interpharma with database QuintilesIMS Switzerland, 2017.
0
1,000
800
600
400
200
161005009590
15
1,060
n Rheumatic diseases 31.1%
n Cancer 22.4%
n Eye diseases 13.7%
n Multiple sclerosis 7.0%
n Diabetes 6.9%
n Haematopoiesis 4.0%
n Osteoporosis 3.3%
n Growth hormones 2.7%
n Vaccines 2.3%
n Others 6.6%

48
Medicines for diseases of the central nervous system sold the most
In 2016, medicines for diseases of the central nervous system had the biggest market share at 15.6%. This category includes anal-gesics, medicines for diseases such as epilepsy and Parkinson’s and also treatments of mental disorders (hallucinations, delusions and depression). Analgesics formed the biggest group in this category.
The next biggest market share was achieved by cancer medicines (13.9%) and treatments for infectious diseases (11.4%). The former include classical cytostatic agents, which are used in chemother-apy, so-called monoclonal antibodies, which are used alone or in combination with chemotherapy, and also various other products used in cancer therapy. The latter consists of medicines to treat hepatitis C and HIV or antibiotics. Vaccines also fall into this cate-gory.

49
Market share of medicines by indication area
Market volume 2016: CHF 5,594.8 million (at ex-factory prices, 100%)
© In
terp
harm
a
n Central nervous system 15.6%
n Cancer 13.9%
n Infections 11.4%
n Cardiovascular 9.7%
n Respiratory system 5.9%
n Haematopoiesis 5.6%
n Digestive system 5.4%
n Musculoskeletal system 5.2%
n Urogenital system 4.2%
n Sensory organs 4.1%
n Skin 3.3%
n Others 15.7%
Source: Interpharma with database QuintilesIMS Switzerland, 2017.

50
More approved medicines
All medicines either available in Switzerland or intended for export from Switzerland have to be approved by the Swiss Agency for Therapeutic Products (Swissmedic). The applicants have to pro-vide extensive documentation for the approval. This documenta-tion must show evidence of, amongst other things, efficacy, quality and safety, as well as identity, purity and content of the active ingredients of the medicine. The entire approval procedure usually takes 330 days. In 2016, 42 medicines with new active ingredients were approved. In the case of medicines for life-threat-ening diseases, fast-track procedures that usually take 140 days are also possible. In 2016, seven applications were processed using the fast-track procedure.
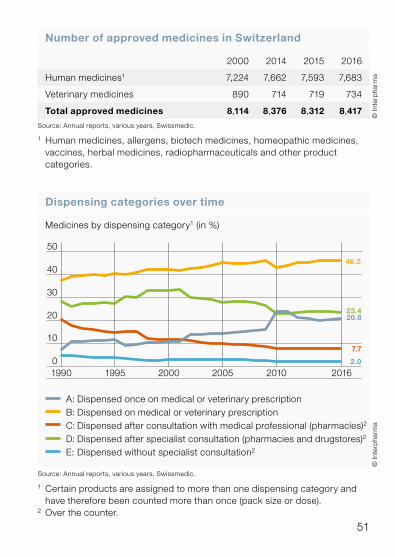
In 2016, the number of medicines approved by Swissmedic increased by 1.3% over the previous year and amounted to a total of 8,417 human and veterinary medicines. Viewed over a pro-longed period, the overall number of approvals declined substan-tially. In 1990, this number stood at 10,119 units – 1,700 more than is the case today.
On the basis of the benefit-risk ratio, Swissmedic classifies human and veterinary medicines according to different dispensing cat-egories. In 2016, categories A and B (prescription only) accounted for 67% of all approved medicines.
51
© In
terp
harm
a
Number of approved medicines in Switzerland
2000 2014 2015 2016
Human medicines1 7,224 7,662 7,593 7,683
Veterinary medicines 890 714 719 734
Total approved medicines 8,114 8,376 8,312 8,417
Source: Annual reports, various years, Swissmedic.
1 Human medicines, allergens, biotech medicines, homeopathic medicines, vaccines, herbal medicines, radiopharmaceuticals and other product categories.
© In
terp
harm
a
Dispensing categories over time
Medicines by dispensing category1 (in %)
1995 2000 2005 2016201019900
10
20
30
40
50
46.2
20.8
7.7
23.4
2.0
Source: Annual reports, various years, Swissmedic.
1 Certain products are assigned to more than one dispensing category and have therefore been counted more than once (pack size or dose).
2 Over the counter.
A: Dispensed once on medical or veterinary prescription B: Dispensed on medical or veterinary prescription C: Dispensed after consultation with medical professional (pharmacies)2
D: Dispensed after specialist consultation (pharmacies and drugstores)2
E: Dispensed without specialist consultation2

52
Growing number of reimbursable medicines
In Switzerland, only medicines included in the so-called Specialties List (SL) drawn up by the Federal Office of Public Health (FOPH) are reimbursed through the mandatory health insurance. The FOPH decides on inclusion in the SL based on the recommenda-tions of the Federal Medicines Committee and stipulates the maximum price for reimbursement. The defining criteria for this are the efficacy, suitability and cost-effectiveness of the medicine concerned.
The cost-efficiency is determined based on a comparison with prices abroad. A therapeutic cross-comparison is also made with medicines in the same indication or with a similar mechanism of action. If an innovation premium is claimed, this must be justified by evidence of increased efficacy or a better risk profile (fewer side effects). It is explicitly laid down in the ordinance to the Health Insurance Act, because Switzerland has an interest in offering a research-friendly environment.
The scope of the SL has increased in the last few years, partly also because there are more and more generics, and generics produ-cers are required to offer all the pack sizes offered with the original product. At the end of 2016, the SL included a total of 2,948 prod-ucts in 9,784 packs. 93% of these were prescription only (catego-ries A and B), and the remaining 7% were available without pre-scription (categories C and D). These non-prescription medicines are only reimbursed if they have been prescribed by a doctor. In 2016, more than 41% of all SL packs were generics, as were around 55% of the packs newly included in the SL in 2016.

53
Reimbursable medicines by dispensing category
Total reimbursable medicines 2016: 9,784 packs1 (100%)
© In
terp
harm
a
Medicines in the Specialties List (SL)
1995 2014 2015 2016
Number of products 2,255 2,898 2,922 2,948
Number of packs 5,383 9,725 9,649 9,784
© In
terp
harm
a
Source: Federal Office of Public Health, 2016, as at 1.12.2016.
Source: Federal Office of Public Health, 2016, as at 1.12.2016.
1 10 packs (0.1%) could not be assigned to a list. These comprised pens, diskhalers and baby food.
n List A: 2,404 (24.6%)
n List B: 6,688 (68.4%)
n List C: 191 (2.0%)
n List D: 491 (5.0%)

54
The price of a medicine is not a market price
In Switzerland, the price to the public of a reimbursable medicine (maximum price that is reimbursed by the social health insurance) is not determined on the free market, but is set by the state. It is made up of the sales and marketing portion of the overall cost, the ex-factory price, the sales tax and the value-added tax. The ex-factory price is established on the basis of a therapeutic refer-ence pricing system and an international reference pricing system. In the case of the former, the cost of the product is compared with that of medicines already approved to treat the same disease. The international reference pricing system looks at the prices in coun-tries with economically comparable structures in the pharmaceu-tical sector. In June 2015, Belgium, Finland and Sweden were added to the basket of countries used for this reference pricing since 2010 (Austria, Denmark, France, Germany, Great Britain and the Netherlands).
The Swiss Agency for Therapeutic Products (Swissmedic) levies a sales tax. This is payable for every pack sold and is dependent on the ex-factory price. It amounts to 5 Swiss francs per pack at most and accounts for more than 50% of the income of Swissmedic.
For every medicine, a sales and marketing surcharge is imposed by law. For prescription-only medicines up to an ex-factory price of 880 francs a surcharge of 12% is imposed, and for more expen-sive medicines the surcharge is 7%. In addition, a price-related surcharge is levied for every pack. For reimbursable OTC medi-cines a surcharge of 80% is imposed without a surcharge per pack. In the case of non-reimbursable medicines, pricing is deter-mined by competition.

55
Composition of the price of a medicine
Ex-factory price
Foreign pricecomparison (AT, BE, DE, DK, FI, FR, GB, NL, SE) based onex-factory prices
Therapeuticcross-comparison
Value-added tax (2.5%)
Pharmaceutical benefits according to LAMal
Retail price(accordingto SpecialtiesList, SL)1
Sales anddistribution costs
Sales tax
Capital costs
Production costs(logistics, infra-structure, personnel)
© In
terp
harm
a
Source: Federal Office of Public Health.
1 The relation between retail price and ex-factory price can be found at www.spezialitaetenliste.ch
Marketing surcharges (categories A and B, without LOA1)
Ex-factory price + price-related + surcharge (in CHF) surcharge per pack (in CHF)
0.05 – 4.99 12% 4.00
5.00 –10.99 12% 8.00
11.00 –14.99 12% 12.00
15.00 – 879.99 12% 16.00
880.00 – 2,569.99 7% 60.00
from 2,570.00 0% 240.00
© In
terp
harm
a
Source: Federal Office of Public Health.
1 Service-based remuneration.

56
Prices of medicines have fallen further
In September 2016, at an exchange rate of CHF 1.07 to the euro, the prices of the 250 or so biggest-selling patent-protected original medicines were 14% higher in Switzerland than the average of the nine reference countries. This emerges from the eighth joint com-parison of international prices by santésuisse and Interpharma. The price difference is primarily due to changes in the exchange rates.
After the Swiss National Bank’s decision to lift the minimum threshold for the exchange rate of the franc against the euro in January 2015, the costs of Switzerland as a pharmaceutical centre that is of huge importance for the national economy increased around 20% owing to the strength of the franc, after the franc had already become massively overvalued in the years before and Switzerland had become an expensive location for business.
The price review by the Federal Office of Public Health (FOPH) is carried out every three years and also when the indications for a product are widened. However, only downward price adjustments are possible. Therefore the price differences versus other coun-tries will be reduced further.
The consumer price index of Eurostat measures price trends over a prolonged period. It shows that the prices of medicines in Swit-zerland have fallen substantially in the last few years. By contrast, the prices of medicines in other reference countries have increased or not fallen as sharply as in Switzerland.

57
© In
terp
harm
a
Comparison of drug prices Switzerland vs other countries
Top 250 original products 9-countries basket (exchange rate CHF / EUR 1.07), September 2016 prices
FRFIBESEATGBNLDKDE9-countries basket
CH0
20
40
60
80
100
120
100
86 90 89
105
87 85 81 80
72
84
© In
terp
harm
a
Harmonized Consumer Price Index
Pharmaceutical products (index, 2005 = 100)
Source: Eurostat, 2017.
Source: Joint foreign-price comparison by santésuisse and Interpharma, April 2017.
2014 20162015201320122011201020092008200720062005
70
60
80
90
100
110
130
120
Ø Länderkorb
CH
UK
SE
FI
AT
NL
FR
DE
DK
BE
132
126
117
103101100
95949187
68
DE AT GB DK SE NL FR BE FI CH
Average of 9 reference countries
58
Price comparison with other countries
An essential component when the prices of reimbursable medi-cines are set is the price comparison with other countries. Between 2010 and May 2015, the basket of countries was made up of Austria, Denmark, France, Germany, Great Britain and the Neth-erlands. Since June 2015, Swiss prices have also been compared with those in Belgium, Finland and Sweden. The international ref-erence pricing system is brought to bear both when a price is set for the first time as part of the process of inclusion in the specialties list (SL) and also when all medicines that have already been in-cluded in the SL undergo a price review every three years. In June 2015, therapeutic reference pricing was also considered in the triennial price review. In the three years before this, it was primar-ily only the international reference pricing system that was applied in price reviews. Since March 2017, equal weight has been given to international reference pricing and therapeutic reference pricing both for the initial inclusion in the SL and also for all price reviews. Before this, greater weight was attached to international reference pricing. The costs of research and development continue to be taken into account during the patent life.
In the three-year price reviews, prices can only be reduced, but not increased. If for example the franc, which is strong at the moment, were to weaken and Swiss prices were lower than the average of the basket of countries, the prices in Switzerland would not be automatically increased. Applications for price increases are possible.

59
Price comparisons of European states
Official price comparisonwith all EU statesOfficial price comparisonwith selected EU states
Unofficial price comparisonwith selected EU statesUnofficial price comparisonwith all EU statesNo price comparison
Switzerland Official
CH
ATBE
SE
NO
FR
DE
GRIE
IT
NL
PT
ES
UK
FI
DK
© In
terp
harm
a
Source: IMS Health; EFPIA.

60
International impact of Swiss pharmaceutical regulation
Both in industrialized countries and in emerging nations, the prices of Swiss medicines form part of the reference basket that is used to determine prices in those countries. The way in which prices are set using prices from reference markets varies from country to country. In some cases, the lowest price is used, and in other cases an average or median price is used. On the basis of inter-national price referencing, any change in Swiss prices of medicines has a global impact.
A 10% reduction in price would lead to a global decline of almost 1,108 million Swiss francs in sales for the industry. Of this, around 515 million francs would be lost in Switzerland, more than 470 million in industrialized countries and over 122 million in emerging nations. In other words, international price referencing has the effect of doubling the global impact of any price reduction in Swit-zerland. Apart from the impact on prices, this can also influence company decisions on the launch of innovative medicines and lead to delays in the introduction of products on the Swiss market. With a substantial price reduction in Switzerland, it is possible that the market launch in Switzerland would be considerably delayed.

61
© In
terp
harm
a
Switzerland as reference country
Average of basket prices Lowest basket pricesOther basket prices (e.g. median)
CH
RU
SK
FI
POBE
TW
KR
BR
BH
EG
DZ
CAIRJO
LB
OM
SATU
TR
HU
Source: The international impact of Swiss drug regulation, Charles River Associates, study on behalf of Interpharma and Novartis, March 2013, Interpharma, 2015.

62
© In
terp
harm
a
Development of pharmaceutical trade balance
Pharmaceutical trade balance (in CHF billions)
19900
10
20
30
40
50
60
80
70
1995 2000 2005 2010 2016
80.4
47.9
32.5
Source: Foreign Trade Statistics, Federal Customs Administration, 2017.
Export Surplus Import
Economic Impact
Pharmaceutical sector as driver of the export industry
Despite the continuing crisis in the eurozone in 2016, the pharma-ceutical industry managed to maintain its position as the export driver of the Swiss economy. After 2015, which was marked by the strong appreciation of the franc after the exchange rate cap against the euro was lifted in January 2015, strong export growth was recorded in 2016: exports increased by more than 14% and ran to more than 80 billion francs. They thus accounted for more than a third of Switzerland’s export volume. The trade surplus also showed a sharp increase. The most important export market for pharmaceutical products remains Europe.

63
Export of pharmaceutical products
Export volume 2016: CHF 80.4 billion (100%)=̂ 38.2% of all Swiss exports
Import of pharmaceutical products
Import volume 2016: CHF 32.5 billion (100%)=̂ 18.7% of all Swiss imports
© In
terp
harm
a©
Inte
rpha
rma
Source: Foreign Trade Statistics, Federal Customs Administration, 2017.
Source: Foreign Trade Statistics, Federal Customs Administration, 2017.
n EU 50.9%
n DE 15.5%
n GB 6.4%
n IT 5.8%
n BE 4.7%
n FR 4.2%
n Rest of EU 14.3%
n Non-EU 49.1%
n Rest of Europe
2.4%
n US 20.4%
n CN 4.8%
n JP 4.1%
n BR, RU, IN, MX, TR, KR 4.6%
n Other countries 12.8%
n EU 79.2%
n DE 22.4%
n IT 10.4%
n GB 4.8%
n FR 2.6%
n BE 1.2%
n Rest of EU 37.8%
n Non-EU 20.8%
n Rest of Europe
0.7%
n US 13.1%
n JP 1.4%
n CN 0.7%
n BR, RU, IN,
MX, TR, KR 2.1%
n Other countries 2.8%
64
High export surplus
In 2015, Switzerland posted an export surplus of more than 40 billion Swiss francs for pharmaceutical products. This has steadi-ly grown in the last few years. Comparison with the rest of Europe shows that Switzerland occupied a leading position with this result not only relatively, but also in absolute terms. The neighbouring countries, for example, showed much lower export surpluses. Italy, the USA and Japan also show a negative trade balance.
Switzerland’s positive trade balance demonstrates the high degree of competitiveness of its pharmaceutical industry. Switzerland is the country with the largest export surplus of pharmaceutical products not only in Europe, but also worldwide. Yet it is not only an important production centre, but also a major research hub.
Innovative medicines, which are often produced using biotechno-logical methods, continue to be manufactured in the classical industrial countries, and at the moment there are several new production facilities under construction in Switzerland.

65
Pharmaceutical trade balance compared with other countries
In CHF millions, according to SITC 54 Classification1, 2015
© In
terp
harm
a
Source: UN Comtrade Database, 2017; conversion to CHF by Interpharma.
¹ The Standard International Trade Classification (SITC) is a classification of goods used to classify the exports and imports of a country.
–40,000
–30,000
–20,000
–10,000
0
30,000
40,000
20,000
10,000
USJPITATGBDKFRBENLIEDECH
–19,584
–35,838
–2,491
4902,0524,3307,204
27,80526,134
8,378
40,213
2,828
66
High workplace productivity and major employer
The pharmaceutical industry is the most productive sector in Swit-zerland. Workplace productivity increased almost every year between 1980 and 2008, after which it fell again until 2012. In 2014, it stood at around 627,000 francs per employee, which was much higher than in the early years of the last decade. The prod-uctivity of the pharmaceutical industry is more than four times higher than that of industry as a whole. This has likewise increased almost every year since 1980, with the exception of a few years, but the increase has been much less marked than in the pharma-ceutical sector. Workplace productivity is defined as the nominal gross value added in francs per employee.
The pharmaceutical sector is a major employer in Switzerland. Thus in 2014, a total of around 41,800 people were directly employed in pharmaceutical companies, which corresponds to 1% of all Swiss employees. Indirectly, another 182,000 or so people are employed in the supply sector providing services to the pharmaceutical industry. The number of those directly employed in the industry has nearly doubled since 1995.

67
Workplace productivity pharmaceutical industry / overall economy
In CHF per employee (full-time equivalent)
© In
terp
harm
a
Source: BAK Basel Economics, Polynomics, 2015.
Pharmaceutical industry Overall economy
Number of employees pharmaceutical industry / overall economy
Growth in the number of employees in the pharmaceutical industry andthe overall economy (in 1,000)
© In
terp
harm
a
Source: BAK Basel Economics, Polynomics, 2015.
Pharmaindustrie (rechte Achse)Gesamtwirtschaft
1980 20140 0
45
2,000
30
15
4,000
6,000
5,056.2
41.8
22.8
3,530.1
1990 2000 2010
Overall economy (left axis) Pharmaceutical industry (right axis)
0
200,000
400,000
600,000
800,000Gesamtwirtschaft
Pharmaindustrie
1980 1990 2000 2014
627,233
103,952
63,783
157,964

68
High level of research investments in Switzerland
In 2016, the 24 Interpharma companies spent more than 7 billion francs in research and development (R&D). That is almost twice as much as they achieved in sales in Switzerland. This high level of financial investment in R&D underlines the importance of Swit-zerland as a research centre and testifies to the driving power of innovation within these companies. In the research and develop-ment process, the research-based pharmaceutical companies shoulder the full risk of research themselves. Particularly the companies with headquarters in Switzerland (Actelion, Novartis and Roche) invested a lot in R&D, but major R&D investments were also made by companies without headquarters in Switzerland.
In addition to R&D spending, the Interpharma companies in Swit-zerland also invested half a billion francs in plant, such as technical apparatus, machines and the equipment of buildings and produc-tion facilities. Both categories of investment are reflected in high staffing levels. The pharmaceutical industry is thus a mainstay of Switzerland’s economy.
Many Interpharma companies are organized as regional compa-nies in Switzerland and are therefore unable to report certain key figures for Switzerland, even though they invest in Switzerland.
© In
terp
harm
a
Source: Interpharma, 2017.
Staff levels of Interpharma companies in Switzerland
Pharmaceutical sector Switzerland, 2016¹
Workforce (full-time equivalents) 34,903

69
© In
terp
harm
a
Source: Interpharma, 2017.
1 The figures are based on the 24 Interpharma companies that were members of Interpharma in June 2017, even if they had not yet become members in 2016. Some companies do not break down certain key indicators by country and for this reason the corresponding information is not reflected in these figures. In the case of companies with several divisions, only the information for the pharmaceuticals division was included.
² Prescription-only medicines.
Interpharma companies in Switzerland
Pharmaceuticals Switzerland, 20161, in CHF millions
0
3,000
2,000
1,000
4,000
5,000
6,000
7,0007,009
567
3,651
n Sales2 n R&D n PP&E Investments

70
High global spending on research and development
In 2016, the 24 Interpharma companies invested approximately 98 billion francs in the research and development (R&D) of medicines and new treatments. This corresponds to around 20% of their sales. This reinvestment in R&D is above average compared with other industries. More than 679,000 people worldwide were employed in the pharmaceutical divisions of companies.
In the overall groups of Interpharma companies – i.e. with all other divisions, such as medical technology, generics or animal health divisions – more than a million people were employed. The groups invested more than 105 billion francs in R&D and spent around 82 billion francs on the construction of new plants.
Source: Interpharma, 2017.
Staff levels of Interpharma companies and groups
Worldwide, 2016
Headcount of Interpharma companies worldwide1 679,447
Headcount of Interpharma companies worldwide (groups) 1,181,227
© In
terp
harm
a

71
© In
terp
harm
a©
Inte
rpha
rma
Source: Interpharma, 2017.
1 The figures are based on the 24 Interpharma companies that were members of Interpharma in June 2017, even if they had not yet become members in 2016. In the case of companies with several divisions, only the information for the pharmaceuticals division was included.
² Prescription-only medicines.
Interpharma companies worldwide
Pharmaceuticals worldwide, 2016¹, in CHF millions
Groups (all divisions) worldwide, 2016, in CHF millions
0
200,000
100,000
300,000
400,000
500,000
122,411
478,527
97,96375,041
0
400,000
300,000
200,000
100,000
500,000
600,000
143,276
605,485
105,613 82,457
n Sales2 n R&D n PP&E Investments n Operating profit
n Sales n R&D n PP&E Investments n Operating profit

72
Major investments in Switzerland as a research hub
In 2016, the Interpharma companies Actelion, Novartis, Roche, Merck and Vifor Pharma spent 6,822 million Swiss francs on research and development (R&D) in the field of pharmaceuticals in Switzerland. This corresponds to 37.4% of their global R&D spend which is nearly the same as in the USA. The high levels of invest-ment in pharmaceutical research and development in Switzerland and the USA underline the importance of these two research centres.
Interpharma companies: spending on R&D worldwide
Global R&D expenditure of Interpharma companies1, 2016: CHF 18,221 million (100%)
© In
terp
harm
a
Source: Interpharma, 2017.
¹ Based on data for R&D in pharmaceuticals from Actelion, Novartis, Roche, Merck and Vifor Pharma. The other Interpharma companies do not break down their R&D investments by country and were therefore not included.
n Switzerland 37.4% =̂ CHF 6,822 millionn Rest of Europe 13.9% =̂ CHF 2,524 millionn USA 38.0% =̂ CHF 6,928 millionn Japan 5.2% =̂ CHF 949 millionn Others 5.5% =̂ CHF 998 million

73
Interpharma companies in Switzerland: sales, research and exports
In CHF billions, 2016
Source: Interpharma; export trade statistics, Federal Customs Administration, 2017.
3.77.0
80.4
0
10
20
30
40
50
60
70
80
Sales Research and development
Export
© In
terp
harm
a
74
Switzerland leads in innovation ranking
According to the European and Global Innovation Index, Switzer-land is both European and world champion in innovation. The particular strengths of Switzerland lie amongst other things in the number of scientific publications in international journals and their citability, patent applications and income based on licences and patents abroad. High employment quotas in knowledge-intensive activities and the high proportion of new graduates are further particular features of Switzerland. The European innovation index is drawn up with reference to 25 indicators, while the global index is based on 80 indicators. The data for both indexes comes pri-marily from the years 2011 to 2015.
Despite the relatively good position of Switzerland by European standards, recent developments give some cause for concern. Compared with other countries, for example, Switzerland has fallen behind in clinical research. A master plan to strengthen biomedical research and technology, which the Federal Council approved in December 2013, is aimed at reinforcing the global competitiveness of Switzerland as a research centre and of the Swiss pharmaceutical industry.

75
Swiss innovation system in comparison with EU countries
European innovation index 2016
Swiss innovation system in worldwide comparison
Global innovation index 2016
© In
terp
harm
a©
Inte
rpha
rma
Source: Innovation Union Scoreboard 2016, European Union, 2016.
Source: Global Innovation Index 2016, WIPO et al., 2016.
HKISLUKRDENLDKIESGFIUSGBSECH50
52
54
56
58
60
62
64
68
66
66.3
63.6
61.9
61.4
59.9
59.2
59.0
58.5
58.3
57.9
57.1
57.1
55.7
56.0
EUFRISATLUGBBEIENLDEFIDKSECH0.0
0.1
0.2
0.3
0.4
0.5
0.6
0.7
0.80.
79
0.70
0.70
0.65
0.63
0.63
0.61
0.60
0.60
0.60
0.59
0.57
0.57
0.52

76
Research and Development
Patent protection promotes medical advances
Patents allow exclusive commercial use of an invention during the 20-year period of patent protection. In return, the research and development results must be made accessible to the public. Third parties can be excluded from the commercial use of the patented invention and the use can be licenced for a fee. In the case of medicines the period of patent protection is reduced de facto to 15 years at the most because of the time it takes to develop the medicine and gain regulatory marketing approval. As a result of patent protection, the investments made in research and develop-ment are protected and incentives created for further innovations, because the development of new medicines is time-consuming and expensive, and the pharmaceutical companies are sole bear-ers of the risk of research. In addition, the manufacturing process of a medicine is relatively easy to copy. Against this background, patent law, which protects biotechnological inventions, is of utmost importance for pharmaceutical and biotech companies in Switzerland. Besides protecting the actual invention, the protec-tion of data from preclinical and clinical trials required by the health authorities (first-applicant protection) makes sure that no other company can refer to and use this data during the period of pro-tection following market approval.
Precisely for a country like Switzerland, which has no raw mater-ials at its disposal, knowledge and know-how are important cap-ital. In pharmaceutical research more than 85 patents per million employees were registered from Switzerland between 2000 and 2010.
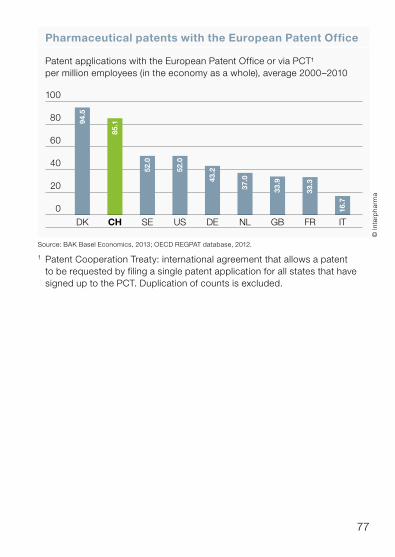
77
Pharmaceutical patents with the European Patent Office
Patent applications with the European Patent Office or via PCT¹per million employees (in the economy as a whole), average 2000–2010
© In
terp
harm
a
Source: BAK Basel Economics, 2013; OECD REGPAT database, 2012.
1 Patent Cooperation Treaty: international agreement that allows a patent to be requested by filing a single patent application for all states that have signed up to the PCT. Duplication of counts is excluded.
ITFRGBNLDEUSSECHDK
0
20
40
60
100
80 94.5
85.1
52.0
52.0
43.2
37.0
33.9
33.3
16.7

78
Pharmaceutical industry is crucial in national research and development
Private industry continues to invest a great deal. In 2015, the pri-vate sector accounted for more than 63% of all investments spent. The public sector (federal government and cantons) contributed 24% of research and development (R&D) funding, while around 2% came from private non-profit organizations and from universities.
R&D play an important part in Switzerland’s private sector. In-house R&D spending in 2015 amounted to 15.7 billion Swiss francs. This expenditure covers all financial and human resources deployed for R&D within companies in Switzerland (production sites or laboratories). At 5.5 billion francs, the pharmaceutical industry accounted for around 35% of all in-house R&D spending in Switzerland, which was thus around three times as high as the amount spent in the engineering and metal industry.
Many corporate groups are increasingly focusing their R&D spending on individual company units, while other divisions apply the results of their R&D. If this is included in the analysis, the phar-maceutical sector benefited from more than 7.9 billion francs or 51% of total in-house R&D spending in 2015.
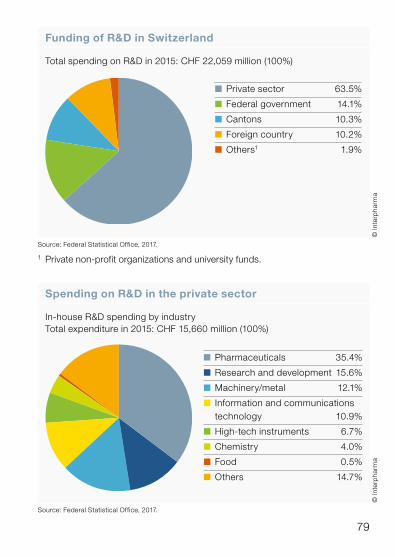
79
Funding of R&D in Switzerland
Total spending on R&D in 2015: CHF 22,059 million (100%)
© In
terp
harm
a
Source: Federal Statistical Office, 2017.
1 Private non-profit organizations and university funds.
n Private sector 63.5%
n Federal government 14.1%
n Cantons 10.3%
n Foreign country 10.2%
n Others1 1.9%
Spending on R&D in the private sector
In-house R&D spending by industryTotal expenditure in 2015: CHF 15,660 million (100%)
© In
terp
harm
a
Source: Federal Statistical Office, 2017.
n Pharmaceuticals 35.4%
n Research and development 15.6%
n Machinery/metal 12.1%
n Information and communications technology 10.9%
n High-tech instruments 6.7%
n Chemistry 4.0%
n Food 0.5%
n Others 14.7%

80
High awareness of Swiss research
Despite the growing competition from countries that have invested massively in research and development in the last few years (espe-cially in Asia), Swiss research is held in high regard worldwide. In terms of visibility in scientific publications between 2009 and 2013 Switzerland occupies an outstanding position, as shown in the bibliometric evaluation of research in Switzerland by the State Secretariat for Education, Research and Innovation. Of the twenty countries with the largest number of publications, Switzerland was the most productive country at 3.9 publications a year for every 1,000 inhabitants.
Switzerland came in the top five in almost all natural sciences. In the period from 2007 to 2011, however, it was even better placed. But in clinical medicine, Switzerland did not feature among the five best countries and was ranked seventh.
In a scientific publication, other publications are usually cited. The more often an article is cited, the greater its impact in the research community. Swiss publications were cited extraordinarily often between 2009 and 2013 and commanded above-average atten-tion in the research community. First place in the world ranking by impact was taken by the USA. Switzerland occupied third place with a value 17% above the global average. While Switzerland only accounted for 1.2% of publications worldwide, these publications enjoyed high international attention.

81
Country ranking according to recognition of scientific publications
2009–2013
Research field 1 2 3 4 5
Life sciences US GB IS CH NL
Physics, chemistry andearth sciences US CH NL GB DK
Agriculture, biology and environmental sciences GB CH NL US DK
Technological andengineering sciences, IT DK NL CH US GB
© In
terp
harm
a
Source: Bibliometric evaluation of research in Switzerland 1981–2013, report of State Secretariat for Education, Research and Innovation, 2016.
Scientific impact by country
Top 10, 2009–2013
© In
terp
harm
a
Source: Bibliometric evaluation of research in Switzerland 1981–2013, report of State Secretariat for Education, Research and Innovation, 2016.
90
95
100
105
110
115
120
WorldSEFRDECADKBEGBCHNLUS
120
118
117
116
110
109
108
106
105
105
100
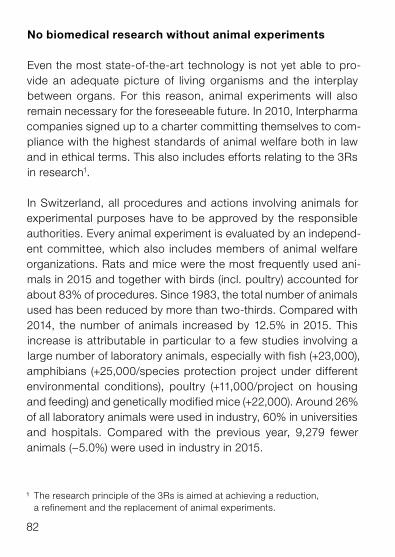
82
No biomedical research without animal experiments
Even the most state-of-the-art technology is not yet able to pro-vide an adequate picture of living organisms and the interplay between organs. For this reason, animal experiments will also remain necessary for the foreseeable future. In 2010, Interpharma companies signed up to a charter committing themselves to com-pliance with the highest standards of animal welfare both in law and in ethical terms. This also includes efforts relating to the 3Rs in research1.
In Switzerland, all procedures and actions involving animals for experimental purposes have to be approved by the responsible authorities. Every animal experiment is evaluated by an independ-ent committee, which also includes members of animal welfare organizations. Rats and mice were the most frequently used ani-mals in 2015 and together with birds (incl. poultry) accounted for about 83% of procedures. Since 1983, the total number of animals used has been reduced by more than two-thirds. Compared with 2014, the number of animals increased by 12.5% in 2015. This increase is attributable in particular to a few studies involving a large number of laboratory animals, especially with fish (+23,000), amphibians (+25,000/species protection project under different environmental conditions), poultry (+11,000/project on housing and feeding) and genetically modified mice (+22,000). Around 26% of all laboratory animals were used in industry, 60% in universities and hospitals. Compared with the previous year, 9,279 fewer animals (−5.0%) were used in industry in 2015.
¹ The research principle of the 3Rs is aimed at achieving a reduction, a refinement and the replacement of animal experiments.
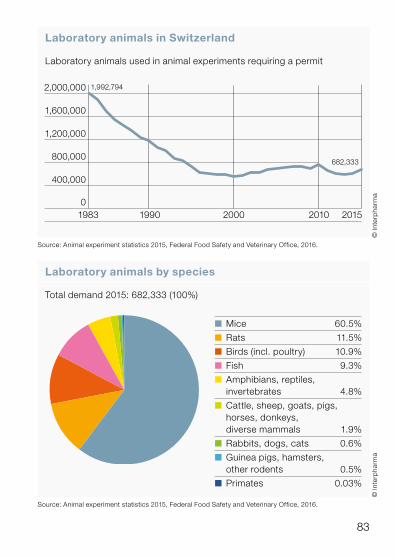
83
Laboratory animals in Switzerland
Laboratory animals used in animal experiments requiring a permit
© In
terp
harm
a
1983 1990 2000 20152010
2,000,000
1,600,000
1,200,000
800,000
400,000
0
1,992,794
682,333
Source: Animal experiment statistics 2015, Federal Food Safety and Veterinary Office, 2016.
© In
terp
harm
a
Source: Animal experiment statistics 2015, Federal Food Safety and Veterinary Office, 2016.
Laboratory animals by species
Total demand 2015: 682,333 (100%)
n Mice 60.5%
n Rats 11.5%
n Birds (incl. poultry) 10.9%
n Fish 9.3%
n Amphibians, reptiles, invertebrates 4.8%
n Cattle, sheep, goats, pigs, horses, donkeys, diverse mammals 1.9%
n Rabbits, dogs, cats 0.6%
n Guinea pigs, hamsters, other rodents 0.5%
n Primates 0.03%

84
Fewer clinical trials
To study the efficacy, safety and quality of new medicines, phar-maceutical companies have to carry out clinical trials before products are allowed onto the market. In these trials, studies are first carried out in healthy volunteers (Phase I), then in a small number of patients (Phase II) and finally in a larger number of patients (Phase III). Only after this can an application for marketing authorization be submitted to the medicines regulatory authority Swissmedic. Once market approval has been granted, the new medicine must be monitored in practice (Phase IV).
Every clinical trial has to be approved by the responsible ethics committee and definitively released by Swissmedic. The number of studies carried out is an indicator of the attractiveness of a research centre. In the last ten years, there has been a marked decrease in clinical research in Switzerland. Since 2006 the num-ber of clinical trials has declined substantially. This trend can be seen in all clinical trial phases.
The master plan approved by the Federal Council in December 2013 with a view to strengthening biomedical research and tech-nology provides for measures to counter this downward trend. Amongst other things, the quality of training for doctors in clinical research at universities and hospitals is to be improved. The Human Research Act, which came into force at the beginning of 2014, aims at speeding up the approval procedure for clinical trials in the ethics committees.

85
© In
terp
harm
a
Clinical studies in Switzerland
Clinical trials definitively approved by Swissmedic for medicines
Source: Swissmedic, 2017.
1 The total may differ from the sum of Phase I–IV trials because Phase 0 studies and observational studies have also been included in view of their small number.
0
50
100
150
200
250
300
350
400
161512 13 14111009080706
360
185
86
438
130
9033
105
57
n Total1 n Phase I n Phase II n Phase III n Phase IV

InterpharmaPetersgraben 35, P.O. BoxCH-4009 BaselPhone +41 (0)61 264 34 00Fax +41 (0)61 264 34 [email protected]