Embed Size (px)
Citation preview

8/14/2019 SWISHER COUNTY - Happy ISD - 2000 Texas School Survey of Drug and Alcohol Use
http://slidepdf.com/reader/full/swisher-county-happy-isd-2000-texas-school-survey-of-drug-and-alcohol-use 1/113
8/14/2019 SWISHER COUNTY - Happy ISD - 2000 Texas School Survey of Drug and Alcohol Use
http://slidepdf.com/reader/full/swisher-county-happy-isd-2000-texas-school-survey-of-drug-and-alcohol-use 2/113
HappySpring 2000
______________________________________________________________________________________________
Table T-1: How recently, if ever, have you used...
Past School Ever NeverMonth Year Used Used
_____________________________________________________________________________________Any tobacco product All 33.6% 38.7% 55.6% 44.4%_____________________________________________________________________________________Cigarettes All 30.2% 36.9% 52.9% 47.1%_____________________________________________________________________________________Smokeless tobacco All 14.5% 20.9% 28.8% 71.2%
______________________________________________________________________________________________
Table T-2: How often do you normally use...
Any tobacco product?
Several Several About About Less ThanNever Every Times Times Once a Once a Once aUsed Day a Week a Month Month Year Year
All 34.4% 33.2% 4.9% 1.5% 11.7% 4.5% 9.8%
Cigarettes?
Several Several About About Less ThanNever Every Times Times Once a Once a Once aUsed Day a Week a Month Month Year Year
All 33.1% 35.7% 7.0% 1.8% 9.2% 5.5% 7.7%
Smokeless tobacco?
Several Several About About Less ThanNever Every Times Times Once a Once a Once aUsed Day a Week a Month Month Year Year
All 54.1% 6.6% 8.8% 1.7% 9.6% 10.5% 8.8%
______________________________________________________________________________________________
Table T-3: In the past 30 days, how many cigarettes have you smoked?
>1 But >10 But >1 Pack<1 Per <10 Per <1 Pack But <2 >2 Packs
None Day Day Per Day Packs/Day Per Day
All 61.3% 5.4% 20.4% 11.8% * % 1.1%
______________________________________________________________________________________________
Table T-4: Average age of first use of:
All
Tobacco 12.2
8/14/2019 SWISHER COUNTY - Happy ISD - 2000 Texas School Survey of Drug and Alcohol Use
http://slidepdf.com/reader/full/swisher-county-happy-isd-2000-texas-school-survey-of-drug-and-alcohol-use 3/113
HappySpring 2000
______________________________________________________________________________________________
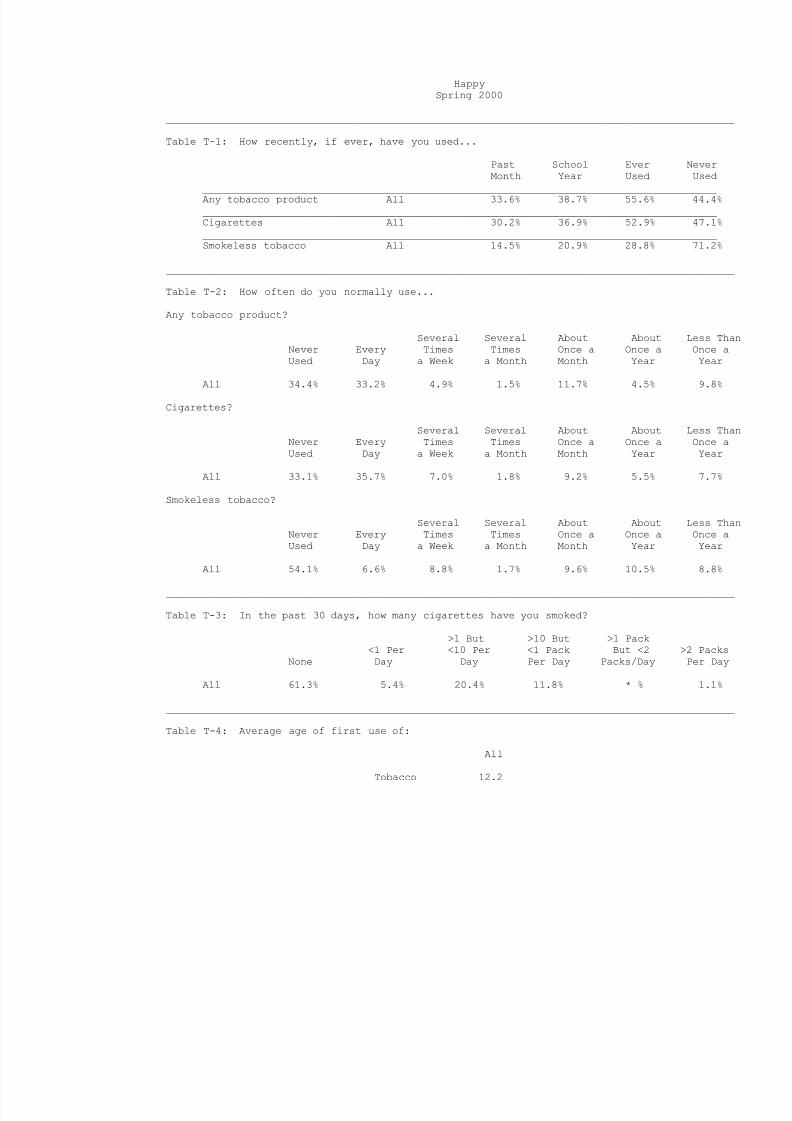
Table T-5: If you wanted some, how difficult would it be to get...
Cigarettes?
Never Very Somewhat Somewhat VeryHeard Of Impossible Difficult Difficult Easy Easy
All 11.4% 5.5% 10.0% 5.5% 14.0% 53.6%
Smokeless Tobacco?
Never Very Somewhat Somewhat VeryHeard Of Impossible Difficult Difficult Easy Easy
All 15.2% 12.7% 7.2% 5.4% 20.6% 38.9%
______________________________________________________________________________________________
Table T-6: About how many of your close friends...
Use any tobacco product?
Never heardNone A Few Some Most All
All 27.9% 26.6% 14.2% 26.8% 4.6%
Smoke cigarettes?
Never heardNone A Few Some Most All
All 30.5% 24.8% 13.3% 26.8% 4.6%
Use a smokeless tobacco product?
Never heardNone A Few Some Most All
All 46.7% 21.7% 18.0% 12.7% 0.9%
______________________________________________________________________________________________
Table T-7: How do your parents feel about kids your age smoking cigarettes?
Strongly Mildly Mildly Strongly Don'tDisapprove Disapprove Neither Approve Approve Know
All 46.0% 16.5% 27.4% 4.2% 2.9% 3.0%
______________________________________________________________________________________________
Table T-8: How dangerous do you think it is for kids your age to use tobacco?
Very Somewhat Not Very Not at All Do Not
Dangerous Dangerous Dangerous Dangerous Know
All 47.1% 28.8% 18.0% 2.4% 3.7%
8/14/2019 SWISHER COUNTY - Happy ISD - 2000 Texas School Survey of Drug and Alcohol Use
http://slidepdf.com/reader/full/swisher-county-happy-isd-2000-texas-school-survey-of-drug-and-alcohol-use 4/113
HappySpring 2000
______________________________________________________________________________________________
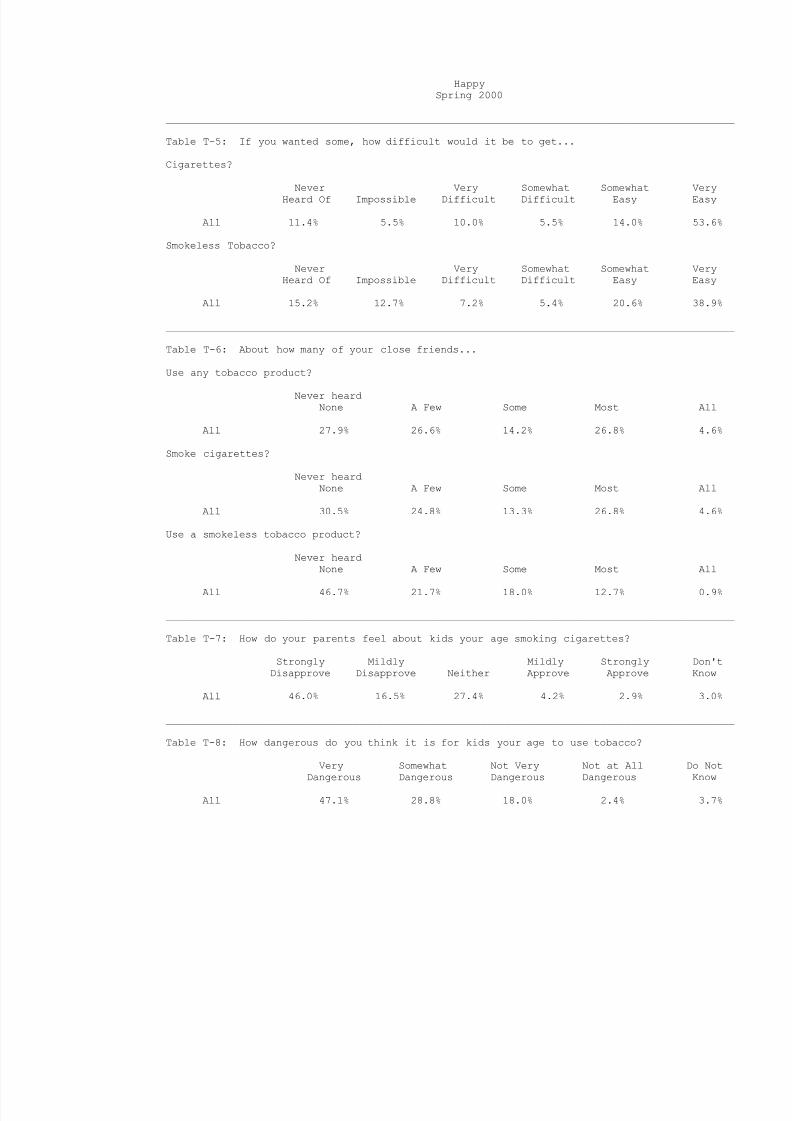
Table A-1: How recently, if ever, have you used...
Past School Ever NeverMonth Year Used Used
_____________________________________________________________________________________Any alcohol product All 36.4% 53.5% 67.3% 32.7%_____________________________________________________________________________________Beer All 32.9% 46.9% 56.8% 43.2%_____________________________________________________________________________________Wine coolers All 27.0% 44.0% 57.9% 42.1%_____________________________________________________________________________________Wine All 15.9% 32.5% 49.8% 50.2%_____________________________________________________________________________________Liquor All 26.4% 38.8% 48.3% 51.7%
______________________________________________________________________________________________
Table A-2: How often do you normally use...
Any alcohol product?
Several Several About About Less ThanNever Every Times Times Once a Once a Once aUsed Day a Week a Month Month Year Year
All 24.3% 2.2% 17.2% 15.6% 15.2% 13.3% 12.2%
Beer?
Several Several About About Less ThanNever Every Times Times Once a Once a Once aUsed Day a Week a Month Month Year Year
All 26.2% 2.9% 17.5% 18.8% 14.8% 11.6% 8.3%
Wine coolers?
Several Several About About Less Than
Never Every Times Times Once a Once a Once aUsed Day a Week a Month Month Year Year
All 21.0% * % 12.1% 20.5% 15.2% 20.2% 11.0%
Wine?
Several Several About About Less ThanNever Every Times Times Once a Once a Once aUsed Day a Week a Month Month Year Year
All 27.9% * % 5.6% 12.7% 17.1% 24.7% 12.0%
Liquor?
Several Several About About Less ThanNever Every Times Times Once a Once a Once a
Used Day a Week a Month Month Year Year
All 31.4% * % 12.9% 15.9% 13.0% 9.1% 17.7%
8/14/2019 SWISHER COUNTY - Happy ISD - 2000 Texas School Survey of Drug and Alcohol Use
http://slidepdf.com/reader/full/swisher-county-happy-isd-2000-texas-school-survey-of-drug-and-alcohol-use 5/113
HappySpring 2000
______________________________________________________________________________________________
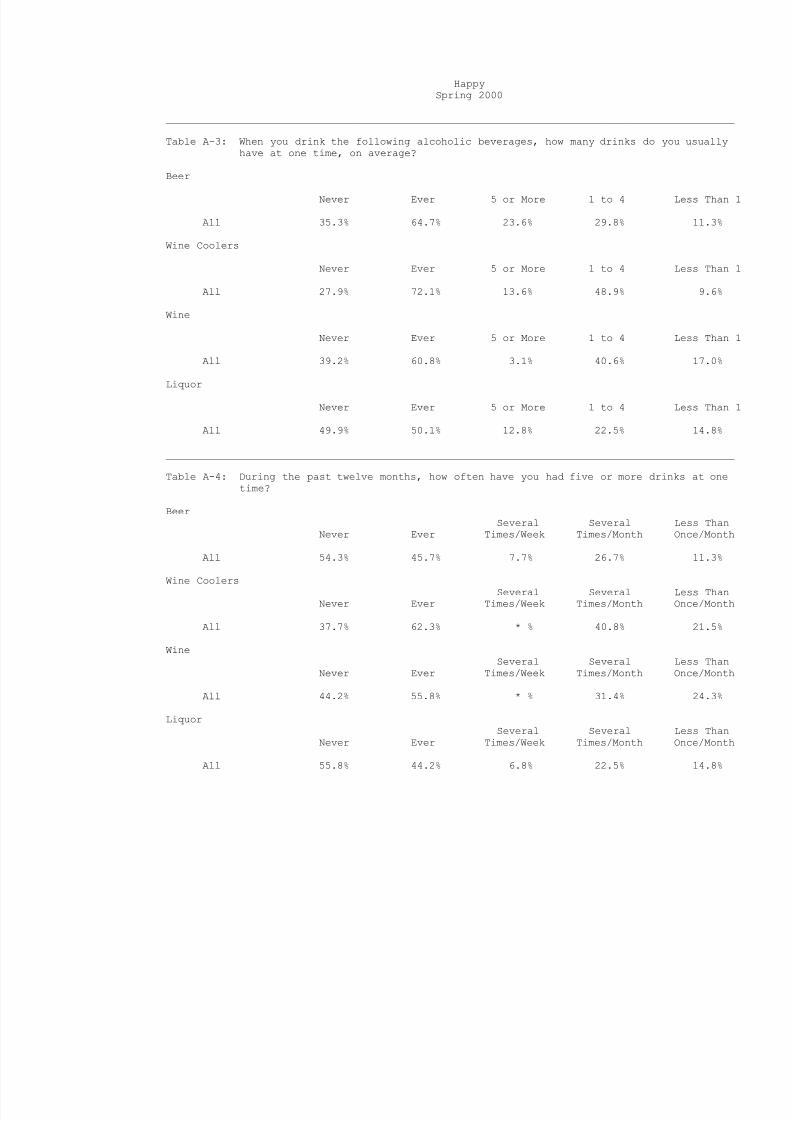
Table A-3: When you drink the following alcoholic beverages, how many drinks do you usuallyhave at one time, on average?
Beer
Never Ever 5 or More 1 to 4 Less Than 1
All 35.3% 64.7% 23.6% 29.8% 11.3%
Wine Coolers
Never Ever 5 or More 1 to 4 Less Than 1
All 27.9% 72.1% 13.6% 48.9% 9.6%
Wine
Never Ever 5 or More 1 to 4 Less Than 1
All 39.2% 60.8% 3.1% 40.6% 17.0%
Liquor
Never Ever 5 or More 1 to 4 Less Than 1
All 49.9% 50.1% 12.8% 22.5% 14.8%
______________________________________________________________________________________________
Table A-4: During the past twelve months, how often have you had five or more drinks at onetime?
BeerSeveral Several Less Than
Never Ever Times/Week Times/Month Once/Month
All 54.3% 45.7% 7.7% 26.7% 11.3%
Wine Coolers Several Several Less ThanNever Ever Times/Week Times/Month Once/Month
All 37.7% 62.3% * % 40.8% 21.5%
WineSeveral Several Less Than
Never Ever Times/Week Times/Month Once/Month
All 44.2% 55.8% * % 31.4% 24.3%
LiquorSeveral Several Less Than
Never Ever Times/Week Times/Month Once/Month
All 55.8% 44.2% 6.8% 22.5% 14.8%
8/14/2019 SWISHER COUNTY - Happy ISD - 2000 Texas School Survey of Drug and Alcohol Use
http://slidepdf.com/reader/full/swisher-county-happy-isd-2000-texas-school-survey-of-drug-and-alcohol-use 6/113
HappySpring 2000
______________________________________________________________________________________________
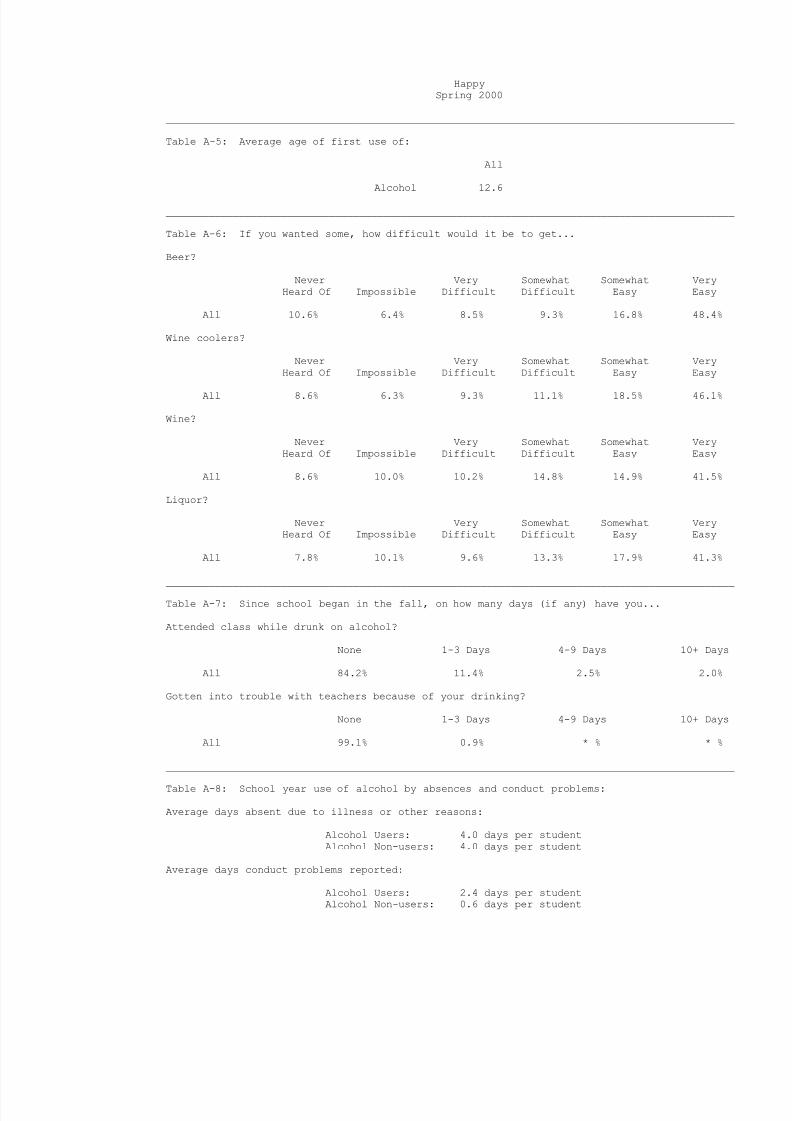
Table A-5: Average age of first use of:
All
Alcohol 12.6
______________________________________________________________________________________________
Table A-6: If you wanted some, how difficult would it be to get...
Beer?
Never Very Somewhat Somewhat VeryHeard Of Impossible Difficult Difficult Easy Easy
All 10.6% 6.4% 8.5% 9.3% 16.8% 48.4%
Wine coolers?
Never Very Somewhat Somewhat VeryHeard Of Impossible Difficult Difficult Easy Easy
All 8.6% 6.3% 9.3% 11.1% 18.5% 46.1%
Wine?
Never Very Somewhat Somewhat VeryHeard Of Impossible Difficult Difficult Easy Easy
All 8.6% 10.0% 10.2% 14.8% 14.9% 41.5%
Liquor?
Never Very Somewhat Somewhat VeryHeard Of Impossible Difficult Difficult Easy Easy
All 7.8% 10.1% 9.6% 13.3% 17.9% 41.3%
______________________________________________________________________________________________Table A-7: Since school began in the fall, on how many days (if any) have you...
Attended class while drunk on alcohol?
None 1-3 Days 4-9 Days 10+ Days
All 84.2% 11.4% 2.5% 2.0%
Gotten into trouble with teachers because of your drinking?
None 1-3 Days 4-9 Days 10+ Days
All 99.1% 0.9% * % * %
______________________________________________________________________________________________
Table A-8: School year use of alcohol by absences and conduct problems:
Average days absent due to illness or other reasons:
Alcohol Users: 4.0 days per studentAlcohol Non-users: 4.0 days per student
Average days conduct problems reported:
Alcohol Users: 2.4 days per studentAlcohol Non-users: 0.6 days per student
8/14/2019 SWISHER COUNTY - Happy ISD - 2000 Texas School Survey of Drug and Alcohol Use
http://slidepdf.com/reader/full/swisher-county-happy-isd-2000-texas-school-survey-of-drug-and-alcohol-use 7/113
HappySpring 2000
______________________________________________________________________________________________
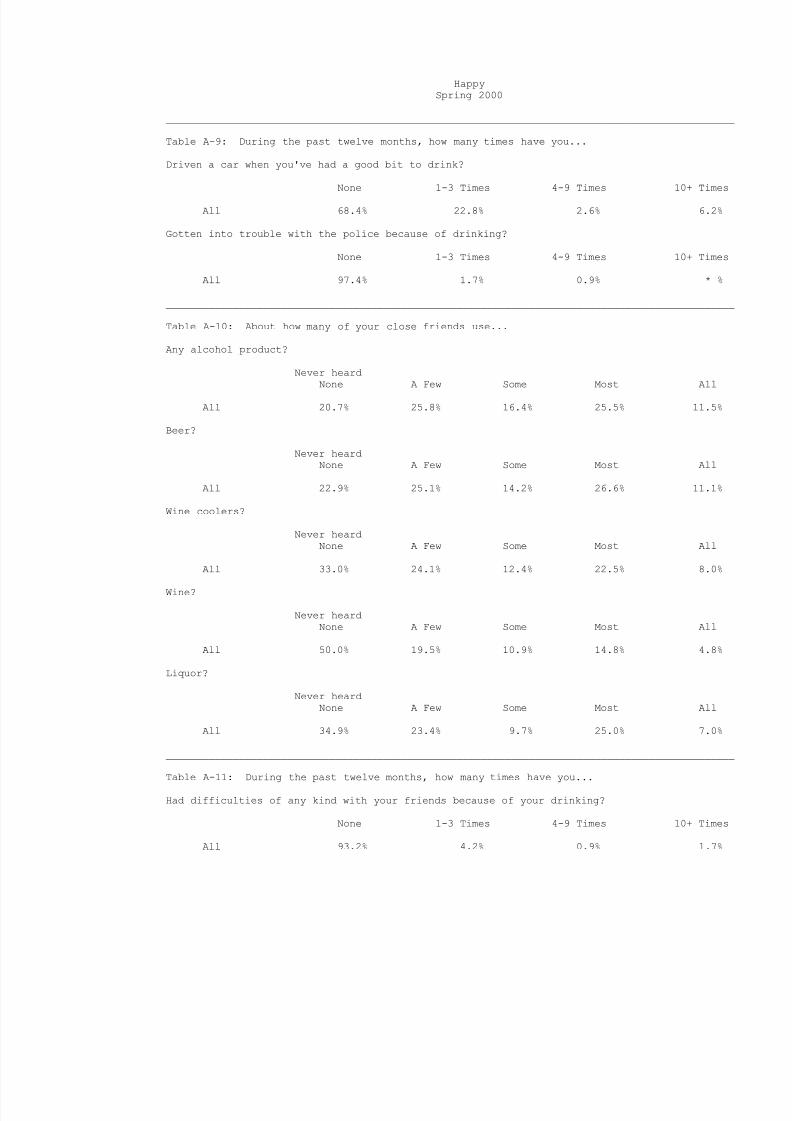
Table A-9: During the past twelve months, how many times have you...
Driven a car when you've had a good bit to drink?
None 1-3 Times 4-9 Times 10+ Times
All 68.4% 22.8% 2.6% 6.2%
Gotten into trouble with the police because of drinking?
None 1-3 Times 4-9 Times 10+ Times
All 97.4% 1.7% 0.9% * %
______________________________________________________________________________________________
Table A-10: About how many of your close friends use...
Any alcohol product?
Never heardNone A Few Some Most All
All 20.7% 25.8% 16.4% 25.5% 11.5%
Beer?
Never heardNone A Few Some Most All
All 22.9% 25.1% 14.2% 26.6% 11.1%
Wine coolers?
Never heardNone A Few Some Most All
All 33.0% 24.1% 12.4% 22.5% 8.0%
Wine?
Never heardNone A Few Some Most All
All 50.0% 19.5% 10.9% 14.8% 4.8%
Liquor?
Never heardNone A Few Some Most All
All 34.9% 23.4% 9.7% 25.0% 7.0%
______________________________________________________________________________________________
Table A-11: During the past twelve months, how many times have you...
Had difficulties of any kind with your friends because of your drinking?
None 1-3 Times 4-9 Times 10+ Times
All 93.2% 4.2% 0.9% 1.7%
8/14/2019 SWISHER COUNTY - Happy ISD - 2000 Texas School Survey of Drug and Alcohol Use
http://slidepdf.com/reader/full/swisher-county-happy-isd-2000-texas-school-survey-of-drug-and-alcohol-use 8/113
HappySpring 2000
______________________________________________________________________________________________
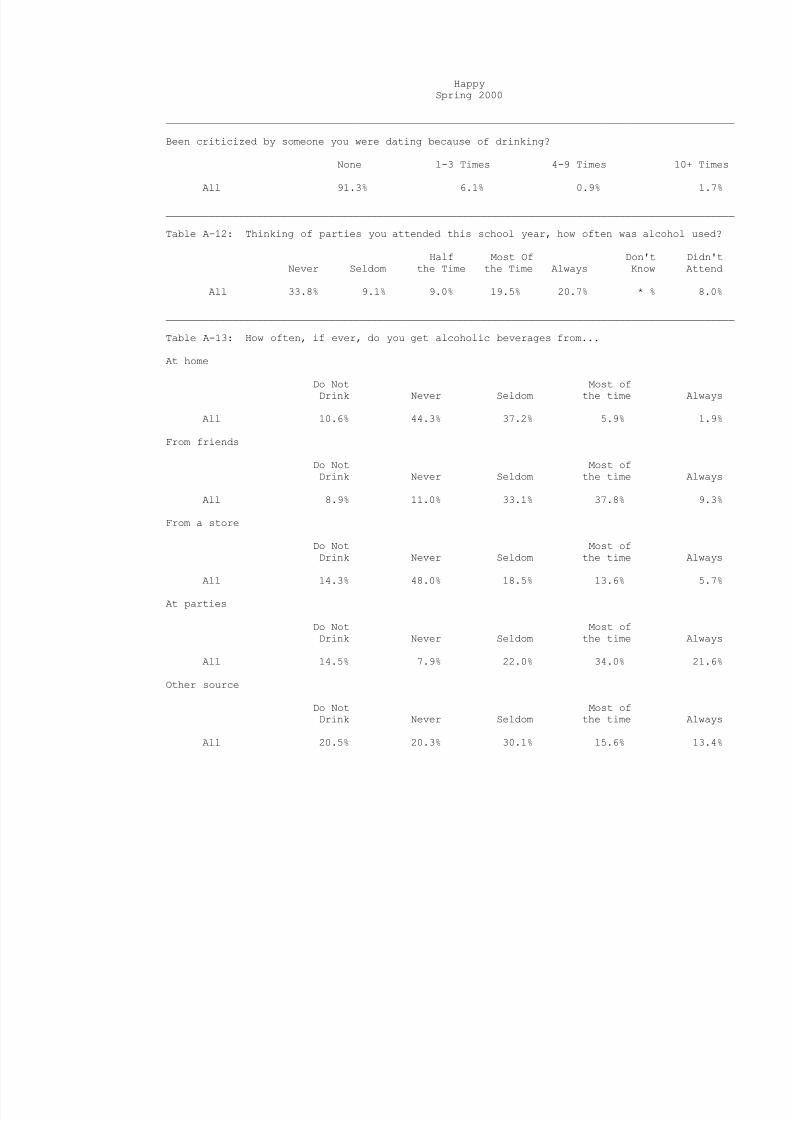
Been criticized by someone you were dating because of drinking?
None 1-3 Times 4-9 Times 10+ Times
All 91.3% 6.1% 0.9% 1.7%
______________________________________________________________________________________________
Table A-12: Thinking of parties you attended this school year, how often was alcohol used?
Half Most Of Don't Didn'tNever Seldom the Time the Time Always Know Attend
All 33.8% 9.1% 9.0% 19.5% 20.7% * % 8.0%
______________________________________________________________________________________________
Table A-13: How often, if ever, do you get alcoholic beverages from...
At home
Do Not Most ofDrink Never Seldom the time Always
All 10.6% 44.3% 37.2% 5.9% 1.9%
From friends
Do Not Most ofDrink Never Seldom the time Always
All 8.9% 11.0% 33.1% 37.8% 9.3%
From a store
Do Not Most ofDrink Never Seldom the time Always
All 14.3% 48.0% 18.5% 13.6% 5.7%At parties
Do Not Most ofDrink Never Seldom the time Always
All 14.5% 7.9% 22.0% 34.0% 21.6%
Other source
Do Not Most ofDrink Never Seldom the time Always
All 20.5% 20.3% 30.1% 15.6% 13.4%
8/14/2019 SWISHER COUNTY - Happy ISD - 2000 Texas School Survey of Drug and Alcohol Use
http://slidepdf.com/reader/full/swisher-county-happy-isd-2000-texas-school-survey-of-drug-and-alcohol-use 9/113
HappySpring 2000
______________________________________________________________________________________________
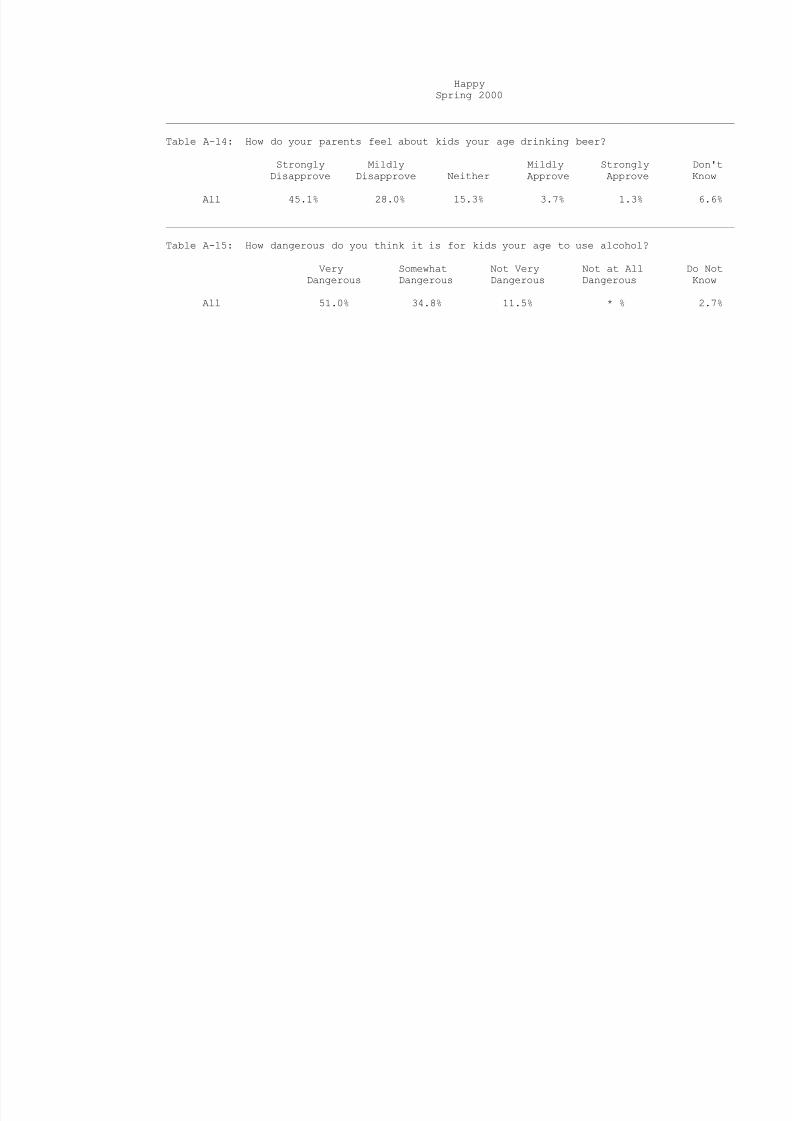
Table A-14: How do your parents feel about kids your age drinking beer?
Strongly Mildly Mildly Strongly Don'tDisapprove Disapprove Neither Approve Approve Know
All 45.1% 28.0% 15.3% 3.7% 1.3% 6.6%
______________________________________________________________________________________________
Table A-15: How dangerous do you think it is for kids your age to use alcohol?
Very Somewhat Not Very Not at All Do NotDangerous Dangerous Dangerous Dangerous Know
All 51.0% 34.8% 11.5% * % 2.7%
8/14/2019 SWISHER COUNTY - Happy ISD - 2000 Texas School Survey of Drug and Alcohol Use
http://slidepdf.com/reader/full/swisher-county-happy-isd-2000-texas-school-survey-of-drug-and-alcohol-use 10/113
HappySpring 2000
______________________________________________________________________________________________
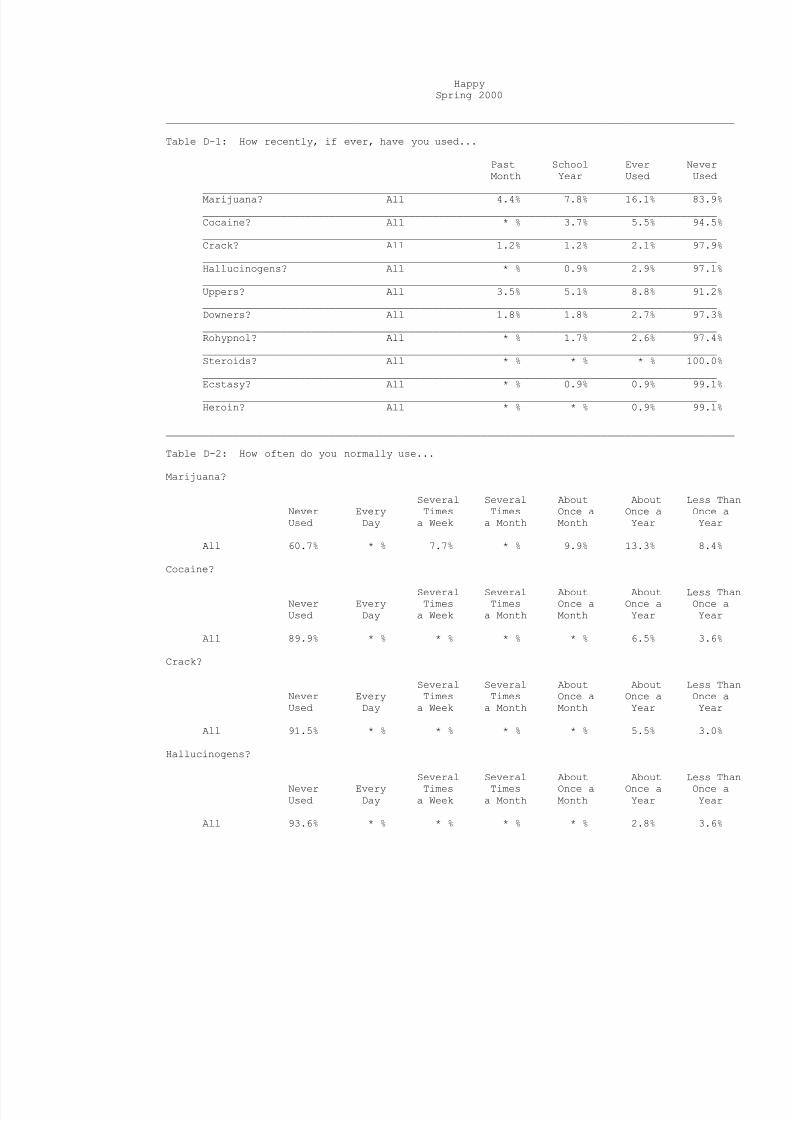
Table D-1: How recently, if ever, have you used...
Past School Ever NeverMonth Year Used Used
_____________________________________________________________________________________Marijuana? All 4.4% 7.8% 16.1% 83.9%_____________________________________________________________________________________Cocaine? All * % 3.7% 5.5% 94.5%_____________________________________________________________________________________Crack? All 1.2% 1.2% 2.1% 97.9%_____________________________________________________________________________________Hallucinogens? All * % 0.9% 2.9% 97.1%_____________________________________________________________________________________Uppers? All 3.5% 5.1% 8.8% 91.2%_____________________________________________________________________________________Downers? All 1.8% 1.8% 2.7% 97.3%_____________________________________________________________________________________Rohypnol? All * % 1.7% 2.6% 97.4%_____________________________________________________________________________________Steroids? All * % * % * % 100.0%_____________________________________________________________________________________Ecstasy? All * % 0.9% 0.9% 99.1%_____________________________________________________________________________________Heroin? All * % * % 0.9% 99.1%
______________________________________________________________________________________________
Table D-2: How often do you normally use...
Marijuana?
Several Several About About Less ThanNever Every Times Times Once a Once a Once aUsed Day a Week a Month Month Year Year
All 60.7% * % 7.7% * % 9.9% 13.3% 8.4%
Cocaine?
Several Several About About Less ThanNever Every Times Times Once a Once a Once aUsed Day a Week a Month Month Year Year
All 89.9% * % * % * % * % 6.5% 3.6%
Crack?
Several Several About About Less ThanNever Every Times Times Once a Once a Once aUsed Day a Week a Month Month Year Year
All 91.5% * % * % * % * % 5.5% 3.0%
Hallucinogens?
Several Several About About Less ThanNever Every Times Times Once a Once a Once aUsed Day a Week a Month Month Year Year
All 93.6% * % * % * % * % 2.8% 3.6%
8/14/2019 SWISHER COUNTY - Happy ISD - 2000 Texas School Survey of Drug and Alcohol Use
http://slidepdf.com/reader/full/swisher-county-happy-isd-2000-texas-school-survey-of-drug-and-alcohol-use 11/113
HappySpring 2000
______________________________________________________________________________________________
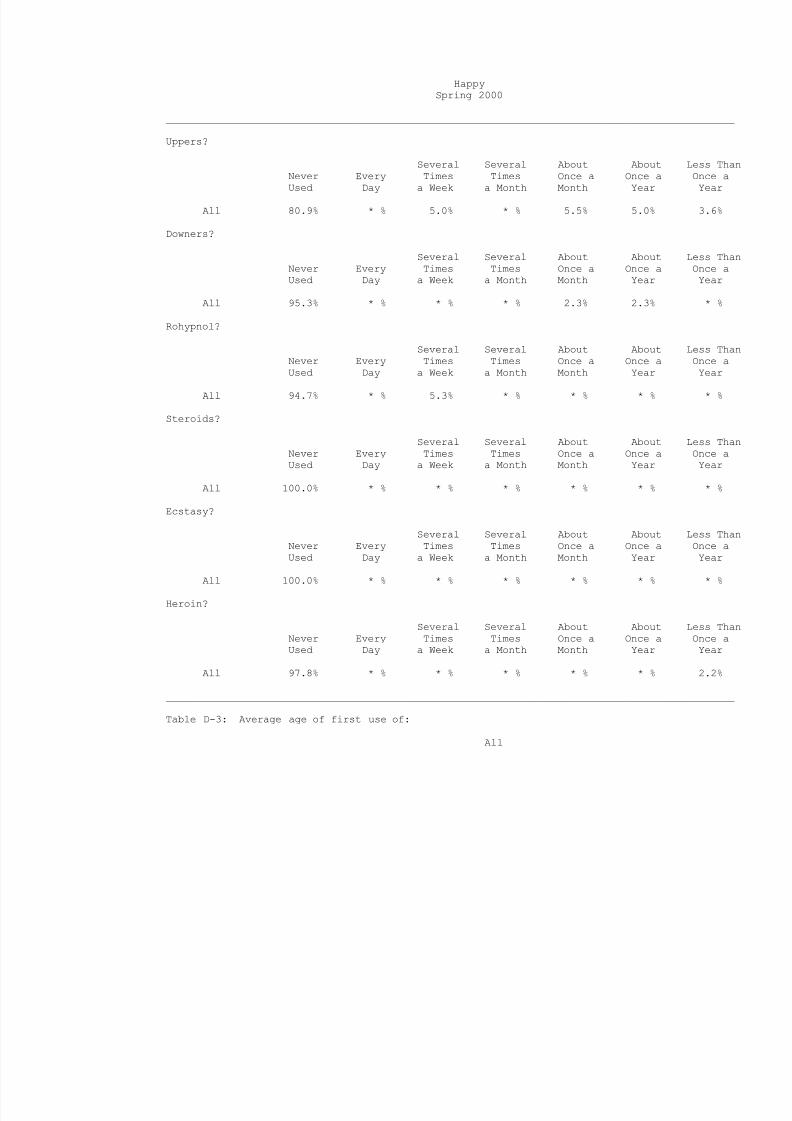
Uppers?
Several Several About About Less ThanNever Every Times Times Once a Once a Once aUsed Day a Week a Month Month Year Year
All 80.9% * % 5.0% * % 5.5% 5.0% 3.6%
Downers?
Several Several About About Less ThanNever Every Times Times Once a Once a Once aUsed Day a Week a Month Month Year Year
All 95.3% * % * % * % 2.3% 2.3% * %
Rohypnol?
Several Several About About Less ThanNever Every Times Times Once a Once a Once aUsed Day a Week a Month Month Year Year
All 94.7% * % 5.3% * % * % * % * %
Steroids?
Several Several About About Less ThanNever Every Times Times Once a Once a Once aUsed Day a Week a Month Month Year Year
All 100.0% * % * % * % * % * % * %
Ecstasy?
Several Several About About Less ThanNever Every Times Times Once a Once a Once aUsed Day a Week a Month Month Year Year
All 100.0% * % * % * % * % * % * %Heroin?
Several Several About About Less ThanNever Every Times Times Once a Once a Once aUsed Day a Week a Month Month Year Year
All 97.8% * % * % * % * % * % 2.2%
______________________________________________________________________________________________
Table D-3: Average age of first use of:
All
8/14/2019 SWISHER COUNTY - Happy ISD - 2000 Texas School Survey of Drug and Alcohol Use
http://slidepdf.com/reader/full/swisher-county-happy-isd-2000-texas-school-survey-of-drug-and-alcohol-use 12/113
HappySpring 2000
______________________________________________________________________________________________
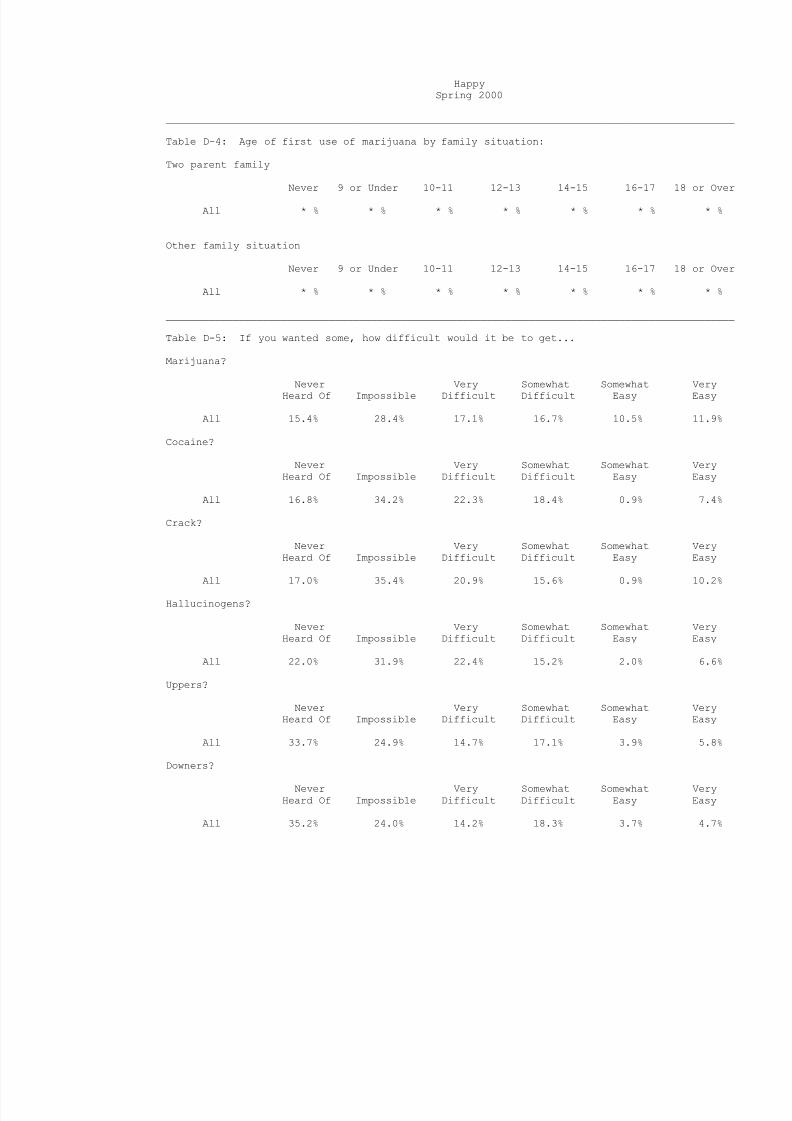
Table D-4: Age of first use of marijuana by family situation:
Two parent family
Never 9 or Under 10-11 12-13 14-15 16-17 18 or Over
All * % * % * % * % * % * % * %
Other family situation
Never 9 or Under 10-11 12-13 14-15 16-17 18 or Over
All * % * % * % * % * % * % * %
______________________________________________________________________________________________
Table D-5: If you wanted some, how difficult would it be to get...
Marijuana?
Never Very Somewhat Somewhat VeryHeard Of Impossible Difficult Difficult Easy Easy
All 15.4% 28.4% 17.1% 16.7% 10.5% 11.9%
Cocaine?
Never Very Somewhat Somewhat VeryHeard Of Impossible Difficult Difficult Easy Easy
All 16.8% 34.2% 22.3% 18.4% 0.9% 7.4%
Crack?
Never Very Somewhat Somewhat VeryHeard Of Impossible Difficult Difficult Easy Easy
All 17.0% 35.4% 20.9% 15.6% 0.9% 10.2%Hallucinogens?
Never Very Somewhat Somewhat VeryHeard Of Impossible Difficult Difficult Easy Easy
All 22.0% 31.9% 22.4% 15.2% 2.0% 6.6%
Uppers?
Never Very Somewhat Somewhat VeryHeard Of Impossible Difficult Difficult Easy Easy
All 33.7% 24.9% 14.7% 17.1% 3.9% 5.8%
Downers?
Never Very Somewhat Somewhat VeryHeard Of Impossible Difficult Difficult Easy Easy
All 35.2% 24.0% 14.2% 18.3% 3.7% 4.7%
8/14/2019 SWISHER COUNTY - Happy ISD - 2000 Texas School Survey of Drug and Alcohol Use
http://slidepdf.com/reader/full/swisher-county-happy-isd-2000-texas-school-survey-of-drug-and-alcohol-use 13/113
HappySpring 2000
______________________________________________________________________________________________
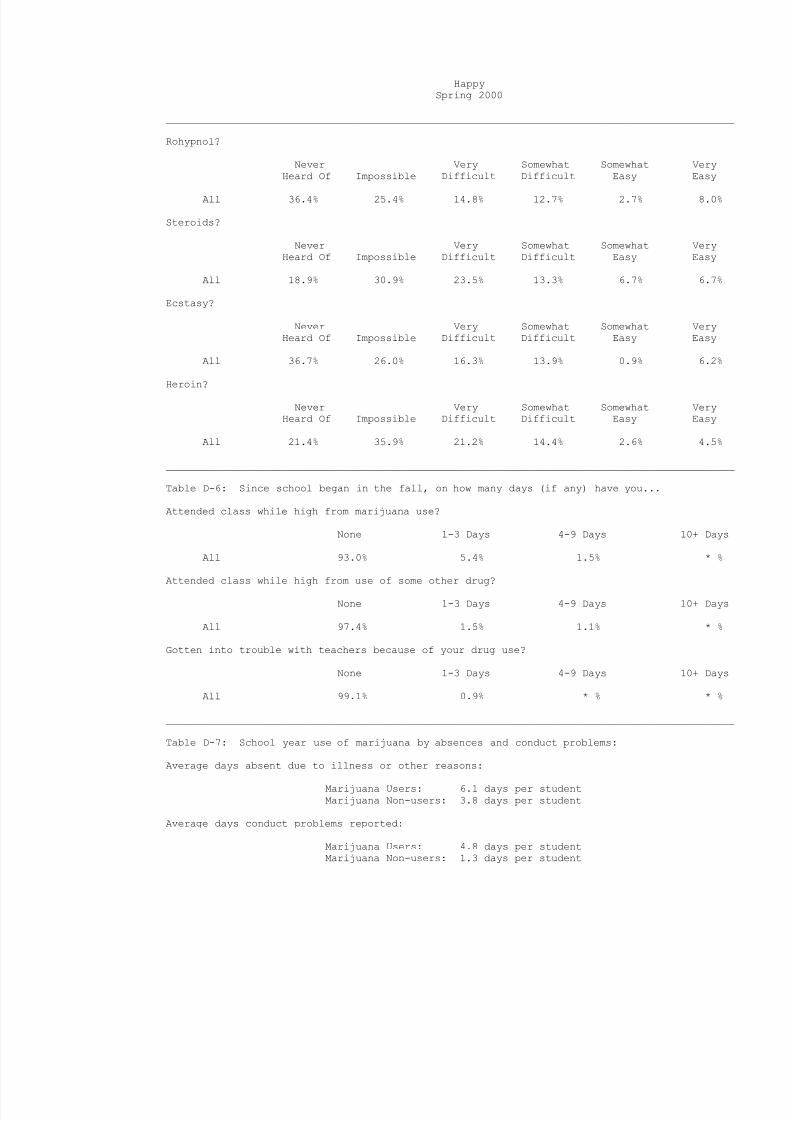
Rohypnol?
Never Very Somewhat Somewhat VeryHeard Of Impossible Difficult Difficult Easy Easy
All 36.4% 25.4% 14.8% 12.7% 2.7% 8.0%
Steroids?
Never Very Somewhat Somewhat VeryHeard Of Impossible Difficult Difficult Easy Easy
All 18.9% 30.9% 23.5% 13.3% 6.7% 6.7%
Ecstasy?
Never Very Somewhat Somewhat VeryHeard Of Impossible Difficult Difficult Easy Easy
All 36.7% 26.0% 16.3% 13.9% 0.9% 6.2%
Heroin?
Never Very Somewhat Somewhat VeryHeard Of Impossible Difficult Difficult Easy Easy
All 21.4% 35.9% 21.2% 14.4% 2.6% 4.5%
______________________________________________________________________________________________
Table D-6: Since school began in the fall, on how many days (if any) have you...
Attended class while high from marijuana use?
None 1-3 Days 4-9 Days 10+ Days
All 93.0% 5.4% 1.5% * %
Attended class while high from use of some other drug?None 1-3 Days 4-9 Days 10+ Days
All 97.4% 1.5% 1.1% * %
Gotten into trouble with teachers because of your drug use?
None 1-3 Days 4-9 Days 10+ Days
All 99.1% 0.9% * % * %
______________________________________________________________________________________________
Table D-7: School year use of marijuana by absences and conduct problems:
Average days absent due to illness or other reasons:
Marijuana Users: 6.1 days per studentMarijuana Non-users: 3.8 days per student
Average days conduct problems reported:
Marijuana Users: 4.8 days per studentMarijuana Non-users: 1.3 days per student
8/14/2019 SWISHER COUNTY - Happy ISD - 2000 Texas School Survey of Drug and Alcohol Use
http://slidepdf.com/reader/full/swisher-county-happy-isd-2000-texas-school-survey-of-drug-and-alcohol-use 14/113
HappySpring 2000
______________________________________________________________________________________________
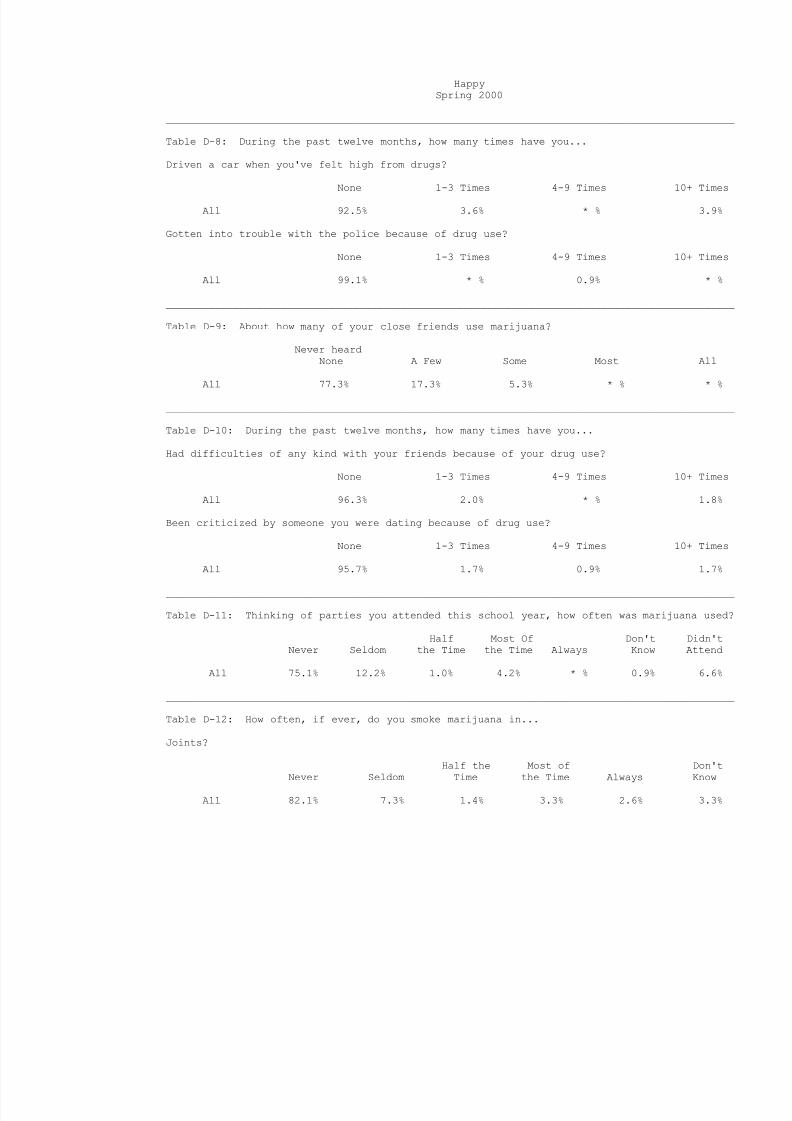
Table D-8: During the past twelve months, how many times have you...
Driven a car when you've felt high from drugs?
None 1-3 Times 4-9 Times 10+ Times
All 92.5% 3.6% * % 3.9%
Gotten into trouble with the police because of drug use?
None 1-3 Times 4-9 Times 10+ Times
All 99.1% * % 0.9% * %
______________________________________________________________________________________________
Table D-9: About how many of your close friends use marijuana?
Never heardNone A Few Some Most All
All 77.3% 17.3% 5.3% * % * %
______________________________________________________________________________________________
Table D-10: During the past twelve months, how many times have you...
Had difficulties of any kind with your friends because of your drug use?
None 1-3 Times 4-9 Times 10+ Times
All 96.3% 2.0% * % 1.8%
Been criticized by someone you were dating because of drug use?
None 1-3 Times 4-9 Times 10+ Times
All 95.7% 1.7% 0.9% 1.7%
______________________________________________________________________________________________
Table D-11: Thinking of parties you attended this school year, how often was marijuana used?
Half Most Of Don't Didn'tNever Seldom the Time the Time Always Know Attend
All 75.1% 12.2% 1.0% 4.2% * % 0.9% 6.6%
______________________________________________________________________________________________
Table D-12: How often, if ever, do you smoke marijuana in...
Joints?
Half the Most of Don't
Never Seldom Time the Time Always Know
All 82.1% 7.3% 1.4% 3.3% 2.6% 3.3%
8/14/2019 SWISHER COUNTY - Happy ISD - 2000 Texas School Survey of Drug and Alcohol Use
http://slidepdf.com/reader/full/swisher-county-happy-isd-2000-texas-school-survey-of-drug-and-alcohol-use 15/113
HappySpring 2000
______________________________________________________________________________________________
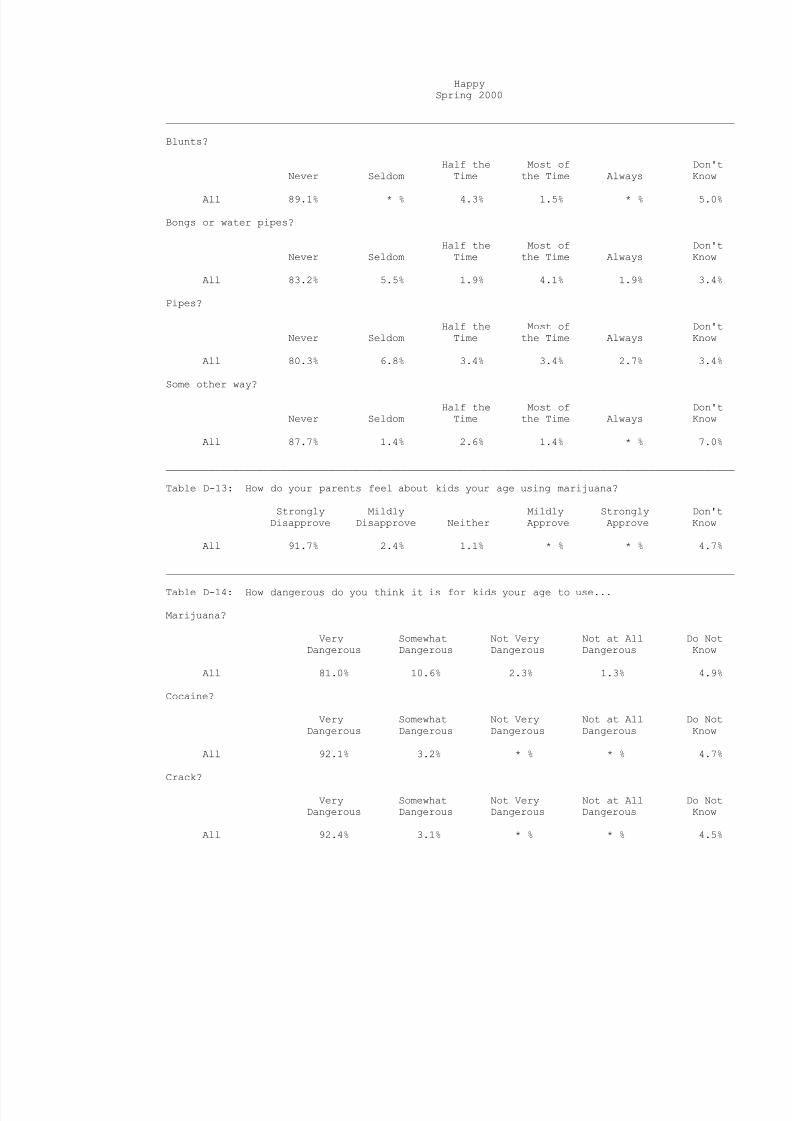
Blunts?
Half the Most of Don'tNever Seldom Time the Time Always Know
All 89.1% * % 4.3% 1.5% * % 5.0%
Bongs or water pipes?
Half the Most of Don'tNever Seldom Time the Time Always Know
All 83.2% 5.5% 1.9% 4.1% 1.9% 3.4%
Pipes?
Half the Most of Don'tNever Seldom Time the Time Always Know
All 80.3% 6.8% 3.4% 3.4% 2.7% 3.4%
Some other way?
Half the Most of Don'tNever Seldom Time the Time Always Know
All 87.7% 1.4% 2.6% 1.4% * % 7.0%
______________________________________________________________________________________________
Table D-13: How do your parents feel about kids your age using marijuana?
Strongly Mildly Mildly Strongly Don'tDisapprove Disapprove Neither Approve Approve Know
All 91.7% 2.4% 1.1% * % * % 4.7%
______________________________________________________________________________________________
Table D-14: How dangerous do you think it is for kids your age to use...
Marijuana?
Very Somewhat Not Very Not at All Do NotDangerous Dangerous Dangerous Dangerous Know
All 81.0% 10.6% 2.3% 1.3% 4.9%
Cocaine?
Very Somewhat Not Very Not at All Do NotDangerous Dangerous Dangerous Dangerous Know
All 92.1% 3.2% * % * % 4.7%
Crack?
Very Somewhat Not Very Not at All Do NotDangerous Dangerous Dangerous Dangerous Know
All 92.4% 3.1% * % * % 4.5%
8/14/2019 SWISHER COUNTY - Happy ISD - 2000 Texas School Survey of Drug and Alcohol Use
http://slidepdf.com/reader/full/swisher-county-happy-isd-2000-texas-school-survey-of-drug-and-alcohol-use 16/113
HappySpring 2000
______________________________________________________________________________________________
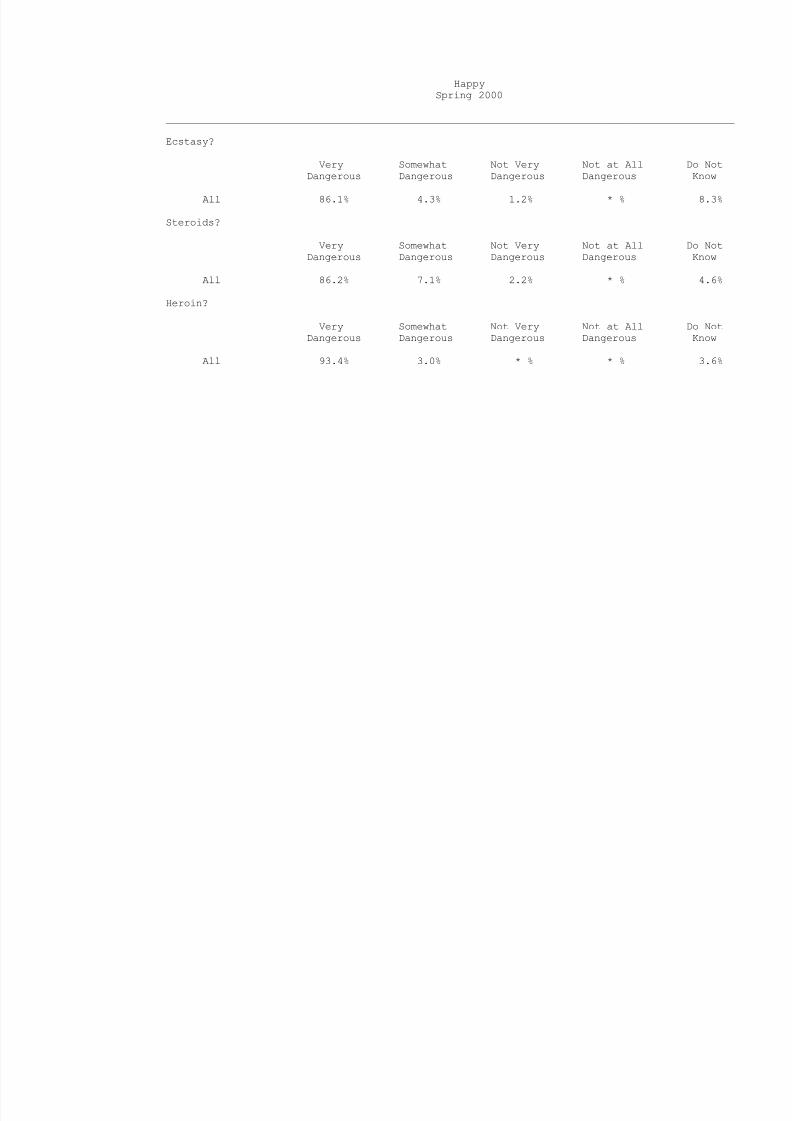
Ecstasy?
Very Somewhat Not Very Not at All Do NotDangerous Dangerous Dangerous Dangerous Know
All 86.1% 4.3% 1.2% * % 8.3%
Steroids?
Very Somewhat Not Very Not at All Do NotDangerous Dangerous Dangerous Dangerous Know
All 86.2% 7.1% 2.2% * % 4.6%
Heroin?
Very Somewhat Not Very Not at All Do NotDangerous Dangerous Dangerous Dangerous Know
All 93.4% 3.0% * % * % 3.6%

8/14/2019 SWISHER COUNTY - Happy ISD - 2000 Texas School Survey of Drug and Alcohol Use
http://slidepdf.com/reader/full/swisher-county-happy-isd-2000-texas-school-survey-of-drug-and-alcohol-use 17/113
8/14/2019 SWISHER COUNTY - Happy ISD - 2000 Texas School Survey of Drug and Alcohol Use
http://slidepdf.com/reader/full/swisher-county-happy-isd-2000-texas-school-survey-of-drug-and-alcohol-use 18/113
HappySpring 2000
______________________________________________________________________________________________
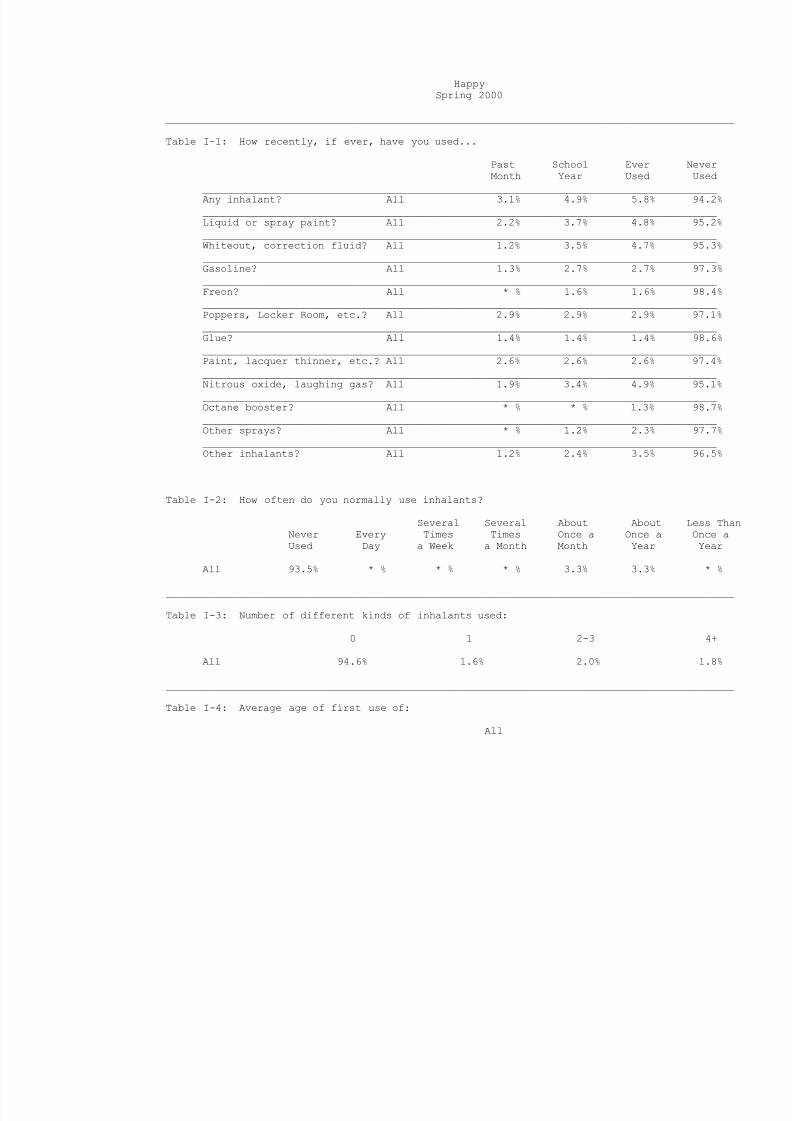
Table I-1: How recently, if ever, have you used...
Past School Ever NeverMonth Year Used Used
_____________________________________________________________________________________Any inhalant? All 3.1% 4.9% 5.8% 94.2%_____________________________________________________________________________________Liquid or spray paint? All 2.2% 3.7% 4.8% 95.2%_____________________________________________________________________________________Whiteout, correction fluid? All 1.2% 3.5% 4.7% 95.3%_____________________________________________________________________________________Gasoline? All 1.3% 2.7% 2.7% 97.3%_____________________________________________________________________________________Freon? All * % 1.6% 1.6% 98.4%_____________________________________________________________________________________Poppers, Locker Room, etc.? All 2.9% 2.9% 2.9% 97.1%_____________________________________________________________________________________Glue? All 1.4% 1.4% 1.4% 98.6%_____________________________________________________________________________________Paint, lacquer thinner, etc.? All 2.6% 2.6% 2.6% 97.4%_____________________________________________________________________________________Nitrous oxide, laughing gas? All 1.9% 3.4% 4.9% 95.1%_____________________________________________________________________________________Octane booster? All * % * % 1.3% 98.7%_____________________________________________________________________________________Other sprays? All * % 1.2% 2.3% 97.7%_____________________________________________________________________________________Other inhalants? All 1.2% 2.4% 3.5% 96.5%
______________________________________________________________________________________________
Table I-2: How often do you normally use inhalants?
Several Several About About Less ThanNever Every Times Times Once a Once a Once aUsed Day a Week a Month Month Year Year
All 93.5% * % * % * % 3.3% 3.3% * %
______________________________________________________________________________________________
Table I-3: Number of different kinds of inhalants used:
0 1 2-3 4+
All 94.6% 1.6% 2.0% 1.8%
______________________________________________________________________________________________
Table I-4: Average age of first use of:
All
8/14/2019 SWISHER COUNTY - Happy ISD - 2000 Texas School Survey of Drug and Alcohol Use
http://slidepdf.com/reader/full/swisher-county-happy-isd-2000-texas-school-survey-of-drug-and-alcohol-use 19/113
HappySpring 2000
______________________________________________________________________________________________
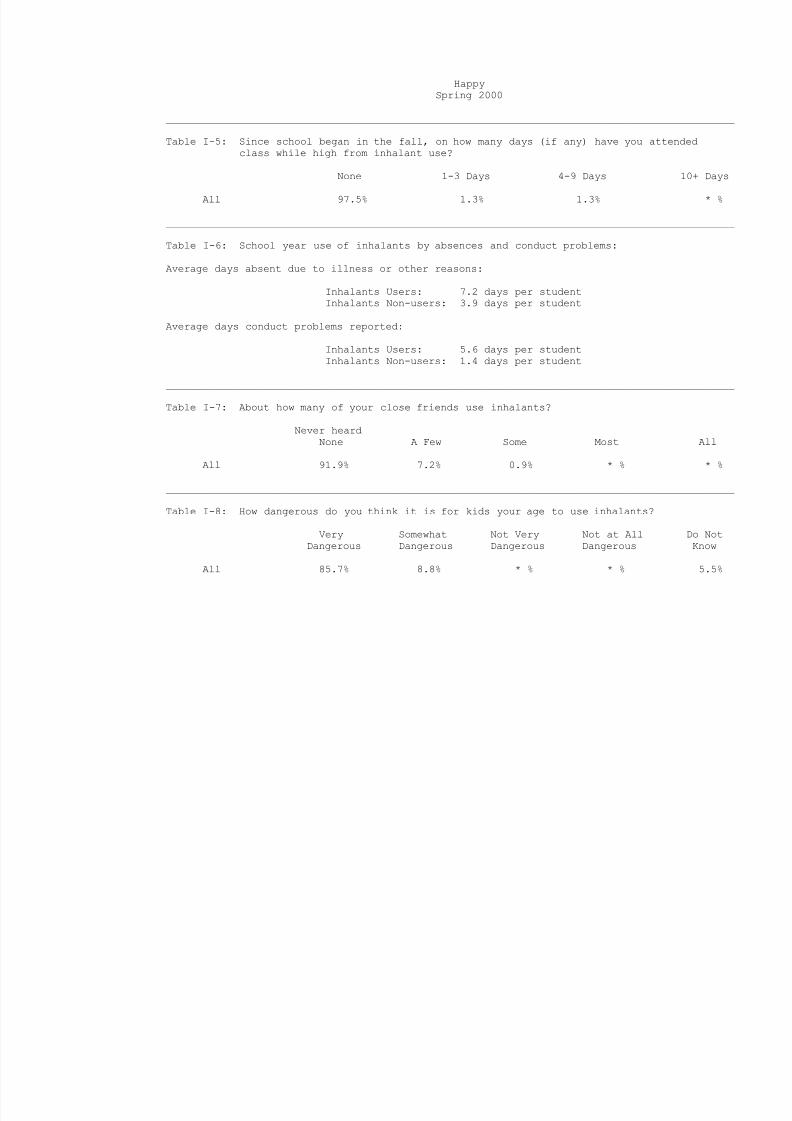
Table I-5: Since school began in the fall, on how many days (if any) have you attendedclass while high from inhalant use?
None 1-3 Days 4-9 Days 10+ Days
All 97.5% 1.3% 1.3% * %
______________________________________________________________________________________________
Table I-6: School year use of inhalants by absences and conduct problems:
Average days absent due to illness or other reasons:
Inhalants Users: 7.2 days per studentInhalants Non-users: 3.9 days per student
Average days conduct problems reported:
Inhalants Users: 5.6 days per studentInhalants Non-users: 1.4 days per student
______________________________________________________________________________________________
Table I-7: About how many of your close friends use inhalants?
Never heardNone A Few Some Most All
All 91.9% 7.2% 0.9% * % * %
______________________________________________________________________________________________
Table I-8: How dangerous do you think it is for kids your age to use inhalants?
Very Somewhat Not Very Not at All Do NotDangerous Dangerous Dangerous Dangerous Know
All 85.7% 8.8% * % * % 5.5%
8/14/2019 SWISHER COUNTY - Happy ISD - 2000 Texas School Survey of Drug and Alcohol Use
http://slidepdf.com/reader/full/swisher-county-happy-isd-2000-texas-school-survey-of-drug-and-alcohol-use 20/113
HappySpring 2000
______________________________________________________________________________________________
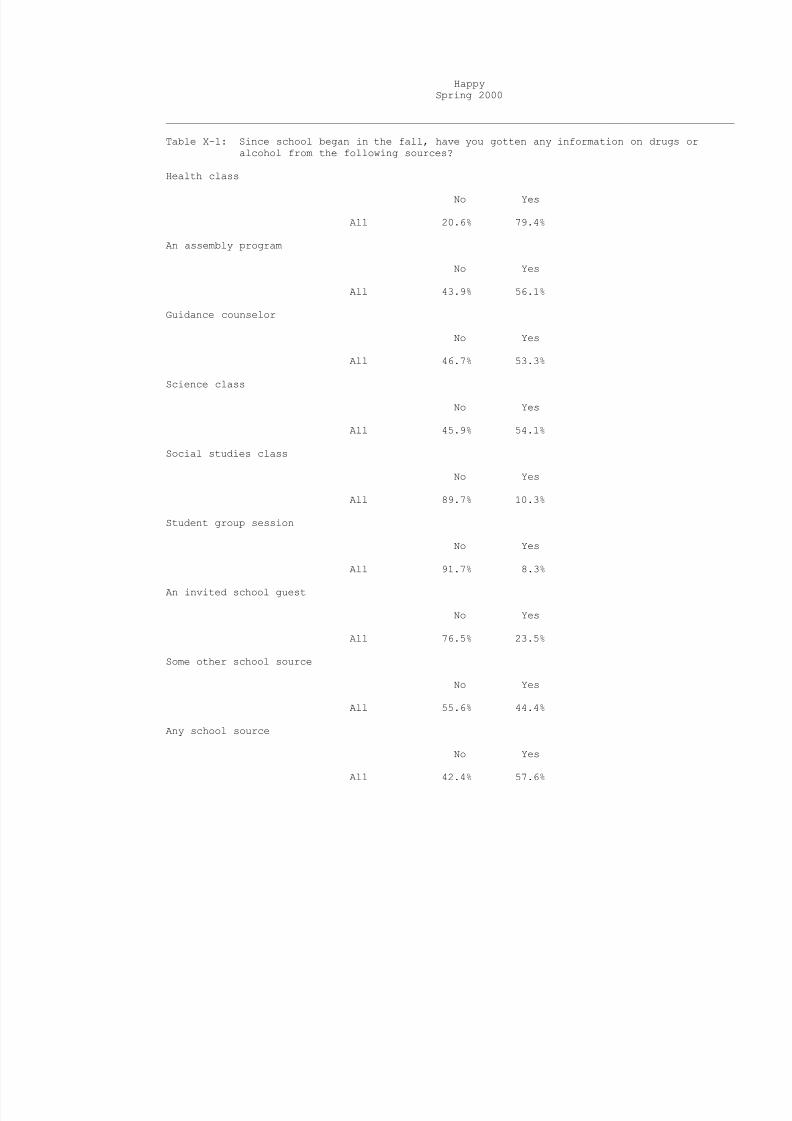
Table X-1: Since school began in the fall, have you gotten any information on drugs oralcohol from the following sources?
Health class
No Yes
All 20.6% 79.4%
An assembly program
No Yes
All 43.9% 56.1%
Guidance counselor
No Yes
All 46.7% 53.3%
Science class
No Yes
All 45.9% 54.1%
Social studies class
No Yes
All 89.7% 10.3%
Student group session
No Yes
All 91.7% 8.3%
An invited school guest
No Yes
All 76.5% 23.5%
Some other school source
No Yes
All 55.6% 44.4%
Any school source
No Yes
All 42.4% 57.6%
8/14/2019 SWISHER COUNTY - Happy ISD - 2000 Texas School Survey of Drug and Alcohol Use
http://slidepdf.com/reader/full/swisher-county-happy-isd-2000-texas-school-survey-of-drug-and-alcohol-use 21/113
HappySpring 2000
______________________________________________________________________________________________
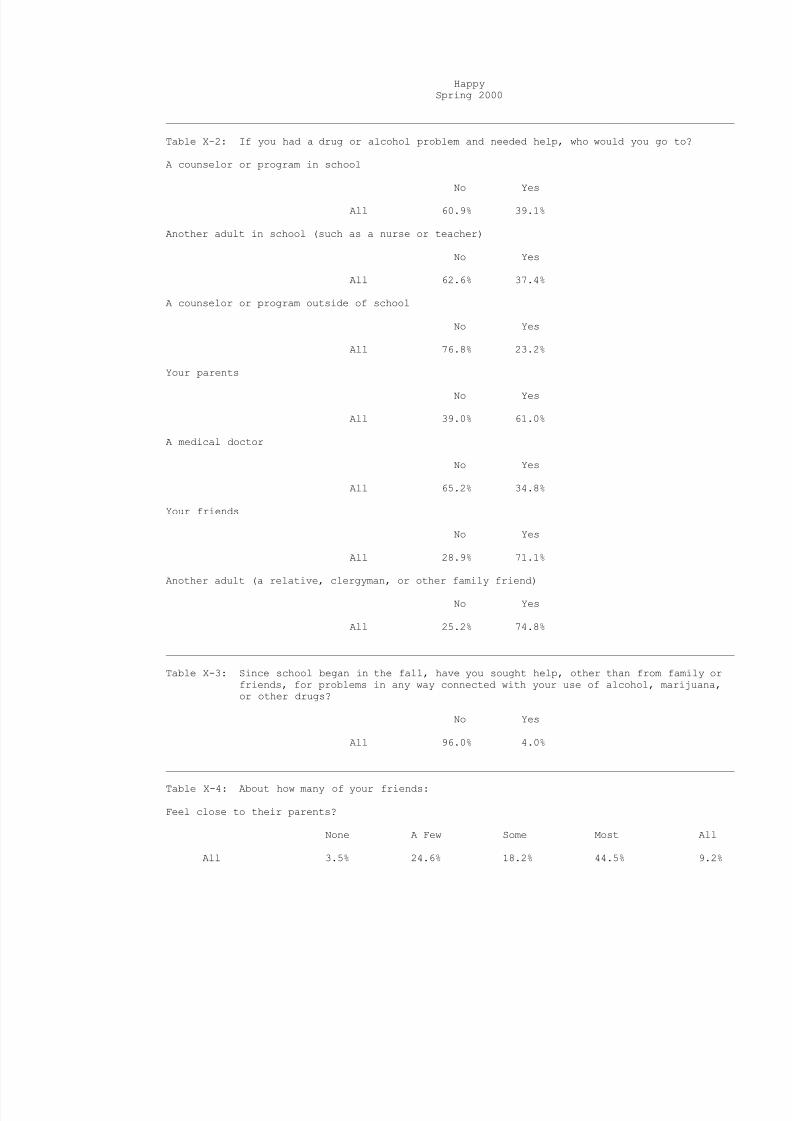
Table X-2: If you had a drug or alcohol problem and needed help, who would you go to?
A counselor or program in school
No Yes
All 60.9% 39.1%
Another adult in school (such as a nurse or teacher)
No Yes
All 62.6% 37.4%
A counselor or program outside of school
No Yes
All 76.8% 23.2%
Your parents
No Yes
All 39.0% 61.0%
A medical doctor
No Yes
All 65.2% 34.8%
Your friends
No Yes
All 28.9% 71.1%
Another adult (a relative, clergyman, or other family friend)No Yes
All 25.2% 74.8%
______________________________________________________________________________________________
Table X-3: Since school began in the fall, have you sought help, other than from family orfriends, for problems in any way connected with your use of alcohol, marijuana,or other drugs?
No Yes
All 96.0% 4.0%
______________________________________________________________________________________________
Table X-4: About how many of your friends:
Feel close to their parents?
None A Few Some Most All
All 3.5% 24.6% 18.2% 44.5% 9.2%
8/14/2019 SWISHER COUNTY - Happy ISD - 2000 Texas School Survey of Drug and Alcohol Use
http://slidepdf.com/reader/full/swisher-county-happy-isd-2000-texas-school-survey-of-drug-and-alcohol-use 22/113
HappySpring 2000
______________________________________________________________________________________________
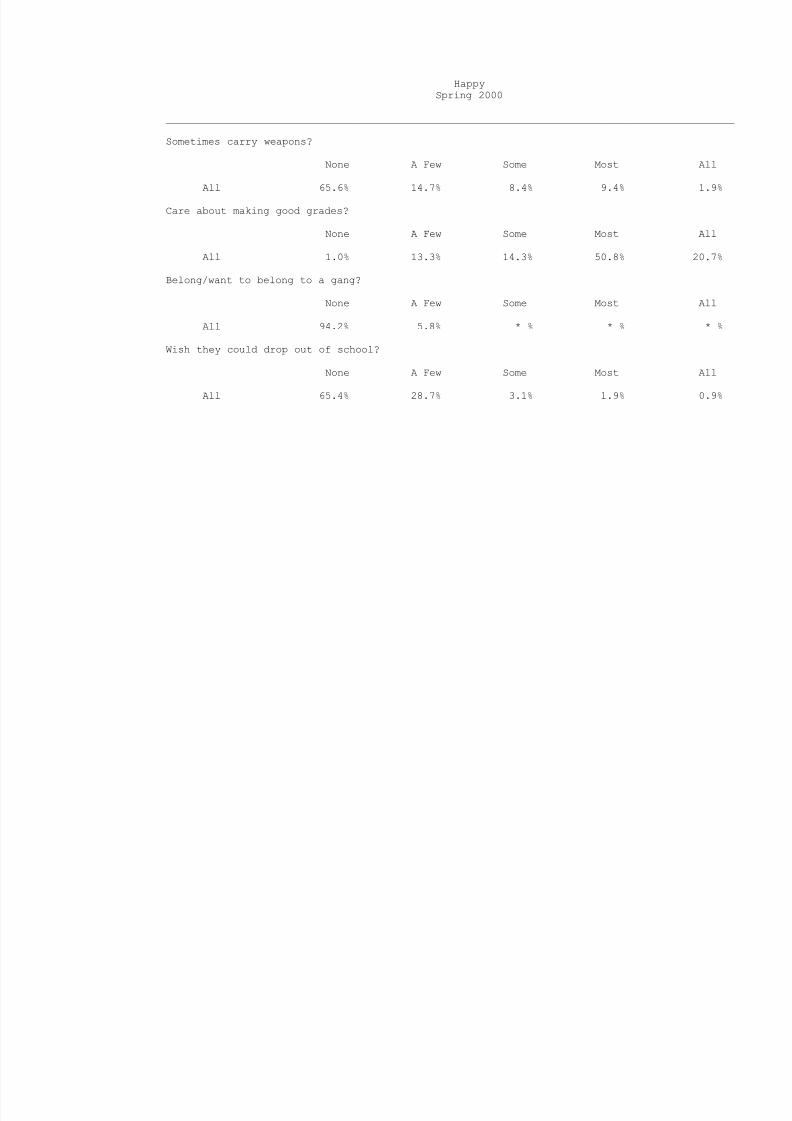
Sometimes carry weapons?
None A Few Some Most All
All 65.6% 14.7% 8.4% 9.4% 1.9%
Care about making good grades?
None A Few Some Most All
All 1.0% 13.3% 14.3% 50.8% 20.7%
Belong/want to belong to a gang?
None A Few Some Most All
All 94.2% 5.8% * % * % * %
Wish they could drop out of school?
None A Few Some Most All
All 65.4% 28.7% 3.1% 1.9% 0.9%

8/14/2019 SWISHER COUNTY - Happy ISD - 2000 Texas School Survey of Drug and Alcohol Use
http://slidepdf.com/reader/full/swisher-county-happy-isd-2000-texas-school-survey-of-drug-and-alcohol-use 23/113

8/14/2019 SWISHER COUNTY - Happy ISD - 2000 Texas School Survey of Drug and Alcohol Use
http://slidepdf.com/reader/full/swisher-county-happy-isd-2000-texas-school-survey-of-drug-and-alcohol-use 24/113
HappySpring 2000
Table B1: Prevalence and recency of use of selected substances by grade--> All students
Past School Ever NeverMonth Year Used Used
_____________________________________________________________________________________Tobacco All 33.6% 38.7% 55.6% 44.4%_____________________________________________________________________________________Alcohol All 36.4% 53.5% 67.3% 32.7%_____________________________________________________________________________________Inhalants All 3.1% 4.9% 5.8% 94.2%_____________________________________________________________________________________Any Illicit Drug All 7.8% 9.4% 16.0% 84.0%_____________________________________________________________________________________Marijuana All 4.4% 7.8% 16.1% 83.9%_____________________________________________________________________________________Marijuana Only All 2.0% 2.0% 6.1% 93.9%_____________________________________________________________________________________Cocaine or Crack All 1.2% 3.7% 5.4% 94.6%_____________________________________________________________________________________Cocaine All * % 3.7% 5.5% 94.5%_____________________________________________________________________________________Crack All 1.2% 1.2% 2.1% 97.9%_____________________________________________________________________________________Hallucinogens All * % 0.9% 2.9% 97.1%_____________________________________________________________________________________Uppers All 3.5% 5.1% 8.8% 91.2%_____________________________________________________________________________________Downers All 1.8% 1.8% 2.7% 97.3%_____________________________________________________________________________________Rohypnol All * % 1.7% 2.6% 97.4%_____________________________________________________________________________________Steroids All * % * % * % 100.0%_____________________________________________________________________________________Ecstasy All * % 0.9% 0.9% 99.1%_____________________________________________________________________________________Heroin All * % * % 0.9% 99.1%
Table B2: Prevalence and recency of use of selected substances by grade--> Male students
Past School Ever NeverMonth Year Used Used_____________________________________________________________________________________Tobacco All 39.6% 46.1% 61.9% 38.1%_____________________________________________________________________________________Alcohol All 39.8% 53.1% 62.0% 38.0%_____________________________________________________________________________________Inhalants All 6.1% 6.1% 6.1% 93.9%_____________________________________________________________________________________Any Illicit Drug All 5.7% 5.7% 12.0% 88.0%_____________________________________________________________________________________Marijuana All 2.3% 5.7% 12.0% 88.0%_____________________________________________________________________________________Marijuana Only All * % * % 6.3% 93.7%_____________________________________________________________________________________Cocaine or Crack All 2.3% 4.0% 5.7% 94.3%_____________________________________________________________________________________
Cocaine All * % 4.0% 5.7% 94.3%_____________________________________________________________________________________Crack All 2.3% 2.3% 4.1% 95.9%_____________________________________________________________________________________Hallucinogens All * % 1.7% 1.7% 98.3%_____________________________________________________________________________________Uppers All 3.5% 3.5% 3.5% 96.5%_____________________________________________________________________________________Downers All 3.5% 3.5% 3.5% 96.5%_____________________________________________________________________________________Rohypnol All * % * % 1.8% 98.2%_____________________________________________________________________________________Steroids All * % * % * % 100.0%_____________________________________________________________________________________Ecstasy All * % 1.7% 1.7% 98.3%

8/14/2019 SWISHER COUNTY - Happy ISD - 2000 Texas School Survey of Drug and Alcohol Use
http://slidepdf.com/reader/full/swisher-county-happy-isd-2000-texas-school-survey-of-drug-and-alcohol-use 25/113
_____________________________________________________________________________________Heroin All * % * % * % 100.0%
8/14/2019 SWISHER COUNTY - Happy ISD - 2000 Texas School Survey of Drug and Alcohol Use
http://slidepdf.com/reader/full/swisher-county-happy-isd-2000-texas-school-survey-of-drug-and-alcohol-use 26/113
HappySpring 2000
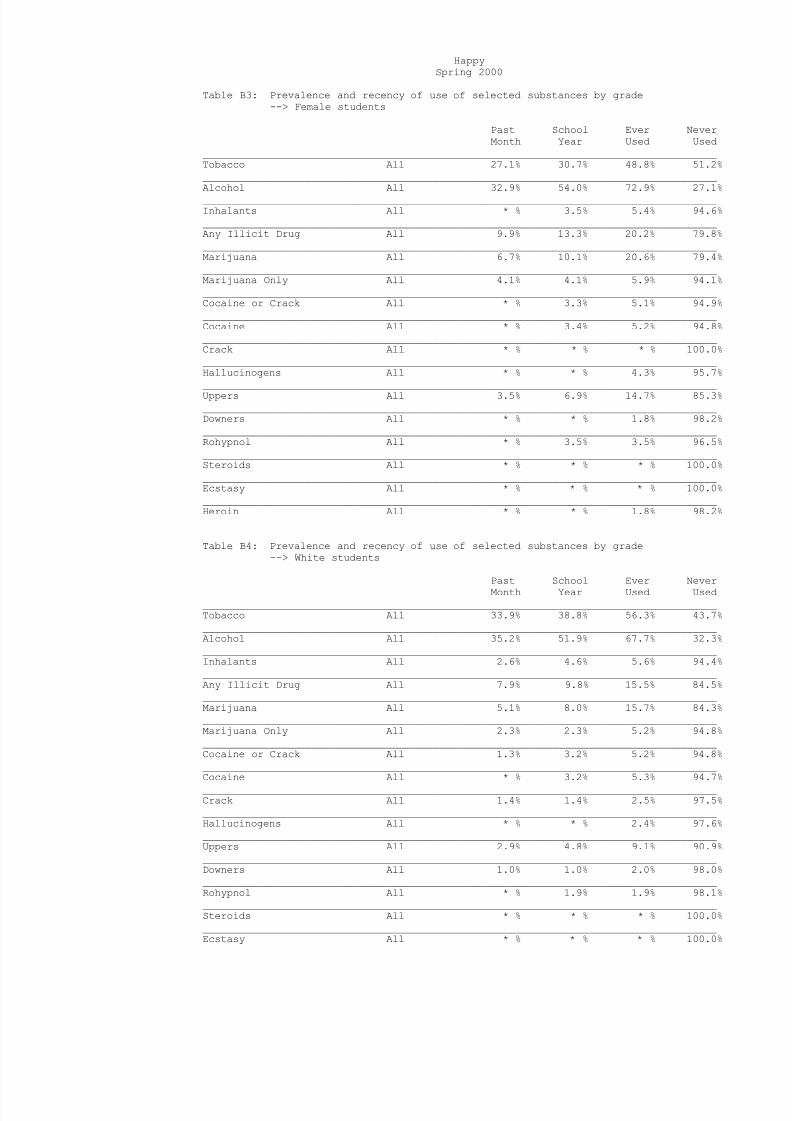
Table B3: Prevalence and recency of use of selected substances by grade--> Female students
Past School Ever NeverMonth Year Used Used
_____________________________________________________________________________________Tobacco All 27.1% 30.7% 48.8% 51.2%_____________________________________________________________________________________Alcohol All 32.9% 54.0% 72.9% 27.1%_____________________________________________________________________________________Inhalants All * % 3.5% 5.4% 94.6%_____________________________________________________________________________________Any Illicit Drug All 9.9% 13.3% 20.2% 79.8%_____________________________________________________________________________________Marijuana All 6.7% 10.1% 20.6% 79.4%_____________________________________________________________________________________Marijuana Only All 4.1% 4.1% 5.9% 94.1%_____________________________________________________________________________________Cocaine or Crack All * % 3.3% 5.1% 94.9%_____________________________________________________________________________________Cocaine All * % 3.4% 5.2% 94.8%_____________________________________________________________________________________Crack All * % * % * % 100.0%_____________________________________________________________________________________Hallucinogens All * % * % 4.3% 95.7%_____________________________________________________________________________________Uppers All 3.5% 6.9% 14.7% 85.3%_____________________________________________________________________________________Downers All * % * % 1.8% 98.2%_____________________________________________________________________________________Rohypnol All * % 3.5% 3.5% 96.5%_____________________________________________________________________________________Steroids All * % * % * % 100.0%_____________________________________________________________________________________Ecstasy All * % * % * % 100.0%_____________________________________________________________________________________Heroin All * % * % 1.8% 98.2%
Table B4: Prevalence and recency of use of selected substances by grade--> White students
Past School Ever NeverMonth Year Used Used_____________________________________________________________________________________Tobacco All 33.9% 38.8% 56.3% 43.7%_____________________________________________________________________________________Alcohol All 35.2% 51.9% 67.7% 32.3%_____________________________________________________________________________________Inhalants All 2.6% 4.6% 5.6% 94.4%_____________________________________________________________________________________Any Illicit Drug All 7.9% 9.8% 15.5% 84.5%_____________________________________________________________________________________Marijuana All 5.1% 8.0% 15.7% 84.3%_____________________________________________________________________________________Marijuana Only All 2.3% 2.3% 5.2% 94.8%_____________________________________________________________________________________Cocaine or Crack All 1.3% 3.2% 5.2% 94.8%_____________________________________________________________________________________
Cocaine All * % 3.2% 5.3% 94.7%_____________________________________________________________________________________Crack All 1.4% 1.4% 2.5% 97.5%_____________________________________________________________________________________Hallucinogens All * % * % 2.4% 97.6%_____________________________________________________________________________________Uppers All 2.9% 4.8% 9.1% 90.9%_____________________________________________________________________________________Downers All 1.0% 1.0% 2.0% 98.0%_____________________________________________________________________________________Rohypnol All * % 1.9% 1.9% 98.1%_____________________________________________________________________________________Steroids All * % * % * % 100.0%_____________________________________________________________________________________Ecstasy All * % * % * % 100.0%
8/14/2019 SWISHER COUNTY - Happy ISD - 2000 Texas School Survey of Drug and Alcohol Use
http://slidepdf.com/reader/full/swisher-county-happy-isd-2000-texas-school-survey-of-drug-and-alcohol-use 27/113
_____________________________________________________________________________________Heroin All * % * % 1.0% 99.0%
8/14/2019 SWISHER COUNTY - Happy ISD - 2000 Texas School Survey of Drug and Alcohol Use
http://slidepdf.com/reader/full/swisher-county-happy-isd-2000-texas-school-survey-of-drug-and-alcohol-use 28/113
HappySpring 2000
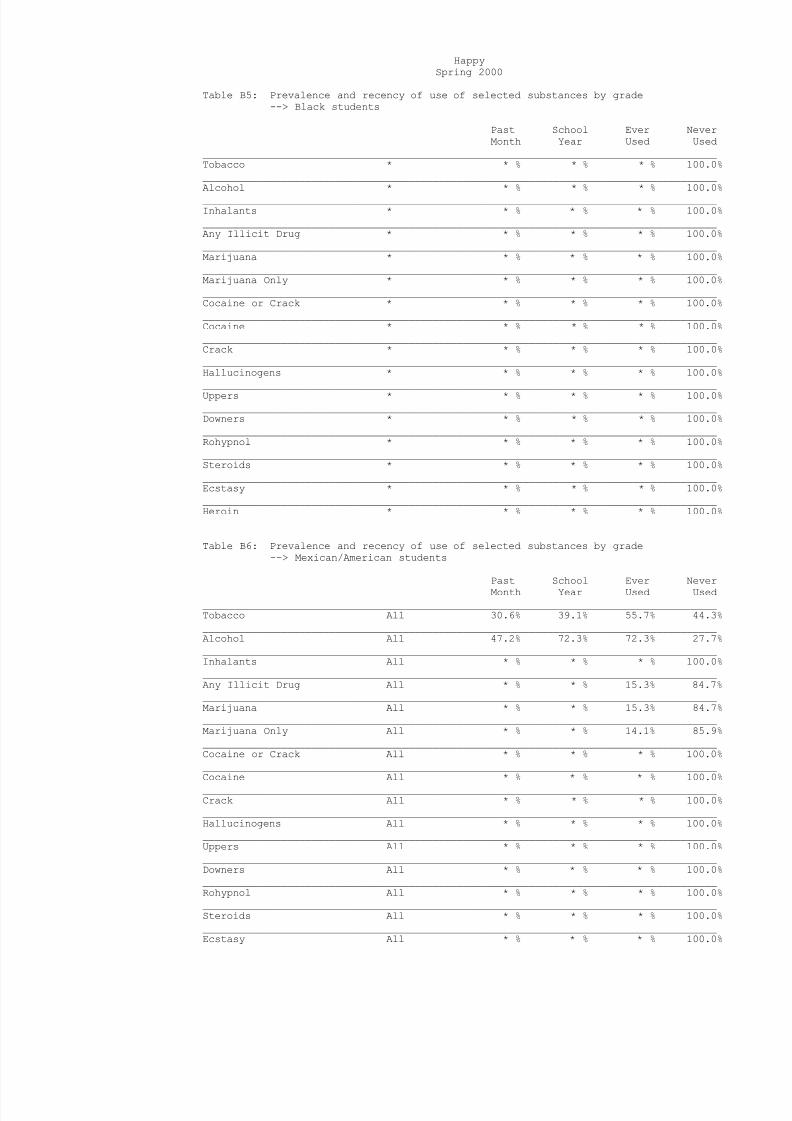
Table B5: Prevalence and recency of use of selected substances by grade--> Black students
Past School Ever NeverMonth Year Used Used
_____________________________________________________________________________________Tobacco * * % * % * % 100.0%_____________________________________________________________________________________Alcohol * * % * % * % 100.0%_____________________________________________________________________________________Inhalants * * % * % * % 100.0%_____________________________________________________________________________________Any Illicit Drug * * % * % * % 100.0%_____________________________________________________________________________________Marijuana * * % * % * % 100.0%_____________________________________________________________________________________Marijuana Only * * % * % * % 100.0%_____________________________________________________________________________________Cocaine or Crack * * % * % * % 100.0%_____________________________________________________________________________________Cocaine * * % * % * % 100.0%_____________________________________________________________________________________Crack * * % * % * % 100.0%_____________________________________________________________________________________Hallucinogens * * % * % * % 100.0%_____________________________________________________________________________________Uppers * * % * % * % 100.0%_____________________________________________________________________________________Downers * * % * % * % 100.0%_____________________________________________________________________________________Rohypnol * * % * % * % 100.0%_____________________________________________________________________________________Steroids * * % * % * % 100.0%_____________________________________________________________________________________Ecstasy * * % * % * % 100.0%_____________________________________________________________________________________Heroin * * % * % * % 100.0%
Table B6: Prevalence and recency of use of selected substances by grade--> Mexican/American students
Past School Ever NeverMonth Year Used Used_____________________________________________________________________________________Tobacco All 30.6% 39.1% 55.7% 44.3%_____________________________________________________________________________________Alcohol All 47.2% 72.3% 72.3% 27.7%_____________________________________________________________________________________Inhalants All * % * % * % 100.0%_____________________________________________________________________________________Any Illicit Drug All * % * % 15.3% 84.7%_____________________________________________________________________________________Marijuana All * % * % 15.3% 84.7%_____________________________________________________________________________________Marijuana Only All * % * % 14.1% 85.9%_____________________________________________________________________________________Cocaine or Crack All * % * % * % 100.0%_____________________________________________________________________________________
Cocaine All * % * % * % 100.0%_____________________________________________________________________________________Crack All * % * % * % 100.0%_____________________________________________________________________________________Hallucinogens All * % * % * % 100.0%_____________________________________________________________________________________Uppers All * % * % * % 100.0%_____________________________________________________________________________________Downers All * % * % * % 100.0%_____________________________________________________________________________________Rohypnol All * % * % * % 100.0%_____________________________________________________________________________________Steroids All * % * % * % 100.0%_____________________________________________________________________________________Ecstasy All * % * % * % 100.0%

8/14/2019 SWISHER COUNTY - Happy ISD - 2000 Texas School Survey of Drug and Alcohol Use
http://slidepdf.com/reader/full/swisher-county-happy-isd-2000-texas-school-survey-of-drug-and-alcohol-use 29/113
_____________________________________________________________________________________Heroin All * % * % * % 100.0%
8/14/2019 SWISHER COUNTY - Happy ISD - 2000 Texas School Survey of Drug and Alcohol Use
http://slidepdf.com/reader/full/swisher-county-happy-isd-2000-texas-school-survey-of-drug-and-alcohol-use 30/113
HappySpring 2000
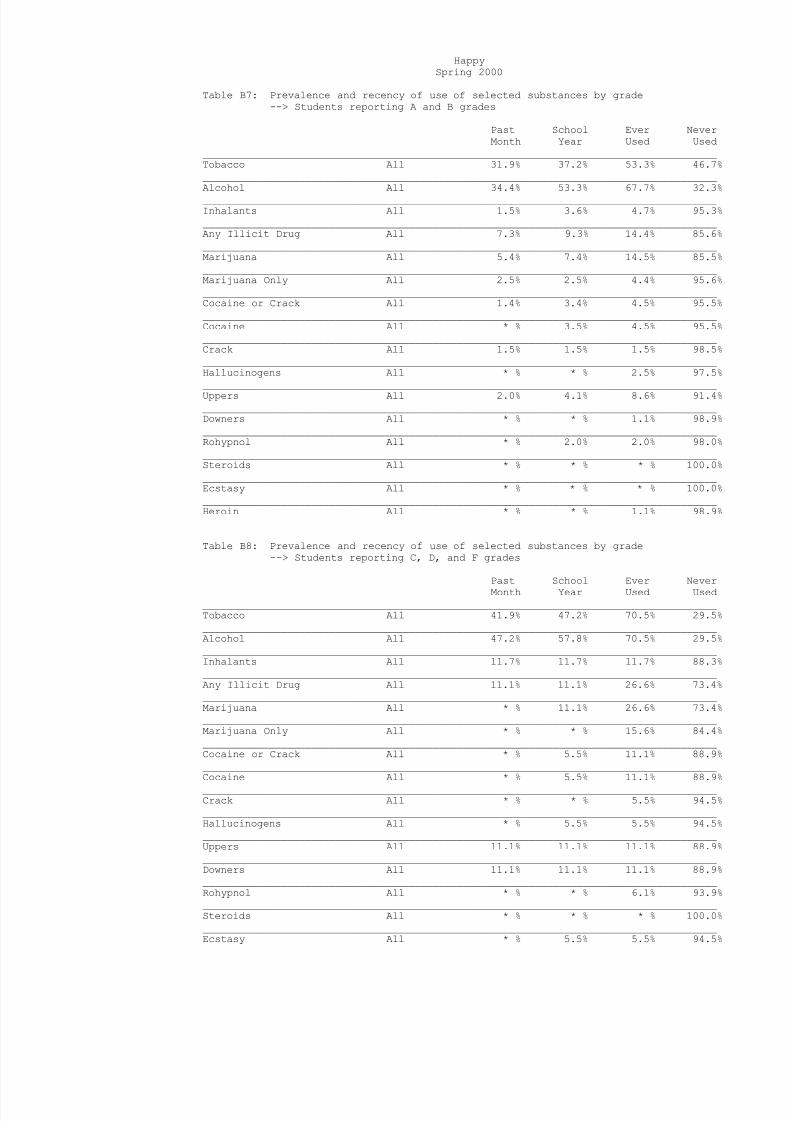
Table B7: Prevalence and recency of use of selected substances by grade--> Students reporting A and B grades
Past School Ever NeverMonth Year Used Used
_____________________________________________________________________________________Tobacco All 31.9% 37.2% 53.3% 46.7%_____________________________________________________________________________________Alcohol All 34.4% 53.3% 67.7% 32.3%_____________________________________________________________________________________Inhalants All 1.5% 3.6% 4.7% 95.3%_____________________________________________________________________________________Any Illicit Drug All 7.3% 9.3% 14.4% 85.6%_____________________________________________________________________________________Marijuana All 5.4% 7.4% 14.5% 85.5%_____________________________________________________________________________________Marijuana Only All 2.5% 2.5% 4.4% 95.6%_____________________________________________________________________________________Cocaine or Crack All 1.4% 3.4% 4.5% 95.5%_____________________________________________________________________________________Cocaine All * % 3.5% 4.5% 95.5%_____________________________________________________________________________________Crack All 1.5% 1.5% 1.5% 98.5%_____________________________________________________________________________________Hallucinogens All * % * % 2.5% 97.5%_____________________________________________________________________________________Uppers All 2.0% 4.1% 8.6% 91.4%_____________________________________________________________________________________Downers All * % * % 1.1% 98.9%_____________________________________________________________________________________Rohypnol All * % 2.0% 2.0% 98.0%_____________________________________________________________________________________Steroids All * % * % * % 100.0%_____________________________________________________________________________________Ecstasy All * % * % * % 100.0%_____________________________________________________________________________________Heroin All * % * % 1.1% 98.9%
Table B8: Prevalence and recency of use of selected substances by grade--> Students reporting C, D, and F grades
Past School Ever NeverMonth Year Used Used_____________________________________________________________________________________Tobacco All 41.9% 47.2% 70.5% 29.5%_____________________________________________________________________________________Alcohol All 47.2% 57.8% 70.5% 29.5%_____________________________________________________________________________________Inhalants All 11.7% 11.7% 11.7% 88.3%_____________________________________________________________________________________Any Illicit Drug All 11.1% 11.1% 26.6% 73.4%_____________________________________________________________________________________Marijuana All * % 11.1% 26.6% 73.4%_____________________________________________________________________________________Marijuana Only All * % * % 15.6% 84.4%_____________________________________________________________________________________Cocaine or Crack All * % 5.5% 11.1% 88.9%_____________________________________________________________________________________
Cocaine All * % 5.5% 11.1% 88.9%_____________________________________________________________________________________Crack All * % * % 5.5% 94.5%_____________________________________________________________________________________Hallucinogens All * % 5.5% 5.5% 94.5%_____________________________________________________________________________________Uppers All 11.1% 11.1% 11.1% 88.9%_____________________________________________________________________________________Downers All 11.1% 11.1% 11.1% 88.9%_____________________________________________________________________________________Rohypnol All * % * % 6.1% 93.9%_____________________________________________________________________________________Steroids All * % * % * % 100.0%_____________________________________________________________________________________Ecstasy All * % 5.5% 5.5% 94.5%

8/14/2019 SWISHER COUNTY - Happy ISD - 2000 Texas School Survey of Drug and Alcohol Use
http://slidepdf.com/reader/full/swisher-county-happy-isd-2000-texas-school-survey-of-drug-and-alcohol-use 31/113
_____________________________________________________________________________________Heroin All * % * % * % 100.0%
8/14/2019 SWISHER COUNTY - Happy ISD - 2000 Texas School Survey of Drug and Alcohol Use
http://slidepdf.com/reader/full/swisher-county-happy-isd-2000-texas-school-survey-of-drug-and-alcohol-use 32/113
HappySpring 2000
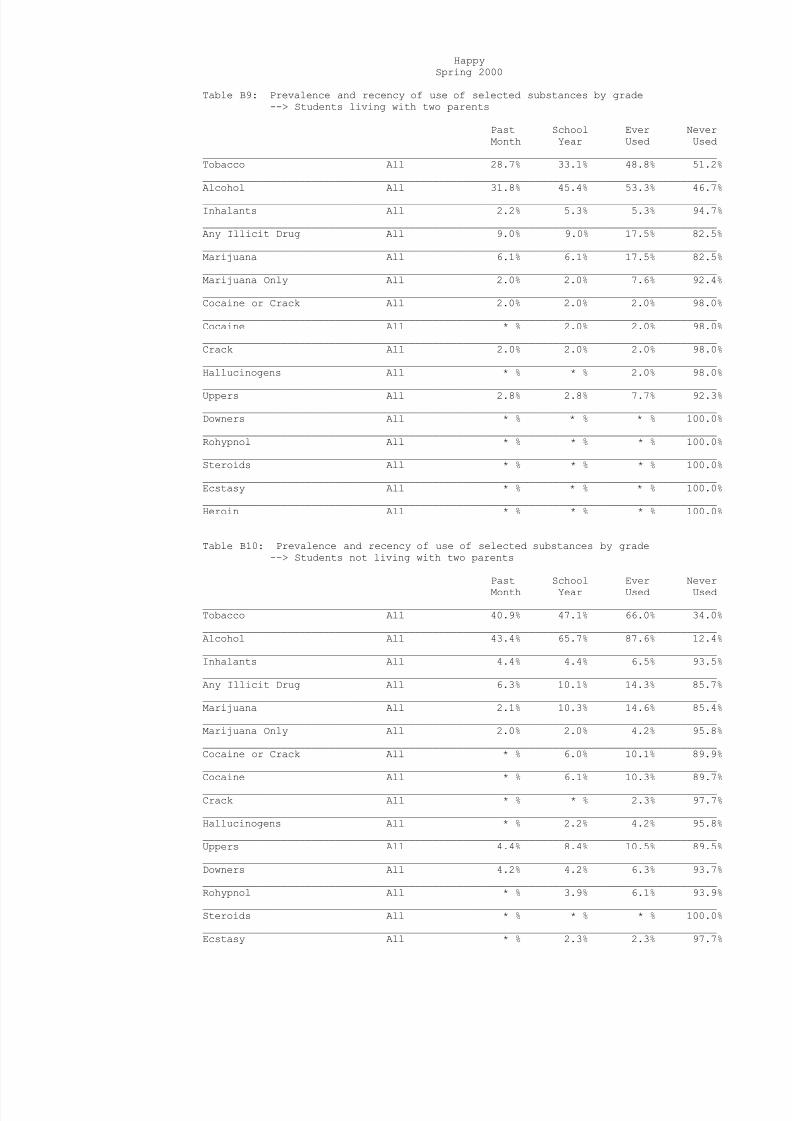
Table B9: Prevalence and recency of use of selected substances by grade--> Students living with two parents
Past School Ever NeverMonth Year Used Used
_____________________________________________________________________________________Tobacco All 28.7% 33.1% 48.8% 51.2%_____________________________________________________________________________________Alcohol All 31.8% 45.4% 53.3% 46.7%_____________________________________________________________________________________Inhalants All 2.2% 5.3% 5.3% 94.7%_____________________________________________________________________________________Any Illicit Drug All 9.0% 9.0% 17.5% 82.5%_____________________________________________________________________________________Marijuana All 6.1% 6.1% 17.5% 82.5%_____________________________________________________________________________________Marijuana Only All 2.0% 2.0% 7.6% 92.4%_____________________________________________________________________________________Cocaine or Crack All 2.0% 2.0% 2.0% 98.0%_____________________________________________________________________________________Cocaine All * % 2.0% 2.0% 98.0%_____________________________________________________________________________________Crack All 2.0% 2.0% 2.0% 98.0%_____________________________________________________________________________________Hallucinogens All * % * % 2.0% 98.0%_____________________________________________________________________________________Uppers All 2.8% 2.8% 7.7% 92.3%_____________________________________________________________________________________Downers All * % * % * % 100.0%_____________________________________________________________________________________Rohypnol All * % * % * % 100.0%_____________________________________________________________________________________Steroids All * % * % * % 100.0%_____________________________________________________________________________________Ecstasy All * % * % * % 100.0%_____________________________________________________________________________________Heroin All * % * % * % 100.0%
Table B10: Prevalence and recency of use of selected substances by grade--> Students not living with two parents
Past School Ever NeverMonth Year Used Used_____________________________________________________________________________________Tobacco All 40.9% 47.1% 66.0% 34.0%_____________________________________________________________________________________Alcohol All 43.4% 65.7% 87.6% 12.4%_____________________________________________________________________________________Inhalants All 4.4% 4.4% 6.5% 93.5%_____________________________________________________________________________________Any Illicit Drug All 6.3% 10.1% 14.3% 85.7%_____________________________________________________________________________________Marijuana All 2.1% 10.3% 14.6% 85.4%_____________________________________________________________________________________Marijuana Only All 2.0% 2.0% 4.2% 95.8%_____________________________________________________________________________________Cocaine or Crack All * % 6.0% 10.1% 89.9%_____________________________________________________________________________________
Cocaine All * % 6.1% 10.3% 89.7%_____________________________________________________________________________________Crack All * % * % 2.3% 97.7%_____________________________________________________________________________________Hallucinogens All * % 2.2% 4.2% 95.8%_____________________________________________________________________________________Uppers All 4.4% 8.4% 10.5% 89.5%_____________________________________________________________________________________Downers All 4.2% 4.2% 6.3% 93.7%_____________________________________________________________________________________Rohypnol All * % 3.9% 6.1% 93.9%_____________________________________________________________________________________Steroids All * % * % * % 100.0%_____________________________________________________________________________________Ecstasy All * % 2.3% 2.3% 97.7%

8/14/2019 SWISHER COUNTY - Happy ISD - 2000 Texas School Survey of Drug and Alcohol Use
http://slidepdf.com/reader/full/swisher-county-happy-isd-2000-texas-school-survey-of-drug-and-alcohol-use 33/113
_____________________________________________________________________________________Heroin All * % * % 2.1% 97.9%
8/14/2019 SWISHER COUNTY - Happy ISD - 2000 Texas School Survey of Drug and Alcohol Use
http://slidepdf.com/reader/full/swisher-county-happy-isd-2000-texas-school-survey-of-drug-and-alcohol-use 34/113
HappySpring 2000
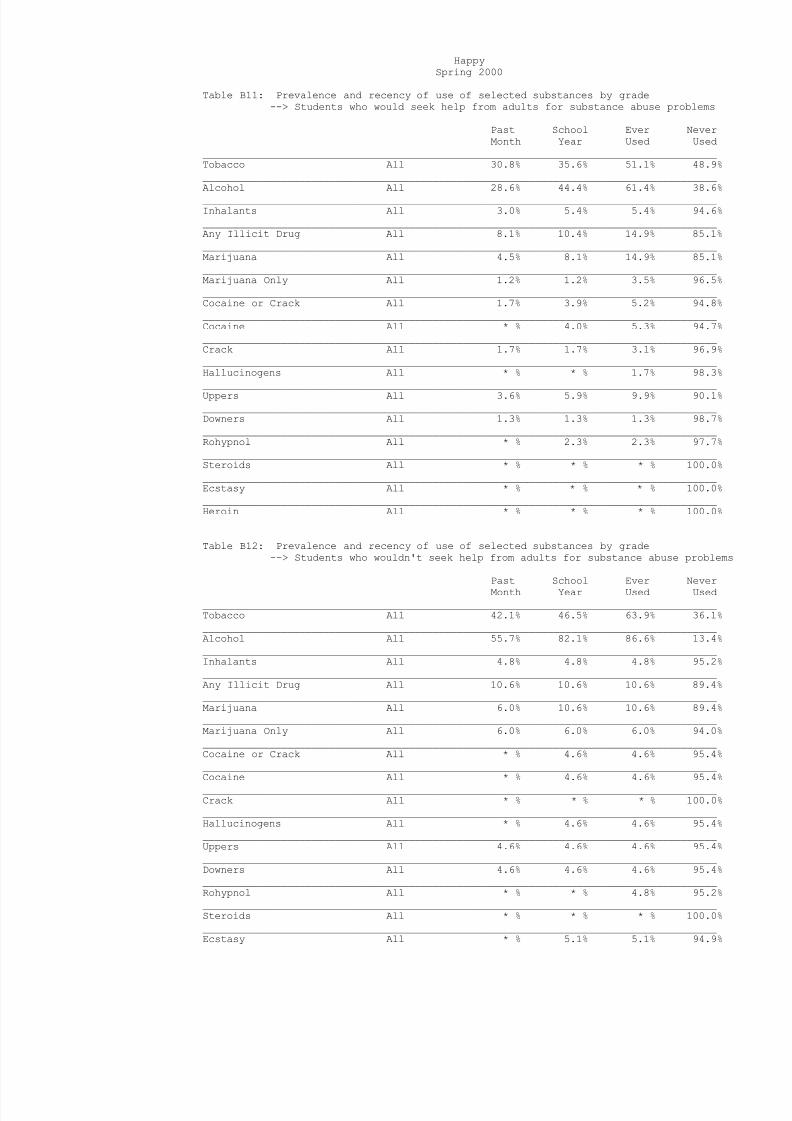
Table B11: Prevalence and recency of use of selected substances by grade--> Students who would seek help from adults for substance abuse problems
Past School Ever NeverMonth Year Used Used
_____________________________________________________________________________________Tobacco All 30.8% 35.6% 51.1% 48.9%_____________________________________________________________________________________Alcohol All 28.6% 44.4% 61.4% 38.6%_____________________________________________________________________________________Inhalants All 3.0% 5.4% 5.4% 94.6%_____________________________________________________________________________________Any Illicit Drug All 8.1% 10.4% 14.9% 85.1%_____________________________________________________________________________________Marijuana All 4.5% 8.1% 14.9% 85.1%_____________________________________________________________________________________Marijuana Only All 1.2% 1.2% 3.5% 96.5%_____________________________________________________________________________________Cocaine or Crack All 1.7% 3.9% 5.2% 94.8%_____________________________________________________________________________________Cocaine All * % 4.0% 5.3% 94.7%_____________________________________________________________________________________Crack All 1.7% 1.7% 3.1% 96.9%_____________________________________________________________________________________Hallucinogens All * % * % 1.7% 98.3%_____________________________________________________________________________________Uppers All 3.6% 5.9% 9.9% 90.1%_____________________________________________________________________________________Downers All 1.3% 1.3% 1.3% 98.7%_____________________________________________________________________________________Rohypnol All * % 2.3% 2.3% 97.7%_____________________________________________________________________________________Steroids All * % * % * % 100.0%_____________________________________________________________________________________Ecstasy All * % * % * % 100.0%_____________________________________________________________________________________Heroin All * % * % * % 100.0%
Table B12: Prevalence and recency of use of selected substances by grade--> Students who wouldn't seek help from adults for substance abuse problems
Past School Ever NeverMonth Year Used Used_____________________________________________________________________________________Tobacco All 42.1% 46.5% 63.9% 36.1%_____________________________________________________________________________________Alcohol All 55.7% 82.1% 86.6% 13.4%_____________________________________________________________________________________Inhalants All 4.8% 4.8% 4.8% 95.2%_____________________________________________________________________________________Any Illicit Drug All 10.6% 10.6% 10.6% 89.4%_____________________________________________________________________________________Marijuana All 6.0% 10.6% 10.6% 89.4%_____________________________________________________________________________________Marijuana Only All 6.0% 6.0% 6.0% 94.0%_____________________________________________________________________________________Cocaine or Crack All * % 4.6% 4.6% 95.4%_____________________________________________________________________________________
Cocaine All * % 4.6% 4.6% 95.4%_____________________________________________________________________________________Crack All * % * % * % 100.0%_____________________________________________________________________________________Hallucinogens All * % 4.6% 4.6% 95.4%_____________________________________________________________________________________Uppers All 4.6% 4.6% 4.6% 95.4%_____________________________________________________________________________________Downers All 4.6% 4.6% 4.6% 95.4%_____________________________________________________________________________________Rohypnol All * % * % 4.8% 95.2%_____________________________________________________________________________________Steroids All * % * % * % 100.0%_____________________________________________________________________________________Ecstasy All * % 5.1% 5.1% 94.9%
8/14/2019 SWISHER COUNTY - Happy ISD - 2000 Texas School Survey of Drug and Alcohol Use
http://slidepdf.com/reader/full/swisher-county-happy-isd-2000-texas-school-survey-of-drug-and-alcohol-use 35/113
_____________________________________________________________________________________Heroin All * % * % * % 100.0%
8/14/2019 SWISHER COUNTY - Happy ISD - 2000 Texas School Survey of Drug and Alcohol Use
http://slidepdf.com/reader/full/swisher-county-happy-isd-2000-texas-school-survey-of-drug-and-alcohol-use 36/113
HappySpring 2000
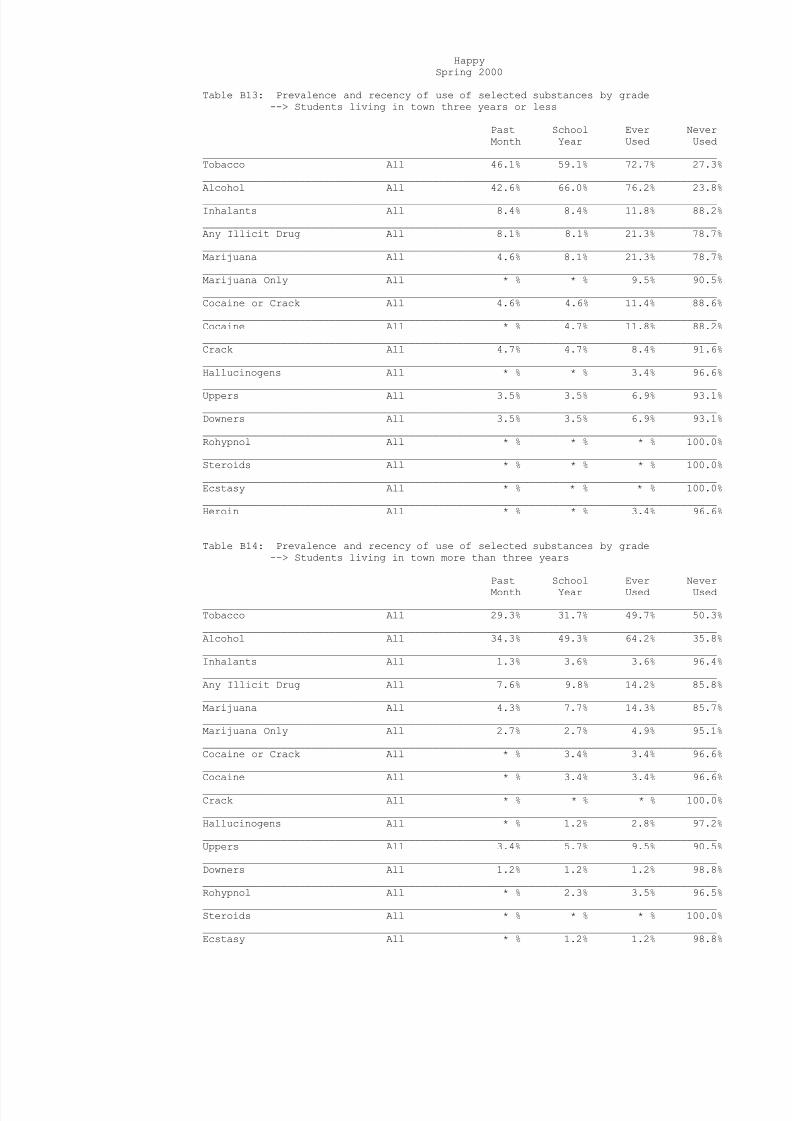
Table B13: Prevalence and recency of use of selected substances by grade--> Students living in town three years or less
Past School Ever NeverMonth Year Used Used
_____________________________________________________________________________________Tobacco All 46.1% 59.1% 72.7% 27.3%_____________________________________________________________________________________Alcohol All 42.6% 66.0% 76.2% 23.8%_____________________________________________________________________________________Inhalants All 8.4% 8.4% 11.8% 88.2%_____________________________________________________________________________________Any Illicit Drug All 8.1% 8.1% 21.3% 78.7%_____________________________________________________________________________________Marijuana All 4.6% 8.1% 21.3% 78.7%_____________________________________________________________________________________Marijuana Only All * % * % 9.5% 90.5%_____________________________________________________________________________________Cocaine or Crack All 4.6% 4.6% 11.4% 88.6%_____________________________________________________________________________________Cocaine All * % 4.7% 11.8% 88.2%_____________________________________________________________________________________Crack All 4.7% 4.7% 8.4% 91.6%_____________________________________________________________________________________Hallucinogens All * % * % 3.4% 96.6%_____________________________________________________________________________________Uppers All 3.5% 3.5% 6.9% 93.1%_____________________________________________________________________________________Downers All 3.5% 3.5% 6.9% 93.1%_____________________________________________________________________________________Rohypnol All * % * % * % 100.0%_____________________________________________________________________________________Steroids All * % * % * % 100.0%_____________________________________________________________________________________Ecstasy All * % * % * % 100.0%_____________________________________________________________________________________Heroin All * % * % 3.4% 96.6%
Table B14: Prevalence and recency of use of selected substances by grade--> Students living in town more than three years
Past School Ever NeverMonth Year Used Used_____________________________________________________________________________________Tobacco All 29.3% 31.7% 49.7% 50.3%_____________________________________________________________________________________Alcohol All 34.3% 49.3% 64.2% 35.8%_____________________________________________________________________________________Inhalants All 1.3% 3.6% 3.6% 96.4%_____________________________________________________________________________________Any Illicit Drug All 7.6% 9.8% 14.2% 85.8%_____________________________________________________________________________________Marijuana All 4.3% 7.7% 14.3% 85.7%_____________________________________________________________________________________Marijuana Only All 2.7% 2.7% 4.9% 95.1%_____________________________________________________________________________________Cocaine or Crack All * % 3.4% 3.4% 96.6%_____________________________________________________________________________________
Cocaine All * % 3.4% 3.4% 96.6%_____________________________________________________________________________________Crack All * % * % * % 100.0%_____________________________________________________________________________________Hallucinogens All * % 1.2% 2.8% 97.2%_____________________________________________________________________________________Uppers All 3.4% 5.7% 9.5% 90.5%_____________________________________________________________________________________Downers All 1.2% 1.2% 1.2% 98.8%_____________________________________________________________________________________Rohypnol All * % 2.3% 3.5% 96.5%_____________________________________________________________________________________Steroids All * % * % * % 100.0%_____________________________________________________________________________________Ecstasy All * % 1.2% 1.2% 98.8%

8/14/2019 SWISHER COUNTY - Happy ISD - 2000 Texas School Survey of Drug and Alcohol Use
http://slidepdf.com/reader/full/swisher-county-happy-isd-2000-texas-school-survey-of-drug-and-alcohol-use 37/113
_____________________________________________________________________________________Heroin All * % * % * % 100.0%
8/14/2019 SWISHER COUNTY - Happy ISD - 2000 Texas School Survey of Drug and Alcohol Use
http://slidepdf.com/reader/full/swisher-county-happy-isd-2000-texas-school-survey-of-drug-and-alcohol-use 38/113
HappySpring 2000
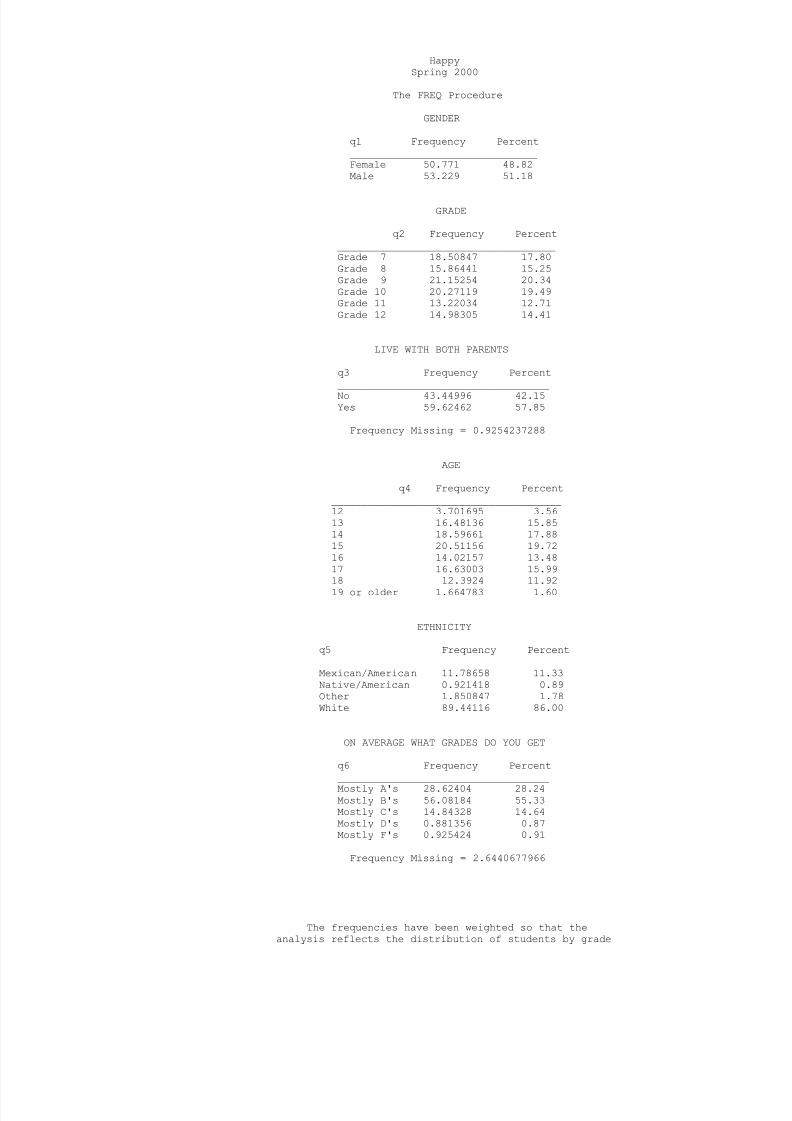
The FREQ Procedure
GENDER
q1 Frequency Percent_______________________________Female 50.771 48.82Male 53.229 51.18
GRADE
q2 Frequency Percent____________________________________Grade 7 18.50847 17.80Grade 8 15.86441 15.25Grade 9 21.15254 20.34Grade 10 20.27119 19.49Grade 11 13.22034 12.71Grade 12 14.98305 14.41
LIVE WITH BOTH PARENTS
q3 Frequency Percent___________________________________No 43.44996 42.15Yes 59.62462 57.85
Frequency Missing = 0.9254237288
AGE
q4 Frequency Percent______________________________________12 3.701695 3.5613 16.48136 15.8514 18.59661 17.8815 20.51156 19.7216 14.02157 13.4817 16.63003 15.99
18 12.3924 11.9219 or older 1.664783 1.60
ETHNICITY
q5 Frequency Percent_________________________________________Mexican/American 11.78658 11.33Native/American 0.921418 0.89Other 1.850847 1.78White 89.44116 86.00
ON AVERAGE WHAT GRADES DO YOU GET
q6 Frequency Percent
___________________________________Mostly A's 28.62404 28.24Mostly B's 56.08184 55.33Mostly C's 14.84328 14.64Mostly D's 0.881356 0.87Mostly F's 0.925424 0.91
Frequency Missing = 2.6440677966
The frequencies have been weighted so that theanalysis reflects the distribution of students by grade

8/14/2019 SWISHER COUNTY - Happy ISD - 2000 Texas School Survey of Drug and Alcohol Use
http://slidepdf.com/reader/full/swisher-county-happy-isd-2000-texas-school-survey-of-drug-and-alcohol-use 39/113
8/14/2019 SWISHER COUNTY - Happy ISD - 2000 Texas School Survey of Drug and Alcohol Use
http://slidepdf.com/reader/full/swisher-county-happy-isd-2000-texas-school-survey-of-drug-and-alcohol-use 40/113
HappySpring 2000
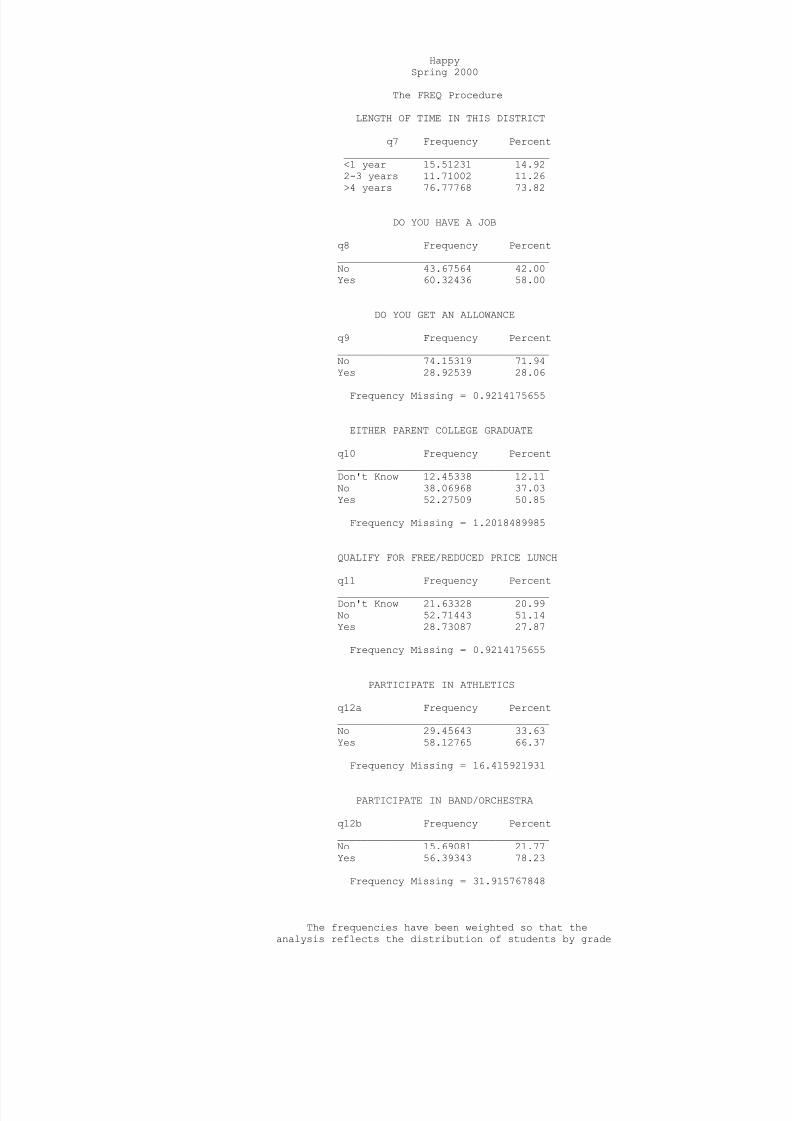
The FREQ Procedure
LENGTH OF TIME IN THIS DISTRICT
q7 Frequency Percent__________________________________<1 year 15.51231 14.922-3 years 11.71002 11.26>4 years 76.77768 73.82
DO YOU HAVE A JOB
q8 Frequency Percent___________________________________No 43.67564 42.00Yes 60.32436 58.00
DO YOU GET AN ALLOWANCE
q9 Frequency Percent___________________________________No 74.15319 71.94Yes 28.92539 28.06
Frequency Missing = 0.9214175655
EITHER PARENT COLLEGE GRADUATE
q10 Frequency Percent___________________________________Don't Know 12.45338 12.11No 38.06968 37.03Yes 52.27509 50.85
Frequency Missing = 1.2018489985
QUALIFY FOR FREE/REDUCED PRICE LUNCH
q11 Frequency Percent___________________________________Don't Know 21.63328 20.99No 52.71443 51.14Yes 28.73087 27.87
Frequency Missing = 0.9214175655
PARTICIPATE IN ATHLETICS
q12a Frequency Percent___________________________________No 29.45643 33.63Yes 58.12765 66.37
Frequency Missing = 16.415921931
PARTICIPATE IN BAND/ORCHESTRA
q12b Frequency Percent___________________________________No 15.69081 21.77Yes 56.39343 78.23
Frequency Missing = 31.915767848
The frequencies have been weighted so that theanalysis reflects the distribution of students by grade

8/14/2019 SWISHER COUNTY - Happy ISD - 2000 Texas School Survey of Drug and Alcohol Use
http://slidepdf.com/reader/full/swisher-county-happy-isd-2000-texas-school-survey-of-drug-and-alcohol-use 41/113
level in the district
8/14/2019 SWISHER COUNTY - Happy ISD - 2000 Texas School Survey of Drug and Alcohol Use
http://slidepdf.com/reader/full/swisher-county-happy-isd-2000-texas-school-survey-of-drug-and-alcohol-use 42/113
HappySpring 2000
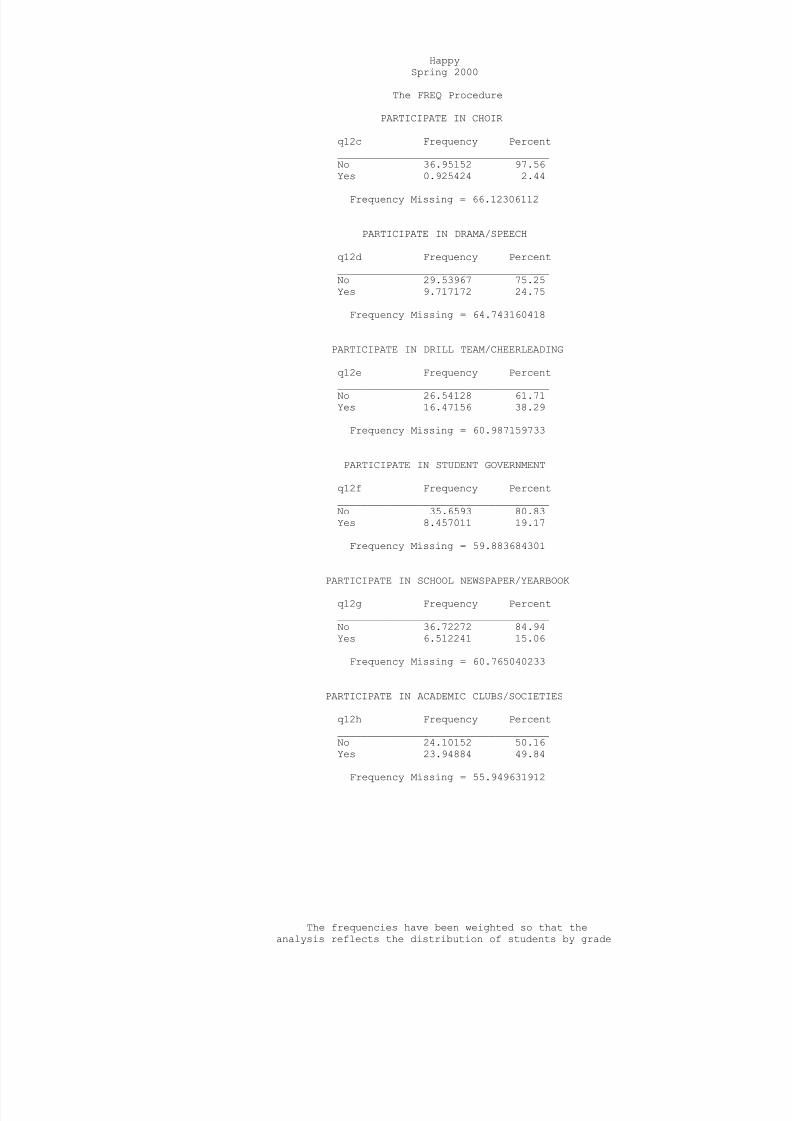
The FREQ Procedure
PARTICIPATE IN CHOIR
q12c Frequency Percent___________________________________No 36.95152 97.56Yes 0.925424 2.44
Frequency Missing = 66.12306112
PARTICIPATE IN DRAMA/SPEECH
q12d Frequency Percent___________________________________No 29.53967 75.25Yes 9.717172 24.75
Frequency Missing = 64.743160418
PARTICIPATE IN DRILL TEAM/CHEERLEADING
q12e Frequency Percent___________________________________No 26.54128 61.71Yes 16.47156 38.29
Frequency Missing = 60.987159733
PARTICIPATE IN STUDENT GOVERNMENT
q12f Frequency Percent___________________________________No 35.6593 80.83Yes 8.457011 19.17
Frequency Missing = 59.883684301
PARTICIPATE IN SCHOOL NEWSPAPER/YEARBOOK q12g Frequency Percent___________________________________No 36.72272 84.94Yes 6.512241 15.06
Frequency Missing = 60.765040233
PARTICIPATE IN ACADEMIC CLUBS/SOCIETIES
q12h Frequency Percent___________________________________No 24.10152 50.16Yes 23.94884 49.84
Frequency Missing = 55.949631912
The frequencies have been weighted so that theanalysis reflects the distribution of students by grade

8/14/2019 SWISHER COUNTY - Happy ISD - 2000 Texas School Survey of Drug and Alcohol Use
http://slidepdf.com/reader/full/swisher-county-happy-isd-2000-texas-school-survey-of-drug-and-alcohol-use 43/113
level in the district
8/14/2019 SWISHER COUNTY - Happy ISD - 2000 Texas School Survey of Drug and Alcohol Use
http://slidepdf.com/reader/full/swisher-county-happy-isd-2000-texas-school-survey-of-drug-and-alcohol-use 44/113
HappySpring 2000
The FREQ Procedure
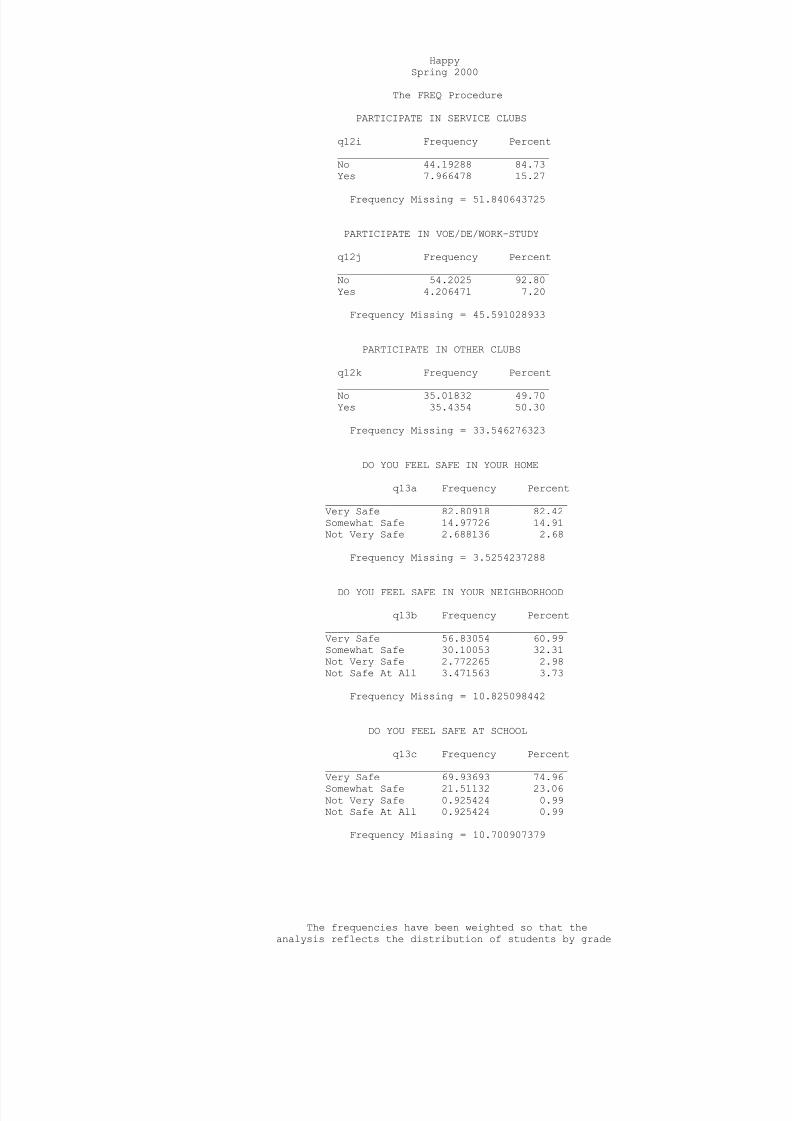
PARTICIPATE IN SERVICE CLUBS
q12i Frequency Percent___________________________________No 44.19288 84.73Yes 7.966478 15.27
Frequency Missing = 51.840643725
PARTICIPATE IN VOE/DE/WORK-STUDY
q12j Frequency Percent___________________________________No 54.2025 92.80Yes 4.206471 7.20
Frequency Missing = 45.591028933
PARTICIPATE IN OTHER CLUBS
q12k Frequency Percent___________________________________No 35.01832 49.70Yes 35.4354 50.30
Frequency Missing = 33.546276323
DO YOU FEEL SAFE IN YOUR HOME
q13a Frequency Percent________________________________________Very Safe 82.80918 82.42Somewhat Safe 14.97726 14.91Not Very Safe 2.688136 2.68
Frequency Missing = 3.5254237288
DO YOU FEEL SAFE IN YOUR NEIGHBORHOOD
q13b Frequency Percent________________________________________Very Safe 56.83054 60.99Somewhat Safe 30.10053 32.31Not Very Safe 2.772265 2.98Not Safe At All 3.471563 3.73
Frequency Missing = 10.825098442
DO YOU FEEL SAFE AT SCHOOL
q13c Frequency Percent________________________________________
Very Safe 69.93693 74.96Somewhat Safe 21.51132 23.06Not Very Safe 0.925424 0.99Not Safe At All 0.925424 0.99
Frequency Missing = 10.700907379
The frequencies have been weighted so that theanalysis reflects the distribution of students by grade

8/14/2019 SWISHER COUNTY - Happy ISD - 2000 Texas School Survey of Drug and Alcohol Use
http://slidepdf.com/reader/full/swisher-county-happy-isd-2000-texas-school-survey-of-drug-and-alcohol-use 45/113
level in the district
8/14/2019 SWISHER COUNTY - Happy ISD - 2000 Texas School Survey of Drug and Alcohol Use
http://slidepdf.com/reader/full/swisher-county-happy-isd-2000-texas-school-survey-of-drug-and-alcohol-use 46/113
HappySpring 2000
The FREQ Procedure
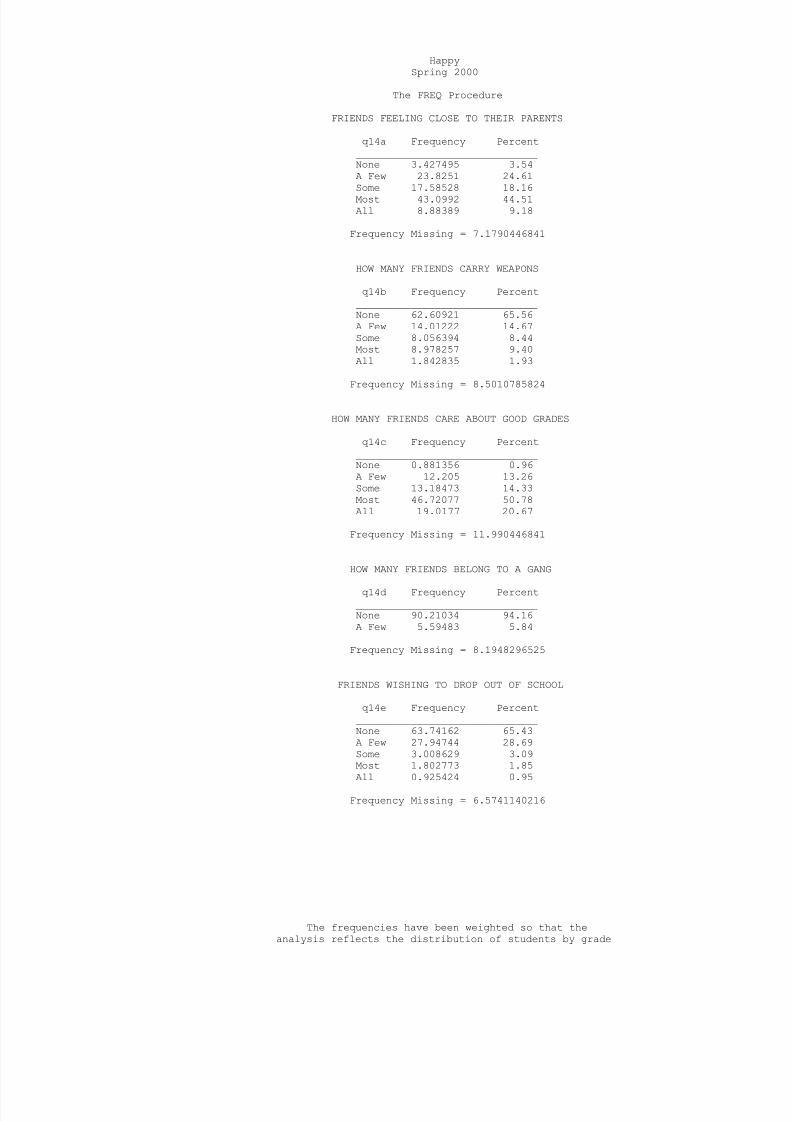
FRIENDS FEELING CLOSE TO THEIR PARENTS
q14a Frequency Percent______________________________None 3.427495 3.54A Few 23.8251 24.61Some 17.58528 18.16Most 43.0992 44.51All 8.88389 9.18
Frequency Missing = 7.1790446841
HOW MANY FRIENDS CARRY WEAPONS
q14b Frequency Percent______________________________None 62.60921 65.56A Few 14.01222 14.67Some 8.056394 8.44Most 8.978257 9.40All 1.842835 1.93
Frequency Missing = 8.5010785824
HOW MANY FRIENDS CARE ABOUT GOOD GRADES
q14c Frequency Percent______________________________None 0.881356 0.96A Few 12.205 13.26Some 13.18473 14.33Most 46.72077 50.78All 19.0177 20.67
Frequency Missing = 11.990446841
HOW MANY FRIENDS BELONG TO A GANG
q14d Frequency Percent______________________________None 90.21034 94.16A Few 5.59483 5.84
Frequency Missing = 8.1948296525
FRIENDS WISHING TO DROP OUT OF SCHOOL
q14e Frequency Percent______________________________None 63.74162 65.43A Few 27.94744 28.69Some 3.008629 3.09Most 1.802773 1.85
All 0.925424 0.95
Frequency Missing = 6.5741140216
The frequencies have been weighted so that theanalysis reflects the distribution of students by grade

8/14/2019 SWISHER COUNTY - Happy ISD - 2000 Texas School Survey of Drug and Alcohol Use
http://slidepdf.com/reader/full/swisher-county-happy-isd-2000-texas-school-survey-of-drug-and-alcohol-use 47/113
level in the district
8/14/2019 SWISHER COUNTY - Happy ISD - 2000 Texas School Survey of Drug and Alcohol Use
http://slidepdf.com/reader/full/swisher-county-happy-isd-2000-texas-school-survey-of-drug-and-alcohol-use 48/113
HappySpring 2000
The FREQ Procedure
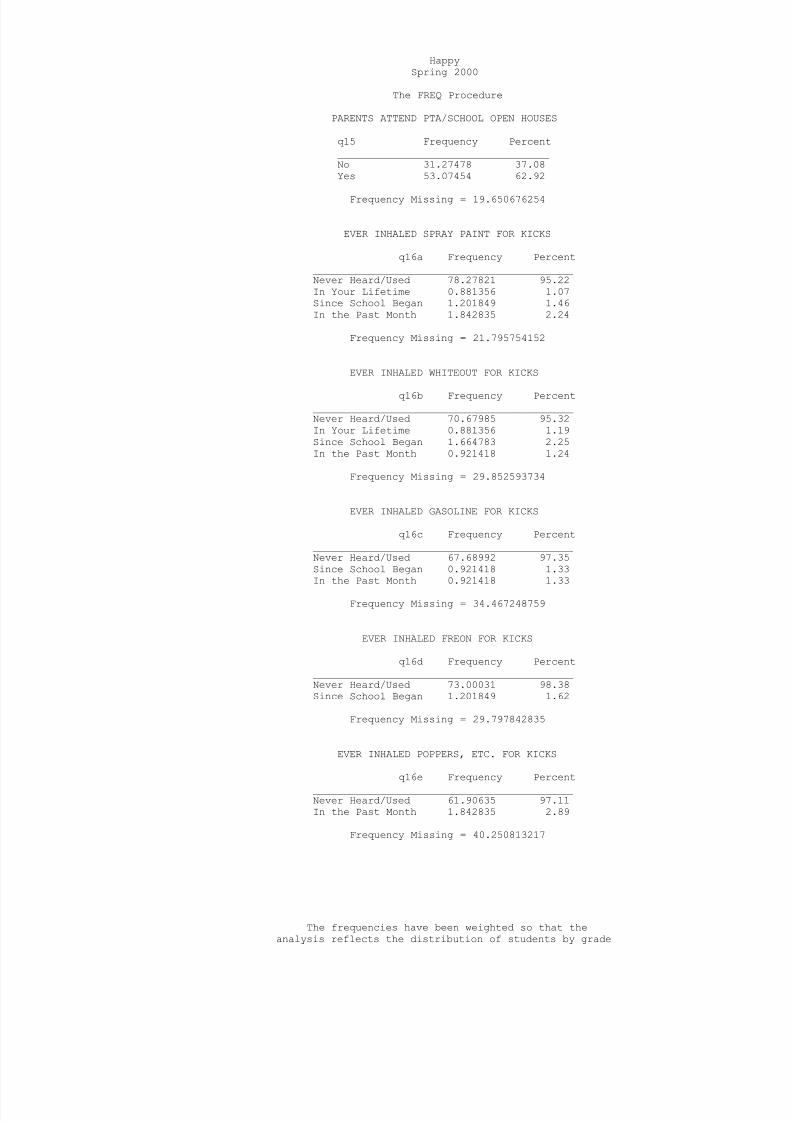
PARENTS ATTEND PTA/SCHOOL OPEN HOUSES
q15 Frequency Percent___________________________________No 31.27478 37.08Yes 53.07454 62.92
Frequency Missing = 19.650676254
EVER INHALED SPRAY PAINT FOR KICKS
q16a Frequency Percent___________________________________________Never Heard/Used 78.27821 95.22In Your Lifetime 0.881356 1.07Since School Began 1.201849 1.46In the Past Month 1.842835 2.24
Frequency Missing = 21.795754152
EVER INHALED WHITEOUT FOR KICKS
q16b Frequency Percent___________________________________________Never Heard/Used 70.67985 95.32In Your Lifetime 0.881356 1.19Since School Began 1.664783 2.25In the Past Month 0.921418 1.24
Frequency Missing = 29.852593734
EVER INHALED GASOLINE FOR KICKS
q16c Frequency Percent___________________________________________Never Heard/Used 67.68992 97.35Since School Began 0.921418 1.33
In the Past Month 0.921418 1.33Frequency Missing = 34.467248759
EVER INHALED FREON FOR KICKS
q16d Frequency Percent___________________________________________Never Heard/Used 73.00031 98.38Since School Began 1.201849 1.62
Frequency Missing = 29.797842835
EVER INHALED POPPERS, ETC. FOR KICKS
q16e Frequency Percent___________________________________________Never Heard/Used 61.90635 97.11In the Past Month 1.842835 2.89
Frequency Missing = 40.250813217
The frequencies have been weighted so that theanalysis reflects the distribution of students by grade

8/14/2019 SWISHER COUNTY - Happy ISD - 2000 Texas School Survey of Drug and Alcohol Use
http://slidepdf.com/reader/full/swisher-county-happy-isd-2000-texas-school-survey-of-drug-and-alcohol-use 49/113
level in the district
8/14/2019 SWISHER COUNTY - Happy ISD - 2000 Texas School Survey of Drug and Alcohol Use
http://slidepdf.com/reader/full/swisher-county-happy-isd-2000-texas-school-survey-of-drug-and-alcohol-use 50/113
HappySpring 2000
The FREQ Procedure
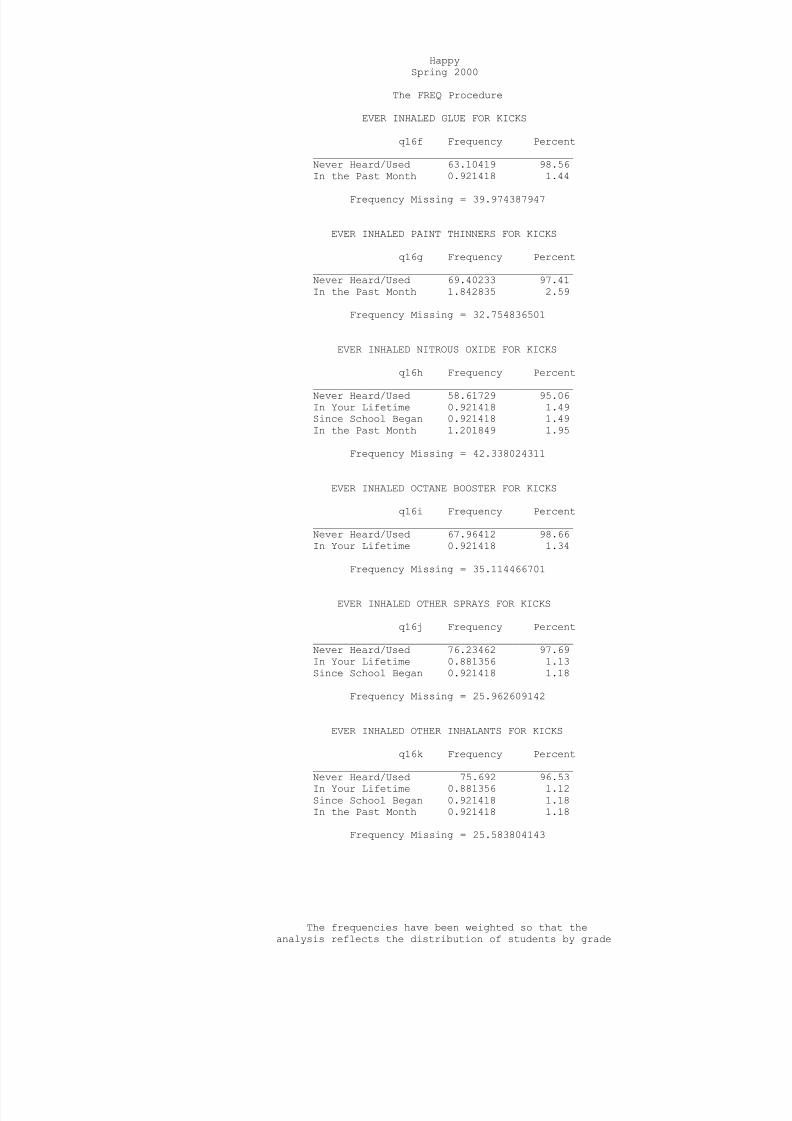
EVER INHALED GLUE FOR KICKS
q16f Frequency Percent___________________________________________Never Heard/Used 63.10419 98.56In the Past Month 0.921418 1.44
Frequency Missing = 39.974387947
EVER INHALED PAINT THINNERS FOR KICKS
q16g Frequency Percent___________________________________________Never Heard/Used 69.40233 97.41In the Past Month 1.842835 2.59
Frequency Missing = 32.754836501
EVER INHALED NITROUS OXIDE FOR KICKS
q16h Frequency Percent___________________________________________Never Heard/Used 58.61729 95.06In Your Lifetime 0.921418 1.49Since School Began 0.921418 1.49In the Past Month 1.201849 1.95
Frequency Missing = 42.338024311
EVER INHALED OCTANE BOOSTER FOR KICKS
q16i Frequency Percent___________________________________________Never Heard/Used 67.96412 98.66In Your Lifetime 0.921418 1.34
Frequency Missing = 35.114466701
EVER INHALED OTHER SPRAYS FOR KICKS
q16j Frequency Percent___________________________________________Never Heard/Used 76.23462 97.69In Your Lifetime 0.881356 1.13Since School Began 0.921418 1.18
Frequency Missing = 25.962609142
EVER INHALED OTHER INHALANTS FOR KICKS
q16k Frequency Percent___________________________________________
Never Heard/Used 75.692 96.53In Your Lifetime 0.881356 1.12Since School Began 0.921418 1.18In the Past Month 0.921418 1.18
Frequency Missing = 25.583804143
The frequencies have been weighted so that theanalysis reflects the distribution of students by grade

8/14/2019 SWISHER COUNTY - Happy ISD - 2000 Texas School Survey of Drug and Alcohol Use
http://slidepdf.com/reader/full/swisher-county-happy-isd-2000-texas-school-survey-of-drug-and-alcohol-use 51/113
level in the district
8/14/2019 SWISHER COUNTY - Happy ISD - 2000 Texas School Survey of Drug and Alcohol Use
http://slidepdf.com/reader/full/swisher-county-happy-isd-2000-texas-school-survey-of-drug-and-alcohol-use 52/113
HappySpring 2000
The FREQ Procedure
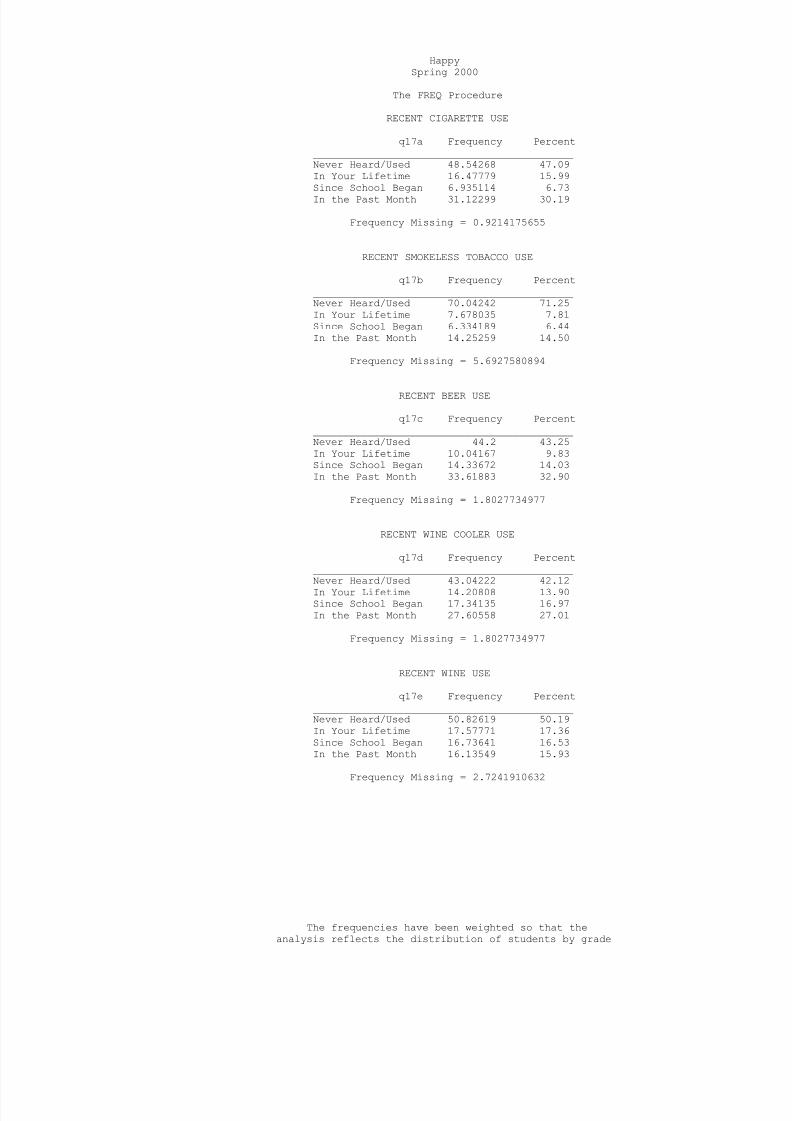
RECENT CIGARETTE USE
q17a Frequency Percent___________________________________________Never Heard/Used 48.54268 47.09In Your Lifetime 16.47779 15.99Since School Began 6.935114 6.73In the Past Month 31.12299 30.19
Frequency Missing = 0.9214175655
RECENT SMOKELESS TOBACCO USE
q17b Frequency Percent___________________________________________Never Heard/Used 70.04242 71.25In Your Lifetime 7.678035 7.81Since School Began 6.334189 6.44In the Past Month 14.25259 14.50
Frequency Missing = 5.6927580894
RECENT BEER USE
q17c Frequency Percent___________________________________________Never Heard/Used 44.2 43.25In Your Lifetime 10.04167 9.83Since School Began 14.33672 14.03In the Past Month 33.61883 32.90
Frequency Missing = 1.8027734977
RECENT WINE COOLER USE
q17d Frequency Percent___________________________________________
Never Heard/Used 43.04222 42.12In Your Lifetime 14.20808 13.90Since School Began 17.34135 16.97In the Past Month 27.60558 27.01
Frequency Missing = 1.8027734977
RECENT WINE USE
q17e Frequency Percent___________________________________________Never Heard/Used 50.82619 50.19In Your Lifetime 17.57771 17.36Since School Began 16.73641 16.53In the Past Month 16.13549 15.93
Frequency Missing = 2.7241910632
The frequencies have been weighted so that theanalysis reflects the distribution of students by grade

8/14/2019 SWISHER COUNTY - Happy ISD - 2000 Texas School Survey of Drug and Alcohol Use
http://slidepdf.com/reader/full/swisher-county-happy-isd-2000-texas-school-survey-of-drug-and-alcohol-use 53/113
level in the district
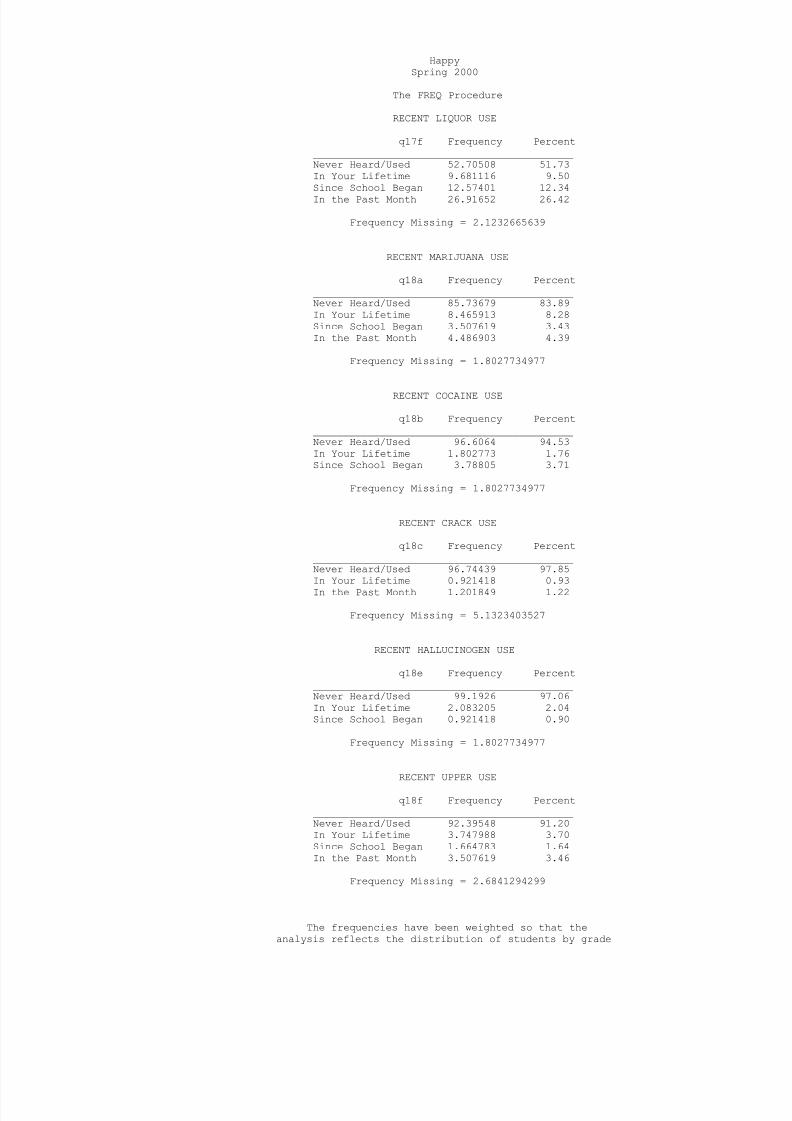
8/14/2019 SWISHER COUNTY - Happy ISD - 2000 Texas School Survey of Drug and Alcohol Use
http://slidepdf.com/reader/full/swisher-county-happy-isd-2000-texas-school-survey-of-drug-and-alcohol-use 54/113
HappySpring 2000
The FREQ Procedure
RECENT LIQUOR USE
q17f Frequency Percent___________________________________________Never Heard/Used 52.70508 51.73In Your Lifetime 9.681116 9.50Since School Began 12.57401 12.34In the Past Month 26.91652 26.42
Frequency Missing = 2.1232665639
RECENT MARIJUANA USE
q18a Frequency Percent___________________________________________Never Heard/Used 85.73679 83.89In Your Lifetime 8.465913 8.28Since School Began 3.507619 3.43In the Past Month 4.486903 4.39
Frequency Missing = 1.8027734977
RECENT COCAINE USE
q18b Frequency Percent___________________________________________Never Heard/Used 96.6064 94.53In Your Lifetime 1.802773 1.76Since School Began 3.78805 3.71
Frequency Missing = 1.8027734977
RECENT CRACK USE
q18c Frequency Percent___________________________________________Never Heard/Used 96.74439 97.85
In Your Lifetime 0.921418 0.93In the Past Month 1.201849 1.22
Frequency Missing = 5.1323403527
RECENT HALLUCINOGEN USE
q18e Frequency Percent___________________________________________Never Heard/Used 99.1926 97.06In Your Lifetime 2.083205 2.04Since School Began 0.921418 0.90
Frequency Missing = 1.8027734977
RECENT UPPER USE q18f Frequency Percent
___________________________________________Never Heard/Used 92.39548 91.20In Your Lifetime 3.747988 3.70Since School Began 1.664783 1.64In the Past Month 3.507619 3.46
Frequency Missing = 2.6841294299
The frequencies have been weighted so that theanalysis reflects the distribution of students by grade

8/14/2019 SWISHER COUNTY - Happy ISD - 2000 Texas School Survey of Drug and Alcohol Use
http://slidepdf.com/reader/full/swisher-county-happy-isd-2000-texas-school-survey-of-drug-and-alcohol-use 55/113
level in the district
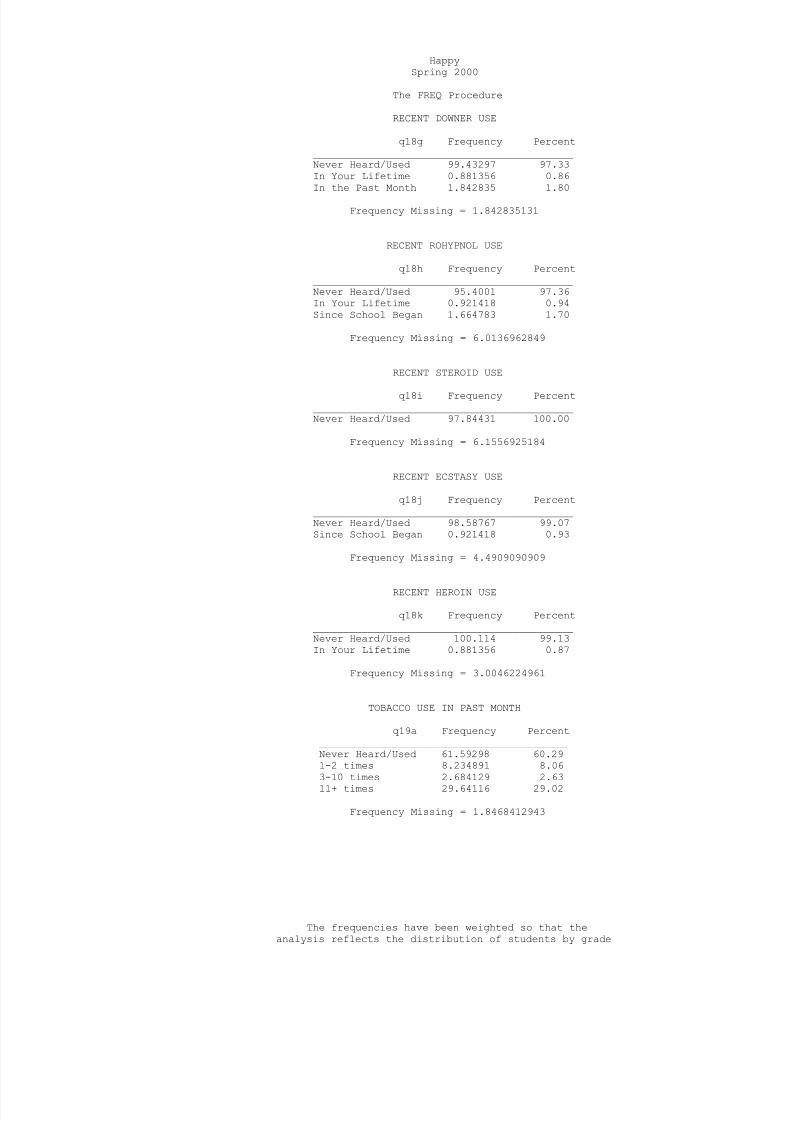
8/14/2019 SWISHER COUNTY - Happy ISD - 2000 Texas School Survey of Drug and Alcohol Use
http://slidepdf.com/reader/full/swisher-county-happy-isd-2000-texas-school-survey-of-drug-and-alcohol-use 56/113
HappySpring 2000
The FREQ Procedure
RECENT DOWNER USE
q18g Frequency Percent___________________________________________Never Heard/Used 99.43297 97.33In Your Lifetime 0.881356 0.86In the Past Month 1.842835 1.80
Frequency Missing = 1.842835131
RECENT ROHYPNOL USE
q18h Frequency Percent___________________________________________Never Heard/Used 95.4001 97.36In Your Lifetime 0.921418 0.94Since School Began 1.664783 1.70
Frequency Missing = 6.0136962849
RECENT STEROID USE
q18i Frequency Percent___________________________________________Never Heard/Used 97.84431 100.00
Frequency Missing = 6.1556925184
RECENT ECSTASY USE
q18j Frequency Percent___________________________________________Never Heard/Used 98.58767 99.07Since School Began 0.921418 0.93
Frequency Missing = 4.4909090909
RECENT HEROIN USE
q18k Frequency Percent___________________________________________Never Heard/Used 100.114 99.13In Your Lifetime 0.881356 0.87
Frequency Missing = 3.0046224961
TOBACCO USE IN PAST MONTH
q19a Frequency Percent_________________________________________Never Heard/Used 61.59298 60.291-2 times 8.234891 8.06
3-10 times 2.684129 2.6311+ times 29.64116 29.02
Frequency Missing = 1.8468412943
The frequencies have been weighted so that theanalysis reflects the distribution of students by grade

8/14/2019 SWISHER COUNTY - Happy ISD - 2000 Texas School Survey of Drug and Alcohol Use
http://slidepdf.com/reader/full/swisher-county-happy-isd-2000-texas-school-survey-of-drug-and-alcohol-use 57/113
level in the district
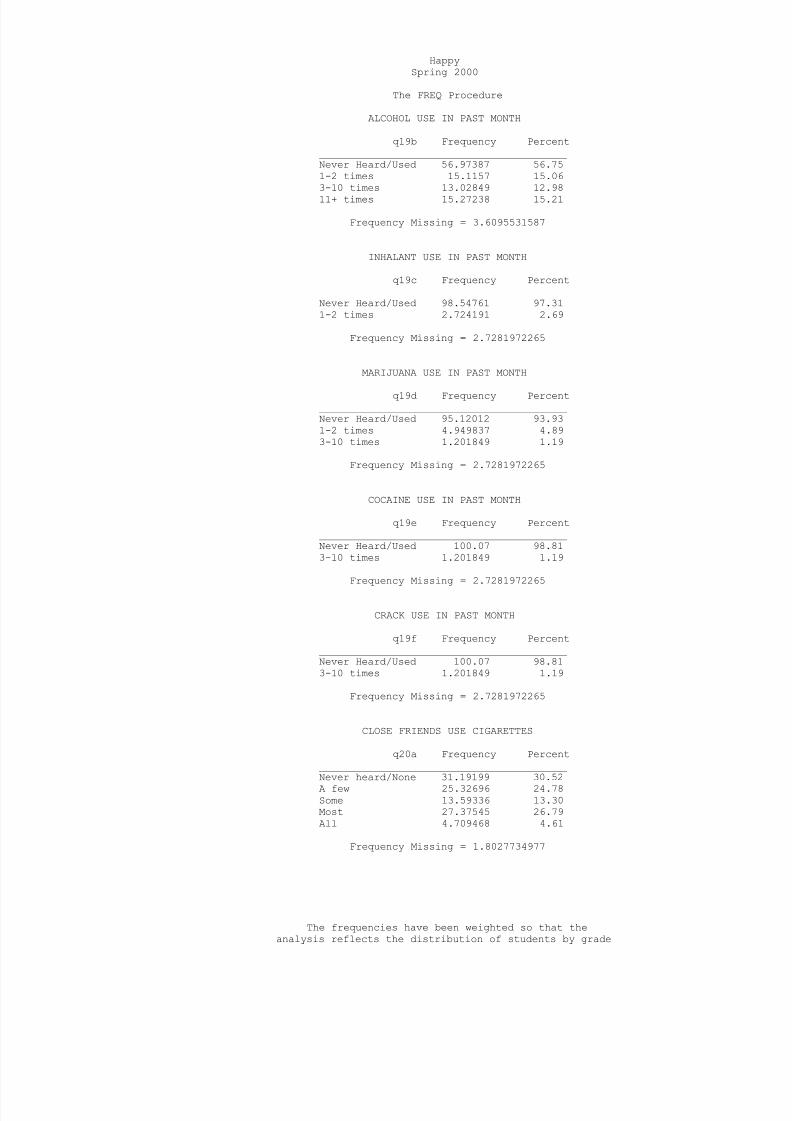
8/14/2019 SWISHER COUNTY - Happy ISD - 2000 Texas School Survey of Drug and Alcohol Use
http://slidepdf.com/reader/full/swisher-county-happy-isd-2000-texas-school-survey-of-drug-and-alcohol-use 58/113
HappySpring 2000
The FREQ Procedure
ALCOHOL USE IN PAST MONTH
q19b Frequency Percent_________________________________________Never Heard/Used 56.97387 56.751-2 times 15.1157 15.063-10 times 13.02849 12.9811+ times 15.27238 15.21
Frequency Missing = 3.6095531587
INHALANT USE IN PAST MONTH
q19c Frequency Percent_________________________________________Never Heard/Used 98.54761 97.311-2 times 2.724191 2.69
Frequency Missing = 2.7281972265
MARIJUANA USE IN PAST MONTH
q19d Frequency Percent_________________________________________Never Heard/Used 95.12012 93.931-2 times 4.949837 4.893-10 times 1.201849 1.19
Frequency Missing = 2.7281972265
COCAINE USE IN PAST MONTH
q19e Frequency Percent_________________________________________Never Heard/Used 100.07 98.813-10 times 1.201849 1.19
Frequency Missing = 2.7281972265
CRACK USE IN PAST MONTH
q19f Frequency Percent_________________________________________Never Heard/Used 100.07 98.813-10 times 1.201849 1.19
Frequency Missing = 2.7281972265
CLOSE FRIENDS USE CIGARETTES
q20a Frequency Percent_________________________________________
Never heard/None 31.19199 30.52A few 25.32696 24.78Some 13.59336 13.30Most 27.37545 26.79All 4.709468 4.61
Frequency Missing = 1.8027734977
The frequencies have been weighted so that theanalysis reflects the distribution of students by grade

8/14/2019 SWISHER COUNTY - Happy ISD - 2000 Texas School Survey of Drug and Alcohol Use
http://slidepdf.com/reader/full/swisher-county-happy-isd-2000-texas-school-survey-of-drug-and-alcohol-use 59/113
level in the district
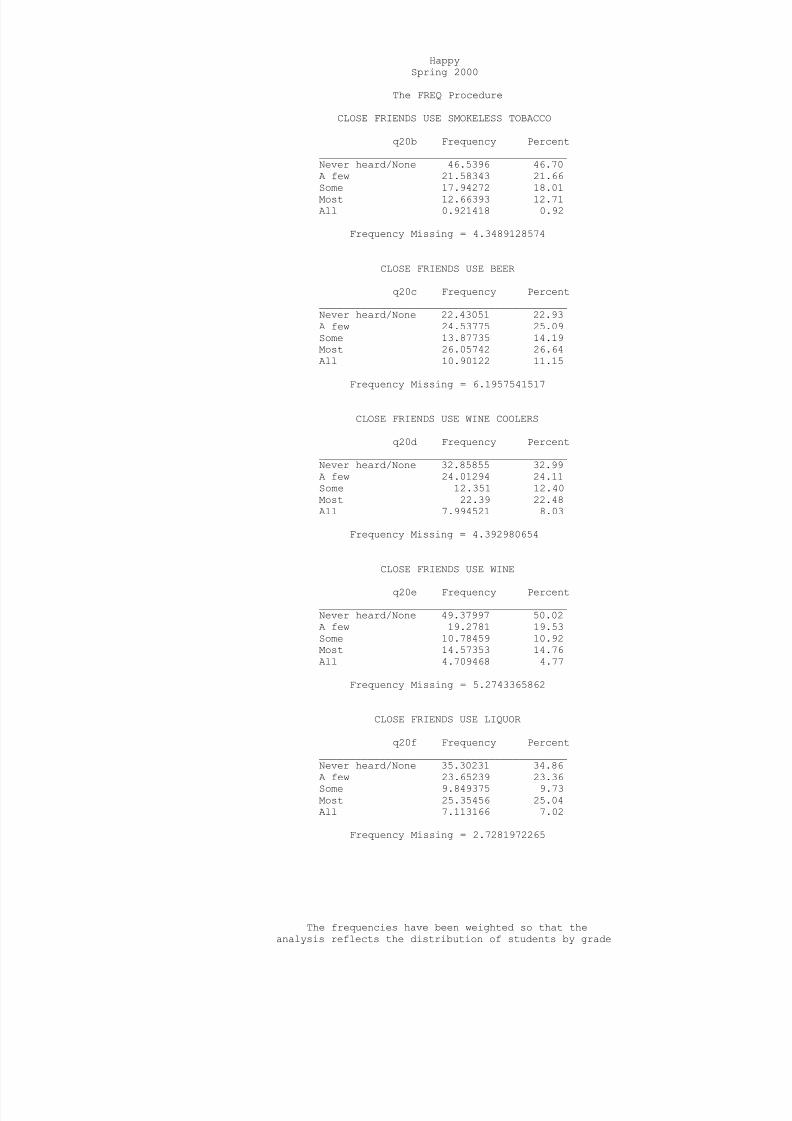
8/14/2019 SWISHER COUNTY - Happy ISD - 2000 Texas School Survey of Drug and Alcohol Use
http://slidepdf.com/reader/full/swisher-county-happy-isd-2000-texas-school-survey-of-drug-and-alcohol-use 60/113
HappySpring 2000
The FREQ Procedure
CLOSE FRIENDS USE SMOKELESS TOBACCO
q20b Frequency Percent_________________________________________Never heard/None 46.5396 46.70A few 21.58343 21.66Some 17.94272 18.01Most 12.66393 12.71All 0.921418 0.92
Frequency Missing = 4.3489128574
CLOSE FRIENDS USE BEER
q20c Frequency Percent_________________________________________Never heard/None 22.43051 22.93A few 24.53775 25.09Some 13.87735 14.19Most 26.05742 26.64All 10.90122 11.15
Frequency Missing = 6.1957541517
CLOSE FRIENDS USE WINE COOLERS
q20d Frequency Percent_________________________________________Never heard/None 32.85855 32.99A few 24.01294 24.11Some 12.351 12.40Most 22.39 22.48All 7.994521 8.03
Frequency Missing = 4.392980654
CLOSE FRIENDS USE WINE
q20e Frequency Percent_________________________________________Never heard/None 49.37997 50.02A few 19.2781 19.53Some 10.78459 10.92Most 14.57353 14.76All 4.709468 4.77
Frequency Missing = 5.2743365862
CLOSE FRIENDS USE LIQUOR
q20f Frequency Percent_________________________________________Never heard/None 35.30231 34.86
A few 23.65239 23.36Some 9.849375 9.73Most 25.35456 25.04All 7.113166 7.02
Frequency Missing = 2.7281972265
The frequencies have been weighted so that theanalysis reflects the distribution of students by grade

8/14/2019 SWISHER COUNTY - Happy ISD - 2000 Texas School Survey of Drug and Alcohol Use
http://slidepdf.com/reader/full/swisher-county-happy-isd-2000-texas-school-survey-of-drug-and-alcohol-use 61/113
level in the district
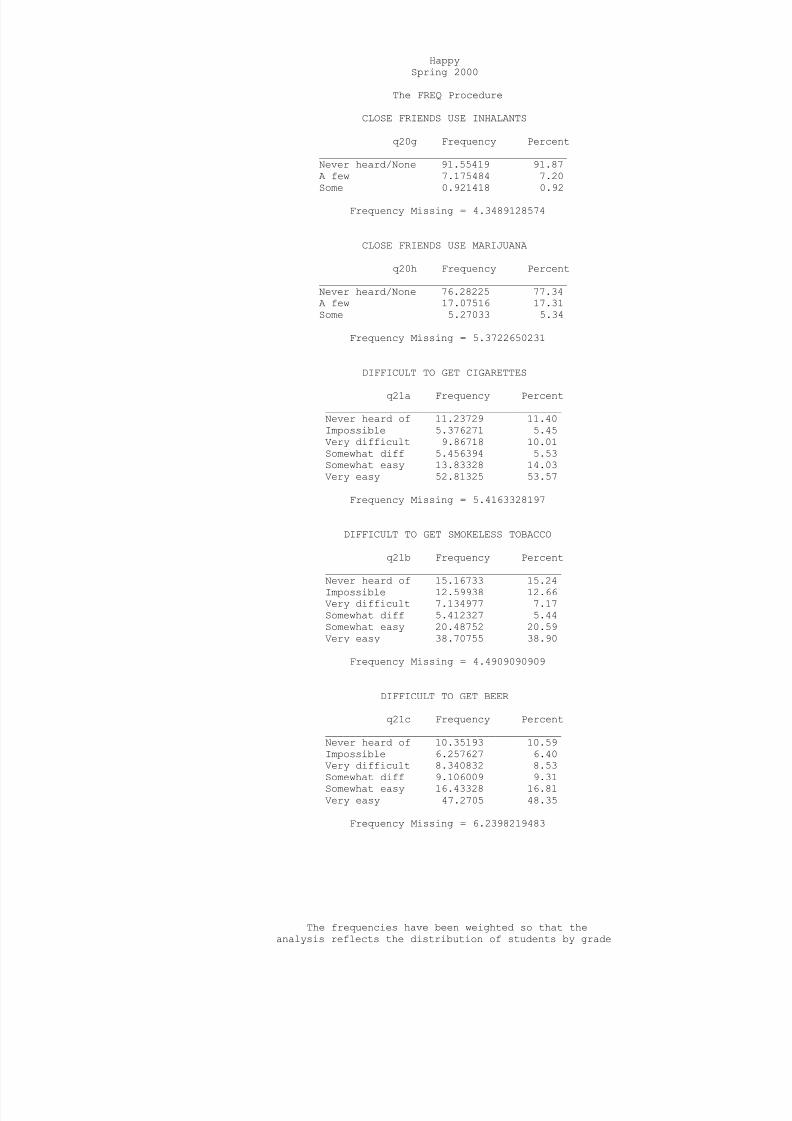
8/14/2019 SWISHER COUNTY - Happy ISD - 2000 Texas School Survey of Drug and Alcohol Use
http://slidepdf.com/reader/full/swisher-county-happy-isd-2000-texas-school-survey-of-drug-and-alcohol-use 62/113

8/14/2019 SWISHER COUNTY - Happy ISD - 2000 Texas School Survey of Drug and Alcohol Use
http://slidepdf.com/reader/full/swisher-county-happy-isd-2000-texas-school-survey-of-drug-and-alcohol-use 63/113
level in the district

8/14/2019 SWISHER COUNTY - Happy ISD - 2000 Texas School Survey of Drug and Alcohol Use
http://slidepdf.com/reader/full/swisher-county-happy-isd-2000-texas-school-survey-of-drug-and-alcohol-use 64/113
HappySpring 2000
The FREQ Procedure
DIFFICULT TO GET WINE COOLERS
q21d Frequency Percent_______________________________________Never heard of 8.505085 8.62Impossible 6.257627 6.34Very difficult 9.222188 9.35Somewhat diff 10.90478 11.05Somewhat easy 18.28814 18.53Very easy 45.50779 46.11
Frequency Missing = 5.3143982195
DIFFICULT TO GET WINE
q21e Frequency Percent_______________________________________Never heard of 8.505085 8.62Impossible 9.827119 9.96Very difficult 10.10354 10.24Somewhat diff 14.5584 14.75Somewhat easy 14.71464 14.91Very easy 40.97281 41.52
Frequency Missing = 5.3184043828
DIFFICULT TO GET LIQUOR
q21f Frequency Percent_______________________________________Never heard of 7.539599 7.79Impossible 9.827119 10.15Very difficult 9.266256 9.57Somewhat diff 12.83174 13.25Somewhat easy 17.35871 17.93Very easy 40.01133 41.32
Frequency Missing = 7.1652456771
DIFFICULT TO GET INHALANTS
q21g Frequency Percent_______________________________________Never heard of 13.73535 14.44Impossible 14.72666 15.48Very difficult 7.539599 7.93Somewhat diff 7.536038 7.92Somewhat easy 8.367095 8.80Very easy 43.21137 45.43
Frequency Missing = 8.8838897449
The frequencies have been weighted so that theanalysis reflects the distribution of students by grade

8/14/2019 SWISHER COUNTY - Happy ISD - 2000 Texas School Survey of Drug and Alcohol Use
http://slidepdf.com/reader/full/swisher-county-happy-isd-2000-texas-school-survey-of-drug-and-alcohol-use 65/113
level in the district

8/14/2019 SWISHER COUNTY - Happy ISD - 2000 Texas School Survey of Drug and Alcohol Use
http://slidepdf.com/reader/full/swisher-county-happy-isd-2000-texas-school-survey-of-drug-and-alcohol-use 66/113
HappySpring 2000
The FREQ Procedure
DIFFICULT TO GET MARIJUANA
q21h Frequency Percent_______________________________________Never heard of 14.80277 15.42Impossible 27.2379 28.37Very difficult 16.41147 17.10Somewhat diff 16.00151 16.67Somewhat easy 10.08173 10.50Very easy 11.46608 11.94
Frequency Missing = 7.9985276494
DIFFICULT TO GET COCAINE
q21i Frequency Percent_______________________________________Never heard of 16.41948 16.79Impossible 33.43366 34.18Very difficult 21.78774 22.28Somewhat diff 18.02239 18.43Somewhat easy 0.881356 0.90Very easy 7.259613 7.42
Frequency Missing = 6.1957541517
DIFFICULT TO GET CRACK
q21j Frequency Percent_______________________________________Never heard of 16.46355 16.99Impossible 34.35508 35.45Very difficult 20.21733 20.86Somewhat diff 15.15576 15.64Somewhat easy 0.881356 0.91Very easy 9.84982 10.16
Frequency Missing = 7.0771100839
DIFFICULT TO GET HALLUCINOGENS
q21l Frequency Percent_______________________________________Never heard of 20.30947 21.97Impossible 29.44575 31.86Very difficult 20.72388 22.42Somewhat diff 14.09235 15.25Somewhat easy 1.802773 1.95Very easy 6.057764 6.55
Frequency Missing = 11.568019175
The frequencies have been weighted so that theanalysis reflects the distribution of students by grade

8/14/2019 SWISHER COUNTY - Happy ISD - 2000 Texas School Survey of Drug and Alcohol Use
http://slidepdf.com/reader/full/swisher-county-happy-isd-2000-texas-school-survey-of-drug-and-alcohol-use 67/113
level in the district
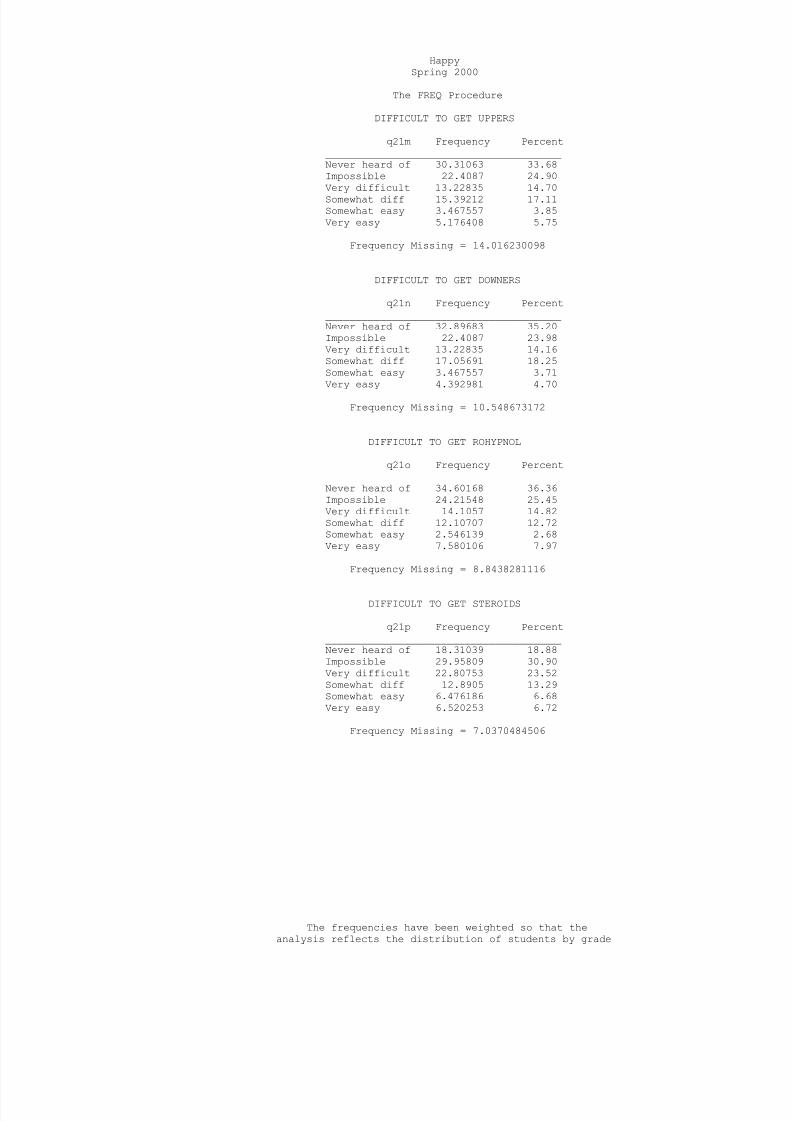
8/14/2019 SWISHER COUNTY - Happy ISD - 2000 Texas School Survey of Drug and Alcohol Use
http://slidepdf.com/reader/full/swisher-county-happy-isd-2000-texas-school-survey-of-drug-and-alcohol-use 68/113
HappySpring 2000
The FREQ Procedure
DIFFICULT TO GET UPPERS
q21m Frequency Percent_______________________________________Never heard of 30.31063 33.68Impossible 22.4087 24.90Very difficult 13.22835 14.70Somewhat diff 15.39212 17.11Somewhat easy 3.467557 3.85Very easy 5.176408 5.75
Frequency Missing = 14.016230098
DIFFICULT TO GET DOWNERS
q21n Frequency Percent_______________________________________Never heard of 32.89683 35.20Impossible 22.4087 23.98Very difficult 13.22835 14.16Somewhat diff 17.05691 18.25Somewhat easy 3.467557 3.71Very easy 4.392981 4.70
Frequency Missing = 10.548673172
DIFFICULT TO GET ROHYPNOL
q21o Frequency Percent_______________________________________Never heard of 34.60168 36.36Impossible 24.21548 25.45Very difficult 14.1057 14.82Somewhat diff 12.10707 12.72Somewhat easy 2.546139 2.68Very easy 7.580106 7.97
Frequency Missing = 8.8438281116
DIFFICULT TO GET STEROIDS
q21p Frequency Percent_______________________________________Never heard of 18.31039 18.88Impossible 29.95809 30.90Very difficult 22.80753 23.52Somewhat diff 12.8905 13.29Somewhat easy 6.476186 6.68Very easy 6.520253 6.72
Frequency Missing = 7.0370484506
The frequencies have been weighted so that theanalysis reflects the distribution of students by grade

8/14/2019 SWISHER COUNTY - Happy ISD - 2000 Texas School Survey of Drug and Alcohol Use
http://slidepdf.com/reader/full/swisher-county-happy-isd-2000-texas-school-survey-of-drug-and-alcohol-use 69/113
level in the district
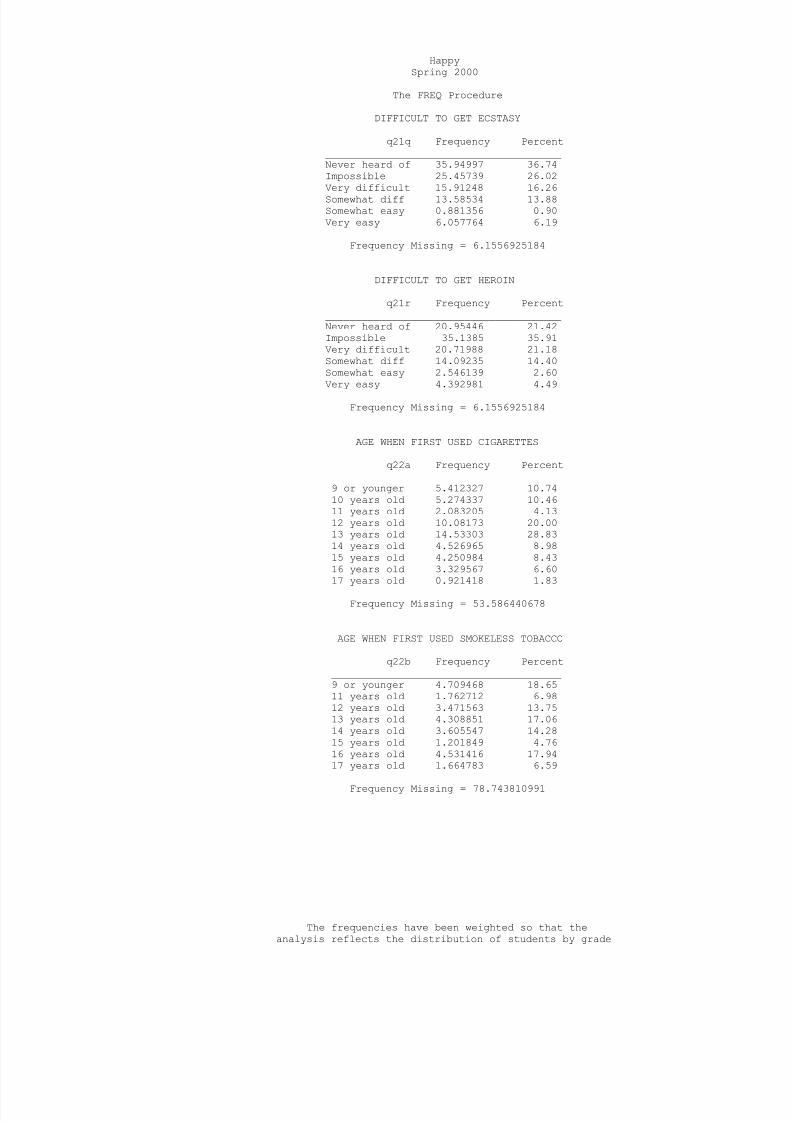
8/14/2019 SWISHER COUNTY - Happy ISD - 2000 Texas School Survey of Drug and Alcohol Use
http://slidepdf.com/reader/full/swisher-county-happy-isd-2000-texas-school-survey-of-drug-and-alcohol-use 70/113
HappySpring 2000
The FREQ Procedure
DIFFICULT TO GET ECSTASY
q21q Frequency Percent_______________________________________Never heard of 35.94997 36.74Impossible 25.45739 26.02Very difficult 15.91248 16.26Somewhat diff 13.58534 13.88Somewhat easy 0.881356 0.90Very easy 6.057764 6.19
Frequency Missing = 6.1556925184
DIFFICULT TO GET HEROIN
q21r Frequency Percent_______________________________________Never heard of 20.95446 21.42Impossible 35.1385 35.91Very difficult 20.71988 21.18Somewhat diff 14.09235 14.40Somewhat easy 2.546139 2.60Very easy 4.392981 4.49
Frequency Missing = 6.1556925184
AGE WHEN FIRST USED CIGARETTES
q22a Frequency Percent______________________________________9 or younger 5.412327 10.7410 years old 5.274337 10.4611 years old 2.083205 4.1312 years old 10.08173 20.0013 years old 14.53303 28.8314 years old 4.526965 8.9815 years old 4.250984 8.4316 years old 3.329567 6.60
17 years old 0.921418 1.83Frequency Missing = 53.586440678
AGE WHEN FIRST USED SMOKELESS TOBACCO
q22b Frequency Percent______________________________________9 or younger 4.709468 18.6511 years old 1.762712 6.9812 years old 3.471563 13.7513 years old 4.308851 17.0614 years old 3.605547 14.2815 years old 1.201849 4.7616 years old 4.531416 17.9417 years old 1.664783 6.59
Frequency Missing = 78.743810991
The frequencies have been weighted so that theanalysis reflects the distribution of students by grade

8/14/2019 SWISHER COUNTY - Happy ISD - 2000 Texas School Survey of Drug and Alcohol Use
http://slidepdf.com/reader/full/swisher-county-happy-isd-2000-texas-school-survey-of-drug-and-alcohol-use 71/113
level in the district
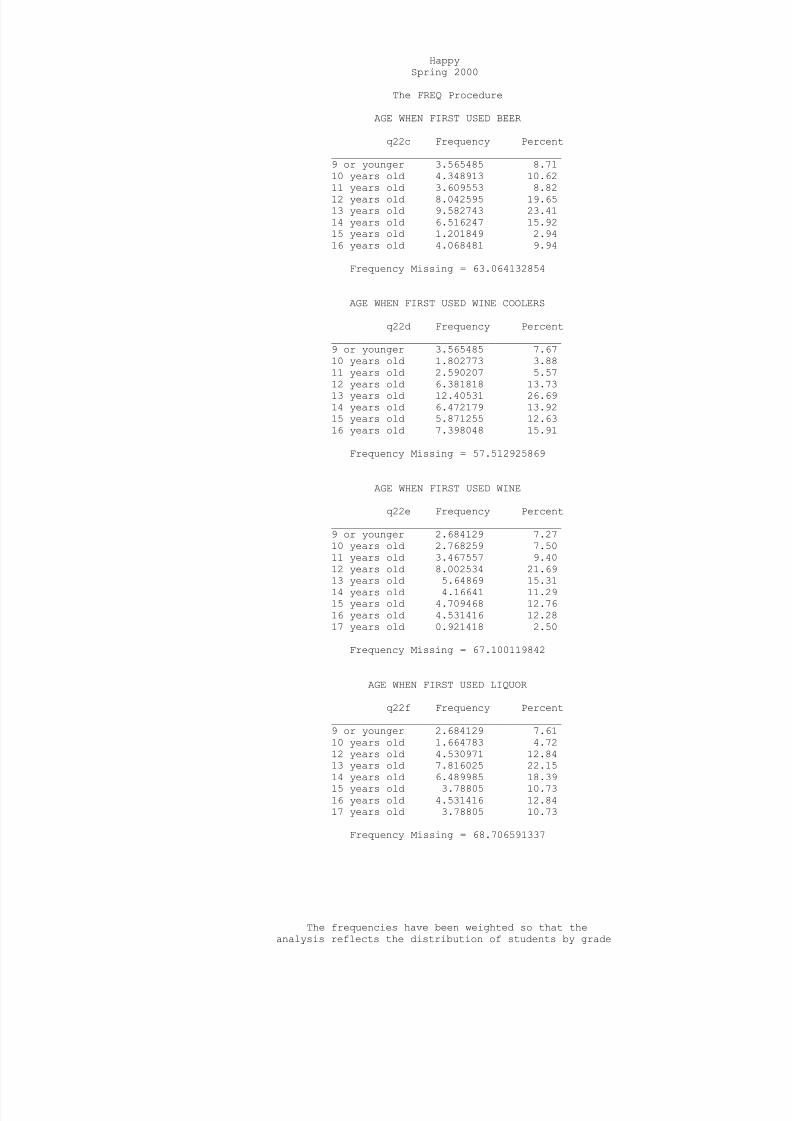
8/14/2019 SWISHER COUNTY - Happy ISD - 2000 Texas School Survey of Drug and Alcohol Use
http://slidepdf.com/reader/full/swisher-county-happy-isd-2000-texas-school-survey-of-drug-and-alcohol-use 72/113
HappySpring 2000
The FREQ Procedure
AGE WHEN FIRST USED BEER
q22c Frequency Percent______________________________________9 or younger 3.565485 8.7110 years old 4.348913 10.6211 years old 3.609553 8.8212 years old 8.042595 19.6513 years old 9.582743 23.4114 years old 6.516247 15.9215 years old 1.201849 2.9416 years old 4.068481 9.94
Frequency Missing = 63.064132854
AGE WHEN FIRST USED WINE COOLERS
q22d Frequency Percent______________________________________9 or younger 3.565485 7.6710 years old 1.802773 3.8811 years old 2.590207 5.5712 years old 6.381818 13.7313 years old 12.40531 26.6914 years old 6.472179 13.9215 years old 5.871255 12.6316 years old 7.398048 15.91
Frequency Missing = 57.512925869
AGE WHEN FIRST USED WINE
q22e Frequency Percent______________________________________9 or younger 2.684129 7.2710 years old 2.768259 7.5011 years old 3.467557 9.4012 years old 8.002534 21.69
13 years old 5.64869 15.3114 years old 4.16641 11.2915 years old 4.709468 12.7616 years old 4.531416 12.2817 years old 0.921418 2.50
Frequency Missing = 67.100119842
AGE WHEN FIRST USED LIQUOR
q22f Frequency Percent______________________________________9 or younger 2.684129 7.6110 years old 1.664783 4.7212 years old 4.530971 12.8413 years old 7.816025 22.15
14 years old 6.489985 18.3915 years old 3.78805 10.7316 years old 4.531416 12.8417 years old 3.78805 10.73
Frequency Missing = 68.706591337
The frequencies have been weighted so that theanalysis reflects the distribution of students by grade

8/14/2019 SWISHER COUNTY - Happy ISD - 2000 Texas School Survey of Drug and Alcohol Use
http://slidepdf.com/reader/full/swisher-county-happy-isd-2000-texas-school-survey-of-drug-and-alcohol-use 73/113
level in the district

8/14/2019 SWISHER COUNTY - Happy ISD - 2000 Texas School Survey of Drug and Alcohol Use
http://slidepdf.com/reader/full/swisher-county-happy-isd-2000-texas-school-survey-of-drug-and-alcohol-use 74/113
HappySpring 2000
The FREQ Procedure
AGE WHEN FIRST USED INHALANTS
q22g Frequency Percent______________________________________12 years old 0.921418 26.2713 years old 0.921418 26.2716 years old 1.664783 47.46
Frequency Missing = 100.49238144
AGE WHEN FIRST USED MARIJUANA
q22h Frequency Percent______________________________________9 or younger 0.921418 8.3411 years old 0.925424 8.3812 years old 0.921418 8.3414 years old 1.201849 10.8815 years old 0.881356 7.9816 years old 1.664783 15.0717 years old 4.531416 41.02
Frequency Missing = 92.952336929
AGE WHEN FIRST USED COCAINE
q22i Frequency Percent______________________________________16 years old 2.123267 56.0517 years old 1.664783 43.95
Frequency Missing = 100.21195001
AGE WHEN FIRST USED CRACK
q22j Frequency Percent______________________________________
16 years old 0.921418 35.6317 years old 1.664783 64.37
Frequency Missing = 101.41379901
AGE WHEN FIRST USED HALLUCINOGENS
q22l Frequency Percent______________________________________15 years old 1.201849 56.6016 years old 0.921418 43.40
Frequency Missing = 101.87673344
AGE WHEN FIRST USED UPPERS
q22m Frequency Percent______________________________________11 years old 0.921418 14.4614 years old 2.123267 33.3117 years old 1.664783 26.1218 or older 1.664783 26.12
Frequency Missing = 97.625749016
The frequencies have been weighted so that theanalysis reflects the distribution of students by grade

8/14/2019 SWISHER COUNTY - Happy ISD - 2000 Texas School Survey of Drug and Alcohol Use
http://slidepdf.com/reader/full/swisher-county-happy-isd-2000-texas-school-survey-of-drug-and-alcohol-use 75/113
level in the district
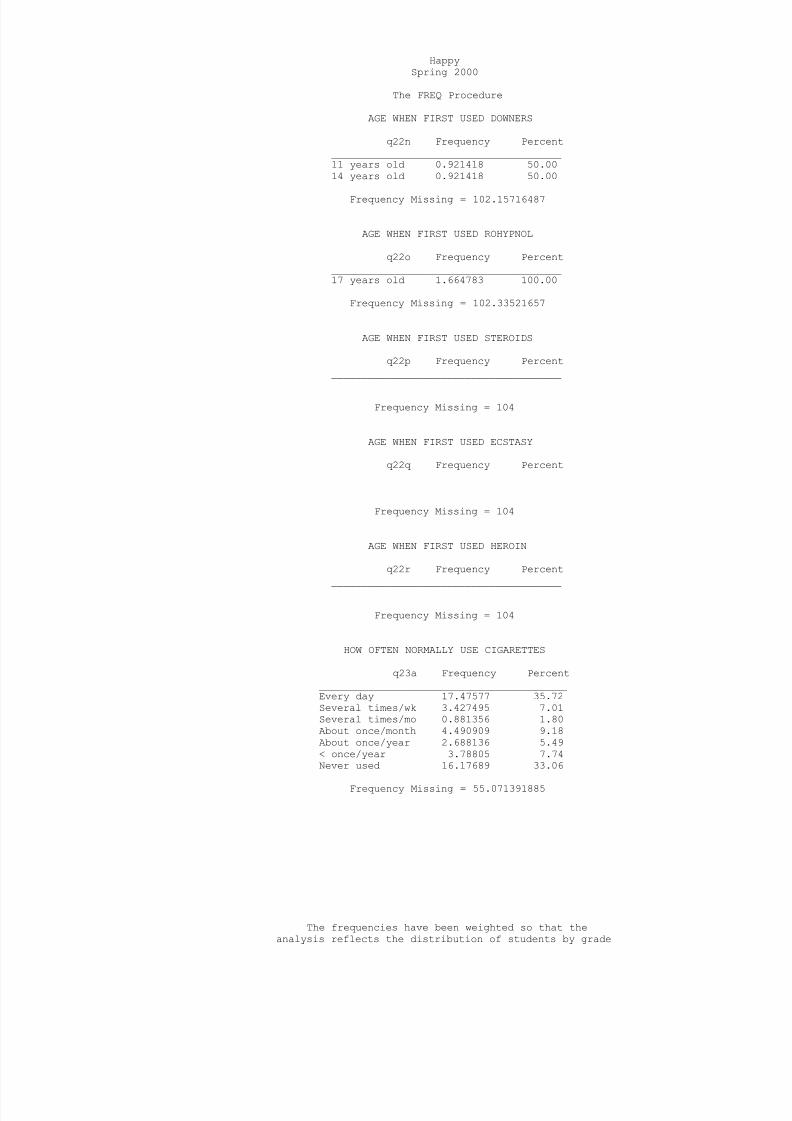
8/14/2019 SWISHER COUNTY - Happy ISD - 2000 Texas School Survey of Drug and Alcohol Use
http://slidepdf.com/reader/full/swisher-county-happy-isd-2000-texas-school-survey-of-drug-and-alcohol-use 76/113
HappySpring 2000
The FREQ Procedure
AGE WHEN FIRST USED DOWNERS
q22n Frequency Percent______________________________________11 years old 0.921418 50.0014 years old 0.921418 50.00
Frequency Missing = 102.15716487
AGE WHEN FIRST USED ROHYPNOL
q22o Frequency Percent______________________________________17 years old 1.664783 100.00
Frequency Missing = 102.33521657
AGE WHEN FIRST USED STEROIDS
q22p Frequency Percent______________________________________
Frequency Missing = 104
AGE WHEN FIRST USED ECSTASY
q22q Frequency Percent______________________________________
Frequency Missing = 104
AGE WHEN FIRST USED HEROIN
q22r Frequency Percent
______________________________________
Frequency Missing = 104
HOW OFTEN NORMALLY USE CIGARETTES
q23a Frequency Percent_________________________________________Every day 17.47577 35.72Several times/wk 3.427495 7.01Several times/mo 0.881356 1.80About once/month 4.490909 9.18About once/year 2.688136 5.49< once/year 3.78805 7.74Never used 16.17689 33.06
Frequency Missing = 55.071391885
The frequencies have been weighted so that theanalysis reflects the distribution of students by grade

8/14/2019 SWISHER COUNTY - Happy ISD - 2000 Texas School Survey of Drug and Alcohol Use
http://slidepdf.com/reader/full/swisher-county-happy-isd-2000-texas-school-survey-of-drug-and-alcohol-use 77/113
level in the district
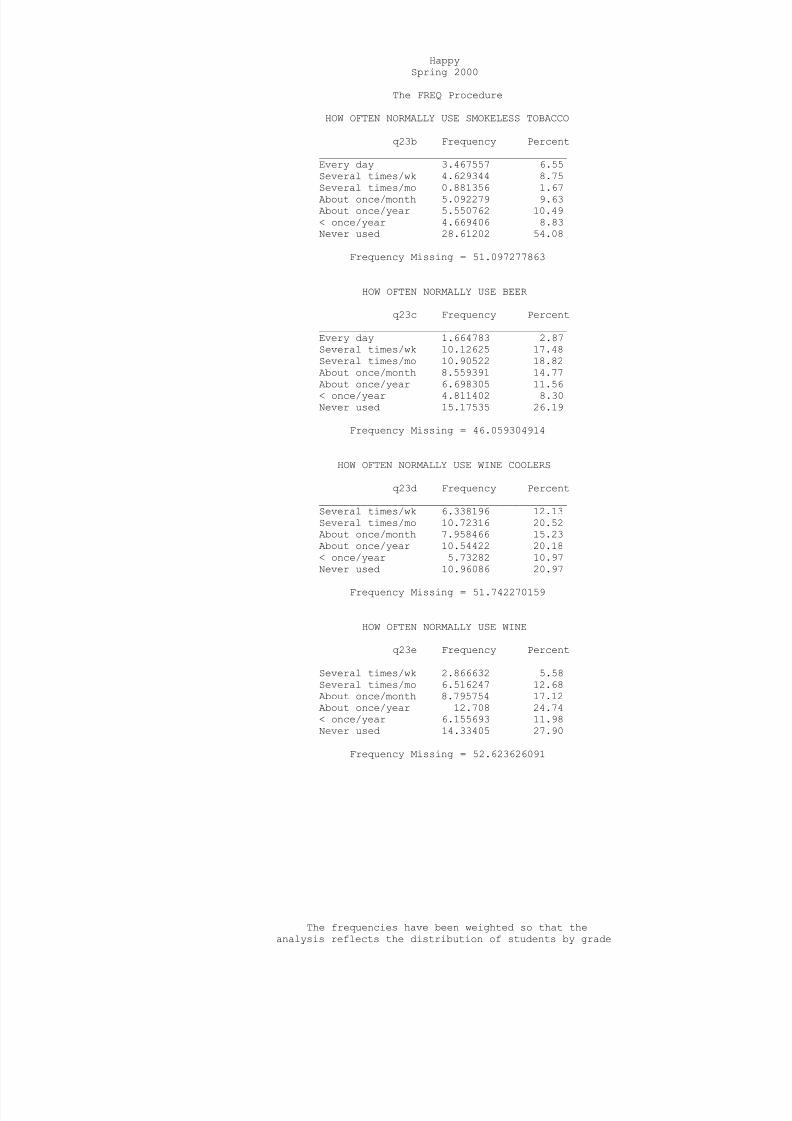
8/14/2019 SWISHER COUNTY - Happy ISD - 2000 Texas School Survey of Drug and Alcohol Use
http://slidepdf.com/reader/full/swisher-county-happy-isd-2000-texas-school-survey-of-drug-and-alcohol-use 78/113
HappySpring 2000
The FREQ Procedure
HOW OFTEN NORMALLY USE SMOKELESS TOBACCO
q23b Frequency Percent_________________________________________Every day 3.467557 6.55Several times/wk 4.629344 8.75Several times/mo 0.881356 1.67About once/month 5.092279 9.63About once/year 5.550762 10.49< once/year 4.669406 8.83Never used 28.61202 54.08
Frequency Missing = 51.097277863
HOW OFTEN NORMALLY USE BEER
q23c Frequency Percent_________________________________________Every day 1.664783 2.87Several times/wk 10.12625 17.48Several times/mo 10.90522 18.82About once/month 8.559391 14.77About once/year 6.698305 11.56< once/year 4.811402 8.30Never used 15.17535 26.19
Frequency Missing = 46.059304914
HOW OFTEN NORMALLY USE WINE COOLERS
q23d Frequency Percent_________________________________________Several times/wk 6.338196 12.13Several times/mo 10.72316 20.52About once/month 7.958466 15.23About once/year 10.54422 20.18< once/year 5.73282 10.97Never used 10.96086 20.97
Frequency Missing = 51.742270159
HOW OFTEN NORMALLY USE WINE
q23e Frequency Percent_________________________________________Several times/wk 2.866632 5.58Several times/mo 6.516247 12.68About once/month 8.795754 17.12About once/year 12.708 24.74< once/year 6.155693 11.98Never used 14.33405 27.90
Frequency Missing = 52.623626091
The frequencies have been weighted so that theanalysis reflects the distribution of students by grade

8/14/2019 SWISHER COUNTY - Happy ISD - 2000 Texas School Survey of Drug and Alcohol Use
http://slidepdf.com/reader/full/swisher-county-happy-isd-2000-texas-school-survey-of-drug-and-alcohol-use 79/113
level in the district
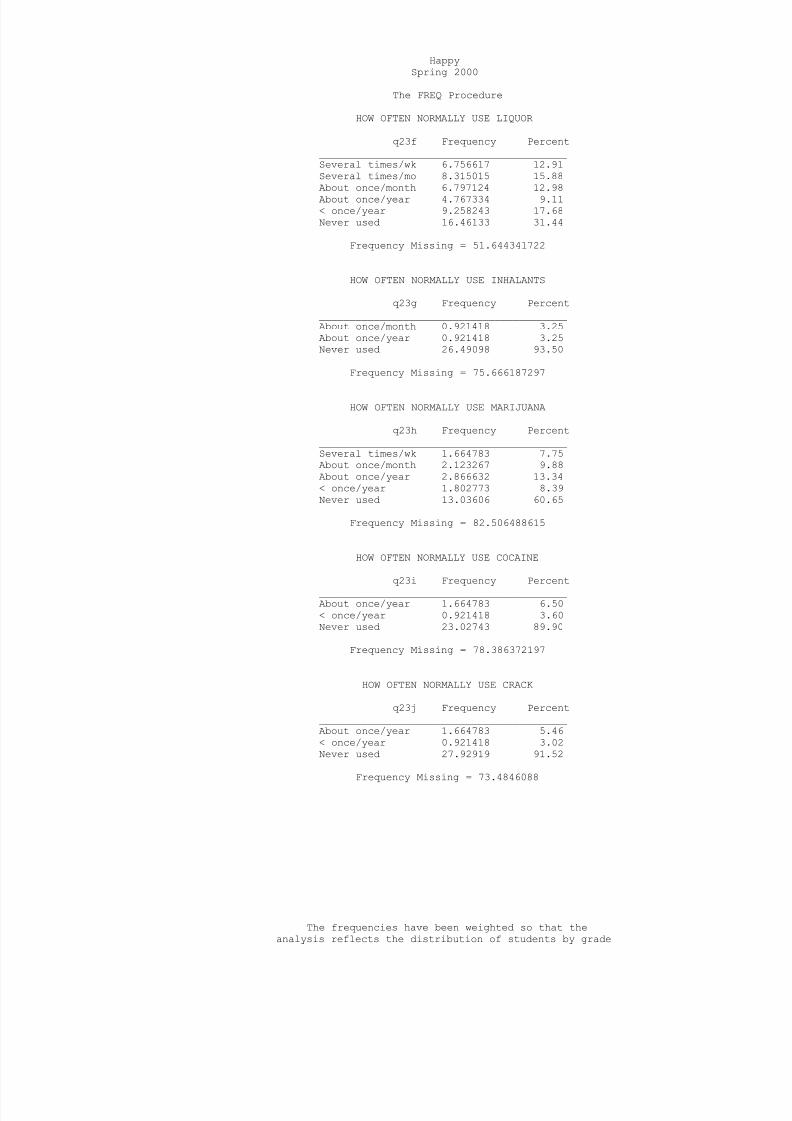
8/14/2019 SWISHER COUNTY - Happy ISD - 2000 Texas School Survey of Drug and Alcohol Use
http://slidepdf.com/reader/full/swisher-county-happy-isd-2000-texas-school-survey-of-drug-and-alcohol-use 80/113
HappySpring 2000
The FREQ Procedure
HOW OFTEN NORMALLY USE LIQUOR
q23f Frequency Percent_________________________________________Several times/wk 6.756617 12.91Several times/mo 8.315015 15.88About once/month 6.797124 12.98About once/year 4.767334 9.11< once/year 9.258243 17.68Never used 16.46133 31.44
Frequency Missing = 51.644341722
HOW OFTEN NORMALLY USE INHALANTS
q23g Frequency Percent_________________________________________About once/month 0.921418 3.25About once/year 0.921418 3.25Never used 26.49098 93.50
Frequency Missing = 75.666187297
HOW OFTEN NORMALLY USE MARIJUANA
q23h Frequency Percent_________________________________________Several times/wk 1.664783 7.75About once/month 2.123267 9.88About once/year 2.866632 13.34< once/year 1.802773 8.39Never used 13.03606 60.65
Frequency Missing = 82.506488615
HOW OFTEN NORMALLY USE COCAINE
q23i Frequency Percent_________________________________________About once/year 1.664783 6.50< once/year 0.921418 3.60Never used 23.02743 89.90
Frequency Missing = 78.386372197
HOW OFTEN NORMALLY USE CRACK
q23j Frequency Percent_________________________________________About once/year 1.664783 5.46< once/year 0.921418 3.02Never used 27.92919 91.52
Frequency Missing = 73.4846088
The frequencies have been weighted so that theanalysis reflects the distribution of students by grade

8/14/2019 SWISHER COUNTY - Happy ISD - 2000 Texas School Survey of Drug and Alcohol Use
http://slidepdf.com/reader/full/swisher-county-happy-isd-2000-texas-school-survey-of-drug-and-alcohol-use 81/113
level in the district
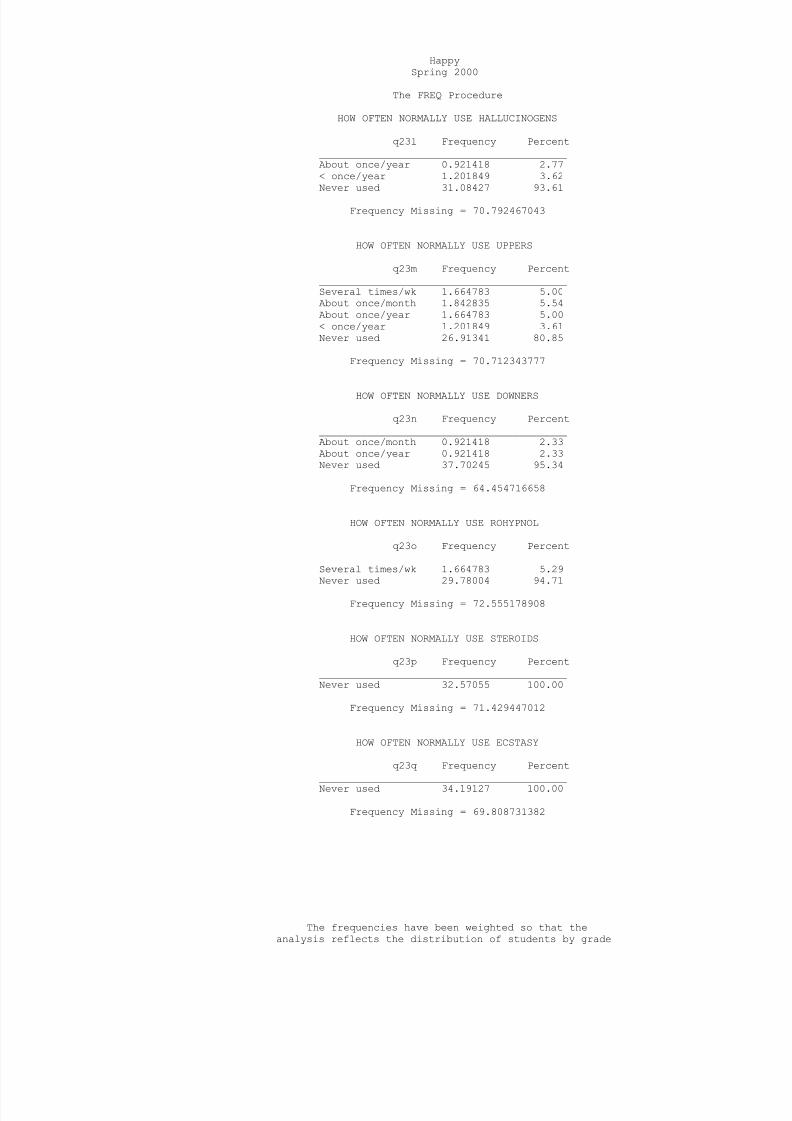
8/14/2019 SWISHER COUNTY - Happy ISD - 2000 Texas School Survey of Drug and Alcohol Use
http://slidepdf.com/reader/full/swisher-county-happy-isd-2000-texas-school-survey-of-drug-and-alcohol-use 82/113
HappySpring 2000
The FREQ Procedure
HOW OFTEN NORMALLY USE HALLUCINOGENS
q23l Frequency Percent_________________________________________About once/year 0.921418 2.77< once/year 1.201849 3.62Never used 31.08427 93.61
Frequency Missing = 70.792467043
HOW OFTEN NORMALLY USE UPPERS
q23m Frequency Percent_________________________________________Several times/wk 1.664783 5.00About once/month 1.842835 5.54About once/year 1.664783 5.00< once/year 1.201849 3.61Never used 26.91341 80.85
Frequency Missing = 70.712343777
HOW OFTEN NORMALLY USE DOWNERS
q23n Frequency Percent_________________________________________About once/month 0.921418 2.33About once/year 0.921418 2.33Never used 37.70245 95.34
Frequency Missing = 64.454716658
HOW OFTEN NORMALLY USE ROHYPNOL
q23o Frequency Percent_________________________________________Several times/wk 1.664783 5.29
Never used 29.78004 94.71Frequency Missing = 72.555178908
HOW OFTEN NORMALLY USE STEROIDS
q23p Frequency Percent_________________________________________Never used 32.57055 100.00
Frequency Missing = 71.429447012
HOW OFTEN NORMALLY USE ECSTASY
q23q Frequency Percent
_________________________________________Never used 34.19127 100.00
Frequency Missing = 69.808731382
The frequencies have been weighted so that theanalysis reflects the distribution of students by grade

8/14/2019 SWISHER COUNTY - Happy ISD - 2000 Texas School Survey of Drug and Alcohol Use
http://slidepdf.com/reader/full/swisher-county-happy-isd-2000-texas-school-survey-of-drug-and-alcohol-use 83/113
level in the district
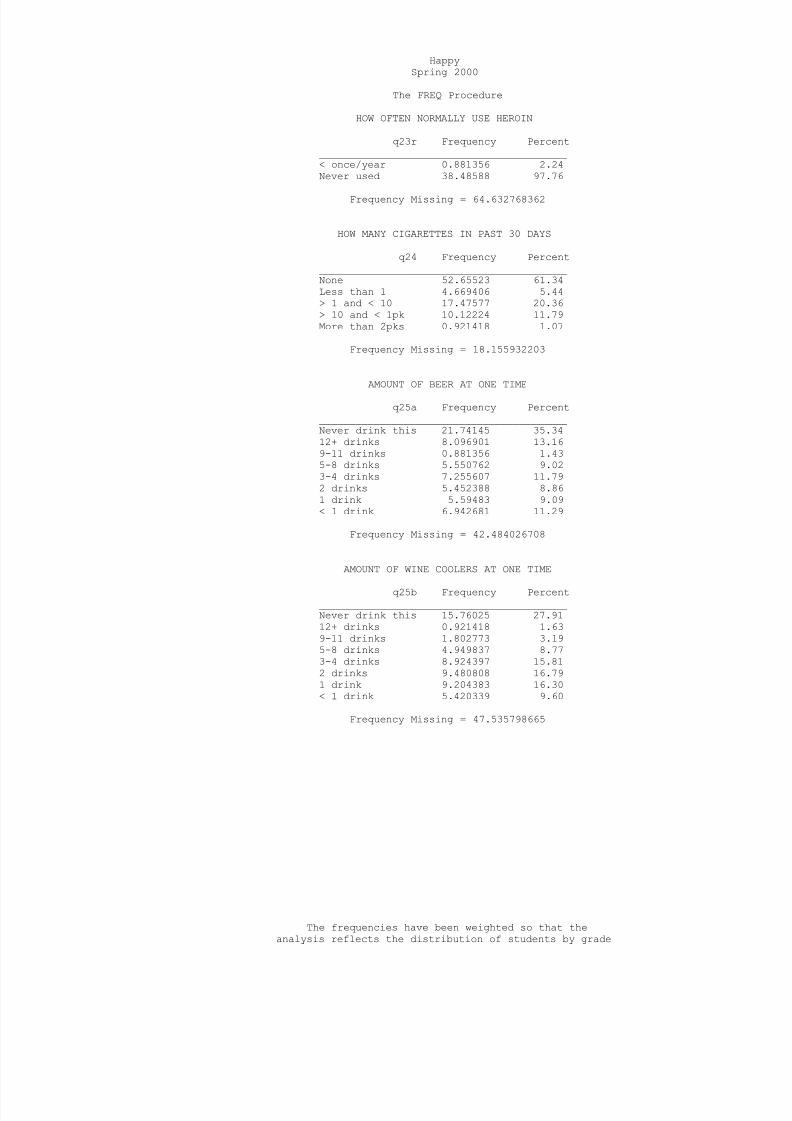
8/14/2019 SWISHER COUNTY - Happy ISD - 2000 Texas School Survey of Drug and Alcohol Use
http://slidepdf.com/reader/full/swisher-county-happy-isd-2000-texas-school-survey-of-drug-and-alcohol-use 84/113
HappySpring 2000
The FREQ Procedure
HOW OFTEN NORMALLY USE HEROIN
q23r Frequency Percent_________________________________________< once/year 0.881356 2.24Never used 38.48588 97.76
Frequency Missing = 64.632768362
HOW MANY CIGARETTES IN PAST 30 DAYS
q24 Frequency Percent_________________________________________None 52.65523 61.34Less than 1 4.669406 5.44> 1 and < 10 17.47577 20.36> 10 and < 1pk 10.12224 11.79More than 2pks 0.921418 1.07
Frequency Missing = 18.155932203
AMOUNT OF BEER AT ONE TIME
q25a Frequency Percent_________________________________________Never drink this 21.74145 35.3412+ drinks 8.096901 13.169-11 drinks 0.881356 1.435-8 drinks 5.550762 9.023-4 drinks 7.255607 11.792 drinks 5.452388 8.861 drink 5.59483 9.09< 1 drink 6.942681 11.29
Frequency Missing = 42.484026708
AMOUNT OF WINE COOLERS AT ONE TIME
q25b Frequency Percent_________________________________________Never drink this 15.76025 27.9112+ drinks 0.921418 1.639-11 drinks 1.802773 3.195-8 drinks 4.949837 8.773-4 drinks 8.924397 15.812 drinks 9.480808 16.791 drink 9.204383 16.30< 1 drink 5.420339 9.60
Frequency Missing = 47.535798665
The frequencies have been weighted so that theanalysis reflects the distribution of students by grade

8/14/2019 SWISHER COUNTY - Happy ISD - 2000 Texas School Survey of Drug and Alcohol Use
http://slidepdf.com/reader/full/swisher-county-happy-isd-2000-texas-school-survey-of-drug-and-alcohol-use 85/113
level in the district
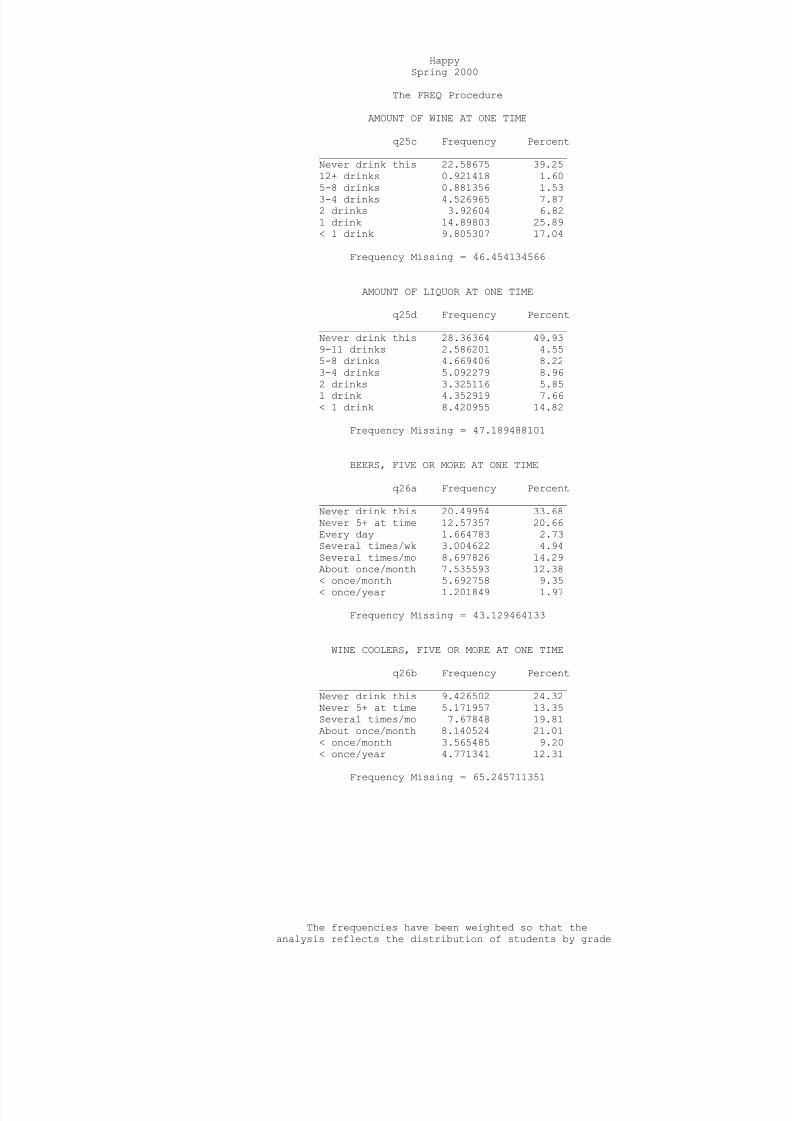
8/14/2019 SWISHER COUNTY - Happy ISD - 2000 Texas School Survey of Drug and Alcohol Use
http://slidepdf.com/reader/full/swisher-county-happy-isd-2000-texas-school-survey-of-drug-and-alcohol-use 86/113
HappySpring 2000
The FREQ Procedure
AMOUNT OF WINE AT ONE TIME
q25c Frequency Percent_________________________________________Never drink this 22.58675 39.2512+ drinks 0.921418 1.605-8 drinks 0.881356 1.533-4 drinks 4.526965 7.872 drinks 3.92604 6.821 drink 14.89803 25.89< 1 drink 9.805307 17.04
Frequency Missing = 46.454134566
AMOUNT OF LIQUOR AT ONE TIME
q25d Frequency Percent_________________________________________Never drink this 28.36364 49.939-11 drinks 2.586201 4.555-8 drinks 4.669406 8.223-4 drinks 5.092279 8.962 drinks 3.325116 5.851 drink 4.352919 7.66< 1 drink 8.420955 14.82
Frequency Missing = 47.189488101
BEERS, FIVE OR MORE AT ONE TIME
q26a Frequency Percent_________________________________________Never drink this 20.49954 33.68Never 5+ at time 12.57357 20.66Every day 1.664783 2.73Several times/wk 3.004622 4.94Several times/mo 8.697826 14.29About once/month 7.535593 12.38
< once/month 5.692758 9.35< once/year 1.201849 1.97
Frequency Missing = 43.129464133
WINE COOLERS, FIVE OR MORE AT ONE TIME
q26b Frequency Percent_________________________________________Never drink this 9.426502 24.32Never 5+ at time 5.171957 13.35Several times/mo 7.67848 19.81About once/month 8.140524 21.01< once/month 3.565485 9.20< once/year 4.771341 12.31
Frequency Missing = 65.245711351
The frequencies have been weighted so that theanalysis reflects the distribution of students by grade

8/14/2019 SWISHER COUNTY - Happy ISD - 2000 Texas School Survey of Drug and Alcohol Use
http://slidepdf.com/reader/full/swisher-county-happy-isd-2000-texas-school-survey-of-drug-and-alcohol-use 87/113
level in the district
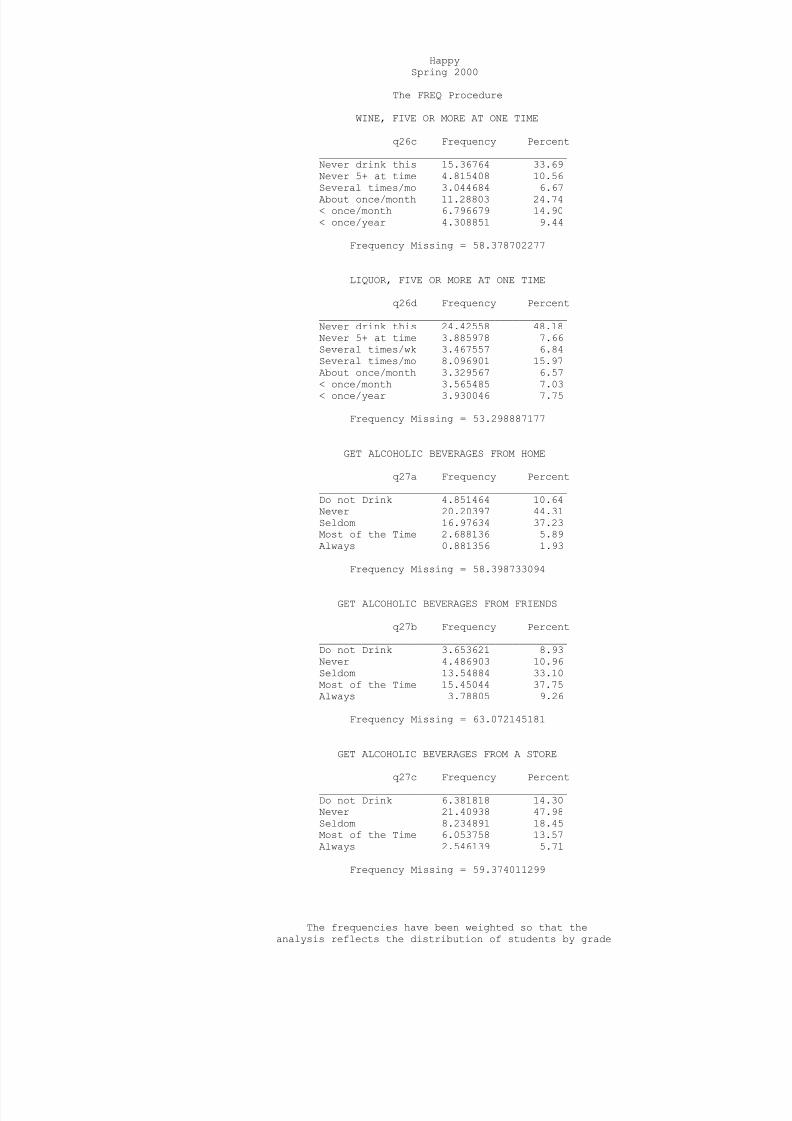
8/14/2019 SWISHER COUNTY - Happy ISD - 2000 Texas School Survey of Drug and Alcohol Use
http://slidepdf.com/reader/full/swisher-county-happy-isd-2000-texas-school-survey-of-drug-and-alcohol-use 88/113
HappySpring 2000
The FREQ Procedure
WINE, FIVE OR MORE AT ONE TIME
q26c Frequency Percent_________________________________________Never drink this 15.36764 33.69Never 5+ at time 4.815408 10.56Several times/mo 3.044684 6.67About once/month 11.28803 24.74< once/month 6.796679 14.90< once/year 4.308851 9.44
Frequency Missing = 58.378702277
LIQUOR, FIVE OR MORE AT ONE TIME
q26d Frequency Percent_________________________________________Never drink this 24.42558 48.18Never 5+ at time 3.885978 7.66Several times/wk 3.467557 6.84Several times/mo 8.096901 15.97About once/month 3.329567 6.57< once/month 3.565485 7.03< once/year 3.930046 7.75
Frequency Missing = 53.298887177
GET ALCOHOLIC BEVERAGES FROM HOME
q27a Frequency Percent_________________________________________Do not Drink 4.851464 10.64Never 20.20397 44.31Seldom 16.97634 37.23Most of the Time 2.688136 5.89Always 0.881356 1.93
Frequency Missing = 58.398733094
GET ALCOHOLIC BEVERAGES FROM FRIENDS
q27b Frequency Percent_________________________________________Do not Drink 3.653621 8.93Never 4.486903 10.96Seldom 13.54884 33.10Most of the Time 15.45044 37.75Always 3.78805 9.26
Frequency Missing = 63.072145181
GET ALCOHOLIC BEVERAGES FROM A STORE
q27c Frequency Percent_________________________________________Do not Drink 6.381818 14.30Never 21.40938 47.98Seldom 8.234891 18.45Most of the Time 6.053758 13.57Always 2.546139 5.71
Frequency Missing = 59.374011299
The frequencies have been weighted so that theanalysis reflects the distribution of students by grade

8/14/2019 SWISHER COUNTY - Happy ISD - 2000 Texas School Survey of Drug and Alcohol Use
http://slidepdf.com/reader/full/swisher-county-happy-isd-2000-texas-school-survey-of-drug-and-alcohol-use 89/113
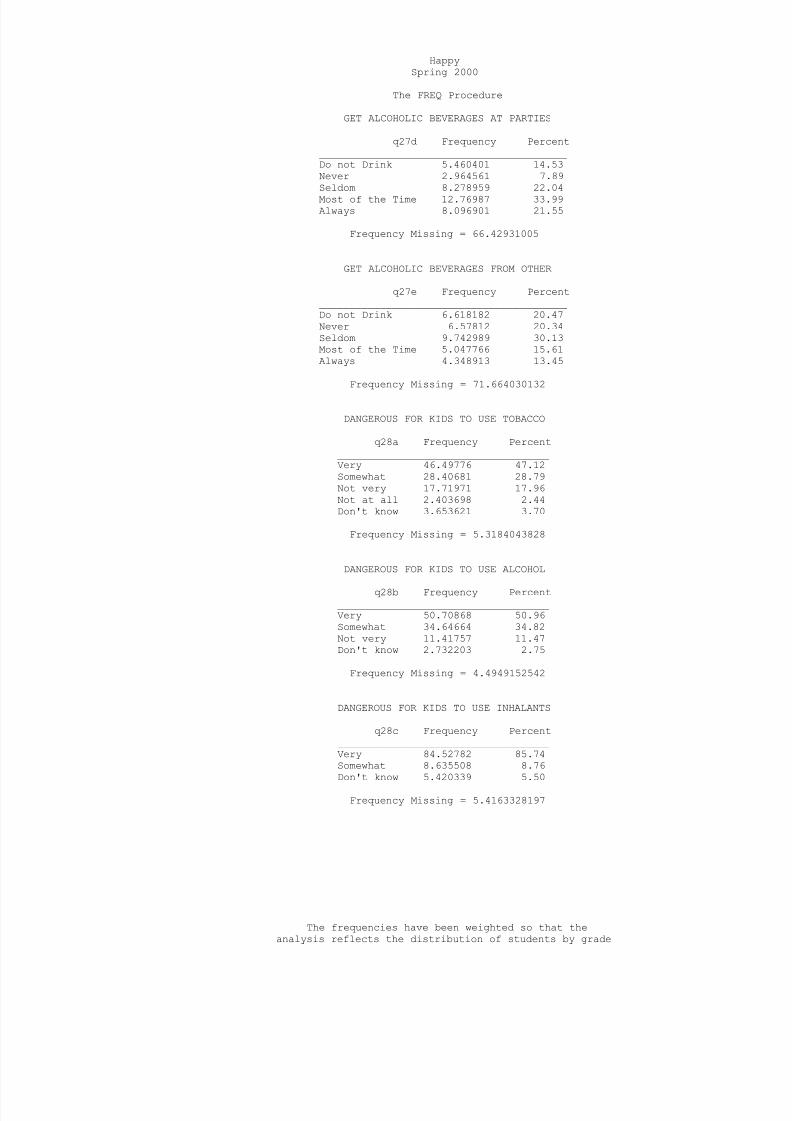
8/14/2019 SWISHER COUNTY - Happy ISD - 2000 Texas School Survey of Drug and Alcohol Use
http://slidepdf.com/reader/full/swisher-county-happy-isd-2000-texas-school-survey-of-drug-and-alcohol-use 90/113
HappySpring 2000
The FREQ Procedure
GET ALCOHOLIC BEVERAGES AT PARTIES
q27d Frequency Percent_________________________________________Do not Drink 5.460401 14.53Never 2.964561 7.89Seldom 8.278959 22.04Most of the Time 12.76987 33.99Always 8.096901 21.55
Frequency Missing = 66.42931005
GET ALCOHOLIC BEVERAGES FROM OTHER
q27e Frequency Percent_________________________________________Do not Drink 6.618182 20.47Never 6.57812 20.34Seldom 9.742989 30.13Most of the Time 5.047766 15.61Always 4.348913 13.45
Frequency Missing = 71.664030132
DANGEROUS FOR KIDS TO USE TOBACCO
q28a Frequency Percent___________________________________Very 46.49776 47.12Somewhat 28.40681 28.79Not very 17.71971 17.96Not at all 2.403698 2.44Don't know 3.653621 3.70
Frequency Missing = 5.3184043828
DANGEROUS FOR KIDS TO USE ALCOHOL
q28b Frequency Percent___________________________________Very 50.70868 50.96Somewhat 34.64664 34.82Not very 11.41757 11.47Don't know 2.732203 2.75
Frequency Missing = 4.4949152542
DANGEROUS FOR KIDS TO USE INHALANTS
q28c Frequency Percent___________________________________Very 84.52782 85.74Somewhat 8.635508 8.76
Don't know 5.420339 5.50
Frequency Missing = 5.4163328197
The frequencies have been weighted so that theanalysis reflects the distribution of students by grade

8/14/2019 SWISHER COUNTY - Happy ISD - 2000 Texas School Survey of Drug and Alcohol Use
http://slidepdf.com/reader/full/swisher-county-happy-isd-2000-texas-school-survey-of-drug-and-alcohol-use 91/113
level in the district
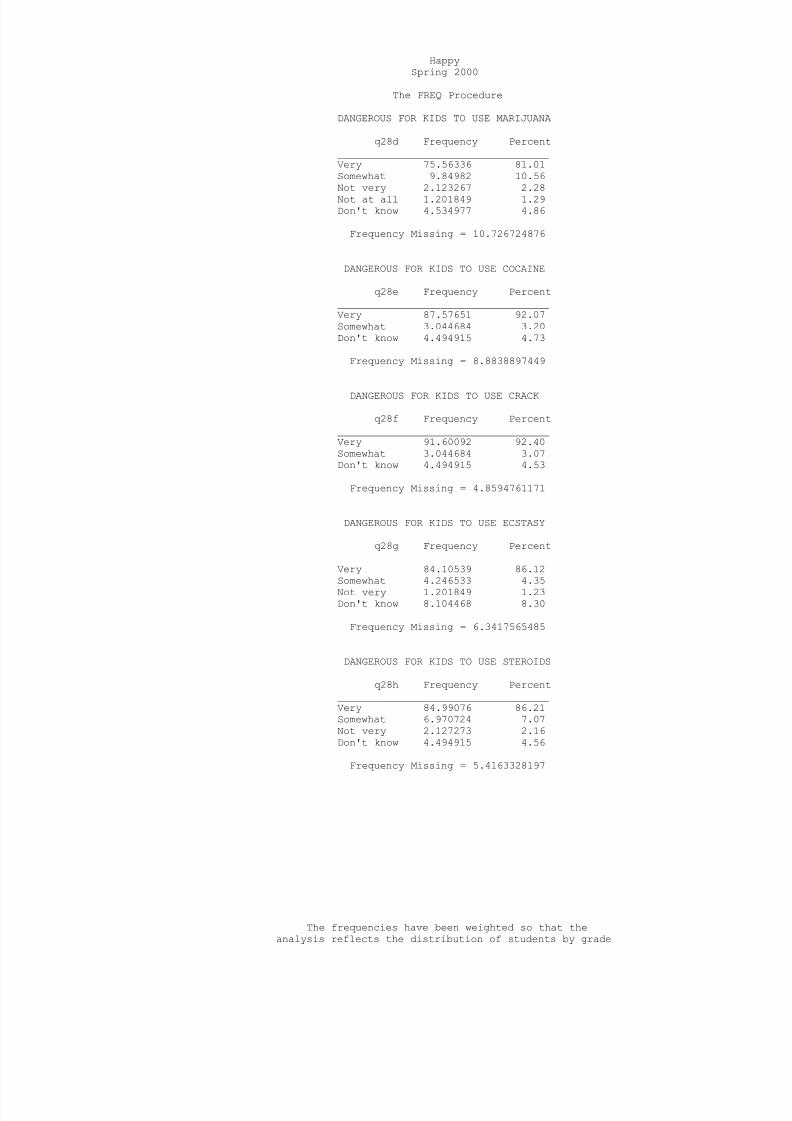
8/14/2019 SWISHER COUNTY - Happy ISD - 2000 Texas School Survey of Drug and Alcohol Use
http://slidepdf.com/reader/full/swisher-county-happy-isd-2000-texas-school-survey-of-drug-and-alcohol-use 92/113
HappySpring 2000
The FREQ Procedure
DANGEROUS FOR KIDS TO USE MARIJUANA
q28d Frequency Percent___________________________________Very 75.56336 81.01Somewhat 9.84982 10.56Not very 2.123267 2.28Not at all 1.201849 1.29Don't know 4.534977 4.86
Frequency Missing = 10.726724876
DANGEROUS FOR KIDS TO USE COCAINE
q28e Frequency Percent___________________________________Very 87.57651 92.07Somewhat 3.044684 3.20Don't know 4.494915 4.73
Frequency Missing = 8.8838897449
DANGEROUS FOR KIDS TO USE CRACK
q28f Frequency Percent___________________________________Very 91.60092 92.40Somewhat 3.044684 3.07Don't know 4.494915 4.53
Frequency Missing = 4.8594761171
DANGEROUS FOR KIDS TO USE ECSTASY
q28g Frequency Percent___________________________________Very 84.10539 86.12
Somewhat 4.246533 4.35Not very 1.201849 1.23Don't know 8.104468 8.30
Frequency Missing = 6.3417565485
DANGEROUS FOR KIDS TO USE STEROIDS
q28h Frequency Percent___________________________________Very 84.99076 86.21Somewhat 6.970724 7.07Not very 2.127273 2.16Don't know 4.494915 4.56
Frequency Missing = 5.4163328197
The frequencies have been weighted so that theanalysis reflects the distribution of students by grade

8/14/2019 SWISHER COUNTY - Happy ISD - 2000 Texas School Survey of Drug and Alcohol Use
http://slidepdf.com/reader/full/swisher-county-happy-isd-2000-texas-school-survey-of-drug-and-alcohol-use 93/113
level in the district
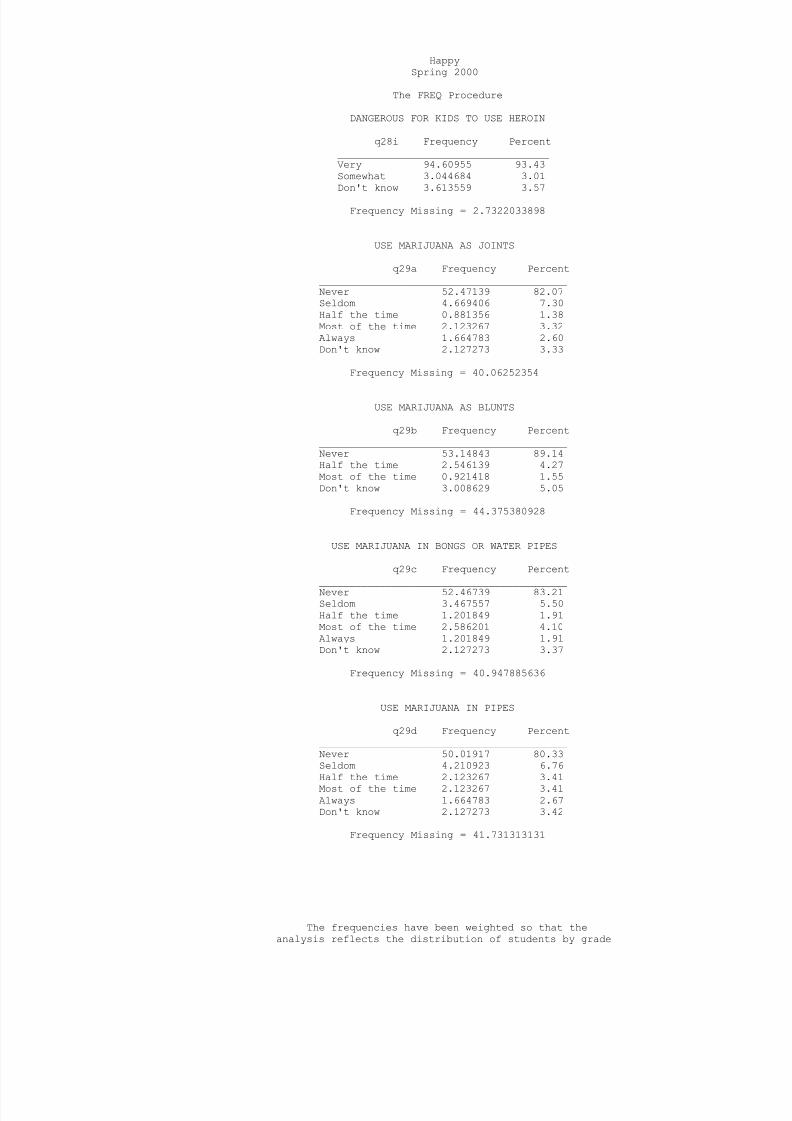
8/14/2019 SWISHER COUNTY - Happy ISD - 2000 Texas School Survey of Drug and Alcohol Use
http://slidepdf.com/reader/full/swisher-county-happy-isd-2000-texas-school-survey-of-drug-and-alcohol-use 94/113
HappySpring 2000
The FREQ Procedure
DANGEROUS FOR KIDS TO USE HEROIN
q28i Frequency Percent___________________________________Very 94.60955 93.43Somewhat 3.044684 3.01Don't know 3.613559 3.57
Frequency Missing = 2.7322033898
USE MARIJUANA AS JOINTS
q29a Frequency Percent_________________________________________Never 52.47139 82.07Seldom 4.669406 7.30Half the time 0.881356 1.38Most of the time 2.123267 3.32Always 1.664783 2.60Don't know 2.127273 3.33
Frequency Missing = 40.06252354
USE MARIJUANA AS BLUNTS
q29b Frequency Percent_________________________________________Never 53.14843 89.14Half the time 2.546139 4.27Most of the time 0.921418 1.55Don't know 3.008629 5.05
Frequency Missing = 44.375380928
USE MARIJUANA IN BONGS OR WATER PIPES
q29c Frequency Percent
_________________________________________Never 52.46739 83.21Seldom 3.467557 5.50Half the time 1.201849 1.91Most of the time 2.586201 4.10Always 1.201849 1.91Don't know 2.127273 3.37
Frequency Missing = 40.947885636
USE MARIJUANA IN PIPES
q29d Frequency Percent_________________________________________Never 50.01917 80.33Seldom 4.210923 6.76
Half the time 2.123267 3.41Most of the time 2.123267 3.41Always 1.664783 2.67Don't know 2.127273 3.42
Frequency Missing = 41.731313131
The frequencies have been weighted so that theanalysis reflects the distribution of students by grade

8/14/2019 SWISHER COUNTY - Happy ISD - 2000 Texas School Survey of Drug and Alcohol Use
http://slidepdf.com/reader/full/swisher-county-happy-isd-2000-texas-school-survey-of-drug-and-alcohol-use 95/113
level in the district
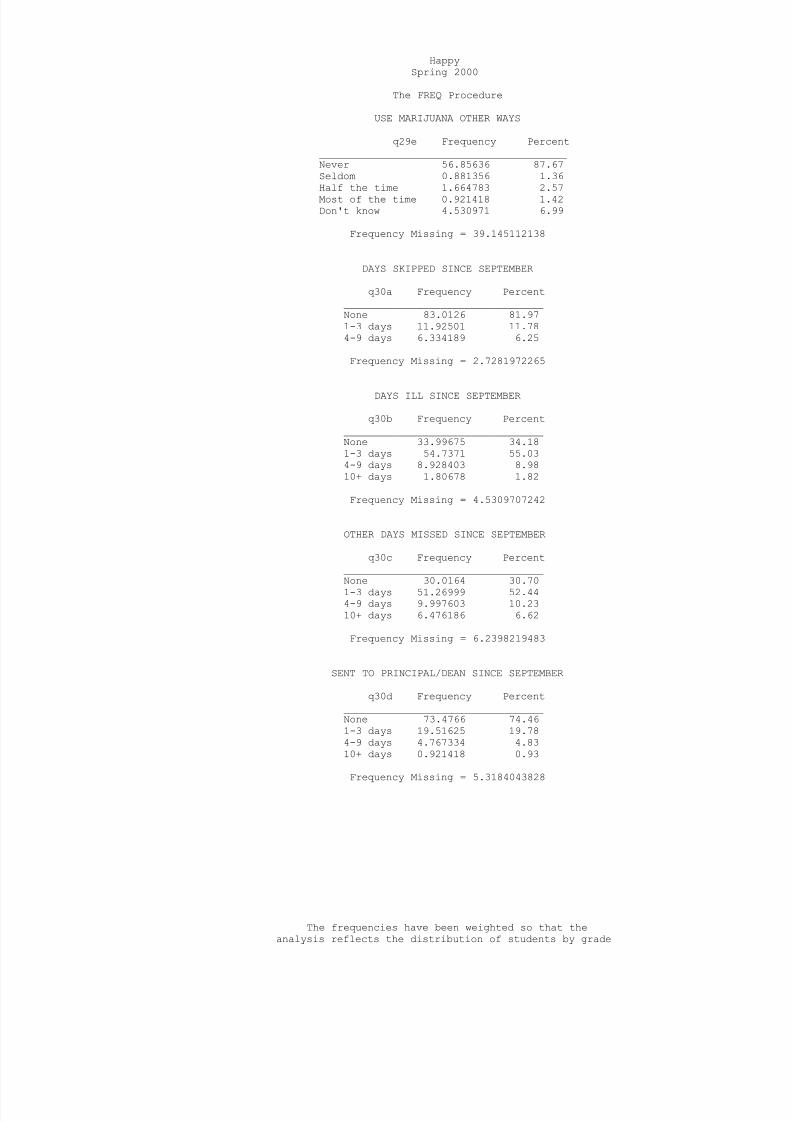
8/14/2019 SWISHER COUNTY - Happy ISD - 2000 Texas School Survey of Drug and Alcohol Use
http://slidepdf.com/reader/full/swisher-county-happy-isd-2000-texas-school-survey-of-drug-and-alcohol-use 96/113
HappySpring 2000
The FREQ Procedure
USE MARIJUANA OTHER WAYS
q29e Frequency Percent_________________________________________Never 56.85636 87.67Seldom 0.881356 1.36Half the time 1.664783 2.57Most of the time 0.921418 1.42Don't know 4.530971 6.99
Frequency Missing = 39.145112138
DAYS SKIPPED SINCE SEPTEMBER
q30a Frequency Percent_________________________________None 83.0126 81.971-3 days 11.92501 11.784-9 days 6.334189 6.25
Frequency Missing = 2.7281972265
DAYS ILL SINCE SEPTEMBER
q30b Frequency Percent_________________________________None 33.99675 34.181-3 days 54.7371 55.034-9 days 8.928403 8.9810+ days 1.80678 1.82
Frequency Missing = 4.5309707242
OTHER DAYS MISSED SINCE SEPTEMBER
q30c Frequency Percent_________________________________
None 30.0164 30.701-3 days 51.26999 52.444-9 days 9.997603 10.2310+ days 6.476186 6.62
Frequency Missing = 6.2398219483
SENT TO PRINCIPAL/DEAN SINCE SEPTEMBER
q30d Frequency Percent_________________________________None 73.4766 74.461-3 days 19.51625 19.784-9 days 4.767334 4.8310+ days 0.921418 0.93
Frequency Missing = 5.3184043828
The frequencies have been weighted so that theanalysis reflects the distribution of students by grade

8/14/2019 SWISHER COUNTY - Happy ISD - 2000 Texas School Survey of Drug and Alcohol Use
http://slidepdf.com/reader/full/swisher-county-happy-isd-2000-texas-school-survey-of-drug-and-alcohol-use 97/113
level in the district
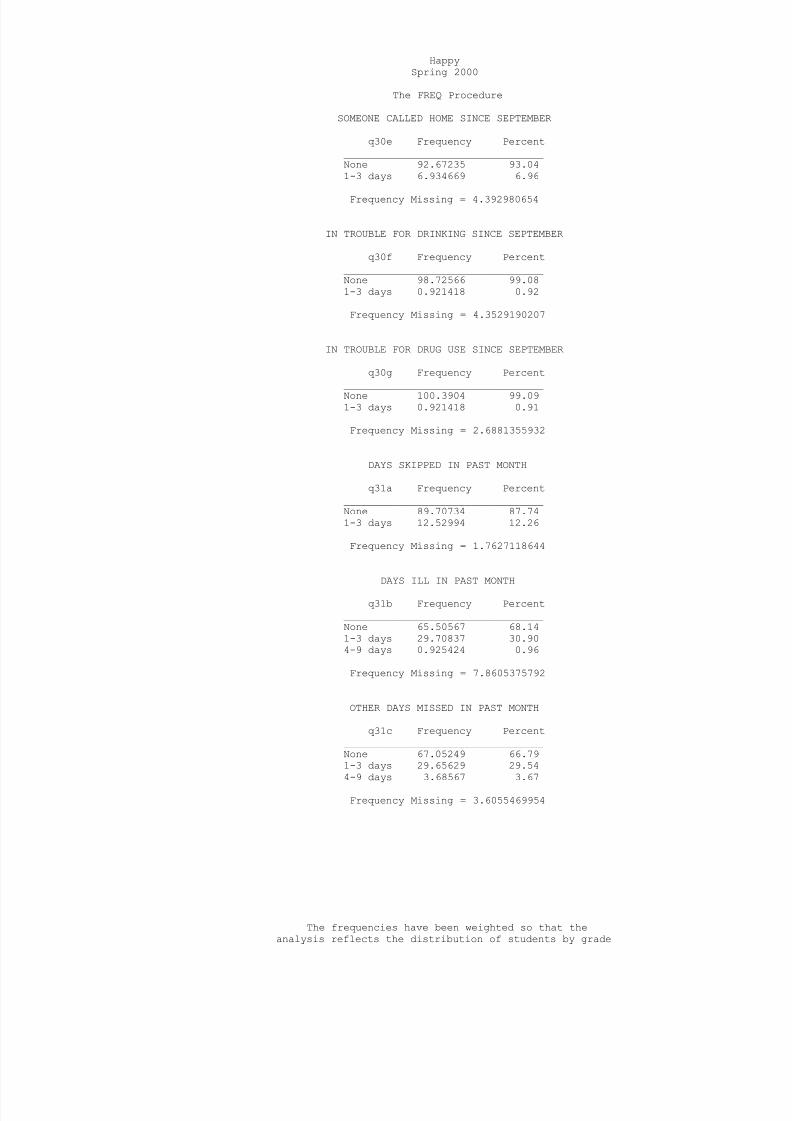
8/14/2019 SWISHER COUNTY - Happy ISD - 2000 Texas School Survey of Drug and Alcohol Use
http://slidepdf.com/reader/full/swisher-county-happy-isd-2000-texas-school-survey-of-drug-and-alcohol-use 98/113
HappySpring 2000
The FREQ Procedure
SOMEONE CALLED HOME SINCE SEPTEMBER
q30e Frequency Percent_________________________________None 92.67235 93.041-3 days 6.934669 6.96
Frequency Missing = 4.392980654
IN TROUBLE FOR DRINKING SINCE SEPTEMBER
q30f Frequency Percent_________________________________None 98.72566 99.081-3 days 0.921418 0.92
Frequency Missing = 4.3529190207
IN TROUBLE FOR DRUG USE SINCE SEPTEMBER
q30g Frequency Percent_________________________________None 100.3904 99.091-3 days 0.921418 0.91
Frequency Missing = 2.6881355932
DAYS SKIPPED IN PAST MONTH
q31a Frequency Percent_________________________________None 89.70734 87.741-3 days 12.52994 12.26
Frequency Missing = 1.7627118644
DAYS ILL IN PAST MONTH q31b Frequency Percent
_________________________________None 65.50567 68.141-3 days 29.70837 30.904-9 days 0.925424 0.96
Frequency Missing = 7.8605375792
OTHER DAYS MISSED IN PAST MONTH
q31c Frequency Percent_________________________________None 67.05249 66.791-3 days 29.65629 29.54
4-9 days 3.68567 3.67
Frequency Missing = 3.6055469954
The frequencies have been weighted so that theanalysis reflects the distribution of students by grade

8/14/2019 SWISHER COUNTY - Happy ISD - 2000 Texas School Survey of Drug and Alcohol Use
http://slidepdf.com/reader/full/swisher-county-happy-isd-2000-texas-school-survey-of-drug-and-alcohol-use 99/113
level in the district
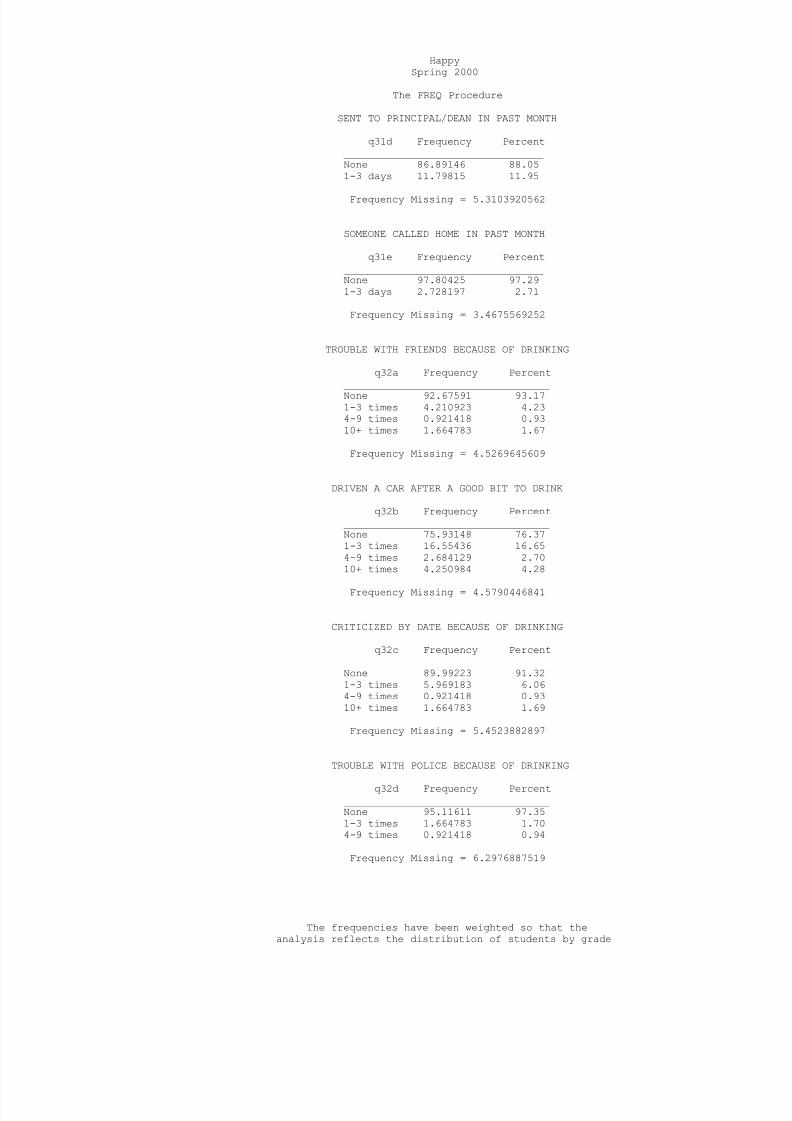
8/14/2019 SWISHER COUNTY - Happy ISD - 2000 Texas School Survey of Drug and Alcohol Use
http://slidepdf.com/reader/full/swisher-county-happy-isd-2000-texas-school-survey-of-drug-and-alcohol-use 100/113
HappySpring 2000
The FREQ Procedure
SENT TO PRINCIPAL/DEAN IN PAST MONTH
q31d Frequency Percent_________________________________None 86.89146 88.051-3 days 11.79815 11.95
Frequency Missing = 5.3103920562
SOMEONE CALLED HOME IN PAST MONTH
q31e Frequency Percent_________________________________None 97.80425 97.291-3 days 2.728197 2.71
Frequency Missing = 3.4675569252
TROUBLE WITH FRIENDS BECAUSE OF DRINKING
q32a Frequency Percent__________________________________None 92.67591 93.171-3 times 4.210923 4.234-9 times 0.921418 0.9310+ times 1.664783 1.67
Frequency Missing = 4.5269645609
DRIVEN A CAR AFTER A GOOD BIT TO DRINK
q32b Frequency Percent__________________________________None 75.93148 76.371-3 times 16.55436 16.654-9 times 2.684129 2.7010+ times 4.250984 4.28
Frequency Missing = 4.5790446841
CRITICIZED BY DATE BECAUSE OF DRINKING
q32c Frequency Percent__________________________________None 89.99223 91.321-3 times 5.969183 6.064-9 times 0.921418 0.9310+ times 1.664783 1.69
Frequency Missing = 5.4523882897
TROUBLE WITH POLICE BECAUSE OF DRINKING
q32d Frequency Percent__________________________________None 95.11611 97.351-3 times 1.664783 1.704-9 times 0.921418 0.94
Frequency Missing = 6.2976887519
The frequencies have been weighted so that theanalysis reflects the distribution of students by grade

8/14/2019 SWISHER COUNTY - Happy ISD - 2000 Texas School Survey of Drug and Alcohol Use
http://slidepdf.com/reader/full/swisher-county-happy-isd-2000-texas-school-survey-of-drug-and-alcohol-use 101/113
level in the district
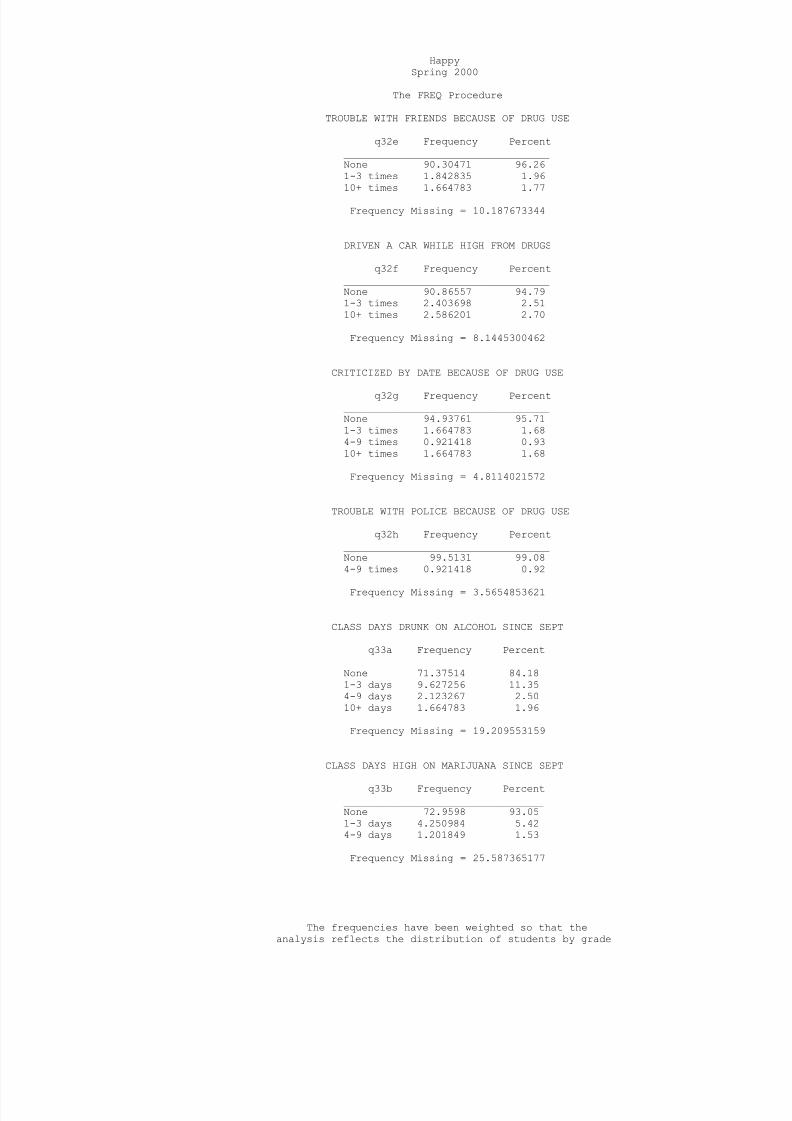
8/14/2019 SWISHER COUNTY - Happy ISD - 2000 Texas School Survey of Drug and Alcohol Use
http://slidepdf.com/reader/full/swisher-county-happy-isd-2000-texas-school-survey-of-drug-and-alcohol-use 102/113
HappySpring 2000
The FREQ Procedure
TROUBLE WITH FRIENDS BECAUSE OF DRUG USE
q32e Frequency Percent__________________________________None 90.30471 96.261-3 times 1.842835 1.9610+ times 1.664783 1.77
Frequency Missing = 10.187673344
DRIVEN A CAR WHILE HIGH FROM DRUGS
q32f Frequency Percent__________________________________None 90.86557 94.791-3 times 2.403698 2.5110+ times 2.586201 2.70
Frequency Missing = 8.1445300462
CRITICIZED BY DATE BECAUSE OF DRUG USE
q32g Frequency Percent__________________________________None 94.93761 95.711-3 times 1.664783 1.684-9 times 0.921418 0.9310+ times 1.664783 1.68
Frequency Missing = 4.8114021572
TROUBLE WITH POLICE BECAUSE OF DRUG USE
q32h Frequency Percent__________________________________None 99.5131 99.084-9 times 0.921418 0.92
Frequency Missing = 3.5654853621
CLASS DAYS DRUNK ON ALCOHOL SINCE SEPT
q33a Frequency Percent_________________________________None 71.37514 84.181-3 days 9.627256 11.354-9 days 2.123267 2.5010+ days 1.664783 1.96
Frequency Missing = 19.209553159
CLASS DAYS HIGH ON MARIJUANA SINCE SEPT
q33b Frequency Percent_________________________________None 72.9598 93.051-3 days 4.250984 5.424-9 days 1.201849 1.53
Frequency Missing = 25.587365177
The frequencies have been weighted so that theanalysis reflects the distribution of students by grade

8/14/2019 SWISHER COUNTY - Happy ISD - 2000 Texas School Survey of Drug and Alcohol Use
http://slidepdf.com/reader/full/swisher-county-happy-isd-2000-texas-school-survey-of-drug-and-alcohol-use 103/113
level in the district
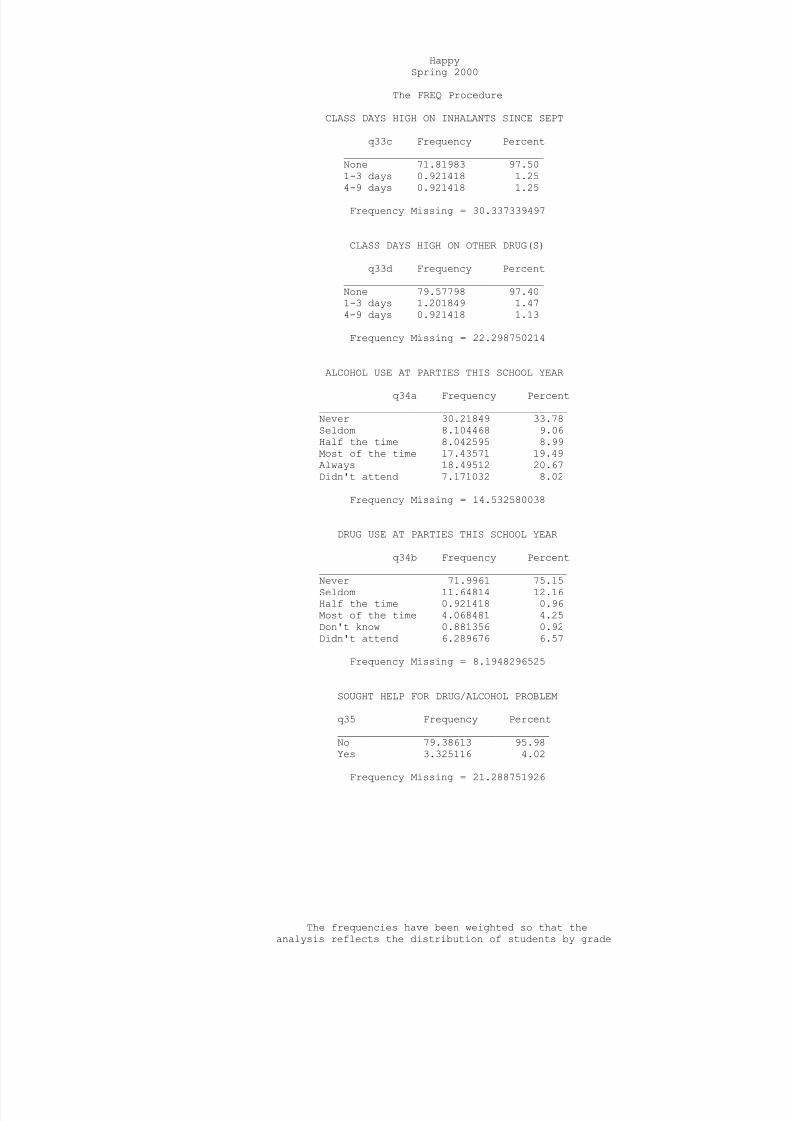
8/14/2019 SWISHER COUNTY - Happy ISD - 2000 Texas School Survey of Drug and Alcohol Use
http://slidepdf.com/reader/full/swisher-county-happy-isd-2000-texas-school-survey-of-drug-and-alcohol-use 104/113

8/14/2019 SWISHER COUNTY - Happy ISD - 2000 Texas School Survey of Drug and Alcohol Use
http://slidepdf.com/reader/full/swisher-county-happy-isd-2000-texas-school-survey-of-drug-and-alcohol-use 105/113
level in the district
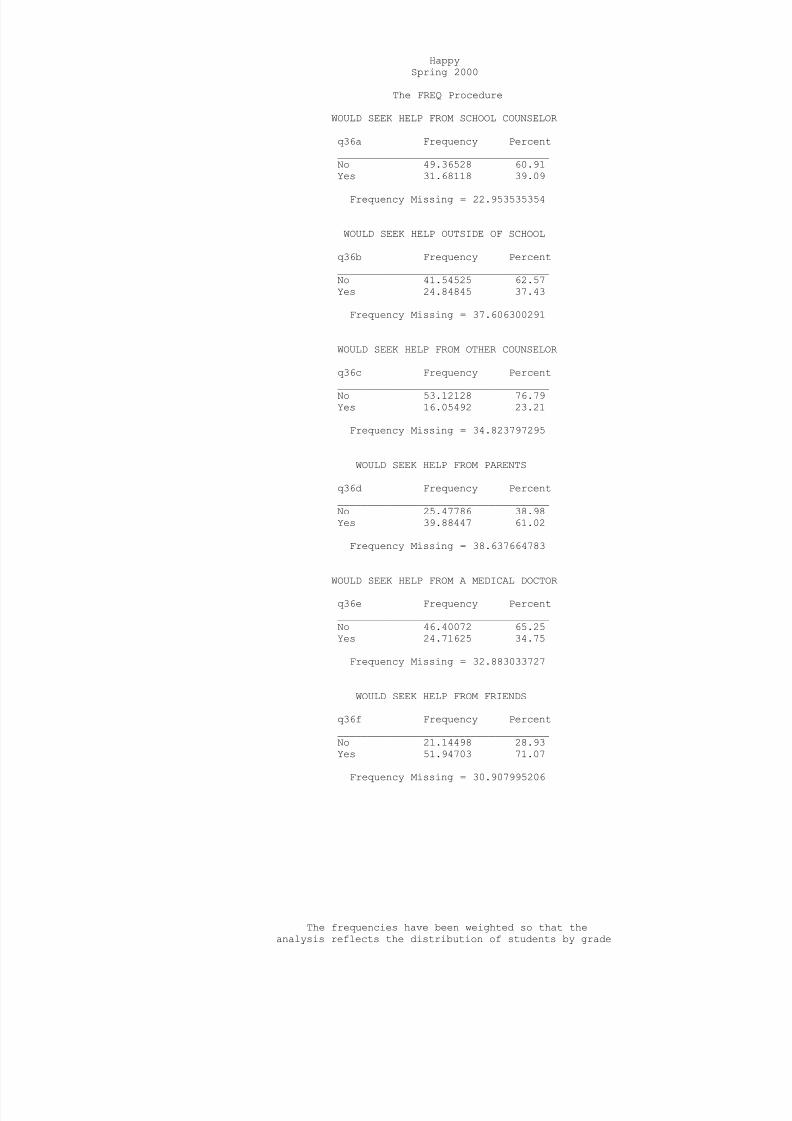
8/14/2019 SWISHER COUNTY - Happy ISD - 2000 Texas School Survey of Drug and Alcohol Use
http://slidepdf.com/reader/full/swisher-county-happy-isd-2000-texas-school-survey-of-drug-and-alcohol-use 106/113

8/14/2019 SWISHER COUNTY - Happy ISD - 2000 Texas School Survey of Drug and Alcohol Use
http://slidepdf.com/reader/full/swisher-county-happy-isd-2000-texas-school-survey-of-drug-and-alcohol-use 107/113
level in the district
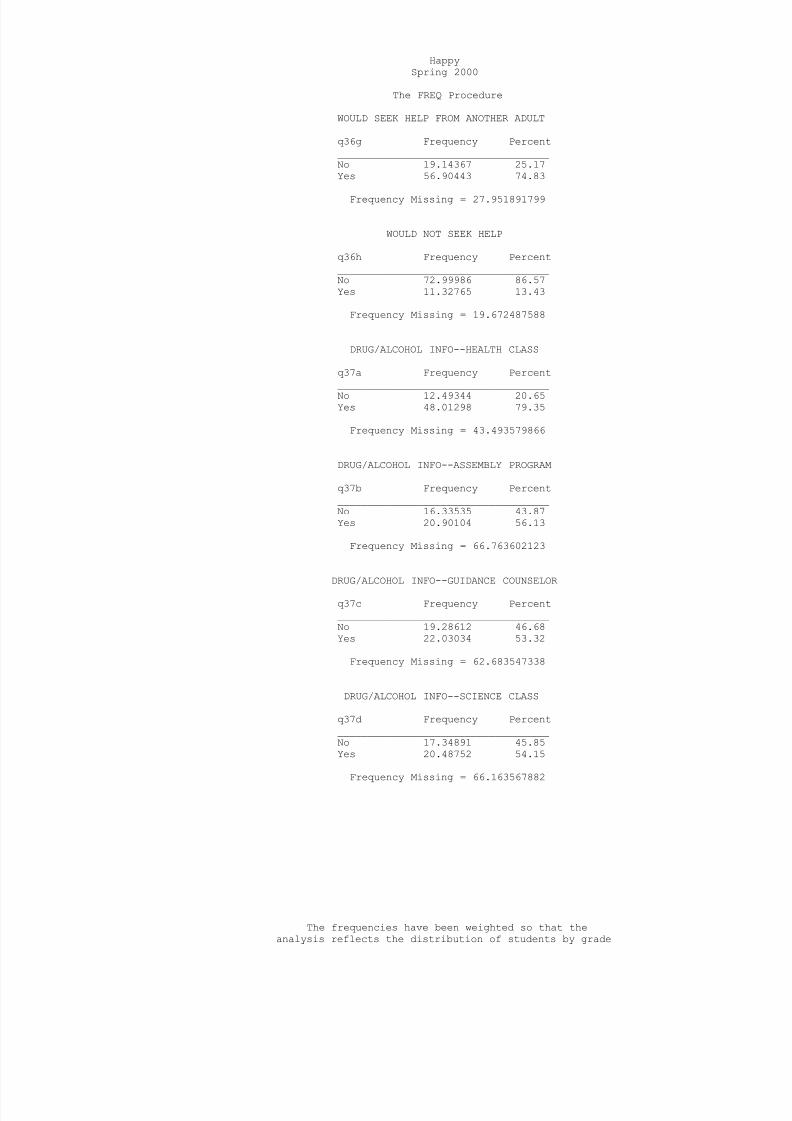
8/14/2019 SWISHER COUNTY - Happy ISD - 2000 Texas School Survey of Drug and Alcohol Use
http://slidepdf.com/reader/full/swisher-county-happy-isd-2000-texas-school-survey-of-drug-and-alcohol-use 108/113
HappySpring 2000
The FREQ Procedure
WOULD SEEK HELP FROM ANOTHER ADULT
q36g Frequency Percent___________________________________No 19.14367 25.17Yes 56.90443 74.83
Frequency Missing = 27.951891799
WOULD NOT SEEK HELP
q36h Frequency Percent___________________________________No 72.99986 86.57Yes 11.32765 13.43
Frequency Missing = 19.672487588
DRUG/ALCOHOL INFO--HEALTH CLASS
q37a Frequency Percent___________________________________No 12.49344 20.65Yes 48.01298 79.35
Frequency Missing = 43.493579866
DRUG/ALCOHOL INFO--ASSEMBLY PROGRAM
q37b Frequency Percent___________________________________No 16.33535 43.87Yes 20.90104 56.13
Frequency Missing = 66.763602123
DRUG/ALCOHOL INFO--GUIDANCE COUNSELOR q37c Frequency Percent___________________________________No 19.28612 46.68Yes 22.03034 53.32
Frequency Missing = 62.683547338
DRUG/ALCOHOL INFO--SCIENCE CLASS
q37d Frequency Percent___________________________________No 17.34891 45.85Yes 20.48752 54.15
Frequency Missing = 66.163567882
The frequencies have been weighted so that theanalysis reflects the distribution of students by grade

8/14/2019 SWISHER COUNTY - Happy ISD - 2000 Texas School Survey of Drug and Alcohol Use
http://slidepdf.com/reader/full/swisher-county-happy-isd-2000-texas-school-survey-of-drug-and-alcohol-use 109/113
level in the district
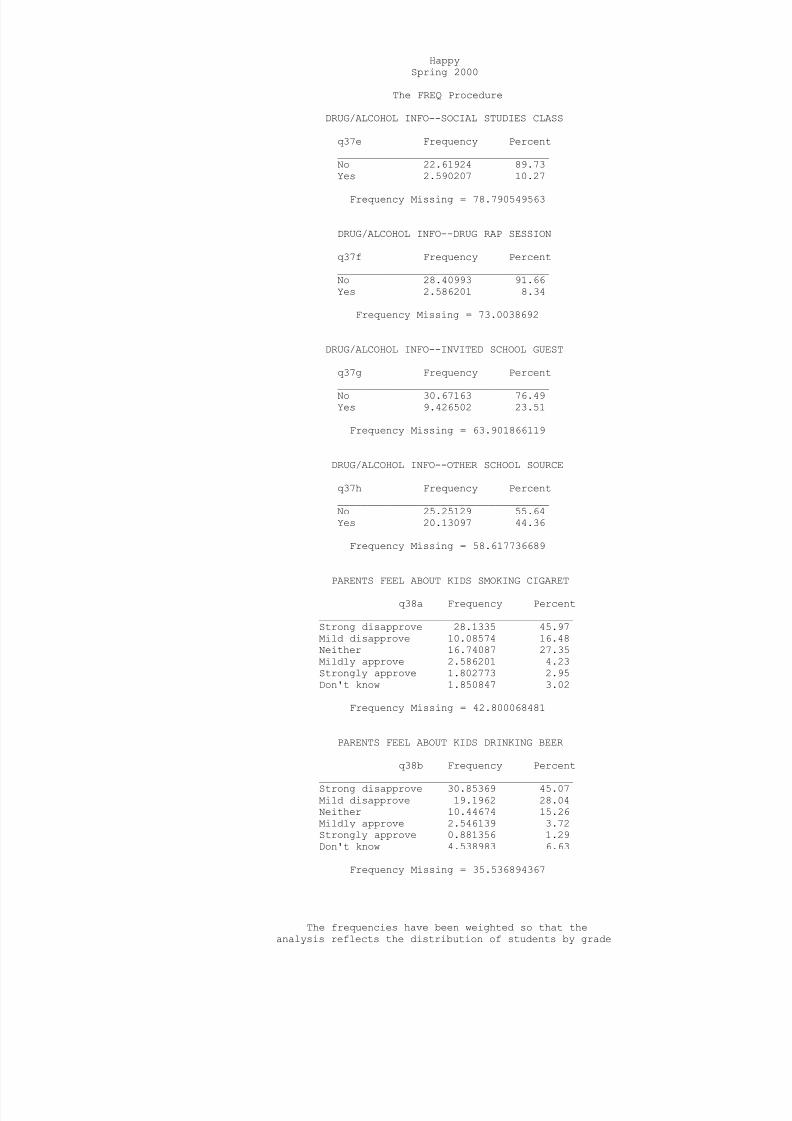
8/14/2019 SWISHER COUNTY - Happy ISD - 2000 Texas School Survey of Drug and Alcohol Use
http://slidepdf.com/reader/full/swisher-county-happy-isd-2000-texas-school-survey-of-drug-and-alcohol-use 110/113
HappySpring 2000
The FREQ Procedure
DRUG/ALCOHOL INFO--SOCIAL STUDIES CLASS
q37e Frequency Percent___________________________________No 22.61924 89.73Yes 2.590207 10.27
Frequency Missing = 78.790549563
DRUG/ALCOHOL INFO--DRUG RAP SESSION
q37f Frequency Percent___________________________________No 28.40993 91.66Yes 2.586201 8.34
Frequency Missing = 73.0038692
DRUG/ALCOHOL INFO--INVITED SCHOOL GUEST
q37g Frequency Percent___________________________________No 30.67163 76.49Yes 9.426502 23.51
Frequency Missing = 63.901866119
DRUG/ALCOHOL INFO--OTHER SCHOOL SOURCE
q37h Frequency Percent___________________________________No 25.25129 55.64Yes 20.13097 44.36
Frequency Missing = 58.617736689
PARENTS FEEL ABOUT KIDS SMOKING CIGARET q38a Frequency Percent
__________________________________________Strong disapprove 28.1335 45.97Mild disapprove 10.08574 16.48Neither 16.74087 27.35Mildly approve 2.586201 4.23Strongly approve 1.802773 2.95Don't know 1.850847 3.02
Frequency Missing = 42.800068481
PARENTS FEEL ABOUT KIDS DRINKING BEER
q38b Frequency Percent
__________________________________________Strong disapprove 30.85369 45.07Mild disapprove 19.1962 28.04Neither 10.44674 15.26Mildly approve 2.546139 3.72Strongly approve 0.881356 1.29Don't know 4.538983 6.63
Frequency Missing = 35.536894367
The frequencies have been weighted so that theanalysis reflects the distribution of students by grade

8/14/2019 SWISHER COUNTY - Happy ISD - 2000 Texas School Survey of Drug and Alcohol Use
http://slidepdf.com/reader/full/swisher-county-happy-isd-2000-texas-school-survey-of-drug-and-alcohol-use 111/113
level in the district
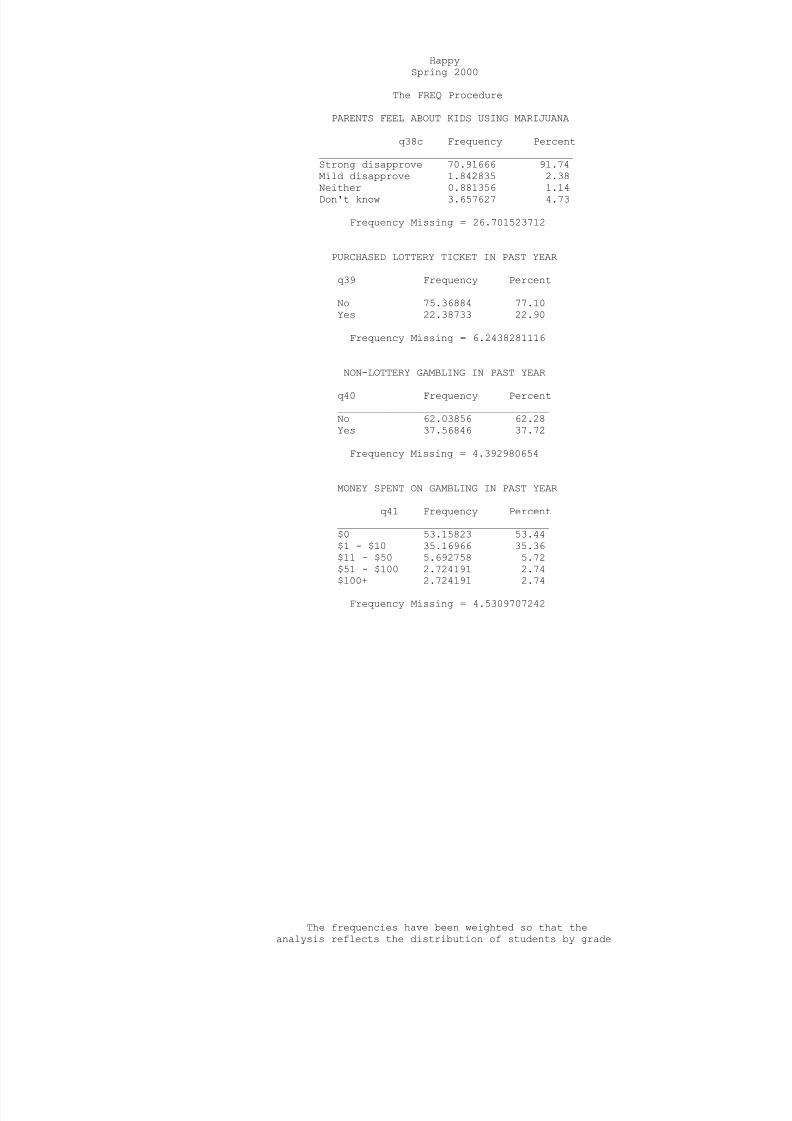
8/14/2019 SWISHER COUNTY - Happy ISD - 2000 Texas School Survey of Drug and Alcohol Use
http://slidepdf.com/reader/full/swisher-county-happy-isd-2000-texas-school-survey-of-drug-and-alcohol-use 112/113
HappySpring 2000
The FREQ Procedure
PARENTS FEEL ABOUT KIDS USING MARIJUANA
q38c Frequency Percent__________________________________________Strong disapprove 70.91666 91.74Mild disapprove 1.842835 2.38Neither 0.881356 1.14Don't know 3.657627 4.73
Frequency Missing = 26.701523712
PURCHASED LOTTERY TICKET IN PAST YEAR
q39 Frequency Percent___________________________________No 75.36884 77.10Yes 22.38733 22.90
Frequency Missing = 6.2438281116
NON-LOTTERY GAMBLING IN PAST YEAR
q40 Frequency Percent___________________________________No 62.03856 62.28Yes 37.56846 37.72
Frequency Missing = 4.392980654
MONEY SPENT ON GAMBLING IN PAST YEAR
q41 Frequency Percent___________________________________$0 53.15823 53.44$1 - $10 35.16966 35.36$11 - $50 5.692758 5.72$51 - $100 2.724191 2.74
$100+ 2.724191 2.74Frequency Missing = 4.5309707242
The frequencies have been weighted so that theanalysis reflects the distribution of students by grade

8/14/2019 SWISHER COUNTY - Happy ISD - 2000 Texas School Survey of Drug and Alcohol Use
http://slidepdf.com/reader/full/swisher-county-happy-isd-2000-texas-school-survey-of-drug-and-alcohol-use 113/113
level in the district