Embed Size (px)
Citation preview

Thursday, 19 February 2015
SWCC’s Plan to Satisfy Future Water Demands
in Saudi Arabia
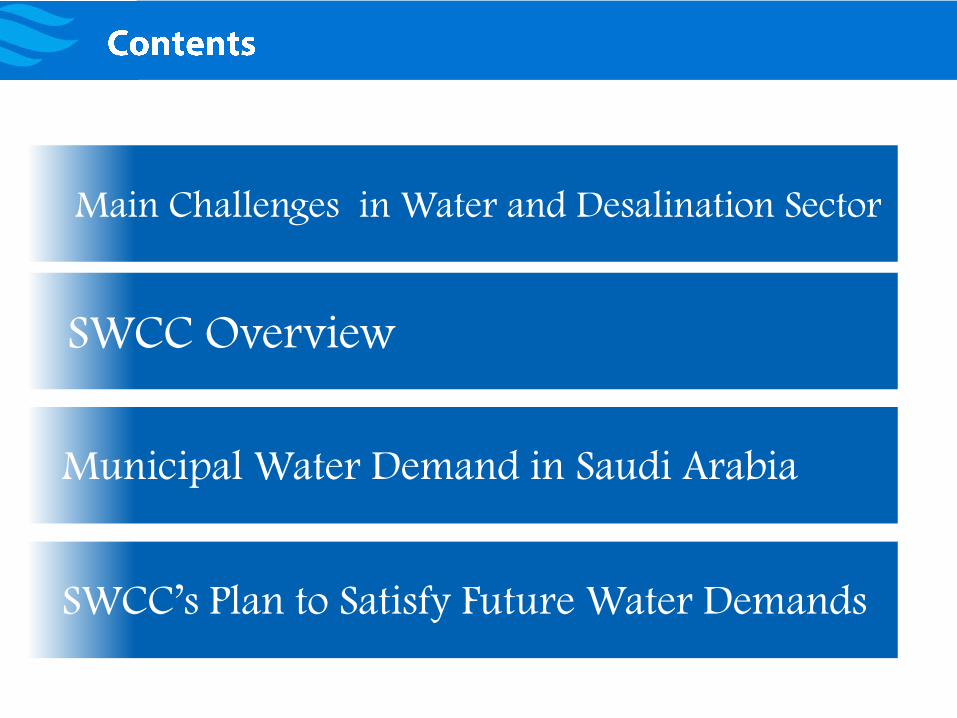
Main Challenges in Water and Desalination Sector
SWCC’s Plan to Satisfy Future Water Demands
Municipal Water Demand in Saudi Arabia
SWCC Overview
Main Challenges in Water and Desalination Sector


SWCC Overview


SWCC’s Facts

التوزيع الجغرافي لمحطات تحلية المياه وانتاج الطاقة باإلضافة إلى خطوط النقل (تشمل المشاريع العاملة والتي تحت اإلنشاء)

SWCC’s Facts

Shoaiba
Shuqaiq
Marafiq
900 MW
194 MIGD
880,000 m3/day
850 MW
47 MIGD
212,000 m3/day
2500 MW
176 MIGD
800,000 m3/day
( SWCC 500,000)
m3/day )
Shoaiba Expansion
150,000 m3/day

Municipal Water Demand in Saudi Arabia

0
10
20
30
40
50
60
2015 2020 2025 2030 2035 2040 2045 2050
Mill
ion
s (P
eo
ple
)

0
2
4
6
8
10
12
14
2015 2020 2025 2030 2035 2040 2045 2050
Mill
ion
s (m
3/d
ay)

0
2
4
6
8
10
12
2015 2020 2025 2030
Mill
ion
s
Water Demand (m3/day) Population other source Desalination
2.55%*
* Calculated Growth rate
1.84%* 1.30%* 1.27%*
population and Growth rate data Based on the mid-year estimates -Central Department of Statistics & Information
Makkah Province

0
500
1000
1500
2000
2500
3000
3500
2015 2020 2025 2030
Tho
usa
nd
s
Water Demand (m3/day) Population other source Desalination
2.42%*
* Calculated Growth rate
1.81%* 1.32%* 1.28%*
population and Growth rate data Based on the mid-year estimates -Central Department of Statistics & Information
Almadinah Province

0
0.1
0.2
0.3
0.4
0.5
0.6
0.7
0.8
0.9
1
2015 2020 2025 2030
Mill
ion
s
Water Demand (m3/day) Population other source
2.27%*
* Calculated Growth rate
1.78%* 1.34%* 1.30%*
population and Growth rate data Based on the mid-year estimates -Central Department of Statistics & Information
Hail Province

0
0.5
1
1.5
2
2.5
3
3.5
2015 2020 2025 2030
Mill
ion
s
Water Demand (m3/day) Population other source Desalination
2.27%*
* Calculated Growth rate
1.78%* 1.34%* 1.30%*
population and Growth rate data Based on the mid-year estimates -Central Department of Statistics & Information
Assair Province

0
1
2
3
4
5
6
7
2015 2020 2025 2030
Mill
ion
s
Water Demand (m3/day) Population
2.42%*
* Calculated Growth rate
1.82%* 1.32%* 1.28%*
population and Growth rate data Based on the mid-year estimates -Central Department of Statistics & Information
Eastern Province

0
1
2
3
4
5
6
7
2015 2020 2025 2030
Mill
ion
s
Water Demand (m3/day) Population
2.42%*
* Calculated Growth rate
1.82%* 1.32%* 1.28%*
population and Growth rate data Based on the mid-year estimates -Central Department of Statistics & Information
Eastern Province

0
0
0
0
0
1
1
1
2015 2020 2025 2030
Mill
ion
s
Water Demand (m3/day) Population other source Desalination
2.25%*
* Calculated Growth rate
1.78%* 1.34%* 1.30%*
population and Growth rate data Based on the mid-year estimates -Central Department of Statistics & Information
Albaha Province

0
100
200
300
400
500
600
700
2015 2020 2025 2030
Tho
usa
nd
s
Water Demand (m3/day) Population other source
2.32%*
* Calculated Growth rate
1.79%* 1.34%* 1.30%*
population and Growth rate data Based on the mid-year estimates -Central Department of Statistics & Information
Aljouf Province

0
500
1000
1500
2000
2500
2015 2020 2025 2030
Tho
usa
nd
s
Water Demand (m3/day) Population other source Desalination
2.30%*
* Calculated Growth rate
1.79%* 1.34%* 1.30%*
population and Growth rate data Based on the mid-year estimates -Central Department of Statistics & Information
Jazan Province

0
200
400
600
800
1000
1200
1400
2015 2020 2025 2030
Tho
usa
nd
s
Water Demand (m3/day) Population
2.27%*
* Calculated Growth rate
1.78%* 1.34%* 1.30%*
population and Growth rate data Based on the mid-year estimates -Central Department of Statistics & Information
Tabuk Province

0
10
20
30
40
50
60
70
80
90
100
2015 2020 2025 2030
Mill
ion
s
Population Hajj Omrah
Total annual demand for the Hajj season and Omrah (m3/year) in
Makkah

0
5
10
15
20
25
30
35
40
2015 2020 2025 2030
Mill
ion
s
Population Hajj Omrah
Total annual demand for the Hajj season and Omrah (m3/year) in
Madinah

SWCC’s Plan to Satisfy Future Water Demands

SWCC Plants (2015-2020)
Haqel 3Dheba 4AlugairRabigh 3Jubail 3
Alwajh 4Jeddah 4Ummlujj 4Yanbu 4

Pipelines Under Design

SWCC Future Plants
Haqel 4 Shuqaiq 3Alkhobar 4
Rabigh 4
Shuaiba 4Dheba 5
Rasalkhair 2 Jeddah 5Yanbu 5

Thank You

We will meet our customers'
desalinated seawater and
power needs efficiently
and reliably, at the lowest
cost possible and the highest
economic return.
We will effectively grow and
incentivize our people,
advance the desalination
industry, and contribute to
the social development of the
Kingdom while abiding by
security, safety and
environmental regulations
Mission1
2
3
4
5
6
7
Focus Areas Strategic Goals
Customer Service
Financial Sustainability
OperationExcellence
Human Resources
Economic Development
Security and Safety
Environment
Meet our customers' desalinated seawater and power needs and provide our service with the highest quality and reliability
Enhance the operation efficiency and diversify our fuel
portfolio.
Achieve the highest economic return by optimizing
revenues and streamlining costs
Develop, grow and incentivize employees and build local capabilities in a work environment that promotes teamwork, fairness, commitment and a sense of belonging
Participate actively in the development and localization of the desalination industry
Conform to best practices in safety and security
Abide by environmental standards and regulations
1
7
3
4
5
6
2
SWCC VisionTo pioneer and excel in seawater desalination industry and power generation

م2015اير التصدير الفعلي للمياه لكل منطقة من مناطق المملكة حسب احصائية إنتاج شهر فبر