Embed Size (px)
Citation preview
SWC Power Road & San Tan FreewayGilbert, ArizonA
PrePAreD bY:Tom Woods, Executive Vice President Brian Woods, Vice President
Colliers internAtionAl2390 E. Camelback Rd, Suite 100 Phoenix, AZ 85016
AnChoreD bY the FollowinG tenAnts:
SWC Ellsworth Loop Road & Rittenhouse RoadQueen Creek, Arizona
Vestar Development Co.2425 East Camelback Road, Suite 750Phoenix, Arizona (602) 866-0900
Another project of:
supercenter
GGIILLBBEERRTT GGAATTEEWWAAYY TTOOWWNNEE CCEENNTTEERR
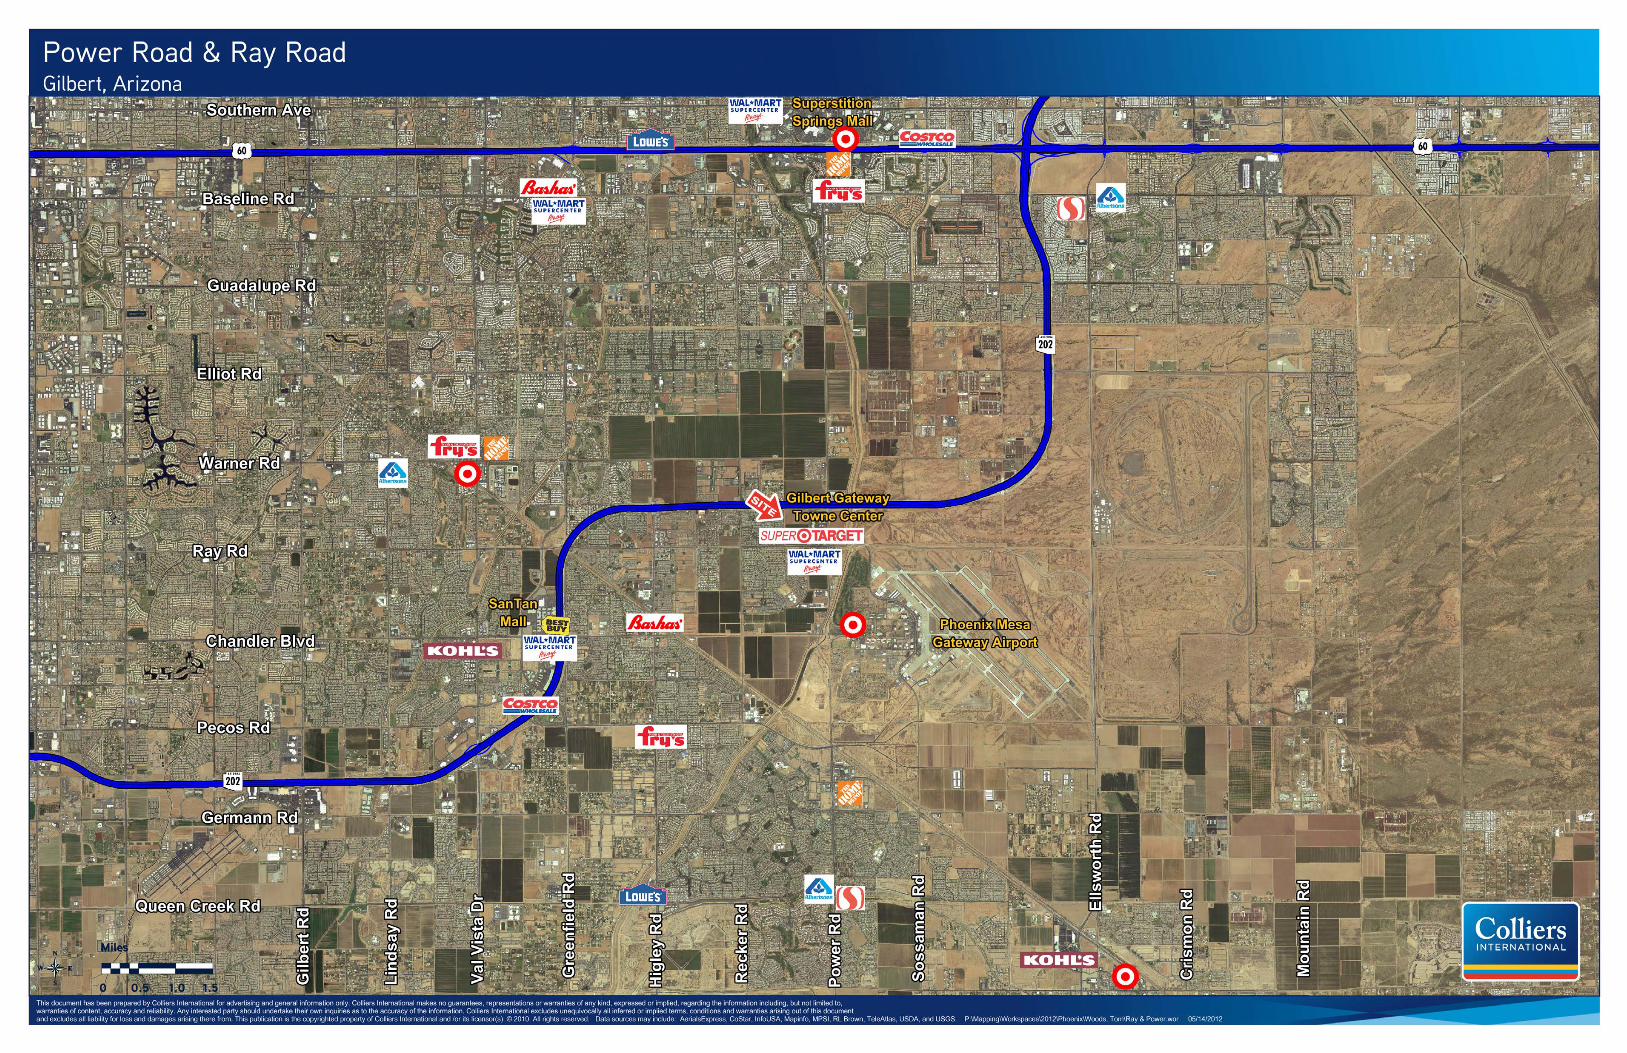
SWC Loop 202 Freeway & Power Road Gilbert, Arizona
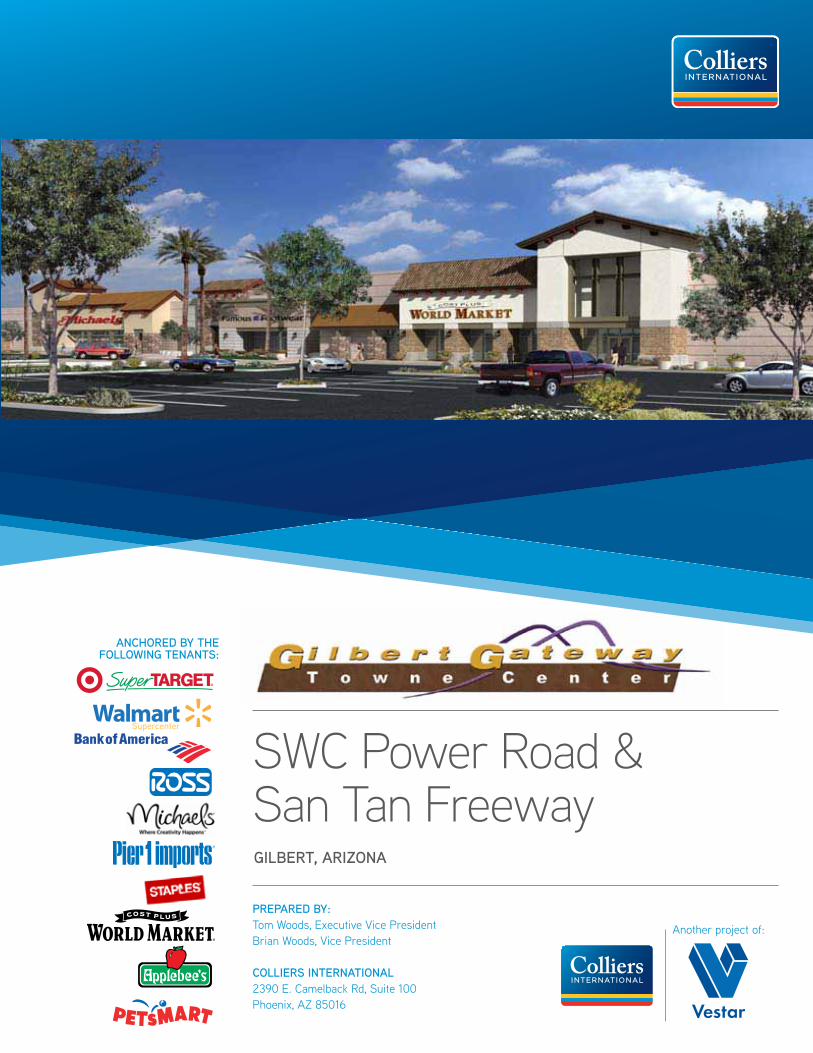
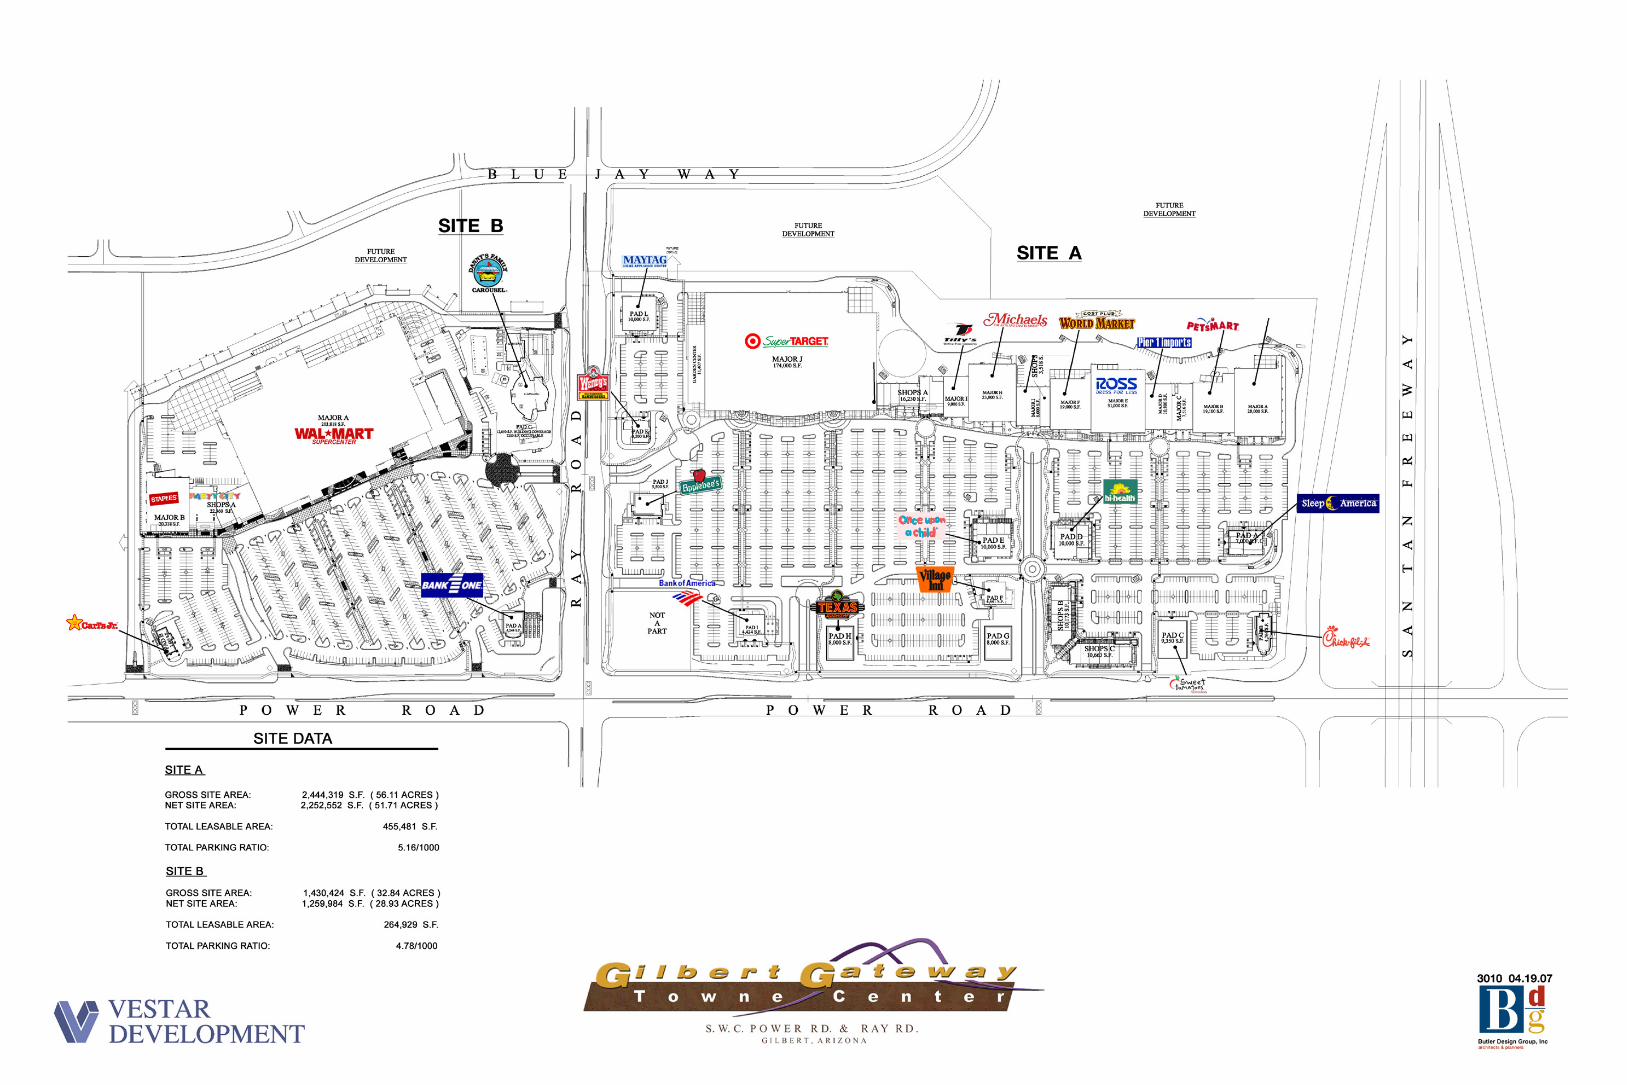
PROJECT DESCRIPTION: Gilbert Gateway Towne Center is an 80-acre retail development with
approximately 800,000 square feet of leasable space. The project is strategically located at the southwest corner of the Loop 202 Freeway and Power Road adjacent to the Williams Gateway Airport and Arizona State University East.
The shopping center consists of two phases. Phase I is anchored by a Super Target on 50 acres at the northwest corner of Power Road and Ray Road. Other tenants include Ross, Michaels, Pier 1 Imports, PetSmart, Cost Plus and Bank of America. Phase II is anchored by Wal-Mart Supercenter, Staples, and additional retailers situated on 30 acres at the southwest corner of Power Road and Ray Road.
DEMOGRAPHICS (2011 ESTIMATES): 1 Mile 3 Miles 5 Miles
Population: 1,715 59,277 190,324 Average HH Income: $85,894 $85,317 $83,557 Median HH Income: $71,313 $76,216 $70,373
HOUSING/POPULATION GROWTH: An analysis of Metropolitan Phoenix reveals that the Southeast Valley is one
of the areas with the available land and infrastructure to support the continued growth expected for Metropolitan Phoenix; consequently, the area surrounding the project is exploding with new residential development. Most of this growth is concentrated along the Power Road corridor north and south of the project with Morrison Ranch (6,000 units) one mile to the north and Power Ranch (7,400 units) two miles to the south.
The Gilbert Gateway Towne Center trade area contains 165 active and planned residential projects. These projects represent 116,000 new units or more than 370,000 additional people within the trade area. The total number of new units will grow over time since a significant amount of land in the trade area is currently not planned.
EMPLOYMENT: Williams Gateway Airport has been one of the fastest-growing employment
areas in metro Phoenix over the past five years. The Williams Gateway complex and the Gilbert Gateway Area employs about 16,000 people. Total employment within a two-mile radius of the project should exceed 22,000 by 2015.
GGIILLBBEERRTT GGAATTEEWWAAYY TTOOWWNNEE CCEENNTTEERR SWC Loop 202 Freeway & Power Road Gilbert, Arizona
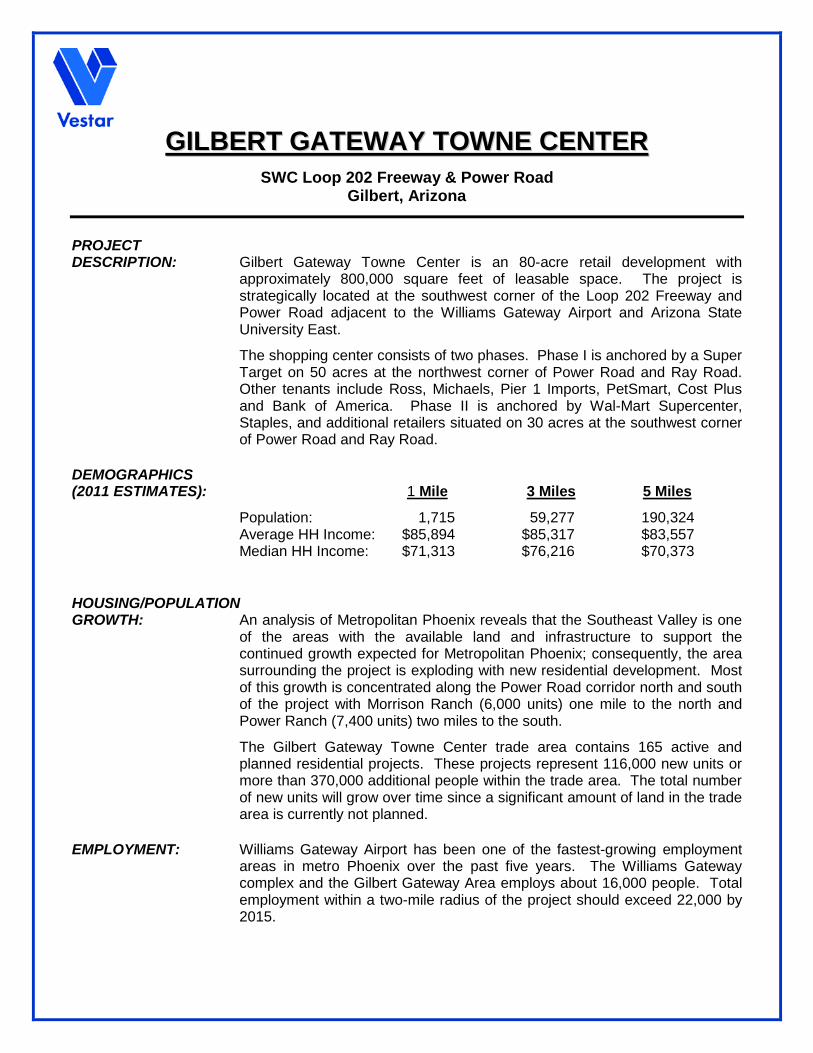
Williams Gateway Airport serves as a reliever airport to Sky Harbor and possesses more than 3,000 acres with over 1,000 acres available for
commercial development. More than 25 companies including Boeing are now located in the airport’s industrial airpark.
TRANSPORTATION: The transportation system serving the site has undergone dramatic changes.
Construction of the Loop 202 to Power Road is complete. Power Road and Ray Road are each under development to become six-lane arterial roads. Power Road provides direct access to the residential communities north and south of the shopping center while Ray Road provides easy access for the residents immediately to the West. Ray Road will also serve as a connection to the master planned community under development at the former General Motors Proving Ground just east of the shopping center.
One of the unique advantages of this site is the location with respect to the freeway and the residential developments. Not only is the project easily accessed from the full diamond interchange on the 202 Freeway at Power Road, but Power Road is the only access point to the Loop 202 between Higley and Hawes Roads (a distance of four miles). The elevated diamond interchange is highly utilized by the nearby residents driving to other destinations in Metropolitan Phoenix and the exposure and visibility of the development benefits as a result.
The project is a five to ten minute drive from most of the residential developments in the area via major arterial or collector streets.
COMMENTS: The project is situated on the only interchange on the Loop 202 for four
miles
Opened March 2005
20,000 students are expected to attend ASU East by 2015
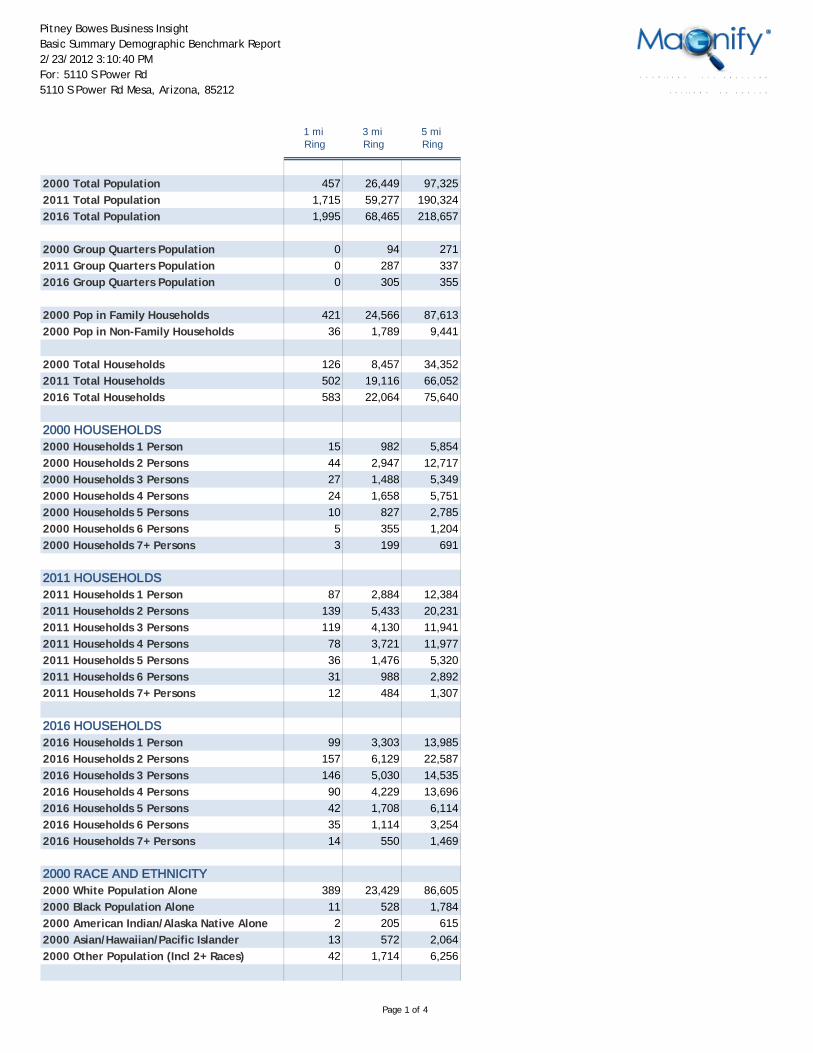
Pitney Bowes Business InsightBasic Summary Demographic Benchmark Report2/23/2012 3:10:40 PMFor: 5110 S Power Rd5110 S Power Rd Mesa, Arizona, 85212
L o n g i t u d e : - 1 1 1 . 6 8 7 1 7 7 8 0
L a t i t u d e : 3 3 . 3 3 5 1 7 0
Page 1 of 4
1 mi Ring
3 mi Ring
5 mi Ring
2000 Total Population 457 26,449 97,3252011 Total Population 1,715 59,277 190,3242016 Total Population 1,995 68,465 218,657
2000 Group Quarters Population 0 94 2712011 Group Quarters Population 0 287 3372016 Group Quarters Population 0 305 355
2000 Pop in Family Households 421 24,566 87,6132000 Pop in Non-Family Households 36 1,789 9,441
2000 Total Households 126 8,457 34,3522011 Total Households 502 19,116 66,0522016 Total Households 583 22,064 75,640
2000 HOUSEHOLDS2000 Households 1 Person 15 982 5,8542000 Households 2 Persons 44 2,947 12,7172000 Households 3 Persons 27 1,488 5,3492000 Households 4 Persons 24 1,658 5,7512000 Households 5 Persons 10 827 2,7852000 Households 6 Persons 5 355 1,2042000 Households 7+ Persons 3 199 691
2011 HOUSEHOLDS2011 Households 1 Person 87 2,884 12,3842011 Households 2 Persons 139 5,433 20,2312011 Households 3 Persons 119 4,130 11,9412011 Households 4 Persons 78 3,721 11,9772011 Households 5 Persons 36 1,476 5,3202011 Households 6 Persons 31 988 2,8922011 Households 7+ Persons 12 484 1,307
2016 HOUSEHOLDS2016 Households 1 Person 99 3,303 13,9852016 Households 2 Persons 157 6,129 22,5872016 Households 3 Persons 146 5,030 14,5352016 Households 4 Persons 90 4,229 13,6962016 Households 5 Persons 42 1,708 6,1142016 Households 6 Persons 35 1,114 3,2542016 Households 7+ Persons 14 550 1,469
2000 RACE AND ETHNICITY2000 White Population Alone 389 23,429 86,6052000 Black Population Alone 11 528 1,7842000 American Indian/Alaska Native Alone 2 205 6152000 Asian/Hawaiian/Pacific Islander 13 572 2,0642000 Other Population (Incl 2+ Races) 42 1,714 6,256
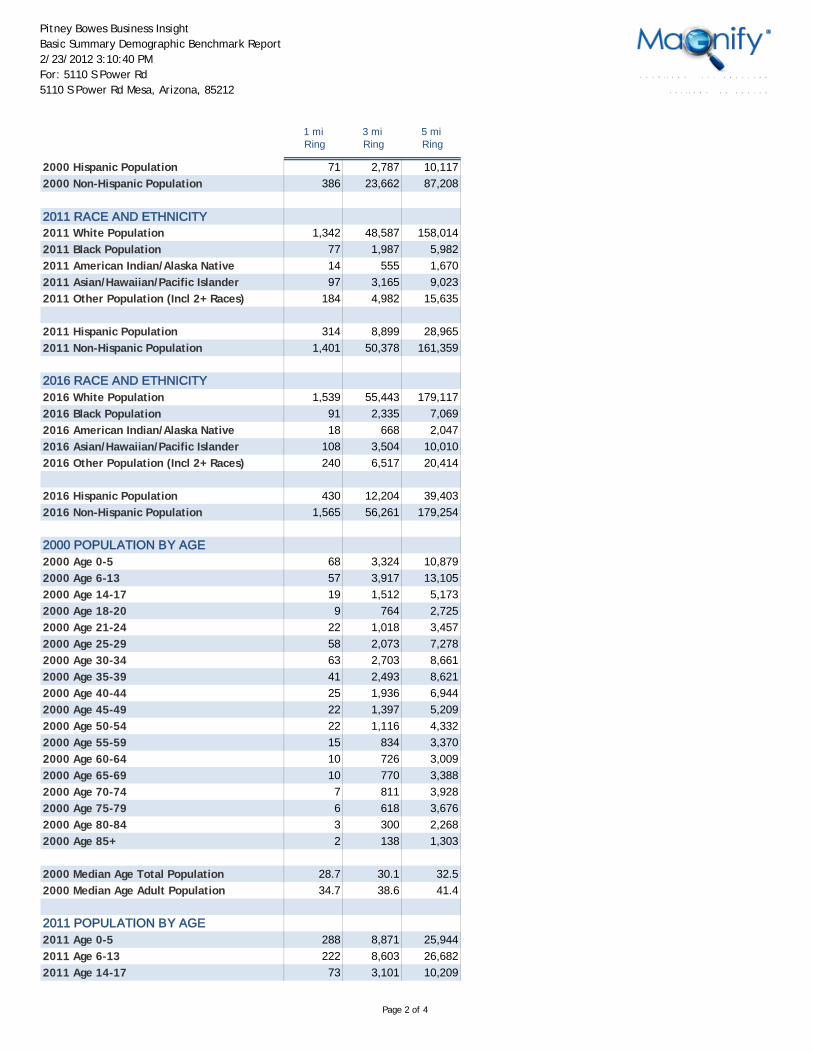
Pitney Bowes Business InsightBasic Summary Demographic Benchmark Report2/23/2012 3:10:40 PMFor: 5110 S Power Rd5110 S Power Rd Mesa, Arizona, 85212
L o n g i t u d e : - 1 1 1 . 6 8 7 1 7 7 8 0
L a t i t u d e : 3 3 . 3 3 5 1 7 0
Page 2 of 4
1 mi Ring
3 mi Ring
5 mi Ring
2000 Hispanic Population 71 2,787 10,1172000 Non-Hispanic Population 386 23,662 87,208
2011 RACE AND ETHNICITY2011 White Population 1,342 48,587 158,0142011 Black Population 77 1,987 5,9822011 American Indian/Alaska Native 14 555 1,6702011 Asian/Hawaiian/Pacific Islander 97 3,165 9,0232011 Other Population (Incl 2+ Races) 184 4,982 15,635
2011 Hispanic Population 314 8,899 28,9652011 Non-Hispanic Population 1,401 50,378 161,359
2016 RACE AND ETHNICITY2016 White Population 1,539 55,443 179,1172016 Black Population 91 2,335 7,0692016 American Indian/Alaska Native 18 668 2,0472016 Asian/Hawaiian/Pacific Islander 108 3,504 10,0102016 Other Population (Incl 2+ Races) 240 6,517 20,414
2016 Hispanic Population 430 12,204 39,4032016 Non-Hispanic Population 1,565 56,261 179,254
2000 POPULATION BY AGE2000 Age 0-5 68 3,324 10,8792000 Age 6-13 57 3,917 13,1052000 Age 14-17 19 1,512 5,1732000 Age 18-20 9 764 2,7252000 Age 21-24 22 1,018 3,4572000 Age 25-29 58 2,073 7,2782000 Age 30-34 63 2,703 8,6612000 Age 35-39 41 2,493 8,6212000 Age 40-44 25 1,936 6,9442000 Age 45-49 22 1,397 5,2092000 Age 50-54 22 1,116 4,3322000 Age 55-59 15 834 3,3702000 Age 60-64 10 726 3,0092000 Age 65-69 10 770 3,3882000 Age 70-74 7 811 3,9282000 Age 75-79 6 618 3,6762000 Age 80-84 3 300 2,2682000 Age 85+ 2 138 1,303
2000 Median Age Total Population 28.7 30.1 32.52000 Median Age Adult Population 34.7 38.6 41.4
2011 POPULATION BY AGE2011 Age 0-5 288 8,871 25,9442011 Age 6-13 222 8,603 26,6822011 Age 14-17 73 3,101 10,209
Pitney Bowes Business InsightBasic Summary Demographic Benchmark Report2/23/2012 3:10:40 PMFor: 5110 S Power Rd5110 S Power Rd Mesa, Arizona, 85212
L o n g i t u d e : - 1 1 1 . 6 8 7 1 7 7 8 0
L a t i t u d e : 3 3 . 3 3 5 1 7 0
Page 3 of 4
1 mi Ring
3 mi Ring
5 mi Ring
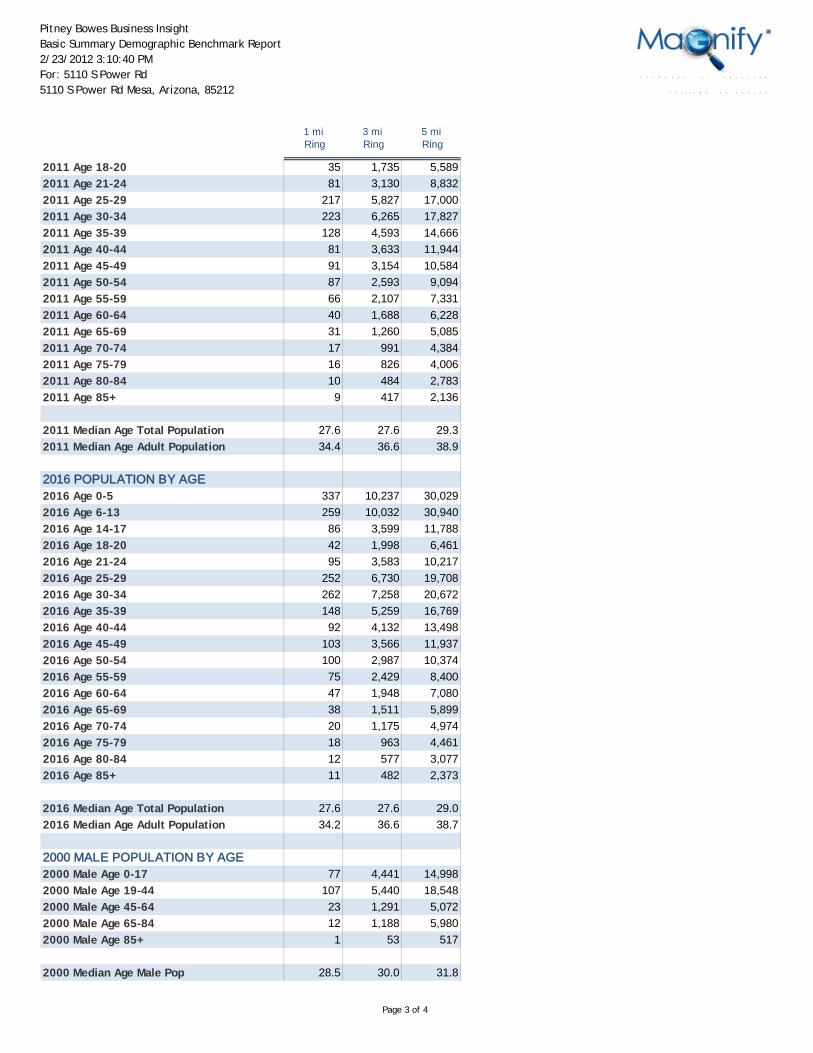
2011 Age 18-20 35 1,735 5,5892011 Age 21-24 81 3,130 8,8322011 Age 25-29 217 5,827 17,0002011 Age 30-34 223 6,265 17,8272011 Age 35-39 128 4,593 14,6662011 Age 40-44 81 3,633 11,9442011 Age 45-49 91 3,154 10,5842011 Age 50-54 87 2,593 9,0942011 Age 55-59 66 2,107 7,3312011 Age 60-64 40 1,688 6,2282011 Age 65-69 31 1,260 5,0852011 Age 70-74 17 991 4,3842011 Age 75-79 16 826 4,0062011 Age 80-84 10 484 2,7832011 Age 85+ 9 417 2,136
2011 Median Age Total Population 27.6 27.6 29.32011 Median Age Adult Population 34.4 36.6 38.9
2016 POPULATION BY AGE2016 Age 0-5 337 10,237 30,0292016 Age 6-13 259 10,032 30,9402016 Age 14-17 86 3,599 11,7882016 Age 18-20 42 1,998 6,4612016 Age 21-24 95 3,583 10,2172016 Age 25-29 252 6,730 19,7082016 Age 30-34 262 7,258 20,6722016 Age 35-39 148 5,259 16,7692016 Age 40-44 92 4,132 13,4982016 Age 45-49 103 3,566 11,9372016 Age 50-54 100 2,987 10,3742016 Age 55-59 75 2,429 8,4002016 Age 60-64 47 1,948 7,0802016 Age 65-69 38 1,511 5,8992016 Age 70-74 20 1,175 4,9742016 Age 75-79 18 963 4,4612016 Age 80-84 12 577 3,0772016 Age 85+ 11 482 2,373
2016 Median Age Total Population 27.6 27.6 29.02016 Median Age Adult Population 34.2 36.6 38.7
2000 MALE POPULATION BY AGE2000 Male Age 0-17 77 4,441 14,9982000 Male Age 19-44 107 5,440 18,5482000 Male Age 45-64 23 1,291 5,0722000 Male Age 65-84 12 1,188 5,9802000 Male Age 85+ 1 53 517
2000 Median Age Male Pop 28.5 30.0 31.8
Pitney Bowes Business InsightBasic Summary Demographic Benchmark Report2/23/2012 3:10:40 PMFor: 5110 S Power Rd5110 S Power Rd Mesa, Arizona, 85212
L o n g i t u d e : - 1 1 1 . 6 8 7 1 7 7 8 0
L a t i t u d e : 3 3 . 3 3 5 1 7 0
Page 4 of 4
1 mi Ring
3 mi Ring
5 mi Ring
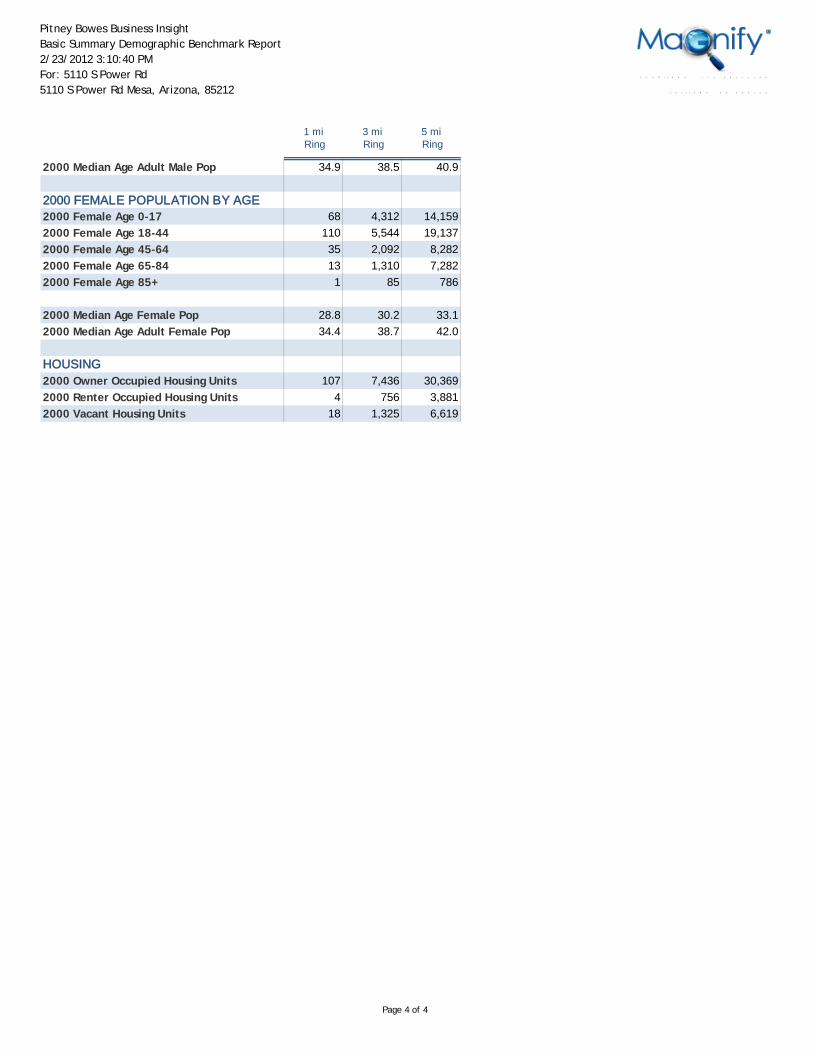
2000 Median Age Adult Male Pop 34.9 38.5 40.9
2000 FEMALE POPULATION BY AGE2000 Female Age 0-17 68 4,312 14,1592000 Female Age 18-44 110 5,544 19,1372000 Female Age 45-64 35 2,092 8,2822000 Female Age 65-84 13 1,310 7,2822000 Female Age 85+ 1 85 786
2000 Median Age Female Pop 28.8 30.2 33.12000 Median Age Adult Female Pop 34.4 38.7 42.0
HOUSING2000 Owner Occupied Housing Units 107 7,436 30,3692000 Renter Occupied Housing Units 4 756 3,8812000 Vacant Housing Units 18 1,325 6,619
1 mi Ring
3 mi Ring
5 mi Ring
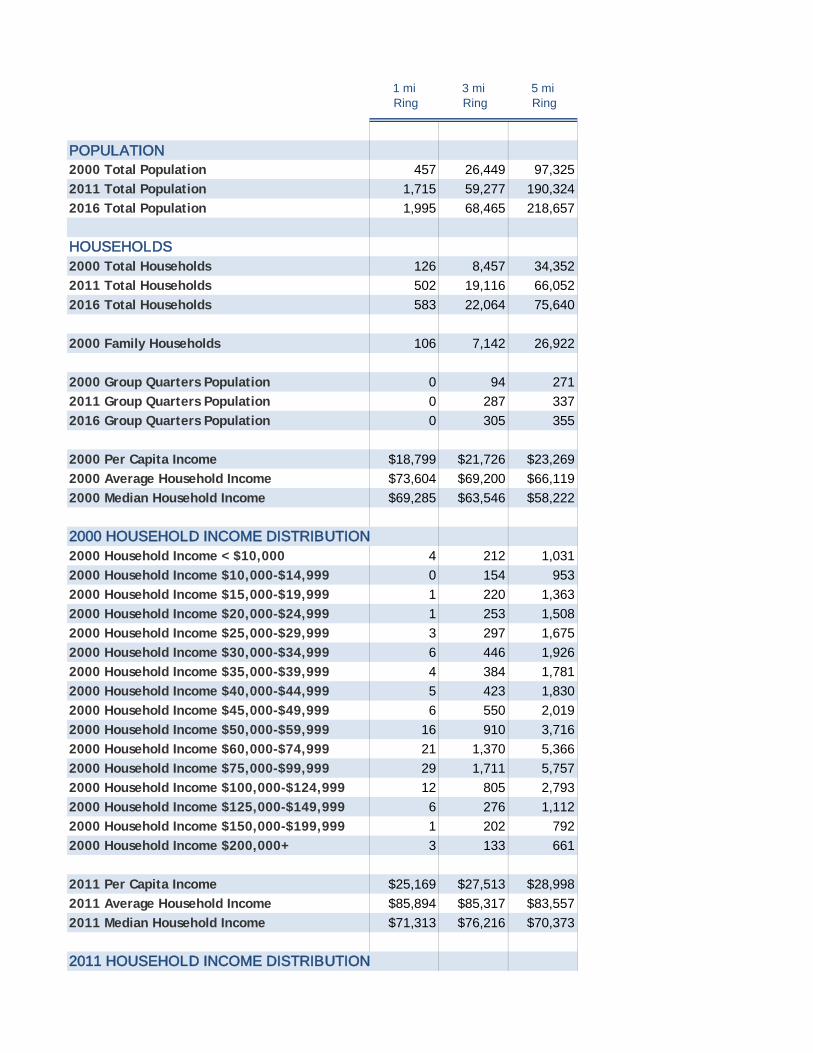
POPULATION2000 Total Population 457 26,449 97,3252011 Total Population 1,715 59,277 190,3242016 Total Population 1,995 68,465 218,657
HOUSEHOLDS2000 Total Households 126 8,457 34,3522011 Total Households 502 19,116 66,0522016 Total Households 583 22,064 75,640
2000 Family Households 106 7,142 26,922
2000 Group Quarters Population 0 94 2712011 Group Quarters Population 0 287 3372016 Group Quarters Population 0 305 355
2000 Per Capita Income $18,799 $21,726 $23,2692000 Average Household Income $73,604 $69,200 $66,1192000 Median Household Income $69,285 $63,546 $58,222
2000 HOUSEHOLD INCOME DISTRIBUTION2000 Household Income < $10,000 4 212 1,0312000 Household Income $10,000-$14,999 0 154 9532000 Household Income $15,000-$19,999 1 220 1,3632000 Household Income $20,000-$24,999 1 253 1,5082000 Household Income $25,000-$29,999 3 297 1,6752000 Household Income $30,000-$34,999 6 446 1,9262000 Household Income $35,000-$39,999 4 384 1,7812000 Household Income $40,000-$44,999 5 423 1,8302000 Household Income $45,000-$49,999 6 550 2,0192000 Household Income $50,000-$59,999 16 910 3,7162000 Household Income $60,000-$74,999 21 1,370 5,3662000 Household Income $75,000-$99,999 29 1,711 5,7572000 Household Income $100,000-$124,999 12 805 2,7932000 Household Income $125,000-$149,999 6 276 1,1122000 Household Income $150,000-$199,999 1 202 7922000 Household Income $200,000+ 3 133 661
2011 Per Capita Income $25,169 $27,513 $28,9982011 Average Household Income $85,894 $85,317 $83,5572011 Median Household Income $71,313 $76,216 $70,373
2011 HOUSEHOLD INCOME DISTRIBUTION
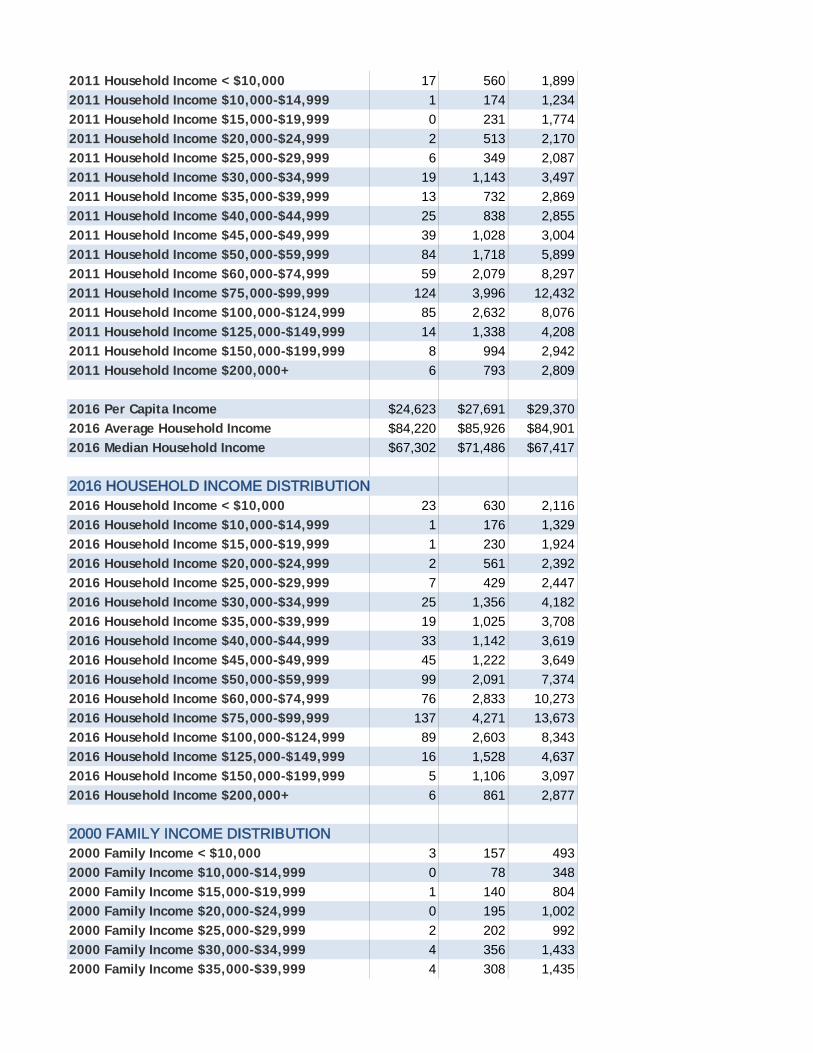
2011 Household Income < $10,000 17 560 1,8992011 Household Income $10,000-$14,999 1 174 1,2342011 Household Income $15,000-$19,999 0 231 1,7742011 Household Income $20,000-$24,999 2 513 2,1702011 Household Income $25,000-$29,999 6 349 2,0872011 Household Income $30,000-$34,999 19 1,143 3,4972011 Household Income $35,000-$39,999 13 732 2,8692011 Household Income $40,000-$44,999 25 838 2,8552011 Household Income $45,000-$49,999 39 1,028 3,0042011 Household Income $50,000-$59,999 84 1,718 5,8992011 Household Income $60,000-$74,999 59 2,079 8,2972011 Household Income $75,000-$99,999 124 3,996 12,4322011 Household Income $100,000-$124,999 85 2,632 8,0762011 Household Income $125,000-$149,999 14 1,338 4,2082011 Household Income $150,000-$199,999 8 994 2,9422011 Household Income $200,000+ 6 793 2,809
2016 Per Capita Income $24,623 $27,691 $29,3702016 Average Household Income $84,220 $85,926 $84,9012016 Median Household Income $67,302 $71,486 $67,417
2016 HOUSEHOLD INCOME DISTRIBUTION2016 Household Income < $10,000 23 630 2,1162016 Household Income $10,000-$14,999 1 176 1,3292016 Household Income $15,000-$19,999 1 230 1,9242016 Household Income $20,000-$24,999 2 561 2,3922016 Household Income $25,000-$29,999 7 429 2,4472016 Household Income $30,000-$34,999 25 1,356 4,1822016 Household Income $35,000-$39,999 19 1,025 3,7082016 Household Income $40,000-$44,999 33 1,142 3,6192016 Household Income $45,000-$49,999 45 1,222 3,6492016 Household Income $50,000-$59,999 99 2,091 7,3742016 Household Income $60,000-$74,999 76 2,833 10,2732016 Household Income $75,000-$99,999 137 4,271 13,6732016 Household Income $100,000-$124,999 89 2,603 8,3432016 Household Income $125,000-$149,999 16 1,528 4,6372016 Household Income $150,000-$199,999 5 1,106 3,0972016 Household Income $200,000+ 6 861 2,877
2000 FAMILY INCOME DISTRIBUTION2000 Family Income < $10,000 3 157 4932000 Family Income $10,000-$14,999 0 78 3482000 Family Income $15,000-$19,999 1 140 8042000 Family Income $20,000-$24,999 0 195 1,0022000 Family Income $25,000-$29,999 2 202 9922000 Family Income $30,000-$34,999 4 356 1,4332000 Family Income $35,000-$39,999 4 308 1,435
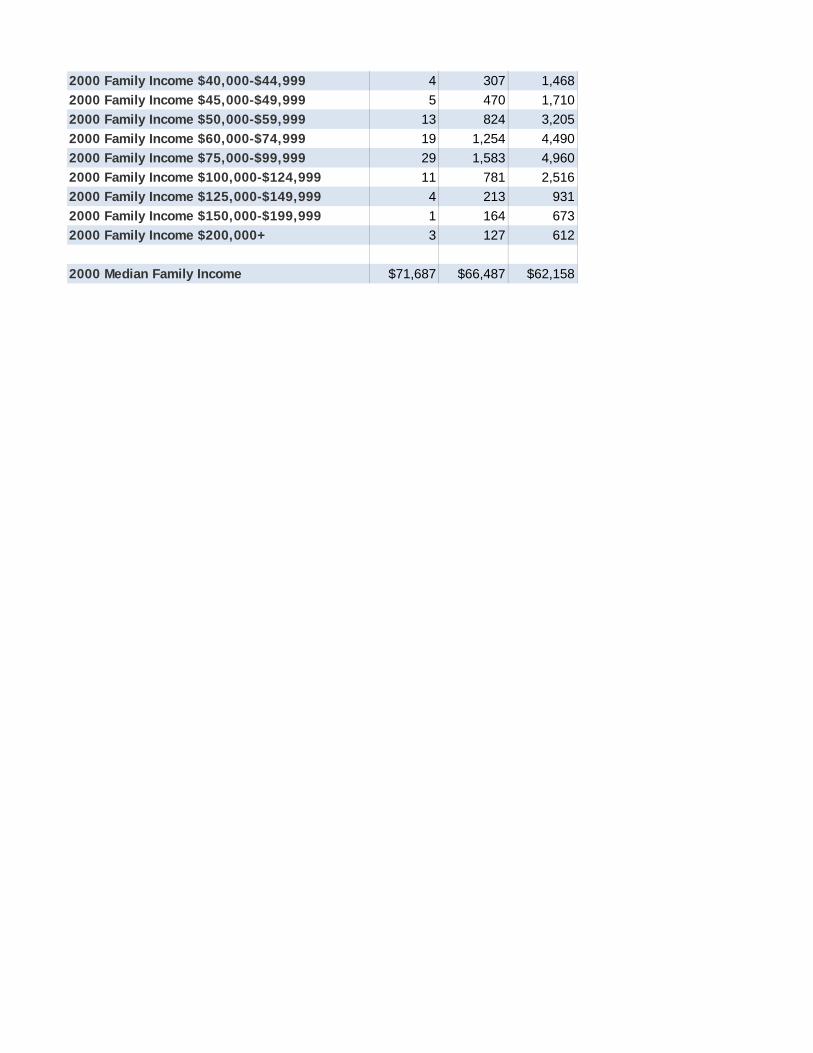
2000 Family Income $40,000-$44,999 4 307 1,4682000 Family Income $45,000-$49,999 5 470 1,7102000 Family Income $50,000-$59,999 13 824 3,2052000 Family Income $60,000-$74,999 19 1,254 4,4902000 Family Income $75,000-$99,999 29 1,583 4,9602000 Family Income $100,000-$124,999 11 781 2,5162000 Family Income $125,000-$149,999 4 213 9312000 Family Income $150,000-$199,999 1 164 6732000 Family Income $200,000+ 3 127 612
2000 Median Family Income $71,687 $66,487 $62,158