Embed Size (px)
Citation preview

SWARTHMORE COLLEGE FINANCIAL REPORT2011!12

CONTENTS
Financial Report, 2011–12 .........................................................................................1
Management Responsibility for Financial Reporting ...............................................7
Report of Independent Auditors ................................................................................8
Consolidated Financial Statements ...........................................................................9
Notes to Consolidated Financial Statements .........................................................13
The Corporation and Board of Managers ..............................................................29
www.swarthmore.edu

Swarthmore College Financial Report, 2011–12 1
FINANCIALREPORT2011!12
The fiscal year that ended June 30, 2012, was marked by stability and continued
progress in moving forward from the Great Recession and down-turn in the financial markets and developing a vision for Swarth-more’s future. This was the third year of budgets developed in response to the economic down-turn. The budget plan adopted by the Board of Managers in Decem-ber 2009 outlined a five-year plan of both permanent and temporary budget measures. Because of prudent financial and investment policies, the College was better positioned than many peer insti-tutions to weather this difficult period. The budget plan avoided reductions to core programs, preserved financial aid, and did not include any layoffs of faculty or staff. Subsequently, the endow-ment recovered to a new fiscal year-end peak last year (June 30, 2011) and, though down slightly to $1.499 billion at June 30, 2012, is generally maintaining its recovery. As hoped for, the College is now in a position to restore temporary reductions in facilities capital spending. In fact, an ambitious schedule of capital projects resumed in 2012.
In December 2011, the Board of Managers approved Strategic Directions for Swarthmore Col-lege, which outlines a vision and initiatives for the next decade. The plan is a result of a compre-hensive and collaborative effort spanning two years and involving faculty, staff, students, alumni, and Board members. The plan reaffirms Swarthmore’s commit-ment to the following principles:
A singular commitment to academic rigor and cre-ativity
A desire to provide access and opportunity for all stu-dents, regardless of their financial circumstances
A diverse, inclusive, and vibrant community of students, faculty, staff, and alumni
A conviction that applied knowledge should be used to improve the world
The strategic plan outlines many initiatives to be implement-ed in the coming years. A capital campaign is in its early stages, and the College hopes to launch the public phase to coincide with the College’s sesquicentennial in 2014.
This report presents the finan-cial results of the 2011!12 fiscal year in detail. Longer-term statis-tical information is presented in Chart 1, and the audited financial statements appear following this report. This past year, the name of the Audit Committee of the Board of Managers was changed to the Audit and Risk Manage-ment Committee, formalizing the responsibility of this committee for broad– not just financial!oversight of risk management throughout the College.
RESULTS OF THE 2011!12 FISCAL YEAR
Swarthmore College’s finan-cial position remained strong at June 30, 2012. Although net assets of the College were slightly lower than the prior year due to a $9.7 million decline in the value of the endowment to $1.499 bil-lion at June 30, 2012, the endow-ment generated a positive 2.2 percent investment return and remained above its pre-downturn peak. The value declined slightly because endowment spending for the budget exceeded the invest-ment return and new gifts to the endowment.
Annual expenses for the year increased 2.2 percent to $124.3 million. This amounted to $81,902 per student, as shown in Chart 2. Every full-pay student at

2 Swarthmore College Financial Report, 2011–12
CHART 1STATISTICAL REVIEW OF SWARTHMORE COLLEGE
(for years ended June 30)

Swarthmore College Financial Report, 2011–12 3
Swarthmore received a “scholar-ship” of $28,652, the cost per stu-dent in excess of student charges (tuition, fee, room, and board). In 2011!12, philanthropy provided 45 percent of the costs of a Swarth-more education while net student revenues provided 42 percent.
STUDENT REVENUES: ENROLLMENT, STUDENT FEES, AND FINANCIAL AID On-campus enrollment was 1,436 last year, and there was an aver-age of an additional 82 students in foreign study each semester. Student charges (tuition, fee, room, and board) were $53,250, an increase of 3.4 percent from the prior year.
Total scholarships funded by the College (excluding grants from other sources) were $28.0 million, an increase of 7.8 percent from 2010!11. The increase in scholar-
ships was due to both an unan-ticipated increase in enrollment and in the percentage of students aided (54 percent compared with 52 percent in the prior year) and an increase in the average scholar-ship per needy student ($33,338, an increase of 4.4 percent from the prior year). The College’s discount rate (scholarships as a percent of tuition and fee revenues) in-creased to 44 percent. A driver of the increase in scholarships was the first year class with a record 57 percent of students qualifying for need-based aid. College schol-arships continue to be one of the fastest-growing line items in the College budget. Although student charges continue to increase, net student revenues (cash collections net of scholarships) are increasing at a much lower rate, barely keep-ing up with cost pressures from expenses such as compensation.
ENDOWMENT SUPPORTThe endowment support to the budget in 2011!12 was $47.9 mil-lion, an increase of $2.9 million from the year before. The endow-ment spending rate (endowment support as a percent of the begin-ning of the year endowment mar-ket value) dipped to 3.3 percent. This is near the low end of the target endowment spending range, but is expected to return to near the middle of the range in 2012!13 when facilities capital spending is restored. Chart 3 shows a history of endowment spending and the spending rate.
GIFTSThe College received $24.0 mil-lion in gifts and grants in 2011!12 compared to $18.2 million received the prior year. An increase of $3.5 million for a facilities project and $1.5 million in gifts of deferred
CHART 2FINANCING A SWARTHMORE EDUCATION 2011-12
4 Swarthmore College Financial Report, 2011–12
assets made the largest contribu-tions to the higher figure. Outright gifts and new pledges from private sources totaled $20.0 million, while the College recognized an additional $1.4 million in outright gifts and new pledges from govern-ment grants.
Current unrestricted gifts increased by $0.6 million from the previous year to $6.6 million. The number of leadership donors (gifts of $1,864 and above) to the annual fund increased from 378 last year to 552 this year, yielding a larger average gift to the fund. One in four alumni donors increased their gift in 2011!12 from the prior year. For the first time in three years, however, the total number of alumni donors declined, resulting in a reduction in the annual fund of $0.3 million from the prior year.The alumni participation rate was 53.1 percent of alumni solicited.Gifts to the parents’ fund (a part of the annual fund) increased by 7.5 percent during 2010!11. A special Board initiative added almost $1 million in current support.
Donors completed more than $3.6 million in life income gifts with the College in 2011!12, with many gift annuitants taking advantage of more favorable rates that expired in December 2011.Terminated life income gifts (after the death of the income recipient) provided the College with $5.5 million in restricted and unre-stricted funds (not included in gift totals). In the past year the College enrolled 36 new members in the Legacy Circle, which recognizes donors who have included Swarth-more in their estate plans, includ-ing wills, trusts, charitable gift annuities, and other gifts that the College will realize in the future.
The Howard Hughes Medical Institute (HHMI) awarded the Col-lege a seventh consecutive four-year $1 million grant to support 20
student summer research fellow-ships a year, a mentoring program, and three curricular innovations. HHMI named Swarthmore a Capstone Awardee, a new category that recognizes long-time grantees who have developed mature and successful programs and who are expected to publish findings on key elements that have led to their suc-cess and to propose new ideas and strategies based on these findings.
Karl Clauss joined Swarthmore as vice president for development and alumni relations in March 2012. Throughout the year Presi-dent Rebecca Chopp continued to visit with hundreds of Swarthmore alumni and parents and scores of leadership donors throughout the United States and Europe in anticipation of a comprehensive effort to secure philanthropic sup-port for initiatives in the Strategic Directions report.
Note: A total of $21.9 million in gifts and grants was recognized in the financial statements according to generally accepted accounting princi-ples. The difference between this and the $24.0 million discussed above is related primarily to the accounting treatment of pledges and grants.
EXPENDITURESThe budget plan adopted by the Board of Managers in response to the economic crisis established constraints on College expen-ditures. The 2011!12 budget included essentially no signifi-cant new items. The increase in total expenditures of 2.2 percent to $124.3 million was driven by salary increases for faculty and staff and increased costs of health insurance premiums. Compensa-tion for faculty and staff amounted to 58 percent of total expenditures. Non-compensation departmental budgets were increased only for unavoidable cost increases.
FACILITIES CAPITAL SPENDINGThe fiscal year that ended June 30, 2012, was the last of three years of reduced facilities capital spend-ing. The 2012!13 budget includes a restoration of spending levels. As a result, several facilities initiatives got under way during the year. The College, informed by the Strategic Directions report, embarked on a campus master plan. Initially, this focused on a detailed look at the needs of the biology, engineering, and psychology departments. The plan will look more broadly at the whole campus next year and is expected to be completed by spring 2013.
The College began several deferred projects that were com-pleted in fall 2012. The most significant of those are the restora-tion of the slate and metal roofs on the 130-year-old Parrish Hall and the complete renovation of the Worth Health Center. Work also continued to make the campus more accessible, and renovation of labs and collaborative work spaces in three of the academic buildings was completed.
The Town Center West (TCW) project was another major effort. Architectural design work pro-gressed, and the College embarked on the business arrangements for the development. TCW is a project guided by the Town Revi-talization Plan of the Borough of Swarthmore and includes a small inn, a restaurant, and the College’s bookstore. The development will provide a comfortable place for the College and the local community and strengthen the village down-town.
TECHNOLOGY SPENDINGTechnology capital funds were used in four general areas—the academic program, administrative information systems, network and

Swarthmore College Financial Report, 2011–12 5
telecommunications, and infra-structure and operations. The major academic enhancement was the continued installation of computer and video equipment in classrooms. Twenty-one class-rooms and seminar rooms now have video capabilities, and more than half of all teaching spaces now have built-in computers. The implementation of a document-imaging system for admissions was completed. Application ma-terials are now stored electroni-cally, and the admissions staff has moved to a more efficient paper-less system. Another administra-tive project was the development of electronic billing of student accounts. Students and their families have access to their bills electronically and can submit payments online.
Infrastructure projects to add and replace servers and increase storage were also completed, and projects continued to improve network and telecommunications services.
ADMISSIONSThe College received a record 6,589 applications for the Class of 2016. Of these, 935 students were admit-ted with a selectivity ratio of 14 percent. The incoming first-year class had 378 students, reflecting a 40 percent yield. There were also 10 transfer students.
Median SAT scores were strong at 730 verbal, 720 math, and 730 writing, each out of a possible 800 total score. Students represented 22 countries and 42 of the 50 states. For the first time, the state with the largest representation was California with 51 students.
ENDOWMENTThe market value of the endow-ment was $1.499 billion at June 30, 2012. The investment return for the fiscal year was 2.2 percent. Positive performance was
achieved by the College’s domestic equity managers and fixed income portfolios as well as the private eq-uity and real asset allocations. The marketable alternatives program was flat for the fiscal year. The en-dowment was negatively impacted by the international equity alloca-tion, which posted a loss driven in part by declines in emerging mar-ket stocks. Although the endow- ment declined $9.7 million from the prior year, it remained above its pre-downturn peak at June 30, 2007, of $1.441 billion. Many large endowments have not yet recov-ered to levels reached before the Great Recession.
The College’s trailing multi-year returns also compared favor-ably with other endowments. For the past 10 years, the Standard & Poor’s 500 Stock Index and the MSCI All Country Exclud-ing U.S. Index have returned 5.8 percent and 7.2 percent annually, respectively, below their long-term trends. For the most part, the Col-lege’s equity investment managers
have performed better than their benchmark indexes. Endowment returns matched or exceeded their longer-term target returns for the past three and 10 years, but lagged the longer-term target returns over one and five years as shown in the table below: Period Ave. Annual Ave. AnnualEnded Return Target Return*June 30, 2012 1-year 2.2% 7.4% 3-year 13.5% 7.8% 5-year 4.0% 7.7% 10-year 8.4% 8.2%
*Inflation plus a 5.75% real return.
The endowment asset allocation is shown in Charts 4 and 5. As of the fiscal year-end, the endowment was close to the target asset allocation. No significant changes to this allo-cation are anticipated at this time. Despite the increasing allocations to the “alternative” asset classes of private equity, real assets, and mar-ketable alternatives, the endow-ment has maintained a high level of
CHART 3SWARTHMORE COLLEGE
DISTRIBUTION AMOUNT PER ENDOWMENT UNIT ($)COMPARED WITH SPENDING RATE (%)

6 Swarthmore College Financial Report, 2011–12
liquidity. As of June 30, 2012, about $697 million (unaudited) of invest-ments could be converted to cash within 30 days. The College has developed detailed models of cash needs for the budget and capital calls for private investments and monitors liquidity on an ongoing basis. The College’s more liquid profile relative to other endow-ments has enabled it to take ad-vantage of some promising invest-ment opportunities during the past several years.
DEBTIn December 2011, the College issued $14.4 million par value in tax-exempt debt and $46.3 million par value in taxable debt. The proceeds were used to refi-nance a portion of the College’s outstanding 2002 bonds and to fund various tax-exempt and tax-able capital projects throughout the next few years. The Moody’s and Standard & Poor’s rating agencies reaffirmed the College’s Aaa and AAA ratings, respec-tively. As of June 30, 2012, the College had $212.9 million in debt outstanding, an increase of $38.4 million from the prior year. Debt as a percent of the endow-ment was 14 percent, a level that compared favorably with many peer institutions.
CONCLUSIONSwarthmore College, in embarking on the implementation of Strate-gic Directions, remains confident in the unique strengths of liberal arts education in the 21st century and in the vision outlined in the plan. The College fully recognizes, however, the challenges to the sus-tainability of its financial model. The global economic environ-ment is unlikely to provide robust endowment returns, a worrisome assumption for institutions like Swarthmore with high budget dependence on endowment spend-
ing. Likewise, demographic and economic factors indicate that financial aid needs will continue to increase. Cost pressures, particu-larly related to providing com-petitive salaries and benefits for faculty and staff, will continue to be a challenge.
The College is committed to financial sustainability for the fu-ture. Balanced budgets and preser-vation of intergenerational equity are core financial principles. The implementation of Strategic Di-rections will be accompanied by frequent financial modeling and stress testing. Initiatives will be launched only when the financial resources are in place for them. The College will move carefully and deliberately in order to main-
tain its strong financial founda-tion.
Suzanne P. Welsh Vice President for Finance and Treasurer
CHART 4SWARTHMORE COLLEGE ENDOWMENT
ASSET ALLOCATIONJune 30, 2012
CHART 5SWARTHMORE COLLEGE ENDOWMENT
HISTORY OF ASSET ALLOCATION
Swarthmore College Financial Report, 2011–12 7
Swarthmore College is responsible for the preparation, integrity, and fair presentation of its published financial statements. The accom-panying financial statements have been prepared in accordance
such include judgments and estimates of management. Swarthmore Col-lege also prepared the other information included in the 2011–12 Finan-cial Report and is responsible for its accuracy and consistency with the financial statements.
Management is also responsible for establishing and maintaining ef-fective internal control over financial reporting. The internal control sys-tem is augmented by written policies and procedures. The Audit and Risk Management Committee of the Board of Managers provides oversight to management’s conduct of the financial reporting process.
Management believes that Swarthmore College maintained an effec-tive internal control system over financial reporting, for the fiscal year ended June 30, 2012 and, further, that the financial statements fairly rep-resent the financial condition of the College as of June 30, 2012, and the operating results and cash flows for the year ended June 30, 2012.
Suzanne P. WelshVice President for Finance and Treasurer
Eileen E. PetulaAssistant Vice President for Finance and Controller
MANAGEMENT RESPONSIBILITY FOR FINANCIALREPORTING

8
Report of Independent Auditors
The Board of Managers of Swarthmore College:
In our opinion, the accompanying consolidated statements of financial position and the related consolidated statements of activities and cash flows present fairly, in all material respects, the financial position of Swarthmore College (the “College”) at June 30, 2012 and 2011, and the changes in its net assets and its cash flows for the years then ended in conformity with accounting principles generally accepted in the United States of America. These financial statements are the responsibility of the College’s management. Our responsible is to express an opinion on these financial statements based on our audits. We conducted our audits of these statements in accordance with auditing standards generally accepted in the United States of America. Those standards require that we plan and perform the audit to obtain reasonable assurance about whether the financial statements are free of material misstatement. An audit includes examining, on a test basis, evidence supporting the amounts and disclosures in the financial statements, assessing the accounting principles used and significant estimates made by management, and evaluating the overall financial statement presentation. We believe that our audits provide a reasonable basis for our opinion.
September 21, 2012

9
SWARTHMORE COLLEGECONSOLIDATED STATEMENTS OF FINANCIAL POSITION
as of June 30, 2012 and 2011(in thousands)
ASSETS 2012 2011
Cash and cash equivalents 32,265$ 32,433$ Accounts receivable, net 2,397 1,227Prepaid expenses and inventories 3,500 3,909Contributions receivable 17,006 18,223Student loans receivable, net 1,663 2,090Employee mortgages receivable 12,817 14,081Assets restricted to investment in property and equipment 17,319 37Property and equipment, net 239,966 232,740Investments, at market
Endowment 1,498,775 1,508,483Life income and annuity 40,713 43,271Other 39,267 12,037
Total assets 1,905,688$ 1,868,531$
LIABILITIES
Accrued compensation 7,069$ 6,712$ Payables and other accruals 8,813 5,662Student deposits 2,239 2,222Deferred payments and other liabilities 45,706 35,459Refundable government loan funds 1,742 1,742Bonds and notes payable 212,864 174,482
Total liabilities 278,433 226,279
NET ASSETS
Unrestricted 638,391$ 628,075$ Temporarily restricted 802,184 834,746Permanently restricted 186,680 179,431
Total net assets 1,627,255 1,642,252
Total liabilities and net assets 1,905,688$ 1,868,531$
See accompanying notes to consolidated financial statements.

10
SWARTHMORE COLLEGECONSOLIDATED STATEMENT OF ACTIVITIES
for the year ended June 30, 2012(in thousands)
Restricted TotalUnrestricted Temporarily Permanently 2012
Operating revenues:
Student tuition and fees 63,713$ $ $ 63,713$ Room and board 16,266 16,266Less student aid (28,034) (28,034)
Net student tuition and fees 51,945 - - 51,945Revenues from investments
Endowment spending distribution 47,888 970 48,858Other 874 874
Private gifts and grants 7,998 1,770 9,768Government grants 464 1,509 1,973Other additions 7,856 1,040 8,896Transfers among net asset classes 691 (691) - Net assets released from restrictions 6,467 (6,467) -
Total operating revenue 124,183 (1,869) - 122,314
Operating expenses:
Instruction 46,115 46,115Academic support 17,804 17,804Student services 11,402 11,402Institutional support 22,944 22,944Auxiliary activities 21,029 21,029Research and public service 5,033 5,033
Total operating expenses 124,327 - - 124,327
Decrease in net assets from operating activities (144) (1,869) - (2,013)
Nonoperating activities:
Net realized and unrealized gain oninvestments, net of endowment spending 6,575 (24,902) (18,327)
Private gifts and grants 3,368 3,602 3,196 10,166Change in present value of life income funds (2,480) (2,480)Maturities of annuity and life income funds 2,088 (4,144) 2,056 - Change in other post retirement benefits (3,260) (3,260)Loss on extinguishment of debt (578) (578)Other 529 948 18 1,495Transfers among net asset classes 324 (2,303) 1,979 - Net assets released from restrictions 1,414 (1,414) -
Increase/decrease in net assets from nonoperating activities 10,460 (30,693) 7,249 (12,984)
Net increase/decrease in net assets for the year 10,316 (32,562) 7,249 (14,997)
Net Assets, June 30, 2011 628,075 834,746 179,431 1,642,252
Net Assets, June 30, 2012 638,391$ 802,184$ 186,680$ 1,627,255$
See accompanying notes to consolidated financial statements.

11
SWARTHMORE COLLEGECONSOLIDATED STATEMENT OF ACTIVITIES
for the year ended June 30, 2011(in thousands)
Restricted TotalUnrestricted Temporarily Permanently 2011
Operating revenues:
Student tuition and fees 60,666$ $ $ 60,666$ Room and board 15,790 15,790Less student aid (25,995) (25,995)
Net student tuition and fees 50,461 - - 50,461Revenues from investments
Endowment spending distribution 44,992 903 45,895Other 1,181 1,181
Private gifts and grants 6,401 3,789 10,190Government grants 471 1,458 1,929Other additions 7,205 974 8,179Transfers among net asset classes 643 (643) - Net assets released from restrictions 6,610 (6,610) -
Total operating revenue 117,964 (129) - 117,835
Operating expenses:
Instruction 44,958 44,958Academic support 17,460 17,460Student services 11,069 11,069Institutional support 22,401 22,401Auxiliary activities 20,876 20,876Research and public service 4,889 4,889
Total operating expenses 121,653 - - 121,653
Decrease in net assets from operating activities (3,689) (129) - (3,818)
Nonoperating activities:
Net realized and unrealized gain oninvestments, net of endowment spending 82,496 179,355 261,851
Private gifts and grants 2,032 9 834 2,875Change in present value of life income funds (511) (511)Maturities of annuity and life income funds 1,534 (1,635) 101 - Change in other post retirement benefits 576 576Loss on extinguishment of debt (1,074) (1,074)Other (117) 1,118 75 1,076Transfers among net asset classes (269) (1,205) 1,474 -
Increase in net assets from nonoperating activities 85,178 177,131 2,484 264,793
Net increase in net assets for the year 81,489 177,002 2,484 260,975
Net Assets, June 30, 2010 546,586 657,744 176,947 1,381,277
Net Assets, June 30, 2011 628,075$ 834,746$ 179,431$ 1,642,252$
See accompanying notes to consolidated financial statements.
12
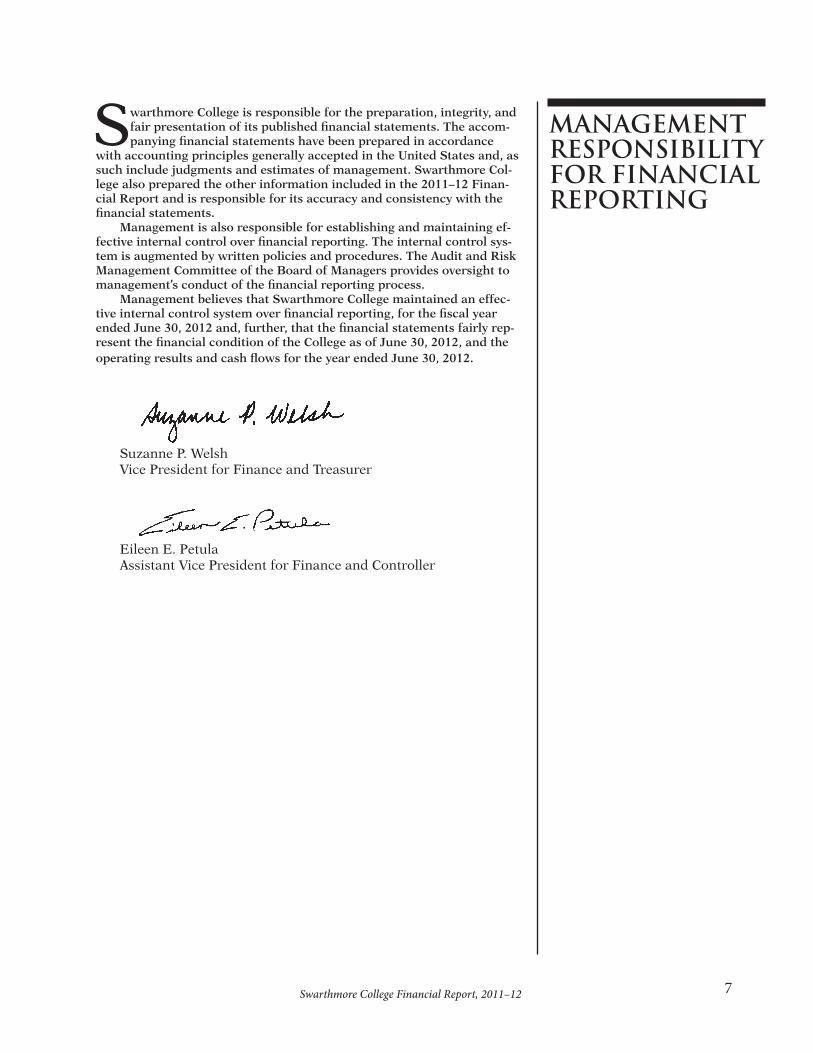
SWARTHMORE COLLEGECONSOLIDATED STATEMENTS OF CASH FLOWS
for the years ended June 30, 2012 and 2011(in thousands)
2012 2011Cash flows from operating activities
Change in net assets (14,997)$ 260,975$ Adjustments to reconcile change in net assets to net cash used by operating activities
Depreciation 7,123 6,983Loss on extinguishment of debt 578 1,074Amortization of bond premium (1,438) (910)Donor restricted gifts (8,568) (4,632)Net unrealized and realized gains on investments (18,690) (290,655)Change in student loan reserve 22 (66)
Changes in operating assets and liabilitiesChange in accounts receivable, contributions receivable,
prepaid expenses and inventories 345 4,469Change in deferred payments 10,247 1,345Change in student deposits, payables and accruals 1,347 (346)
Net cash used by operating activities (24,031) (21,763)
Cash flows from investing activities
Payments for property and equipment (12,171) (4,139)Proceeds from sale of investments 867,163 694,814Purchase of investments (863,437) (665,332)Student loans and employee mortgages advanced (704) (432)Payments on students loans and employee mortgages 2,374 2,034
Net cash provided/(used) by investing activities (6,775) 26,945
Cash flows from financing activities
Donor restricted gifts 8,568 4,632Change in assets restricted to investment in
property and equipment (17,282) 56Proceeds from bonds and notes payable 63,458 30,383Payments on bonds and notes payable (24,106) (33,327)
Net cash provided by financing activities 30,638 1,744
Change in cash and cash equivalents (168) 6,926
Cash and cash equivalents, beginning of year 32,433 25,507
Cash and cash equivalents, end of year 32,265$ 32,433$
Interest paid 7,852$ 8,252$ Non-cash capital expenditures in accounts payable 2,178$ 369$
See accompanying notes to consolidated financial statements.
13
SWARTHMORE COLLEGE NOTES TO CONSOLIDATED FINANCIAL STATEMENTS
June 30, 2012 and 2011 (dollars in thousands)
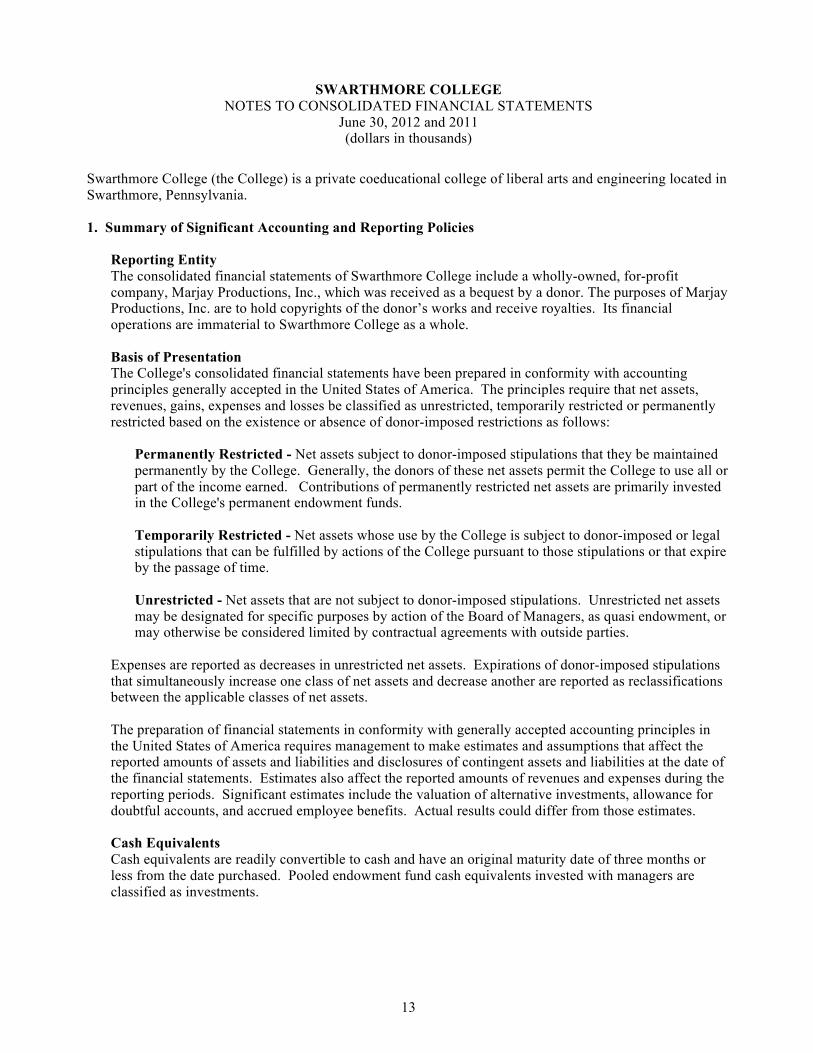
Swarthmore College (the College) is a private coeducational college of liberal arts and engineering located in Swarthmore, Pennsylvania. 1. Summary of Significant Accounting and Reporting Policies
Reporting Entity The consolidated financial statements of Swarthmore College include a wholly-owned, for-profit company, Marjay Productions, Inc., which was received as a bequest by a donor. The purposes of Marjay Productions, Inc. are to hold copyrights of the donor’s works and receive royalties. Its financial operations are immaterial to Swarthmore College as a whole.
Basis of Presentation
The College's consolidated financial statements have been prepared in conformity with accounting principles generally accepted in the United States of America. The principles require that net assets, revenues, gains, expenses and losses be classified as unrestricted, temporarily restricted or permanently restricted based on the existence or absence of donor-imposed restrictions as follows:
Permanently Restricted - Net assets subject to donor-imposed stipulations that they be maintained permanently by the College. Generally, the donors of these net assets permit the College to use all or part of the income earned. Contributions of permanently restricted net assets are primarily invested in the College's permanent endowment funds. Temporarily Restricted - Net assets whose use by the College is subject to donor-imposed or legal stipulations that can be fulfilled by actions of the College pursuant to those stipulations or that expire by the passage of time. Unrestricted - Net assets that are not subject to donor-imposed stipulations. Unrestricted net assets may be designated for specific purposes by action of the Board of Managers, as quasi endowment, or may otherwise be considered limited by contractual agreements with outside parties.
Expenses are reported as decreases in unrestricted net assets. Expirations of donor-imposed stipulations that simultaneously increase one class of net assets and decrease another are reported as reclassifications between the applicable classes of net assets.
The preparation of financial statements in conformity with generally accepted accounting principles in the United States of America requires management to make estimates and assumptions that affect the reported amounts of assets and liabilities and disclosures of contingent assets and liabilities at the date of the financial statements. Estimates also affect the reported amounts of revenues and expenses during the reporting periods. Significant estimates include the valuation of alternative investments, allowance for doubtful accounts, and accrued employee benefits. Actual results could differ from those estimates.
Cash Equivalents Cash equivalents are readily convertible to cash and have an original maturity date of three months or less from the date purchased. Pooled endowment fund cash equivalents invested with managers are classified as investments.
Notes to the consolidated financial statements (continued) (dollars in thousands)
14
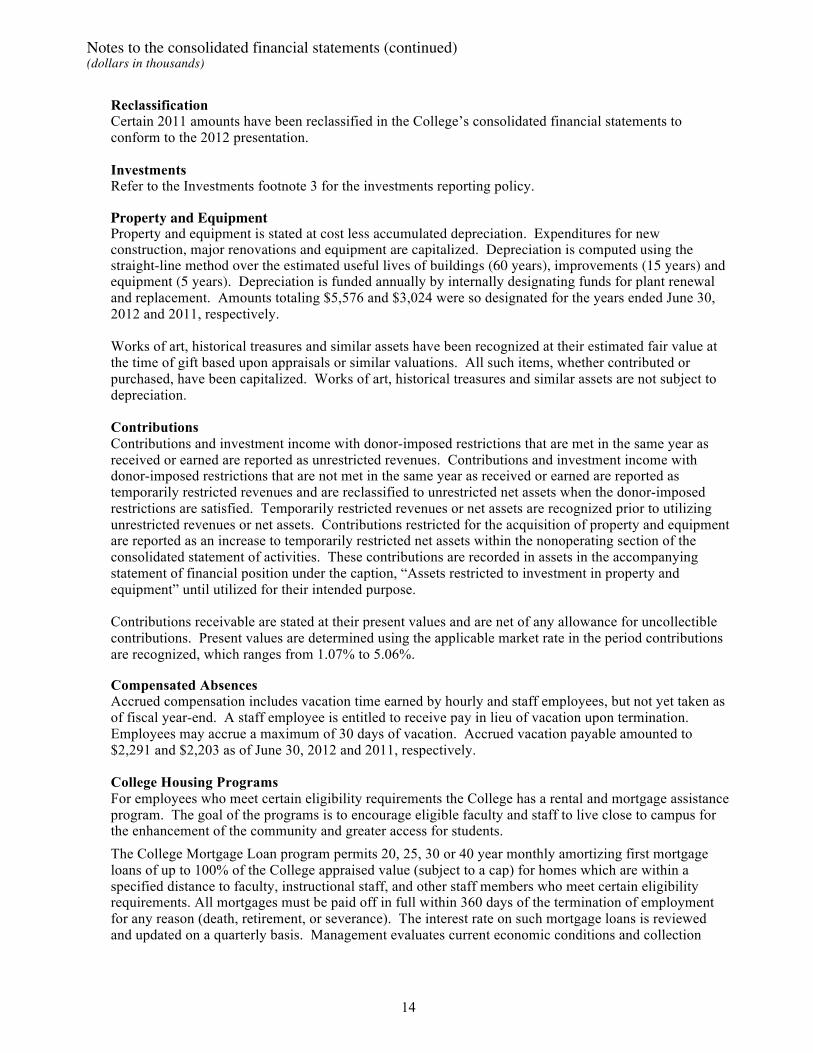
Reclassification Certain 2011 amounts have been reclassified in the College’s consolidated financial statements to conform to the 2012 presentation. Investments Refer to the Investments footnote 3 for the investments reporting policy.
Property and Equipment Property and equipment is stated at cost less accumulated depreciation. Expenditures for new construction, major renovations and equipment are capitalized. Depreciation is computed using the straight-line method over the estimated useful lives of buildings (60 years), improvements (15 years) and equipment (5 years). Depreciation is funded annually by internally designating funds for plant renewal and replacement. Amounts totaling $5,576 and $3,024 were so designated for the years ended June 30, 2012 and 2011, respectively. Works of art, historical treasures and similar assets have been recognized at their estimated fair value at the time of gift based upon appraisals or similar valuations. All such items, whether contributed or purchased, have been capitalized. Works of art, historical treasures and similar assets are not subject to depreciation.
Contributions Contributions and investment income with donor-imposed restrictions that are met in the same year as received or earned are reported as unrestricted revenues. Contributions and investment income with donor-imposed restrictions that are not met in the same year as received or earned are reported as temporarily restricted revenues and are reclassified to unrestricted net assets when the donor-imposed restrictions are satisfied. Temporarily restricted revenues or net assets are recognized prior to utilizing unrestricted revenues or net assets. Contributions restricted for the acquisition of property and equipment are reported as an increase to temporarily restricted net assets within the nonoperating section of the consolidated statement of activities. These contributions are recorded in assets in the accompanying statement of financial position under the caption, “Assets restricted to investment in property and equipment” until utilized for their intended purpose.
Contributions receivable are stated at their present values and are net of any allowance for uncollectible contributions. Present values are determined using the applicable market rate in the period contributions are recognized, which ranges from 1.07% to 5.06%.
Compensated Absences Accrued compensation includes vacation time earned by hourly and staff employees, but not yet taken as of fiscal year-end. A staff employee is entitled to receive pay in lieu of vacation upon termination. Employees may accrue a maximum of 30 days of vacation. Accrued vacation payable amounted to $2,291 and $2,203 as of June 30, 2012 and 2011, respectively. College Housing Programs For employees who meet certain eligibility requirements the College has a rental and mortgage assistance program. The goal of the programs is to encourage eligible faculty and staff to live close to campus for the enhancement of the community and greater access for students.
The College Mortgage Loan program permits 20, 25, 30 or 40 year monthly amortizing first mortgage loans of up to 100% of the College appraised value (subject to a cap) for homes which are within a specified distance to faculty, instructional staff, and other staff members who meet certain eligibility requirements. All mortgages must be paid off in full within 360 days of the termination of employment for any reason (death, retirement, or severance). The interest rate on such mortgage loans is reviewed and updated on a quarterly basis. Management evaluates current economic conditions and collection
Notes to the consolidated financial statements (continued) (dollars in thousands)
15
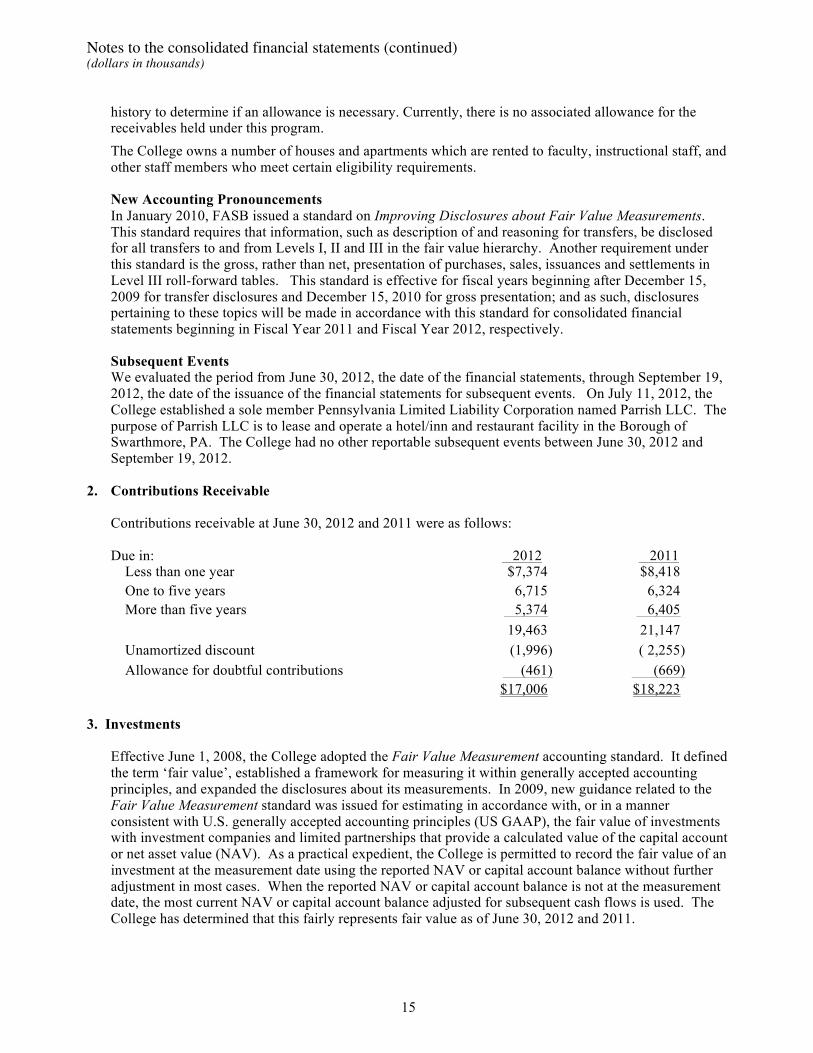
history to determine if an allowance is necessary. Currently, there is no associated allowance for the receivables held under this program.
The College owns a number of houses and apartments which are rented to faculty, instructional staff, and other staff members who meet certain eligibility requirements. New Accounting Pronouncements In January 2010, FASB issued a standard on Improving Disclosures about Fair Value Measurements. This standard requires that information, such as description of and reasoning for transfers, be disclosed for all transfers to and from Levels I, II and III in the fair value hierarchy. Another requirement under this standard is the gross, rather than net, presentation of purchases, sales, issuances and settlements in Level III roll-forward tables. This standard is effective for fiscal years beginning after December 15, 2009 for transfer disclosures and December 15, 2010 for gross presentation; and as such, disclosures pertaining to these topics will be made in accordance with this standard for consolidated financial statements beginning in Fiscal Year 2011 and Fiscal Year 2012, respectively. Subsequent Events We evaluated the period from June 30, 2012, the date of the financial statements, through September 19, 2012, the date of the issuance of the financial statements for subsequent events. On July 11, 2012, the College established a sole member Pennsylvania Limited Liability Corporation named Parrish LLC. The purpose of Parrish LLC is to lease and operate a hotel/inn and restaurant facility in the Borough of Swarthmore, PA. The College had no other reportable subsequent events between June 30, 2012 and September 19, 2012.
2. Contributions Receivable Contributions receivable at June 30, 2012 and 2011 were as follows: Due in: 2012 2011
Less than one year $7,374 $8,418 One to five years 6,715 6,324 More than five years 5,374 6,405
19,463 21,147 Unamortized discount (1,996) ( 2,255) Allowance for doubtful contributions (461) (669) $17,006 $18,223
3. Investments
Effective June 1, 2008, the College adopted the Fair Value Measurement accounting standard. It defined the term ‘fair value’, established a framework for measuring it within generally accepted accounting principles, and expanded the disclosures about its measurements. In 2009, new guidance related to the Fair Value Measurement standard was issued for estimating in accordance with, or in a manner consistent with U.S. generally accepted accounting principles (US GAAP), the fair value of investments with investment companies and limited partnerships that provide a calculated value of the capital account or net asset value (NAV). As a practical expedient, the College is permitted to record the fair value of an investment at the measurement date using the reported NAV or capital account balance without further adjustment in most cases. When the reported NAV or capital account balance is not at the measurement date, the most current NAV or capital account balance adjusted for subsequent cash flows is used. The College has determined that this fairly represents fair value as of June 30, 2012 and 2011.

Notes to the consolidated financial statements (continued) (dollars in thousands)
16
The College’s interests in private equity and real asset limited partnerships and other nonmarketable investments managed by investment companies are carried at the capital account balance or NAV as determined by the investment managers as of June 30, 2012 and 2011. The College performs additional due diligence and reviews these for reasonableness. The College has assessed factors including, but not limited to, managers’ compliance with the Fair Value Measurement standard in their audited financial statements, price transparency and valuation policies, and redemption conditions and restrictions.
Endowment investments include the College’s permanent funds and quasi-endowment funds. Although quasi-endowment funds have been established by the Board of Managers for the same purposes as endowment funds, any portion of quasi-endowment funds may be expended. Annuity, unitrust and life income funds periodically pay either the income earned or a fixed percentage of the assets to designated beneficiaries and terminate at a designated time, usually upon the death of the last designated income beneficiary. The College’s remainder interest is then available for use by the College as designated by either the donor or the Board of Managers. The actuarial liability for the charitable gift annuities as of June 30, 2012 and 2011 is based on the present value of future payments discounted at rates that vary by participant from 2.0% to 11.6% and the 2000CM Mortality Table. The actuarial liability for the unitrusts as of June 30, 2012 and 2011 is based on the present value of future payments discounted at rates that vary by trust from 5% to 9% and the Annuity 2000 Mortality Table.
Investment activity for fiscal years 2012 and 2011 was:
Endowment Annuity andand similar Life Income 2012 2011
funds funds Other Total Total
Investments, beginning of year 1,508,483$ 43,271$ 12,037$ 1,563,791$ 1,302,618$
Contributions 6,662 3,556 10,218 7,270Maturities of annuity and life income funds (6,762) (6,762) (4,225)Other 51 (68) (17) (5,556)Transfers in 5,758 27,639 33,397 5,325Transfers out (5,226) (5,226) (5,197)
7,194 (3,155) 27,571 31,610 (2,383)
Interest and dividends 17,584 1,286 18,870 24,291Unrealized and realized gains and (losses) 18,874 156 (341) 18,689 290,655Investment management fees (4,502) (4,502) (4,676)
31,956 1,442 (341) 33,057 310,270
Payments to annuity and life income beneficiaries (845) (845) (819)Endowment spending distribution Unrestricted (47,888) (47,888) (44,992) Temporarily Restricted (970) (970) (903)
(48,858) (845) 0 (49,703) (46,714)
Investments, end of year 1,498,775$ 40,713$ 39,267$ 1,578,755$ 1,563,791$

Notes to the consolidated financial statements (continued) (dollars in thousands)
17
The Fair Value Measurement accounting standard established a three-level hierarchy for fair value measurements based on the transparency of information used in the valuation of an asset or liability as of the measurement date. Categorization within the fair value hierarchy is based upon the lowest level of input that is significant to the fair value. Observable inputs reflect market data obtained from sources independent of the reporting entity, and unobservable inputs reflect the entity’s own assumptions about how market participants would value an asset or liability based on the best information available. Valuation techniques used to measure fair value must maximize the use of observable inputs and minimize the use of unobservable inputs. The standard describes a fair value hierarchy based on three levels of inputs, of which the first two are considered observable and the last unobservable: ! Level I-Quoted prices are available in active markets for identical investments as of the reporting
date.
! Level II- Pricing inputs, including broker quotes, are generally those other than exchange-quoted prices in active markets, which are either directly or indirectly observable as of the reporting date.
! Level III- Pricing inputs are unobservable for the investment and include situations where a/ there is minimal, if any, market activity for the investment and b/ the inputs used in determination of fair value require significant management judgment or estimation.
The endowment objective established by the Board of Managers is to provide a sustainable level of distribution in support of the College’s annual operating budget while preserving the real purchasing power of the endowment before gifts. The endowment provides significant support of the College’s operations; therefore, endowment policies seek to achieve stability of and sustained growth in this support. The College aims for the distribution from the endowment for operations to grow over time at least as quickly as the average annual increase in College costs. In furtherance of these objectives, the endowment is invested in a diversified investment portfolio of equity and fixed income securities in order to reduce volatility and achieve targeted risk-adjusted returns over complete market cycles. The College’s investment objectives guide its asset allocation policy and are achieved by investing with external investment managers operating through a variety of investment vehicles, including separate accounts, commingled funds managed by investment companies and limited partnerships. The College has investments in six asset categories: ! Cash and Cash Equivalents are investments in short-term cash and money market instruments. These
are able to be liquidated immediately or within 30 days.
! Fixed Income includes investments in fixed income securities, including U.S. Treasury bonds and Treasury Inflation-Protected securities. Level I assets have immediate liquidity while Level III assets have liquidity provisions similar to those for marketable alternatives, as described below.
! Public Equity includes investment in publicly traded stocks of domestic and international companies. Level I and Level II assets are able to be liquidated immediately or within 30 days. Level III assets have liquidity provisions similar to those for marketable alternatives, as described below.
! Real Assets include investments in real estate and natural resources such as oil and gas and commodities. Level II assets are able to be liquidated within 30 days. Level III assets are invested through limited partnerships which have stated terms of typically 10-12 years. The remaining terms of the College’s private real estate and natural resource investments range from 4 to 8 years and 3 to 29 years respectively.
! Private Equity includes investments in buyouts, venture capital and distressed companies. These assets are invested through limited partnerships which have stated terms of typically 10-12 years. The remaining terms of the College’s private equity investments range from 1 to 18 years.
Notes to the consolidated financial statements (continued) (dollars in thousands)
18
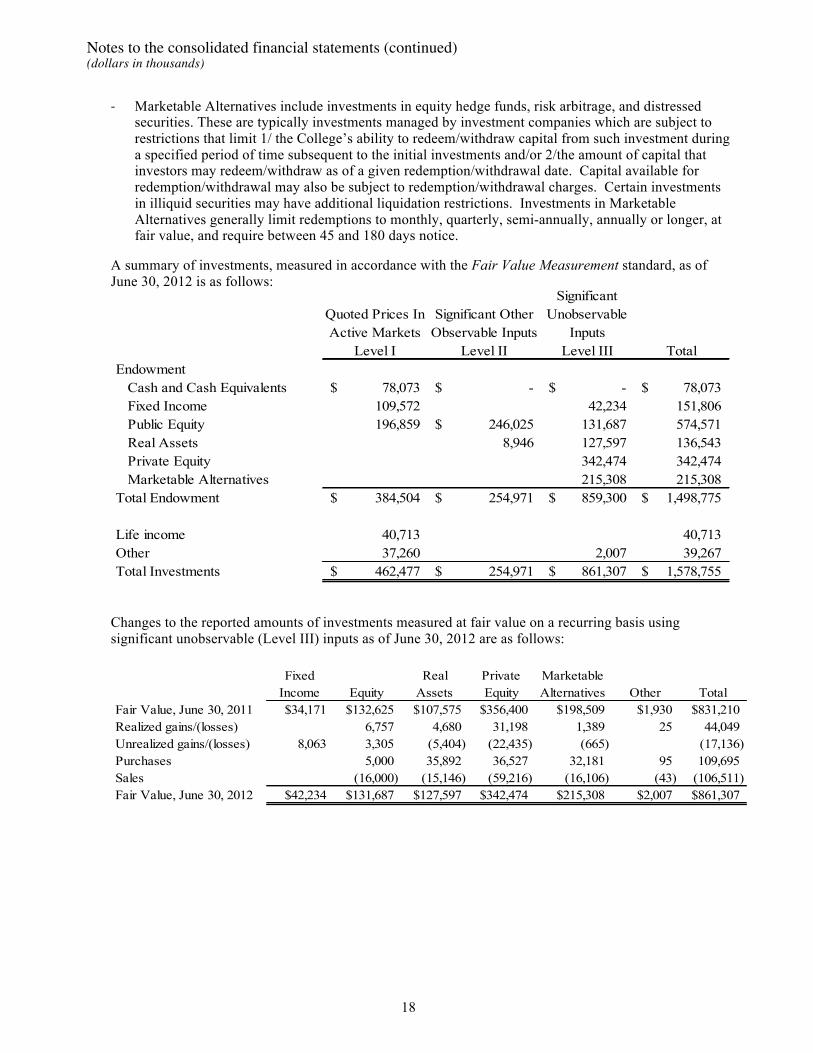
! Marketable Alternatives include investments in equity hedge funds, risk arbitrage, and distressed securities. These are typically investments managed by investment companies which are subject to restrictions that limit 1/ the College’s ability to redeem/withdraw capital from such investment during a specified period of time subsequent to the initial investments and/or 2/the amount of capital that investors may redeem/withdraw as of a given redemption/withdrawal date. Capital available for redemption/withdrawal may also be subject to redemption/withdrawal charges. Certain investments in illiquid securities may have additional liquidation restrictions. Investments in Marketable Alternatives generally limit redemptions to monthly, quarterly, semi-annually, annually or longer, at fair value, and require between 45 and 180 days notice.
A summary of investments, measured in accordance with the Fair Value Measurement standard, as of June 30, 2012 is as follows:
Quoted Prices In Active Markets
Level I
Significant Other Observable Inputs
Level II
Significant Unobservable
Inputs Level III Total
Endowment Cash and Cash Equivalents 78,073$ -$ -$ 78,073$ Fixed Income 109,572 42,234 151,806 Public Equity 196,859 246,025$ 131,687 574,571 Real Assets 8,946 127,597 136,543 Private Equity 342,474 342,474 Marketable Alternatives 215,308 215,308 Total Endowment 384,504$ 254,971$ 859,300$ 1,498,775$
Life income 40,713 40,713 Other 37,260 2,007 39,267 Total Investments 462,477$ 254,971$ 861,307$ 1,578,755$
Changes to the reported amounts of investments measured at fair value on a recurring basis using significant unobservable (Level III) inputs as of June 30, 2012 are as follows:
Fixed Income Equity
Real Assets
Private Equity
Marketable Alternatives Other Total
Fair Value, June 30, 2011 $34,171 $132,625 $107,575 $356,400 $198,509 $1,930 $831,210 Realized gains/(losses) 6,757 4,680 31,198 1,389 25 44,049 Unrealized gains/(losses) 8,063 3,305 (5,404) (22,435) (665) (17,136) Purchases 5,000 35,892 36,527 32,181 95 109,695 Sales (16,000) (15,146) (59,216) (16,106) (43) (106,511) Fair Value, June 30, 2012 $42,234 $131,687 $127,597 $342,474 $215,308 $2,007 $861,307

Notes to the consolidated financial statements (continued) (dollars in thousands)
19
A summary of investments, measured in accordance with the Fair Value Measurement standard, as of June 30, 2011 is as follows:
Quoted Prices In Active Markets
Level I
Significant Other Observable Inputs
Level II
Significant Unobservable
Inputs Level III Total
Endowment Cash and Cash Equivalents 59,726$ -$ -$ 59,726$ Fixed Income 135,012 34,171 169,183 Public Equity 208,990 263,438$ 132,625 605,053 Real Assets 12,037 107,575 119,612 Private Equity 356,400 356,400 Marketable Alternatives 198,509 198,509 Total Endowment 403,728$ 275,475$ 829,280$ 1,508,483$
Life income 43,271 43,271 Other 10,107 1,930 12,037 Total Investments 457,106$ 275,475$ 831,210$ 1,563,791$
Changes to the reported amounts of investments measured at fair value on a recurring basis using significant unobservable (Level III) inputs as of June 30, 2011 are as follows:
Fixed Income Equity
Real Assets
Private Equity
Marketable Alternatives Other Total
Fair Value, June 30, 2010 $31,540 $116,381 $72,725 $272,630 $190,516 $1,972 $685,764 Realized gains/(losses) 5,369 4,068 11,660 8,920 (1) 30,016 Unrealized gains/(losses) 2,631 28,875 14,925 77,675 12,283 136,389 Purchases 27,472 42,398 18,000 180 88,050 Sales (18,000) (11,615) (47,963) (31,210) (221) (109,009) Fair Value, June 30, 2011 34,171$ 132,625$ 107,575$ 356,400$ 198,509$ 1,930$ 831,210$
The College has made commitments to various limited partnerships. The College expects the majority of these funds to be called over the next four years with liquidity to be received over the next fifteen years. The fair value of outstanding commitments at June 30, 2012 and 2011 were:
2012 2011 Private equity $137,328 $118,073 Real estate 60,124 52,664 Natural resources 35,726 35,776 Total unfunded commitments $233,178 $206,513
The College has various sources of internal liquidity at its disposal, including cash, cash equivalents, and marketable debt and equity securities. If called upon at June 30, 2012, management estimates that it could have liquidated within 30 days approximately $697 million (unaudited) to meet short-term needs and provide investment flexibility.
Notes to the consolidated financial statements (continued) (dollars in thousands)
20
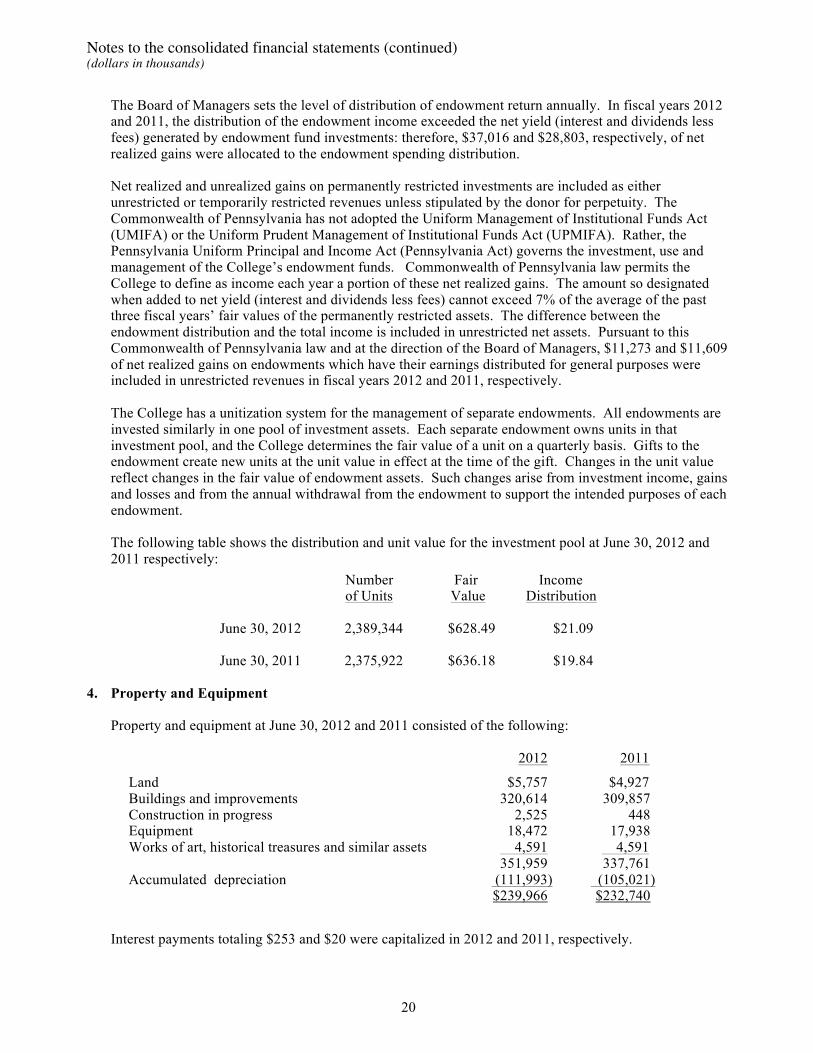
The Board of Managers sets the level of distribution of endowment return annually. In fiscal years 2012 and 2011, the distribution of the endowment income exceeded the net yield (interest and dividends less fees) generated by endowment fund investments: therefore, $37,016 and $28,803, respectively, of net realized gains were allocated to the endowment spending distribution. Net realized and unrealized gains on permanently restricted investments are included as either unrestricted or temporarily restricted revenues unless stipulated by the donor for perpetuity. The Commonwealth of Pennsylvania has not adopted the Uniform Management of Institutional Funds Act (UMIFA) or the Uniform Prudent Management of Institutional Funds Act (UPMIFA). Rather, the Pennsylvania Uniform Principal and Income Act (Pennsylvania Act) governs the investment, use and management of the College’s endowment funds. Commonwealth of Pennsylvania law permits the College to define as income each year a portion of these net realized gains. The amount so designated when added to net yield (interest and dividends less fees) cannot exceed 7% of the average of the past three fiscal years’ fair values of the permanently restricted assets. The difference between the endowment distribution and the total income is included in unrestricted net assets. Pursuant to this Commonwealth of Pennsylvania law and at the direction of the Board of Managers, $11,273 and $11,609 of net realized gains on endowments which have their earnings distributed for general purposes were included in unrestricted revenues in fiscal years 2012 and 2011, respectively. The College has a unitization system for the management of separate endowments. All endowments are invested similarly in one pool of investment assets. Each separate endowment owns units in that investment pool, and the College determines the fair value of a unit on a quarterly basis. Gifts to the endowment create new units at the unit value in effect at the time of the gift. Changes in the unit value reflect changes in the fair value of endowment assets. Such changes arise from investment income, gains and losses and from the annual withdrawal from the endowment to support the intended purposes of each endowment.
The following table shows the distribution and unit value for the investment pool at June 30, 2012 and 2011 respectively:
4. Property and Equipment
Property and equipment at June 30, 2012 and 2011 consisted of the following:
2012 2011
Land $5,757 $4,927 Buildings and improvements 320,614 309,857 Construction in progress 2,525 448 Equipment 18,472 17,938 Works of art, historical treasures and similar assets 4,591 4,591
351,959 337,761 Accumulated depreciation (111,993) (105,021)
$239,966 $232,740
Interest payments totaling $253 and $20 were capitalized in 2012 and 2011, respectively.
Number of Units
Fair Value
Income Distribution
June 30, 2012
2,389,344 $628.49 $21.09
June 30, 2011 2,375,922 $636.18 $19.84

Notes to the consolidated financial statements (continued) (dollars in thousands)
21
5. Deferred Payments and Other Liabilities
Deferred payments and other liabilities at June 30, 2012 and 2011 consisted of the present value of future payments due to or on behalf of employees and former employees under retirement and postretirement programs, donors under annuity and life income programs, a capital purchase agreement, the conditional asset retirement obligation and conditional gifts.
2012 2011 Donors $13,373 $10,443
Postretirement health benefit 11,917 8,657
Conditional gift liability 10,000 10,000
Employees and former employees 4,809 5,369
Capital acquisition 4,592 -
Conditional asset retirement obligation 1,015 990
$45,706 $35,459
The College currently provides a postretirement health benefit in the form of a monthly stipend for the purchase of medical premiums to all employees who meet certain eligibility requirements. The components of the benefit as of June 30, 2012 and 2011 are as follows:
2012 2011
Change in accumulated postretirement benefit obligationPostretirement benefit obligation at beginning of yearActives not fully eligible to retire 4,756$ 5,306$ Actives fully eligible to retire 2,318 2,460Retirees 1,583 1,467Total 8,657 9,233
Service cost 353 420Interest cost 486 466Actuarial (gain) / loss 2,644 (1,252)Benefits paid (223) (210)
Postretirement benefit obligation at end of yearActives not fully eligible to retire 7,422 4,756Actives fully eligible to retire 2,877 2,318Retirees 1,618 1,583Total 11,917$ 8,657$

Notes to the consolidated financial statements (continued) (dollars in thousands)
22
2012 2011Change in plan assetsEmployer contribution 223$ 210$ Benefits paid (223) (210)Fair value of plan assets at end of year -$ -$
Funded statusPostretirement benefit obligation at end of year 11,917$ 8,657$ Fair value of plan assets at end of year - - Funded status end of year 11,917 8,657
Current liability 338 297Non-current liability 11,579 8,360Total 11,917$ 8,657$
Components of the net periodic postretirement benefit costService cost 353$ 420$ Interest cost 486 466Amortization of actuarial (gain) / loss (35) 45Total 804$ 931$
OPEB changes other than net periodic postretirement benefit costNew actuarial (gain) / loss 2,644$ (1,252)$ Amortization of unrecognized amounts 35 (45) Total 2,679$ (1,297)$
Unrecognized amounts and amortization amounts in the following year:Net actuarial (gain) / loss 1,541 (1,138)Total 1,541$ (1,138)$
Amortization amounts in following year (estimate)Net actuarial (gain) / loss 30 (21)Total 30$ (21)$

Notes to the consolidated financial statements (continued) (dollars in thousands)
23
Assumptions and effects:Medical trend rate next year 9.00% 10.00%Ultimate trend rate 5.00% 5.00%Year ultimate trend rate is achieved 2016 2016Discount rate used to value end of year accumulated postretirement benefit obligation 3.90% 5.48%Discount rate used to value net periodic postretirement benefit cost 5.48% 5.32%
Effect of a 1% increase in health care cost trend rate on:Interest cost plus service cost 155$ 169$ Accumulated postretirement benefit obligation 2,219$ 1,339$
Effect of a 1% decrease in health care cost trend rate on:Interest cost plus service cost (125)$ (136)$ Accumulated postretirement benefit obligation (1,783)$ (1,104)$
Measurement date 6/30/2012 6/30/2011
Estimated future benefit payments (net of employee contributions):
Year Beginning July 1st Employer Payment2012 338 2013 385 2014 422 2015 468 2016 516 2017 - 2021 2,474
6. Bonds and Notes Payable
Bonds and notes payable at June 30, 2012 and 2011 were: 2012 2011
Fair Value Cost Fair Value Cost
Swarthmore Borough Authority 1998 Revenue Bonds $3,024 $2,930 $4,529 $4,300 2002 Revenue Bonds 2,177 2,172 25,056 24,492 2006A Revenue Bonds 83,992 78,660 79,542 78,823 2008 Revenue Bonds 26,808 26,144 27,865 26,572 2009 Revenue Bonds 8,916 8,815 9,196 9,047 2011 Revenue Bonds 31,293 29,985 30,317 30,383 2011B Revenue Bonds 17,620 17,024 - - 2011C Revenue Bonds 48,131 46,280 - - Other notes payable 865 854 865 865 Total bonds and notes payable $222,826 $212,864 $177,370 $174,482

Notes to the consolidated financial statements (continued) (dollars in thousands)
24
The College bond ratings were Aaa/AAA for the years ended June 30, 2012 and 2011. On December 21, 2011, the College issued $14,380 aggregate principal amount of 2011B Revenue Bonds (2011B Revenue Bonds) through the Swarthmore Borough Authority (the Authority) at a premium. The proceeds will be used for various tax-exempt capital projects and to fund the costs of issuing the 2011B Bonds. The 2011B Bonds have interest rates of 2.0% to 5.0% depending upon the maturity dates, which range from 2012 to 2021 in annual amounts ranging from $270 to $11,595. Interest is payable semi-annually.
On December 21, 2011, the College issued $46,280 aggregate principal amount of taxable 2011C Revenue Bonds (2011C Revenue Bonds) through the Swarthmore Borough Authority (the Authority). The proceeds were used for general operations, to advance refund a portion of the 2002 Revenue Bonds, par value of $19,665 with maturity dates between 2013 and 2020 and interest rates of 4.75% to 5.25% depending upon the maturity dates, and to fund the costs of issuing the 2011C Bonds. The 2011C Bonds have interest rates of .708% to 3.10% depending upon the maturity dates, which range from 2012 to 2021 in annual amounts ranging from $855 to $21,420. Interest is payable semi-annually. On June 29, 2011, the College issued $26,665 aggregate principal amount of 2011 Revenue Bonds (2011 Bonds) through the Swarthmore Borough Authority (the Authority) at a premium. The proceeds were used to refund the 2001 Revenue Bonds, par value of $29,320 which were scheduled to mature on September 15, 2031, and to fund the costs of issuing the 2011 Bonds. The 2011 Bonds have interest rates of 3.0%, 4.0% and 5.0% (priced to yield 2.18%) and mature on September 15, 2018. Interest is payable semi-annually. On July 29, 2009, the College issued $8,525 aggregate principal amount of 2009 Revenue Bonds (2009 Bonds) through the Swarthmore Borough Authority (the Authority) at a premium. The proceeds were used to refund a portion of the 1998 Revenue Bonds which were scheduled to mature on September 15, 2018 and September 15, 2028, and to fund the costs of issuing the 2009 Bonds. The 2009 Bonds have interest rates of 2.0% and 5.0% (priced to yield 1.56%) and mature on September 15, 2013. Interest is payable semi-annually.
On April 30, 2008, the College issued $25,360 aggregate principal amount of 2008 Revenue Bonds (2008 Bonds) through the Authority at a premium. The proceeds were used to refund the 2006B variable auction rates notes (2006B Bonds), par value of $27,600, and to fund the costs of issuing the 2008 Bonds. The 2008 Bonds have an interest rate of 5.0% (priced to yield 2.95%) and mature on September 15, 2013. Interest is payable semi-annually. On December 20, 2006, the College issued $76,085 aggregate principal amount of 2006A Revenue Bonds (2006A Bonds) through the Authority at a premium. The proceeds were used to advance refund $10,375 of the 1998 Revenue Bonds, to advance refund $63,970 of the 2001 Revenue Bonds, and to fund the costs of issuing the 2006A Bonds. The 2006A Revenue Bonds have interest rates from 4.0% to 5.0% depending upon the maturity dates, which range from 2014 to 2030 in annual amounts ranging from $450 to $22,915. Interest is payable semi-annually.
On July 15, 2002, the College issued $37,650 aggregate principal amount of 2002 Revenue Bonds (2002 Bonds) through the Authority to refund the 1992 Revenue Bonds in order to take advantage of a lower interest rate. On December 21, 2011, $19,665 of the 2002 Revenue Bonds with maturity dates between 2013 and 2020 and interest rates ranging from 4.75% to 5.250% depending upon the maturity dates, were advanced refunded using proceeds from the taxable 2011C Revenue Bonds. The 2002 Revenue Bond that remains outstanding has an interest rate of 5.00%, a maturity date of September 15, 2012, and a balance of $2,155.

Notes to the consolidated financial statements (continued) (dollars in thousands)
25
On July 1, 1998, the College issued $34,960 of 1998 Revenue Bonds through the Authority. The proceeds were used for the refunding of the 1988 Revenue Bonds of $6,530, the advance refunding of $8,770 of 1992 Revenue Bonds, $18,088 to finance the costs of renovation and other capital improvements to various College facilities and the remainder to pay a portion of the costs of issuing the 1998 Revenue Bonds. On December 20, 2006, $10,375 of the 1998 Revenue Bonds with maturity dates between 2014 and 2028 and interest rates of 5.0% were advance refunded using proceeds from the 2006A Revenue Bonds. The 1998 Revenue Bonds which remain outstanding have interest rates of 4.70% and 4.75%, maturity dates in 2012 and 2013, and balances of $1,435 and $1,495. The 1998 Revenue Bonds are collateralized by a pledge of all unrestricted College revenues.
Debt service payments for the next five fiscal years on all borrowings are as follows: Principal Interest Total 2012-2013 $4,726 $8,370 $13,096 2013-2014 38,761 7,407 46,168 2014-2015 4,280 6,499 10,779 2015-2016 4,370 6,414 10,784 2016-2017 4,475 6,315 10,790
Interest paid on bonds and notes payable was $7,852 and $8,252 for the years ended June 30, 2012 and 2011, respectively.
7. Retirement Benefits
Retirement benefits for all eligible employees of the College are individually funded and vested under a defined contribution Sec. 403(b) retirement plan with Teachers Insurance and Annuity Association of America (TIAA), Vanguard Group of Investment Companies or Calvert Group. Under this arrangement, the College makes monthly contributions as defined in the Plan to the accounts of all employees. The College's contributions under this Plan are included in operating expenses and were $4,776 in 2012 and $4,663 in 2011. During fiscal year 2003 the College initiated a Sec. 457 non-qualified deferred compensation plan for senior management employees. Participants elect to defer compensation, which is invested with the Teachers Insurance and Annuity Association of America (TIAA) or the Vanguard Group of Investment Companies and is considered College property until the employee withdraws the funds due to emergency, termination or retirement. The participants’ contributions are subject to the general creditors of the College, so the invested asset is offset by a corresponding liability in the amounts of $644 and $618 at June 30, 2012 and 2011 respectively. The College does not record transaction activity as revenue or expense. The investments are reported at fair value.
Notes to the consolidated financial statements (continued) (dollars in thousands)
26
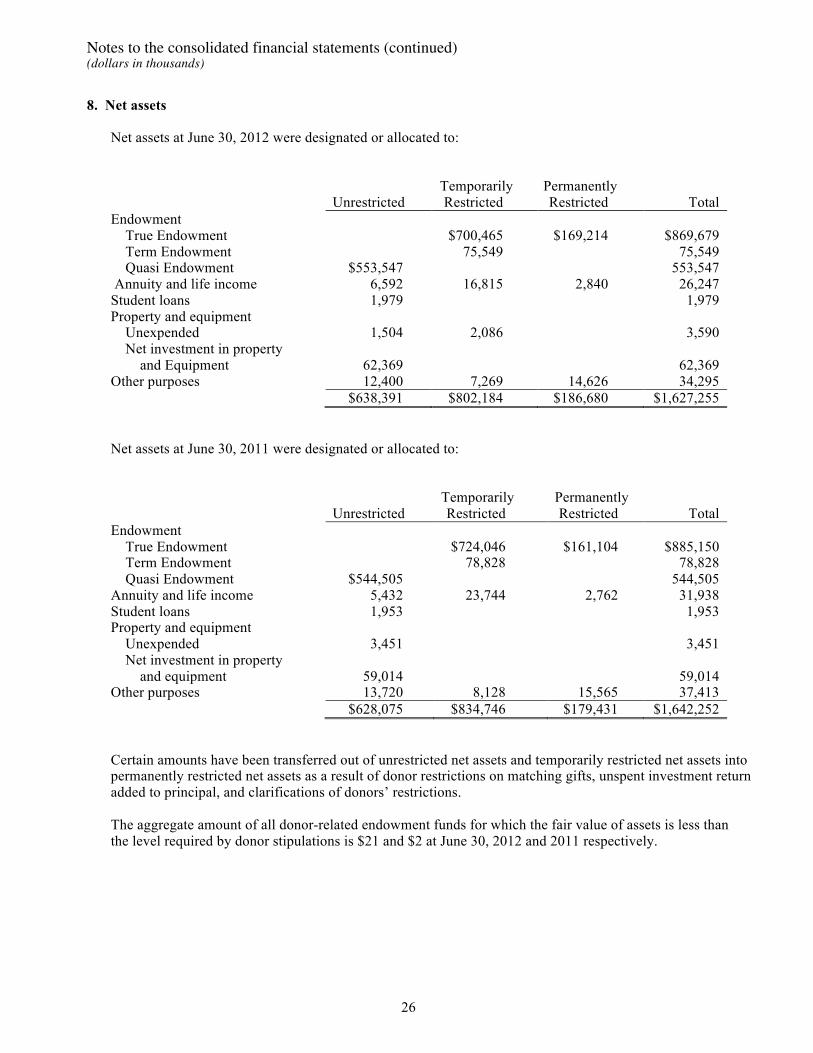
8. Net assets Net assets at June 30, 2012 were designated or allocated to: Temporarily Permanently
Unrestricted Restricted Restricted Total Endowment True Endowment $700,465 $169,214 $869,679 Term Endowment 75,549 75,549 Quasi Endowment $553,547 553,547 Annuity and life income 6,592 16,815 2,840 26,247 Student loans 1,979 1,979 Property and equipment Unexpended 1,504 2,086 3,590 Net investment in property and Equipment
62,369
62,369
Other purposes 12,400 7,269 14,626 34,295 $638,391 $802,184 $186,680 $1,627,255
Net assets at June 30, 2011 were designated or allocated to:
Temporarily Permanently Unrestricted Restricted Restricted Total Endowment True Endowment $724,046 $161,104 $885,150 Term Endowment 78,828 78,828 Quasi Endowment $544,505 544,505 Annuity and life income 5,432 23,744 2,762 31,938 Student loans 1,953 1,953 Property and equipment Unexpended 3,451 3,451 Net investment in property and equipment
59,014
59,014
Other purposes 13,720 8,128 15,565 37,413 $628,075 $834,746 $179,431 $1,642,252
Certain amounts have been transferred out of unrestricted net assets and temporarily restricted net assets into permanently restricted net assets as a result of donor restrictions on matching gifts, unspent investment return added to principal, and clarifications of donors’ restrictions.
The aggregate amount of all donor-related endowment funds for which the fair value of assets is less than the level required by donor stipulations is $21 and $2 at June 30, 2012 and 2011 respectively.

Notes to the consolidated financial statements (continued) (dollars in thousands)
27
Changes to the reported amount of the College's endowment as of June 30 are as follows:
UnrestrictedTemporarily Restricted
Permanently Restricted Total
Endowment total, June 30, 2010 464,944$ 627,690$ 156,620$ 1,249,254$
Contributions 1,246 1,107 2,876 5,229 Transfers (2,875) (1,222) 1,584 (2,513) Interest and dividends 22,888 24 22,912 Unrealized and realized gains (losses) 107,970 176,202 284,172 Investment management fees (4,676) (4,676) Endowment spending distribution (44,992) (903) (45,895) Endowment total, June 30, 2011 544,505$ 802,874$ 161,104$ 1,508,483$
Contributions 2,990 3,672 6,662 Transfers (2,597) (1,298) 4,427 532 Interest and dividends 17,573 11 17,584 Unrealized and realized gains (losses) 43,466 (24,592) 18,874 Investment management fees (4,502) (4,502) Endowment spending distribution (47,888) (970) (48,858) Endowment total, June 30, 2012 553,547$ 776,014$ 169,214$ 1,498,775$
9. Expenses by Natural Classification
Expenses for the years ended June 30, 2012 and 2011 were incurred for the following:
2012 2011 Compensation Faculty $32,663 $31,553 Staff 39,781 39,692 Student 1,313 1,257 Amortization 232 193 Life income payments and other adjustments 1,894 1,970 Bookstore merchandise for resale 544 556 Dining services food 2,026 1,907 Equipment 2,932 3,291 Foreign study program expenses 2,539 2,694 Insurance 724 709 Interest 6,275 7,135 Library materials 2,161 2,178 Services, supplies and other 17,458 14,956 Real estate taxes 958 935 Travel 3,542 3,213 Telephone 51 48 Utilities 2,111 2,383 Depreciation 7,123 6,983
$124,327 $121,653

Notes to the consolidated financial statements (continued) (dollars in thousands)
28
10. Income Tax
The College has been granted tax-exempt status as a non-profit organization under Section 501(c) (3) of the Internal Revenue Code, and accordingly, files federal tax Form 990 (Return of Organization Exempt from Income Tax) annually. The College also files federal tax Form 990-T (Exempt Organizations Business Income Tax Return).
Marjay Productions, Inc. is a for-profit corporation subject to federal income taxes under the Internal Revenue Code. Per the requirement to assess uncertain tax positions, no adjustments to the financial statements were required as a result of the standard. The College will continue to monitor and evaluate its unrelated business income activity.
11. Commitments and Contingencies
In the ordinary course of business the College occasionally becomes involved in legal proceedings relating to contracts or other matters. While any proceedings or litigation have an element of uncertainty, management believes that the outcome of any pending or threatened actions will not have a material adverse effect on the business or financial condition of the College.
As of June 30, 2012 and 2011, the College had outstanding commitments for construction contracts of $3,158 and $1,243, respectively.

i
THE CORPORATIONGiles K. Kemp ’72, ChairNeil R. Grabois ’57, Vice ChairNancy N. Nicely, SecretaryMaurice G. Eldridge ’61, Assistant SecretarySuzanne P. Welsh, Treasurer Lori Ann Johnson, Assistant Treasurer
BOARD OF MANAGERSTerm Expires May 2013Jorge Aguilar ’05Richard A. Barasch ’76Dulany Ogden Bennett ’66James C. Hormel ’55Frederick W. Kyle ’54Susan B. Levine ’78Jorge Munoz ’84Tracey E. Patillo ’90John A. Riggs ’64Carl Russo ’79Robin M. Shapiro ’78David W. Singleton ’68Thomas E. Spock ’78Danielle Toaltoan ’07Joseph L. Turner ’73
Term Expires June 2013Susan S. Morrison ’81, ex officio
Term Expires May 2014Rhonda Resnick Cohen ’76Janet Smith Dickerson H’92Jenny Hourihan Bailin ’80Lewis H. Lazarus ’78Sibella Clark Pedder ’64Gustavo Schwed ’84
Term Expires May 2015Sohail Bengali ’79Nathaniel A. K. Erskine ’10Thomas W. T. Hartnett ’94Jane Lang ’67Lucinda Lewis ’70Bennett Lorber ’64James Lovelace ’79Christopher M. Niemczewski ’74
Term Expires May 2016Delvin Dinkins ’93David Gelber ’63Neil R. Grabois ’57Marilyn Holifield ’69Barbara W. Mather ’65Ann Riechelderfer ’72Elizabeth H. Scheuer ’75Sujatha Srinivasan ’01Ruth Shoemaker Wood ’01
EmeritiEugene M. Lang ’38Julie Lange Hall ’55Samuel L. Hayes III ’57Jerome Kohlberg ’46
Elizabeth J. McCormackMarge Pearlman Scheuer ’48J. Lawrence Shane ’56
FINANCE COMMITTEEBarbara W. Mather ’65, ChairRichard A. Barasch ’76, Vice ChairSohail Bengali ’79Rhonda Cohen ’76Harold Kalkstein ’78 Susan Levine ’78Lucinda M. Lewis ’70John A. Riggs ’64Gustavo Schwed ’84David Singleton ’68Thomas E. Spock ’79Joseph Turner ’73
AUDIT AND RISK MANAGEMENT COMMITTEERichard Barasch ’76, ChairJenny Hourihan Bailin ’80, Vice ChairSohail Bengali ’79Lewis H. Lazarus ’78Barbara W. Mather ’65, ex officioDavid W. Singleton ’68
INVESTMENT COMMITTEEChristopher M. Niemczewski ’74, ChairSalem Shuchman ’84, Vice ChairEphraim Greenwall ’80 Mark Harmeling ’74 Eugene M. Lang ’38Barbara W. Mather ’65, ex officioCorey Mulloy ’94Gustavo Schwed ’84
PRESIDENT’S STAFFAs of June 30, 2012Rebecca Chopp, PresidentJames L. Bock III ’90, Vice President and Dean of AdmissionsH. Elizabeth Braun, Dean of StudentsKarl W. Clauss, Vice President for Development and Alumni RelationsMaurice G. Eldridge ’61, Vice President for College and Community Relations and Executive Assistant to the PresidentC. Stuart Hain, Vice President for Facilities and ServicesNancy Nowicki Nicely, Secretary of the College and Vice President for CommunicationsPamela Prescod-Caesar, Vice President for Human ResourcesThomas Stephenson, ProvostSuzanne P. Welsh, Vice President for Finance and Treasurer
CORPORATION AND BOARD OF MANAGERS