Embed Size (px)
Citation preview

Svoboda
Volcanic Hazards of Mt Shasta
Introduction
Mt Shasta is a volcano in the northern part of California. Although it has been recently inactive for over 10,000 years. However, its eruption would cause damage to multiple cities and NSFS lands. From its previous history of eruptions and looking at the present day topography, what areas around Mt Shasta would be affected by ash fall and lahars, and how much USFS land would become unusable from the ash fall?
2 Methods
2.1 Data Collection
California Counties: A shapefile for California counties was located from the Undergraduate Studies in Earthquake Information Technology under GCS North American 1983. It narrows the area of interest and contains the counties that would be affected by Mt Shasta. http://52.26.186.219/internships/useit/content/california-counties-shapefiles Rivers: A shapefile for the rivers of California provided by the USGS National Hydrography Dataset under GCS North American 1983. Rivers near the volcano will transport volcanic materials downstream at high velocities and cause massive amounts of damage. ftp://rockyftp.cr.usgs.gov/vdelivery/Datasets/Staged/Hydrography/NHD/State/MediumResolution/GDB/ Cities: A feature class of cities with populations provided by Caltrans under GCS North American 1983. Cities near the volcano will receive most damage from the ash and cities along the affected rivers will receive damage from the lahars. http://www.dot.ca.gov/hq/tsip/gis/datalibrary/Metadata/cities.html USFS Land: USFS Land jurisdiction boundaries provided by the United States Forest Service under GCS North American 1983. Lands owned by the USFS are used for the lumber industry primarily, and ash can harm and kill healthy trees. https://data.fs.usda.gov/geodata/edw/datasets.php?dsetCategory=boundaries Elevation: DEMs provided by the USGS The National Map Database under GCS North American 1983. The elevation maps provide a means to obtain a hill shade and predict rivers that travel downhill, downstream from the summit of Mt Shasta. https://viewer.nationalmap.gov/basic/?basemap=b1&category=ned,nedsrc&title=3DEP%20View#productSearch
2.2 Data Management
2.2.1 DEM to hillshade:
DEMs are too large in file size and too many to use functionally on the map. Each one was converted into a hillshade by going under Spatial Analyst Tools --> Surface --> Hillshade. After each DEM is made into a new hillshade, the hillshade was created into one mosaic in case changes or conversions were made to all hillshades under Data Management --> Raster --> Raster Dataset --> Mosaic to New Raster. This was done to store all the files as one layer.

Svoboda
2.2.2 Creating an Area of Interest
Area of interest was created around the 6 hillshade mosaic to cut the amount of rivers from the NHD file. A new shapefile was created in the Catalog menu under the file being worked in. The Edit tool was used to start editing the new shapefile. With the rectangle tool, a box was drawn by putting 3 points around the corners of the mosaic (the 4th point fits well to the rest of the mosaic). The edits were saved, and editing was ended to allow other manipulation of the data.
2.2.3 Clips
Many layers were clipped because many files were at the national scale (e.g. NSFS) or needed to be limited only to the Area of Interest (NHD of California Rivers). Clipping was accomplished under Analysis Tool --> Extract --> Clip. Clip menu shown in Figure 1.
Figure 1: Example of clipping the USFS Land Boundaries to the California County layer.
Layers clipped by different layers
Rivers --> Area of Interest
USFS Safe Land --> California Counties
USFS Threatened Land --> 50 km Ash fall
USFS Endangered Land --> 25 km Ash fall
Svoboda
Small Lahars --> 20km Buffer Ring
Large Lahars --> Area of Interest
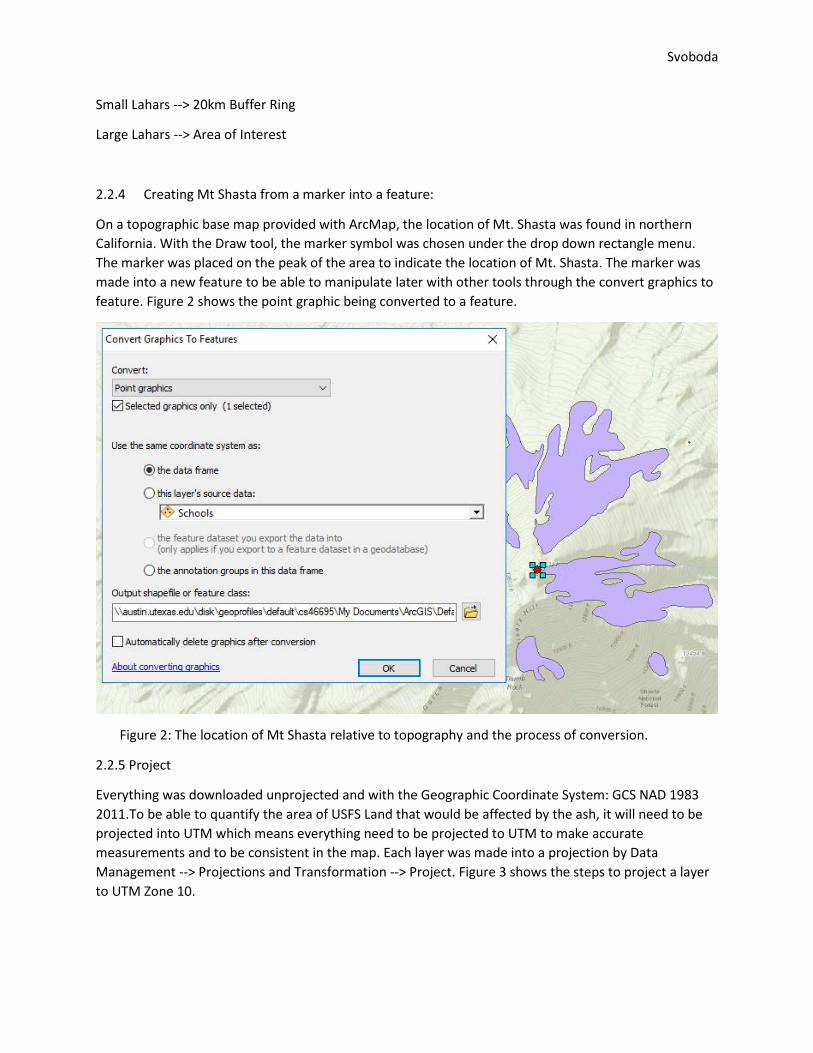
2.2.4 Creating Mt Shasta from a marker into a feature:
On a topographic base map provided with ArcMap, the location of Mt. Shasta was found in northern California. With the Draw tool, the marker symbol was chosen under the drop down rectangle menu. The marker was placed on the peak of the area to indicate the location of Mt. Shasta. The marker was made into a new feature to be able to manipulate later with other tools through the convert graphics to feature. Figure 2 shows the point graphic being converted to a feature.
Figure 2: The location of Mt Shasta relative to topography and the process of conversion.
2.2.5 Project
Everything was downloaded unprojected and with the Geographic Coordinate System: GCS NAD 1983 2011.To be able to quantify the area of USFS Land that would be affected by the ash, it will need to be projected into UTM which means everything need to be projected to UTM to make accurate measurements and to be consistent in the map. Each layer was made into a projection by Data Management --> Projections and Transformation --> Project. Figure 3 shows the steps to project a layer to UTM Zone 10.

Svoboda
Figure 3: The projection of the clipped layers into UTM Zone 10 to be processed for area calculations
2.2.6 Assumptions (from USGS) of
Ash radius (25km): ash found in all areas around Mt. Shasta. Ash radius (50km): farthest distance found from Mt. Shasta most likely from wind. Lahars have reached up to 20km away from the volcano, and larger lahars are predicted to go further into the McCloud River and the Sacramento River. The Rivers near the volcanoes summit will be the only rivers to transport lahar material to lower valley rivers. Figure 4 shows the selection among other rivers in the region to calculate lahars.

Svoboda
Figure 4: Rivers selected to be affected by lahars
2.2.7 Creating Ash Fall Buffer Rings
Assumptions made by the USGS from previous studies around the area of Mt Shasta tell within the radius of 25 kilometers is where ash will fall. Between 25 kilometers and 50 kilometers is a zone where ash can fall with wind direction. Two buffer rings were made to show the area that will have ash fall and an area that is threatened by ash fall. Under Analysis Tools --> Proximity --> Multiple Ring Buffer, buffer rings were made as shown in Figure 5.
Svoboda
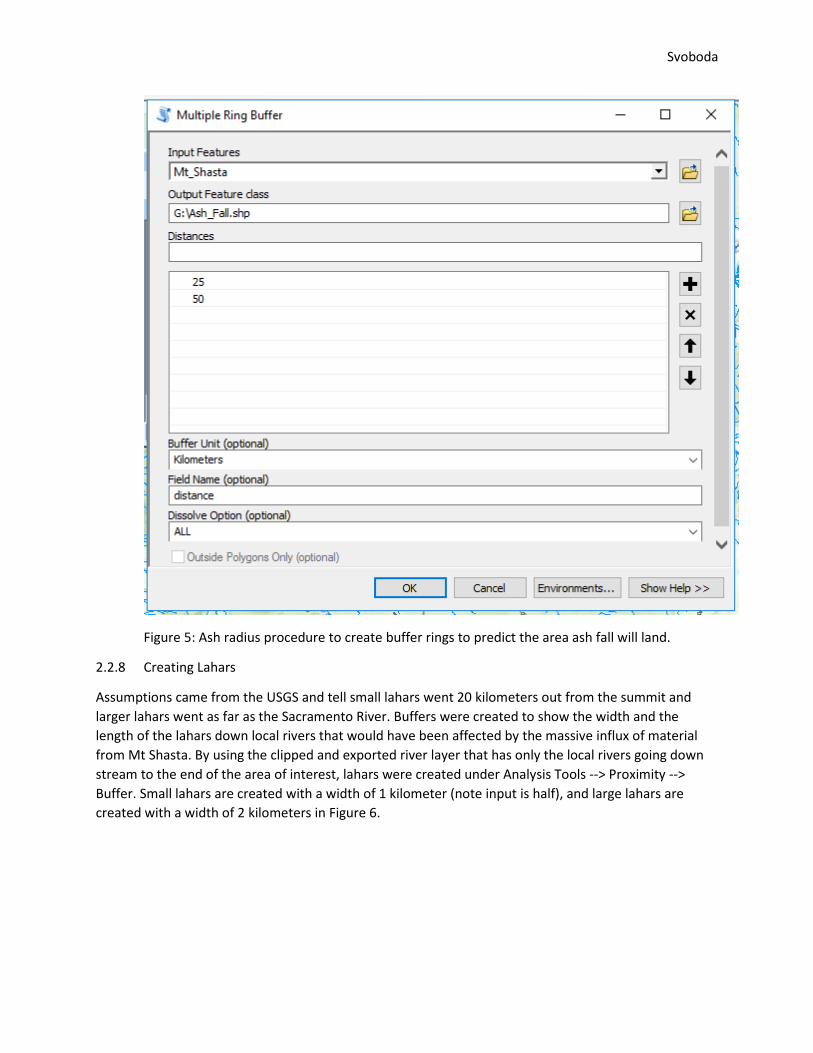
Figure 5: Ash radius procedure to create buffer rings to predict the area ash fall will land.
2.2.8 Creating Lahars
Assumptions came from the USGS and tell small lahars went 20 kilometers out from the summit and larger lahars went as far as the Sacramento River. Buffers were created to show the width and the length of the lahars down local rivers that would have been affected by the massive influx of material from Mt Shasta. By using the clipped and exported river layer that has only the local rivers going down stream to the end of the area of interest, lahars were created under Analysis Tools --> Proximity --> Buffer. Small lahars are created with a width of 1 kilometer (note input is half), and large lahars are created with a width of 2 kilometers in Figure 6.

Svoboda
Figure 6: Buffers were used to create lahars in the rivers
2.2.9 USFS Land Damaged by Ash Fall
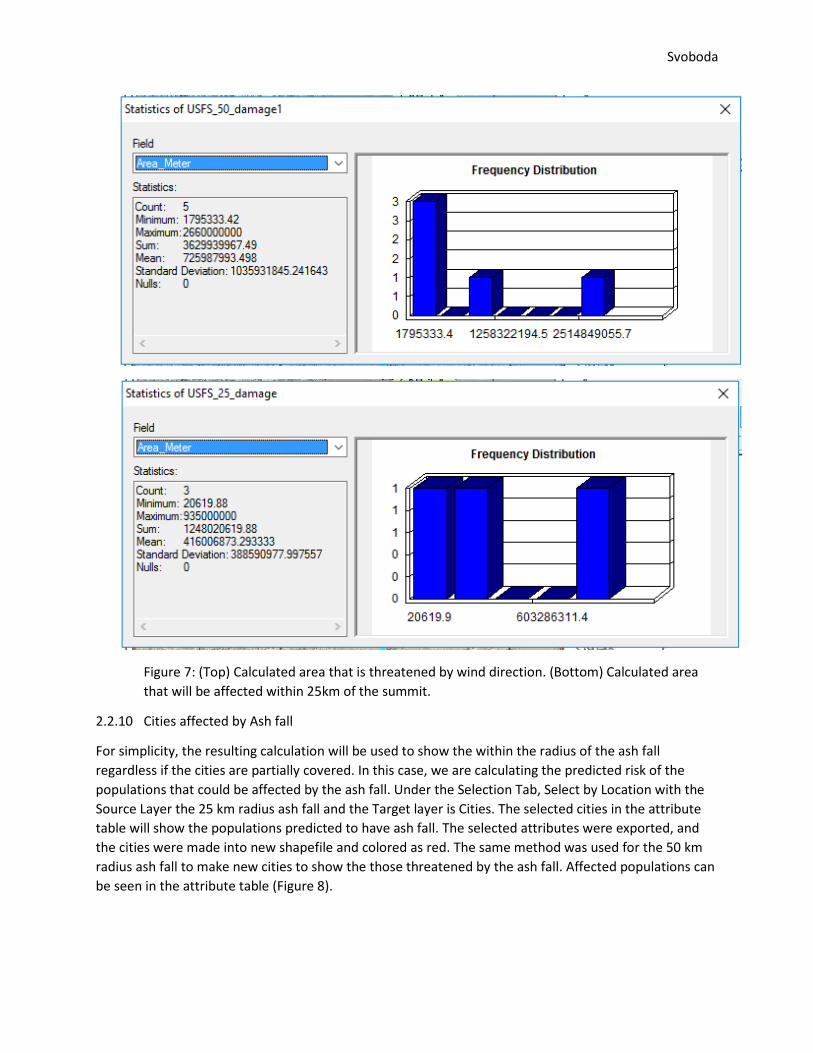
Data was exported from the 25 km and 50 km buffer rings into their own shapefiles around the Mt. Shasta Marker. The resulting shapefile for the 50 km is a ring that does not include the 25 km ash buffer. This was good because this resulted in the possible damages to the USFS Lands after 25 km of ash fall. To see how much area is damaged by the ash, the USFS Land boundary layer was clipped twice with the 25 km ash fall layer and then the 50 km ash fall layer. In the attributes table for both new clipped affected USFS layers, a new field was added with a double type, a precision of 9, and a scale of 2 with the intention to find area. In the newly created field, Calculate Geometry was used to find the area in square meters. This provided a way to see how much of the USFS land would be damaged (Figure 7).
Svoboda
Figure 7: (Top) Calculated area that is threatened by wind direction. (Bottom) Calculated area that will be affected within 25km of the summit.
2.2.10 Cities affected by Ash fall
For simplicity, the resulting calculation will be used to show the within the radius of the ash fall regardless if the cities are partially covered. In this case, we are calculating the predicted risk of the populations that could be affected by the ash fall. Under the Selection Tab, Select by Location with the Source Layer the 25 km radius ash fall and the Target layer is Cities. The selected cities in the attribute table will show the populations predicted to have ash fall. The selected attributes were exported, and the cities were made into new shapefile and colored as red. The same method was used for the 50 km radius ash fall to make new cities to show the those threatened by the ash fall. Affected populations can be seen in the attribute table (Figure 8).

Svoboda
Figure 8: (Top) Populations threatened by the ash fall depending on wind direction. (Bottom) Populations that will experience ash fall within 25km of the volcano.
2.2.11 Cities affected by Lahars
The same process was used to solve the affected cities by lahars with the above method in Cities affected by Ash Fall. Similarly, new layers from cities were made to show those in danger of direct hits and those threatened by the lahars because of the proximity. Affected populations can be seen in the attribute table (Figure 9).

Svoboda
Figure 9: (Top) Populations threatened by the lahars. (Bottom) Populations that will experience lahars.
3 Results
The cities most affected by the eruption of Mt Shasta would be within 25 km of the summit and further south of the volcano. USFS Lands lose several thousand km2 of forest and national grasslands. Figures 10-12 Indicated the hazards generate by Mt Shasta.
USFS that is threatened by the ash fall is 3,629.94 km2, and land in immediate danger is 1,248.02 km2.
9,208 people are threatened by the ash fall and 8011 are in immediate danger. 115,937 people are relatively close to lahars and could be affected, and 205, 798 people are in immediate danger of being hit by a lahar.

Svoboda
Figure 10: The complete hazard map including ash fall and lahars in the area of interest.

Svoboda
Figure 11: Map showing the areas in danger or threatened by the ash fall.

Svoboda
Figure 12: Compilation of maps showing the direction of the lahar flow and the cities that will be hit.
4. Conclusions
The areas around Mt Shasta should be evacuated with enough warning time to avoid lahars and ash flow. The unusable USFS land will be unproductive until the ash is removed and trees are healthy again.

Svoboda
The cities that are in most danger are the ones in close proximity to Mt Shasta and downstream from the eruption because of lahars.
5 References
United States Geologic Survey (2012), USGS: Volcano Hazards Program CalVO Mount Shasta, https://volcanoes.usgs.gov/volcanoes/mount_shasta/ (accessed December 2016).