Embed Size (px)
Citation preview

Sustaining progress in a
low-growth world
2015 MEDIUM TERM
BUDGET POLICY STATEMENT

Sustaining progress in a low-growth world
The world economy is experiencing a sustained period of low growth. All countries – particularly developing nations – are grappling with the changes required to manage this new reality
At home, electricity constraints, low business confidence and declining household demand have compounded the weak economic situation
In order to adapt to this low-growth world, government has:
– Identified structural reforms needed for a higher growth path
– Reduced South Africa’s vulnerability by maintaining the health of the public finances
Sustaining social progress and building a more competitive economy will require rapid implementation of the NDP
The 2015 MTBPS builds on previous commitments to stabilise public debt and improve the effectiveness of government spending
A proposed long-term fiscal guideline will align spending and GDP growth, ensuring that all South Africans can enjoy the benefits of future economic expansion
2

Despite challenges, social progress has been sustained …
Access to basic services Life expectancy
Infant mortality
Early childhood development enrolment
Source: Development Indicators, 2014; Department of Planning, Monitoring and Evaluation
4
6
8
10
12
14
2002
2003
2004
2005
2006
2007
2008
2009
2010
2011
2012
2013
2014
Ho
use
ho
lds
(mill
ion
)
Electricity
Water
Sanitation
45
50
55
60
65
20
02
20
03
20
04
20
05
20
06
20
07
20
08
20
09
20
10
20
11
20
12
20
13
20
14
Ye
ars
Male Female Combined
30
40
50
60
70
80
90
20
02
20
03
20
04
20
05
20
06
20
07
20
08
20
09
20
10
20
11
20
12
20
13
20
14
De
ath
s p
er
1 0
00 l
ive b
irth
s
Infant-mortality rate
Under-5 mortality
0
20
40
60
80
100
20
02
20
03
20
04
20
05
20
06
20
07
20
08
20
09
20
10
20
11
20
12
20
13
20
14
Per
ce
nt
of
fiv
e-y
ear-
old
s
The NDP is about creating work, eliminating poverty and building a more equitable society. Significant progress has been made over the past 15 years.
These achievements are made possible by a sustainable allocation of public funds. Over the last decade, public spending has doubled in real terms.
Good fiscal planning supports the constitutional mandate to realise social and economic rights in a progressive and affordable manner.
The medium-term fiscal framework sustains social gains in a weak economic environment.
But the resources available to the fiscus are expanding too slowly to meet the country’s development requirements.
3

… but economic growth has slowed
Economic growth is expected to be only 1.5 per cent in 2015 – the same as in 2014 – rising marginally to 1.7 per cent in 2016.
Consumer and business confidence is muted. Supply and demand for household credit is shrinking.
Employment growth remains weak.
Inflation currently within target range, but with upside risks from the exchange rate.
Without a speed up the pace of growth, South Africa will not be able to substantially reduce unemployment, poverty and inequality.
2014 2015 2016 2017 2018
Calendar year Actual Estimate Forecast
Percentage change unless otherwise indicated
Final household consumption 1.4 1.5 1.7 2.5 2.8
Gross fixed capital formation -0.4 1.2 1.5 3.2 3.8
Real GDP growth 1.5 1.5 1.7 2.6 2.8
GDP at current prices (R billion) 3 796 4 031 4 349 4 726 5 143
CPI inflation 6.1 4.8 6.2 5.9 5.8
Current account balance (% of GDP) -5.4 -4.1 -4.4 -4.6 -4.8
Source: Reserve Bank and National Treasury
Macroeconomic projections, 2014 - 2018
4

This partly reflects global conditions …
Slower, more volatile growth has become an enduring feature of the world economy, raising concerns of a protracted period of weakness in global trade, investment and commodity prices.
Improved performance by some developed economies has offset the slowdown in developing economies.
Slower growth in China and higher interest rates in the United States create a difficult environment for developing countries that rely on foreign capital to fund investment.
Growth in Sub-Saharan Africa slows from 5 per cent last year to 3.8 per cent this year.
5
Region / country 2014 2015 2016
Percentage
World 4.0 3.4 3.1 3.6
Advanced economies 1.8 1.8 2.0 2.2
US 2.1 2.4 2.6 2.8
Euro area 0.7 0.9 1.5 1.6
UK 1.8 3.0 2.5 2.2
Japan 1.5 -0.1 0.6 1.0
Emerging markets and
developing countries 5.7 4.6 4.0 4.5
Brazil 3.2 0.1 -3.0 -1.0
Russia 2.8 0.6 -3.8 -0.6
India 7.2 7.3 7.3 7.5
China 8.6 7.3 6.8 6.3
Sub-Saharan Africa 5.2 5.0 3.8 4.3
South Africa 2.4 1.5 1.5 1.7
Source: IMF, October 2014, except South Africa (National Treasury forecast)
Average
2010-2014
Source: IMF, October 2015, except South Africa (National Treasury forecast)

… but domestic constraints are also significant
Constrained electricity supply the largest drag on economic activities, costing close to one percentage point of annual GDP growth.
Manufacturing and mining weighed down by electricity constraints; drought has reduced agricultural output. Services sector has also slowed.
Private sector investment contracted by 0.1 per cent in the first half of 2015. Public corporations continue to invest. Government is the largest contributor to investment growth in the last year.
The current account deficit is likely to remain wide, indicating the continued need for foreign savings to fund South African investment.
Although the rand has depreciated against the dollar, South Africa’s inflation is higher than trading partners, resulting in real exchange rate appreciation in recent months.
South Africa’s capital markets have been resilient, enabling continued inflows of portfolio capital to sustain external imbalances.
Without stronger effort to overcome domestic constraints, improve competitiveness and speed up the pace of structural change, South Africa will not be able to substantially reduce unemployment, poverty and inequality in the years ahead.
6

Action is underway to chart a path for higher growth
Government's priorities to restore economic momentum:
– Acting to alleviate the electricity constraint
– Continued investment in infrastructure, especially in transport, logistics and energy
– Reforming the governance of state-owned entities, rationalizing state holdings and encouraging private sector participation
– Labour market reforms that help avoid protracted strikes
– Expanding the independent power producer programme to include gas and coal generation
– Encouraging affordable, reliable and accessible broadband access
– Promoting black ownership of productive industrial assets
– Finalizing MPRDA amendments and continuing dialogue with the mining industry
– Reviewing business incentives to ensure support for labour-intensive outcomes.
Government recognizes that national development requires expanded partnerships with the private sector.
Socio-economic impact assessments will mitigate unintended consequences of future policy initiatives
7

But growth trends point to weaker revenue outlook
8
Projected gross tax revenue down by R35 billion between 2015/16 and 2017/18, compared to the 2015 Budget. Gross tax revenue projected to continue growing faster than nominal GDP, but the margin will narrow.
Over the medium term, government will explore reforms to promote an efficient and progressive tax system, taking into account recommendations of the Davis Tax Committee.
Additional taxes will be needed to fund government’s ambitious policy agenda, but will be approached with caution given weak economic conditions.
Initiatives under way to combat base erosion, profit shifting and the misuse of transfer pricing.
No decision has been made on VAT, but it remains an option as part of a progressive fiscal system.
Growth of nominal GDP and main tax revenues
-5
0
5
10
15
20
1998/99
1999/00
2000/01
2001/02
2002/03
2003/04
2004/05
2005/06
2006/07
2007/08
2008/09
2009/10
2010/11
2011/12
2012/13
2013/14
2014/15
2015/16
2016/17
2017/18
2018/19
Per
cen
t g
row
th (
y-o
-y)
Major tax revenue*
Gross domestic product

The fiscal framework closes the gap between revenue and spending …
20
22
24
26
2003/04
2004/05
2005/06
2006/07
2007/08
2008/09
2009/10
2010/11
2011/12
2012/13
2013/14
2014/15
2015/16
2016/17
2017/18
2018/19
Per
cen
t o
f G
DP
Revenue
Non-Interest Spending
Consolidated fiscal framework
Main budget primary balance Two risks identified in the 2015 budget
have materialized:
– Slower economic growth means lower revenue and some slippage on the budget deficit.
– Public sector wage settlement higher than inflation means more pressure on the public finances
Expenditure on track to stay within ceiling
Government remains on course to achieve its fiscal objectives: stabilising debt and closing the primary balance
9
2014/15 2015/16 2016/17 2017/18 2018/19
R billion/Percentage of GDP Outcome Revised Medium-term estimates
Revenue 1 091.9 1 220.8 1 306.4 1 416.0 1 540.9
28.4% 29.8% 29.4% 29.3% 29.3%
Expenditure 1 228.8 1 378.7 1 451.7 1 568.8 1 699.1
32.0% 33.6% 32.7% 32.5% 32.4%
Budget balance -136.9 -157.9 -145.3 -152.8 -158.2
-3.6% -3.8% -3.3% -3.2% -3.0%
Total net loan debt 1 584.2 1 785.7 1 947.4 2 158.0 2 382.0
41.2% 43.5% 43.9% 44.7% 45.4%
Source: National Treasury

… and stabilises national debt as a share of GDP
Government debt-to-GDP ratio (net of cash balances)
10
30
35
40
45
2011/12
2012/13
2013/14
2014/15
2015/16
2016/17
2017/18
2018/19
2019/20
2020/21
Per
cen
t o
f G
DP
MTBPS 2014
Budget 2015
MTBPS 2015
Projections
Downward revision to GDP, shortfalls in revenue and the weaker exchange rate have led to an upward revision of the debt-to-GDP ratio.
Continued restraint in expenditure growth results in net debt stabilising at 45.7 per cent of GDP in 2019/20.

New guideline cements good fiscal management
Fiscal policy based on principles of counter cyclicality, debt sustainability and intergeneration fairness
A fiscal rule-of-thumb will link the spending ceiling to long-run path of economic growth:
– All South Africans share in the benefits of economic expansion on a sustainable basis.
– Spending remains stable as a share of GDP, unless financed by permanent increases in revenue
– Flexibility to respond to inflation shocks
New approaches to medium-term capital budgeting and appraisal
Enhanced budget transparency
11

But risks to the fiscal outlook remain
Further deterioration in economic growth
– Decline in growth typically results in falling revenue growth, increasing the deficit and debt as a share of GDP.
– Global uncertainty, particularly concerning the path of US monetary policy, could put upward pressure on domestic interest rates and cost of government debt
Expenditure pressures linked to inflation
– Rising inflation would increase the likelihood of unplanned expenditure
– The wage agreement is linked to inflation.
Weak financial positions of several major public entities
– Government has acted to stabilise several state-owned enterprises.
– Eskom, SANRAL and SAA being closely monitored
– Government remains committed to deficit-neutral capital financing of state-owned companies in the years ahead.
– Work has begun to develop a uniform legislative framework to regulate state-owned companies.
12
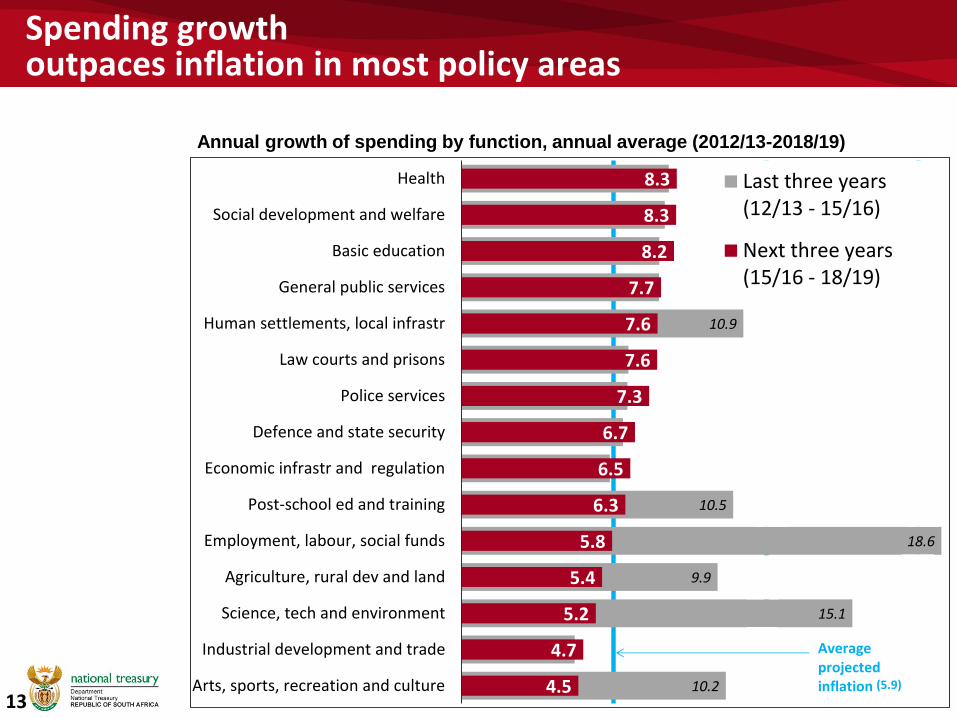
Spending growth outpaces inflation in most policy areas
Annual growth of spending by function, annual average (2012/13-2018/19)
13 10.2
15.1
9.9
18.6
10.5
10.9
4.5
4.7
5.2
5.4
5.8
6.3
6.5
6.7
7.3
7.6
7.6
7.7
8.2
8.3
8.3
Arts, sports, recreation and culture
Industrial development and trade
Science, tech and environment
Agriculture, rural dev and land
Employment, labour, social funds
Post-school ed and training
Economic infrastr and regulation
Defence and state security
Police services
Law courts and prisons
Human settlements, local infrastr
General public services
Basic education
Social development and welfare
Health Last three years(12/13 - 15/16)
Next three years(15/16 - 18/19)
Averageprojected inflation (5.9)

Strong spending on public infrastructure and housing is sustained
General government has made a large contribution to investment growth over the last two years, while private-sector investment has remained muted.
Government continues to invest in public infrastructure and housing. Proposed medium-term budget allocations of R542 billion include:
– R130 billion in roads and public transport
– R60 billion in public housing
– R55 billion in water infrastructure
– R50 billion in other municipal infrastructure
– R43 billion in school buildings
– R11 billion in tertiary education capital projects
– R30 billion in health facilities and equipment
– R20 billion to extend the electricity grid to poor households.
In addition, infrastructure plans by large state-owned companies exceed R400 billion over the next three years.
14

Limited resources directed to core areas of need
The public-sector wage agreement has been accommodated, but will have consequences for the composition of spending, as salary requirements put pressure on capital and other critical inputs.
There is little room for new spending priorities over the next three years, but government proposes additional resources (within spending limits) to core areas of need:
– Accommodating higher-than-expected growth in grant beneficiary numbers (R13 billion over three years)
– The local equitable share bolstered to support the rising cost of free basic services (R6 billion over three years)
– Resources added to social development budgets for substance-abuse centres and early childhood development
– Funds are set aside to improve the quality of public-order policing
– Financial support for health information systems will alleviate problems in the management of medicine stocks, and help lay a foundation for national health insurance
– Additional resources have been provided to support treatment of HIV/AIDS and tuberculosis
– Agencies that support science and innovation have received additional resources to bolster research and development
Revised MTEF shifts about R9 billion from within existing baselines to priority programmes: R4.8 billion is towards road networks, R1.4 billion for provincial public transport, and about R1 billion for the rollout of broadband infrastructure and broadcast digital migration.
15

Interest on debt grows fastest, followed by compensation
Growth of spending by economic type, annual average
(2015/16-2018/19)
16
6.6
6.7
7.0
8.2
10.9
Capital spending andtransfers
Goods and services
Current transfers andsubsidies
Compensation ofemployees
Debt-service costs
Debt-service costs remains the fastest growing type of spending
New wage agreement and higher inflation pushes compensation growth to 8.2 per cent over the medium term

Procurement reforms reduce red-tape and corrupt practices
Central supplier database: In operation since 1 September 2015. More than 20 000 suppliers registered, 9 500 verified. Will become mandatory on 1 April 2016 for national and provincial departments and 1 July 2016 for municipalities.
eTender portal: Single point of entry for business opportunities with government. More than 2 000 tenders worth about R28 billion already posted onto the portal.
gCommerce portal: Government departments can purchase routine supplies through transversal contracts, reducing administrative processes.
Procurement bill being developed to replace the more than 80 different legal instruments, guidelines and instruction notes
Tender documents will be made more user-friendly. The number of documents needed for a tender will be reduced, and the language used will be clear and unambiguous.
Standard operating procedures for procurement being developed, with changes set to take effect from 1 April 2016.
Compulsory standard for infrastructure procurement and delivery management to be issued in April.
17

Reforms to conditional grants
Government has completed the second phase of its local government infrastructure grant review.
Enabling the use of funds for the renewal, refurbishment and rehabilitation of existing infrastructure, alongside asset management systems to plan and prioritise maintenance.
Reforming the public transport network grant to support financially sustainable transit networks in large cities.
Consolidating urban grants over the MTEF period to tackle challenges in the built environment.
Rationalising grants to reduce complexity and administrative burdens. Several water and sanitation grants are being merged, for example.
Introducing grants that differentiate between metros, secondary cities and rural areas. Secondary cities will see changes to their planning requirements.
18

Thank you
19