Embed Size (px)
Citation preview

1
Sustaining Productivity through Resource Conservation
Technologies in the Rice Wheat Farming System of Indo-Gangatic Plains of India
Vijay Laxmi Pandey
Indira Gandhi Institute of Development Research Mumbai, India
Prepared for presentation at the Open Meetingof the Global Environmental Change Research
Community, Montreal, Canada, 16-18 October, 2003

2
l 33% of GDP from agriculture & allied activities
l 60% population engaged in agriculturel Food securityl Agriculture has more direct effect in
reducing rural poverty
Contribution of Indian Agriculture

3
Agriculture Growth
l Food grain production:1964-65: 90 mt1994-95: 191 mt2001-02: 212 mt
l Increase in area under riceRice: 1964-65: 36.46 mha, 2001-02: 42.2 mhaWheat: 1964-65: 13.42 mha, 2001-02: 25.7 mha
l Increase in average yield(1960) (1997) Potential yield
l Rice: 1.55 t/ha 2.81 t/ha 9.88 t/hal Wheat: 0.84 t/ha 2.39 t/ha 6.82 t/ha

4
Determinants of Growth
l High yielding, short duration, dwarf varieties of rice and wheat
l Infrastructure development – irrigation
l Policies – micro and macro– Input price subsidies
– Output price support
l Political commitment
The growth in food grain production and productivity were due to both technological development and political will.

5
Rice Wheat Cropping System
l Rice wheat cropping system followed mostly in the most fertile region of country covering 10 mha in IG plains of India.
l Contributed to food security of India
l RWCS contribute 1/3 of total cereal production in IGP

6
Estimated area under rice-wheat based cropping system in the Indo- Gangetic plains
1983 1993 1983 1993 1983 1993Punjab 1.35 2.02 100 100 44 63Haryana 0.51 0.67 100 100 30 36Uttar Pradesh 5.14 5.25 94 96 61 61Bihar 1.7 1.9 37 40 96 96West Bengal 0.11 0.26 2 4 41 98India 11.46 12.33 29 30 49 52
States
Area (mha) of rice-wheat system
Rice-wheat rotation area % of total rice area
Rice-wheat rotation area % of total wheat area
The table shows the increase in the area under rice wheat farming system from 1983 to 993. The table also shows that in Punjab and Haryana states which are the cereal bowl of the country have put almost all rice cultivation area under rice wheat farming system. The wheat area under RW rotation system has also increased. This has many consequences, such as on crop diversification, environment etc.

7
Threats l Growth rates of rice and wheat are stagnating /
decliningl Cultivation of rice and wheat has become less
profitable (Chaudhary & Harrington, 1993)
l Population growth– Need to produce 294 million tonnes by 2020– 75% of total requirement will be for rice and wheat
l Irrigation coverage reached to ceiling (Punjab, Haryana)
l Use of fertilizer almost up to the highest level in major contributors (Punjab, Haryana)
l Increased stress on natural resourcesNeed for Technology - reduce cost of production
- favorable to environment
Now the threats are that due to increasing population we need to produce even more. This increase in demand will be mostly for the rice and wheat and growth rates of rice and wheat production are either declining or are stagnant. The use of inputs in the major contributor states, i.e., Punjab and Haryana are at the highest level and is stressing the natural resources. Further, because of increased input use the cultivation of rice and wheat are now becoming less profitable.
Therefore, there is need to have some new production technology which reduces cost of cultivation and puts less pressure on the natural resources.

8
Decline in productivity
l Mainly due to environmental resource degradation• Seasonal wet and dry crop cycles over long
period of time• Increased reliance on irrigation and inorganic
fertilizers• Asymmetry of planting schedule• No change in the varieties use

9
l Building of salinity / water loggingl Hardpanl Changes in soil nutrient supply capacityl Increased infestation of pests l Ground water depletion and water pollutionl Air pollution
Environmental Problems

10
Environmental Problems can be reduced by
l Change in policy
l Technology development
l Conservation of resources
l Participation of all the stake holders

11
Policy Changes
Ø Input price and output price Policy
Ø Land Consolidation
ØImprovement in water management•Development of drainage•Canal and ground water•Saline ground water•Rain water harvesting
Ø Trade policy
12
Technological Innovation
• Innovations for efficient use of resources
Resource conservation technologies
• Technologies for conserving the resources, e.g.• Zero tillage• Surface sowing• Bed planting• Crop residue management
In India Resource conservation technologies are propagated by the Rice Wheat Consortium. In this paper we are going to cover only one such technology i.e., zero tillage (ZT)
13
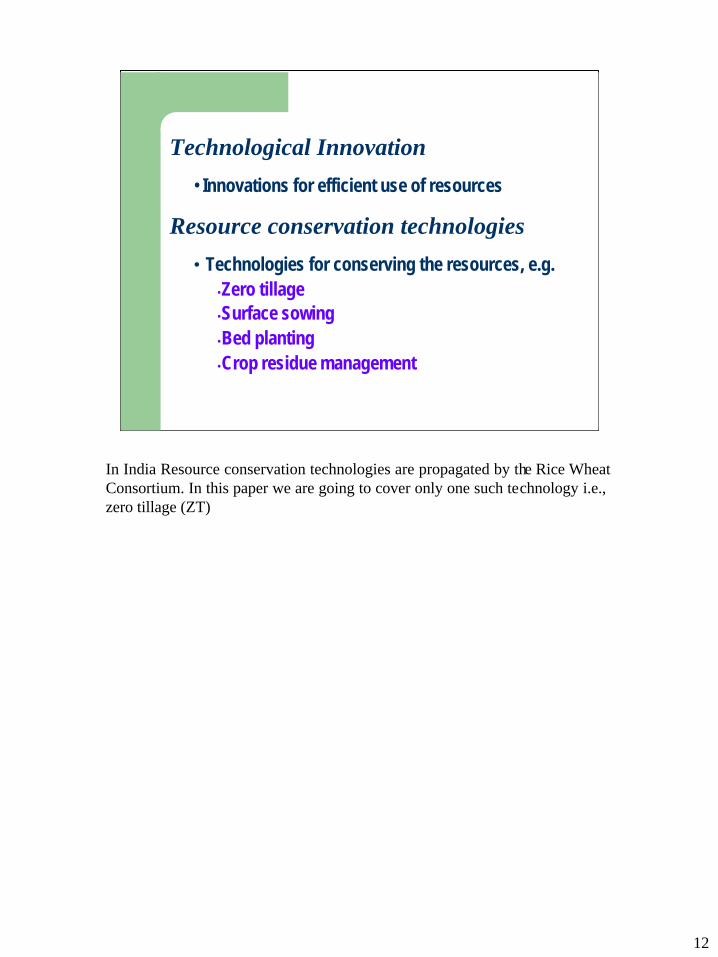
Need for adopting Zero Tillage in India
• Reducing cost of production to enhance profit margin
• Timely planting of wheat over large area• Saving diesel• Minimizing environmental pollution• Controlling Phalaris minor• Reducing wind and water erosion • Growing more number of crops per unit area per
unit time• Maintaining/ improving the sustainability of soils

14
Ø Favorable effect on crop yieldØ Allows timely plantingØ Improves germination and fertilizer use efficiencyØ Reduction in cost of productionØ Reduction in emission of CO2 due to less use of dieselØ Saves time for subsidiary occupationsØ Reduction of weed emergenceØ Effective wind and water erosion controlØ Favorable effect on soil physico-chemical propertiesØ Build up of predators and earthwormsØ Profitable for resource poor farmers
Advantages of Zero Tillage
15
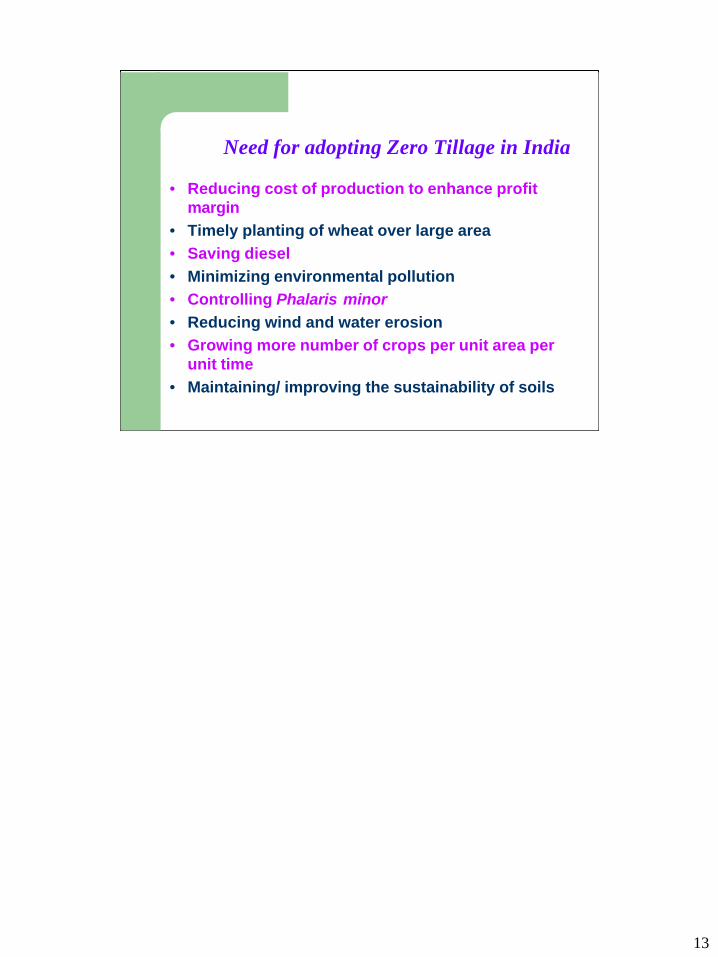
Effect of planting dates and tillage operation on productivity of wheat
The graph shows that date of planting have a significant impact on wheat yield. With the adoption of ZT the yield is even more for the timely sowing using conventional tillage. (The graph adopted from Malik, and Gupta 2002. RWC Paper Series 8)

16
Gautam et al
(2002)
31.2(03-01-03)
35.5(25-12-00)
Bihar Patna
Modgal (1996)
48.9
Late sown
56.2
Timely sown
Uttranchal Pantnagar
Sowing on different dates
Rautaray (2000)
51.452.4M.P.Bhopal
Modgal (1996)
42.542.5Uttranchal Pantnagar
Sowing on same dates
CTZT
Reference Grain yield (q/ha)State Location
Effect of ZT on Wheat Yield

17
Projected area coverage, savings in fuel & labour, & additional gains in productivity of wheat - Haryana
Year
Acres under Zero-Tillage (‘000)
Total net savings (millionRs)
Additional gains in wheat production (mt)
Fuel saved (mlit)
Time saving (dayslabour)
2003 540 720 .59 12.96 31.50
2004 1250 1667 1.37 30.00 729.17
Total 1790 2387 1.96 42.96 760.67
(Ref: Mehla, et al, 2000)

18
Effects of tillage & sowing time on yield & Phalaris minor
ZT CTS CTD ZT CTS/D
Kaithal
WH 542, PBW 343, 4 14 4407 3829 3583 129 560UP 2338 & KRL 1-4 32 14 4897 4605 4288 114 550
Karnal
PBW 343, HD 2329, 17 12 4391 3850 3465 103 438HD 2009 & W 542 32 14 4616 4553 4273 110 473
SonepatHD 2329, HD 2285 7 13 3489 3270 2059 75 333
PanipatWH 542, UP 2338 6 13 3800 4000 3583 89 440
Ambala PBW 343 2 13 3825 3638 2997 73 379
Kurkshetra
PBW 343, WH 542 32 13 4593 4383 4016 97 442
Average sowing days difference, (ZT-CTD)
Grain yield, kg/ha Phalaris minor Districts
Major cultivars
N0. Of trials
Reference: RWC paper series 8.
The table shows that ZT advances the sowing dates by approximately 13 days and results in the increase in the yield. Further due to early sowing of the wheat the weeds are controlled especially P. minor. Because due to early sowing wheat plants are grown and cover the soil therefore, by the time seeds of P. minor geminate its growth gets suppressed.

19
Environmental Benefits
l Saving of diesel – 60 lits/ha -> 156 kg less CO2 per hectare per year
l Water saving – 1 million lits/hal Reducing crop residue burning by 50% -
less CO2 emission of 1.2 tonnes per hectare
lCR = 1.3* yieldlCO2 = CR* DM* CF
= CR*0.78 *0.48[Ref: Mehla, et al, RWC paper series 8]
Added to yield gain and reduction in weed infestation ZT also helps by putting less pressure on the environment.

20
Haryana BiharLand preparations
Diesel (Tillage) 995.84 781.44Tractor charges for tillage 430.64 1328
Cost of seeds 41.27 28.6
Treatment cost of seeds -3.04 0Electricity change (irrigation) 0 277Harvesting cost 61.57 201.42Weedicide -11.66 17.39Urea 80.476 65.78DAP 88.2 1013.58Net savings (Rs) 1738.29 1975.59
Sowing Charges 55 -281
Net savings (CT-ZT) (Rs/Ha)
Net savings refer to savings in input use due to use of ZT technology in comparison to conventional tillage practice in the same area. The table shows that there is saving of Rs 1738/ per Ha (I.e., approximately US$ 39) in Haryana which has a high level of agricultural intensification. Whereas, in Bihar a state where impact of green revolution are still percola ting and is at a very lower level of agricultural intensification, benefits of ZT are even more.

21
Conclusion
l ZT is not new but not successful earlier due to many reasons
l Now again ZT is picking up due to effort of RWC
l ZT have both economic and environmental benefits
l Can be advantageous even where there is less intensification of agriculture
l Still needs more support to extent it for other crops and regions of the country