Embed Size (px)
Citation preview

Sustainable Quality Health CareSingle Payer is not an Answer, it is the Answer
Gerald FriedmanProfessor of Economics
University of Massachusetts at AmherstJuly 29, 2013
[email protected]: @gfriedma

Bottom Line: HR 676 (Improved Medicare-for-All) can be funded
• In 2014: – Saves $592 billion in wasteful administrative spending and
excessive drug prices– After $394 billion in system improvements, saves nearly $200
billion– Local and state governments save $283 billion in Medicaid and
employee health benefits– 95% would save money
• Over decade– Funding program for would produce $3 trillion in federal
deficit reduction– State and local governments save $5 trillion– Health care spending falls by over $8 trillion
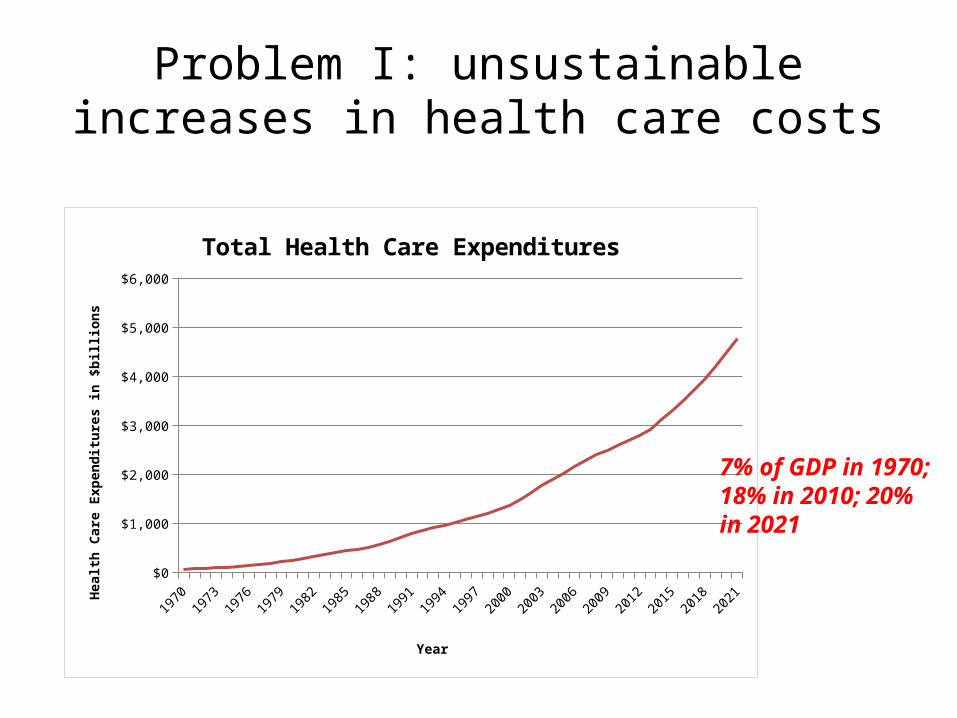
Problem I: unsustainable increases in health care costs
19701972
19741976
19781980
19821984
19861988
19901992
19941996
19982000
20022004
20062008
20102012
20142016
20182020
$0
$1,000
$2,000
$3,000
$4,000
$5,000
$6,000
Total Health Care Expenditures
Year
Heal
th C
are
Expe
nditu
res i
n $b
illio
ns
7% of GDP in 1970; 18% in 2010; 20% in 2021

Rising Health Care burden on household budgets
19701972
19741976
19781980
19821984
19861988
19901992
19941996
19982000
20022004
20062008
20102012
20142016
20182020
100%
600%
1100%
1600%
2100%
2600%
3100%
3600%
4100%
Index of per capita health care spending Index of SSA average wages
Growing burden of excess health care costs
Health care spending 6% of average wage in 1970, 20% in 2010, 24% in 2021

Rising copays and deductibles
2006 2007 2008 2009 2010 2011 2012 $-
$100
$200
$300
$400
$500
$600
$700
$800
$900
Average deductible for all covered workers
Source: http://kff.org/health-costs/issue-brief/snapshots-the-prevalence-and-cost-of-deductibles-in-employer-sponsored-insurance/

Rising medical bankruptcy:More bankruptcies due to medical bills
2001 20070%
10%
20%
30%
40%
50%
60%
70%
80%

Solution: “To provide for comprehensive health insurance coverage for all United States residents, improved health care
delivery, and for other purposes” (HR 676)
Expanded and Improved Medicare for All! Introduced by Representative John Conyers and 52 co-sponsorsBuilds on success of Medicare Program

It works for Medicare. We would not have a health care financing crisis with Medicare for all
Private Insurance Medicare0%
500%
1000%
1500%
2000%
2500%
2165%
1562%
Price Increases 1970-2000

Savings from HR 676
$592 billion in savings from single payer
AdministrationDrug purchasing
$476 billion
$116 billion

Changes with HR 676Savings from single funding source
– Eliminates most administrative overhead in insurance industry
– Eliminates most billing and insurance related expenses for providers
– Can bargain to eliminate monopoly pricing of drugs and other medical supplies

Program Improvements with HR 676,) 2014 (Added costs)
$144
$110
$89
$31
$20
Increased utilization
Cost of expanded coverage and additional government admin-istration
Cost of Medicaid rate adjustment
Transition cost of unemployment insurance and retraining for dis-placed workers
Transition cost of capital buy-out of private health care facilities
$394 in extra spending
Added costs and system improvements
– Expanded coverage to all residents– Elimination of underinsurance leads to greater
utilization of health care services– Elimination of differential under-pricing for
Medicaid– Retraining costs for displaced insurance and billing
workers– Purchase of existing for-profit facilities

Savings grow over timeProjected Personal Health Care Spending ACA vs HR 676
Assuming growth rate of per capita expenditures would slow to rate of countries with single-payer systems, 10 year savings of over $8 trillion or 4% of GDP. Reduction in Federal deficit of nearly $2 trillion.
2014 2015 2016 2017 2018 2019 2020 2021 2022 2023 $2,700
$3,200
$3,700
$4,200
$4,700
$5,200
$5,700
$6,200
ACA personal health expenditures Single payer

Can we pay for it?
Yes! HR 676 provides for a progressive tax program that would fund Improved Medicare for All while increasing economic efficiency• Progressive income taxes• Progressive payroll taxes• Financial transaction tax

Funding: we start with what we need, and what we already have
Total : Baseline spending plus HR 676 program improvements $ 3,556
Remaining revenue sources
Federal Medicare, Medicaid, and other health spending, and 20% of current out-of-pocket spending $ 1,454
Savings from administrative efficiencies and reduced monopolistic drug pricing $ 592
Tax expenditure savings (corporate taxes) $ 260
Net revenue needs $ 1,250

New, Progressive Revenues
Tobin tax of 0.5% on stock trades and 0.01% per year to maturity on transactions in bonds, swaps, and trades. $ 442
6% Surtax on household incomes over $225,000 $ 279
6% tax on property income from capital gains, dividends, interest, profits, and rents $ 310
6% payroll tax on top 60% with incomes over $53,000 $ 346
3% payroll tax on bottom 40% with incomes under $53,000 $ 27
Total additional revenues $ 1,404
Net surplus for deficit reduction $ 154

1940 1945 1950 1955 1960 1965 1970 1975 1980 1985 1990 1995 2000 2005 2010 2013 SP0%
10%
20%
30%
40%
50%
60%
70%
80%
90%
100%
US Top Tax Rate, 1940-2013

$850 Billion spent on Health Insurance Premiums in 2010
Medical Mutual: US Healthcare Costs, 2010

Distributional Impact of HR 676Almost all save money
Note: Assumes current Federal Medicare taxes and spending remains
$25,723
$57,348
$87,733
$128,441
$216,922
$462,946
$2,994,817
$166,592,800
-40%
-30%
-20%
-10%
0%
10%
20%
30%
Average household income in group
Perc
enta
ge c
hang
e in
inco
me
after
tax
es a
nd h
ealt
h ca
re s
pend
ing

10 year deficit reduction of $3 trillionMoney for education, infrastructure, training. Even for
tax cuts.
2014 2015 2016 2017 2018 2019 2020 2021 2022 2023 $-
$500
$1,000
$1,500
$2,000
$2,500
$3,000
$3,500
$4,000
Cumulative Deficit Reduction
Deficit reduction will be greater because of faster economic growth

Instead of waste and administrative abuse, money for families and businesses
2014 2015 2016 2017 2018 2019 2020 2021 2022 2023 $-
$1,000
$2,000
$3,000
$4,000
$5,000
$6,000
$7,000
$8,000
$9,000
$10,000
Cumulative health care savings vs ACA
Redu
ced
pers
onal
hea
lth ca
re e
xpen
ditu
res,
cum
ulati
ve $
billi
on

In 1965, our parents and grandparents created Medicare and began to create a healthier, more productive America.

Let’s finish their work.HR 676: costs less today, costs less
tomorrow, covers everyone