Embed Size (px)
Citation preview

Rochester Institute of TechnologyRIT Scholar Works
Theses Thesis/Dissertation Collections
12-2016
Sustainable management of lithium-ion batteriesafter use in electric vehiclesKirti [email protected]
Follow this and additional works at: http://scholarworks.rit.edu/theses
This Dissertation is brought to you for free and open access by the Thesis/Dissertation Collections at RIT Scholar Works. It has been accepted forinclusion in Theses by an authorized administrator of RIT Scholar Works. For more information, please contact [email protected].
Recommended CitationRicha, Kirti, "Sustainable management of lithium-ion batteries after use in electric vehicles" (2016). Thesis. Rochester Institute ofTechnology. Accessed from

i
Sustainable management of lithium-ion batteries after use in
electric vehicles
By
Kirti Richa
A DISSERTATION
Submitted in partial fulfillment of the requirements
for the degree of Doctor of Philosophy in
Sustainability
Department of Sustainability
Golisano Institute for Sustainability
Rochester Institute of Technology
December 2016
Author: _________________________________________________________________
Sustainability Program
Certified by: _____________________________________________________________
Dr. Callie W. Babbitt
Associate Professor of Sustainability Program
Approved by: ____________________________________________________________
Dr. Thomas Trabold
Department Head of Sustainability Program
Certified by: _____________________________________________________________
Dr. Nabil Nasr
Assistant Provost and Director, Golisano Institute for Sustainability and CIMS

ii
Sustainable management of lithium-ion batteries after use in
electric vehicles
By
Kirti Richa
Submitted by Kirti Richa in partial fulfillment of the requirements for the degree of Doctor of
Philosophy in Sustainability and accepted on behalf of the Rochester Institute of Technology by
the dissertation committee.
We, the undersigned members of the dissertation committee, certify that we have advised and/or
supervised the candidate on the work described in this dissertation. We further certify that we
have reviewed the dissertation manuscript and approve it as partial fulfillment of the
requirements of the degree of Doctor of Philosophy in Sustainability.
Approved by:
Dr. Callie W. Babbitt ______________________________________
(Committee Chair and Dissertation Adviser) Date
Dr. Gabrielle G. Gaustad ______________________________________
(Committee Member) Date
Dr. Nenad Nenadic ______________________________________
(Committee Member) Date
Dr. Brian Landi ______________________________________
(External Examiner) Date
SUSTAINABILITY PROGRAM
ROCHESTER INSTITUTE OF TECHNOLOGY
December 2016

iii
ABSTRACT
Golisano Institute for Sustainability
Rochester Institute of Technology
Degree: Doctor of Philosophy Program: Sustainability
Name of Candidate: Kirti Richa
Title: Sustainable management of lithium-ion batteries after use in electric vehicles
In recent years, many forecasts have predicted a large scale adoption of electric vehicles
(EVs), which would predominantly be powered by lithium-ion batteries (LIBs), owing to their
high energy and power density and long cycle life. While use of EVs could reduce dependence
on fossil based transportation fuels, there is a need to understand the end-of-life (EOL)
implications of retired EV LIBs entering the waste stream in future in the battery-driven vehicle
regime. To proactively address impending waste management issues and inform related policy,
this dissertation explored the sustainable management of LIBs after use in EVs and the
challenges and opportunities involved.
First, a future oriented, dynamic Material Flow Analysis (MFA) was conducted to
estimate the volume of LIB wastes to be potentially generated in the US in near and long term.
The objective of tracking future outflows of EOL EV LIBs through the MFA model was to: (a)
Provide an understanding of the scale at which EV LIB waste management infrastructure needs
to be developed in future, and (b) Analyze the composition of future EV LIB waste stream in
terms of constituent LIB packs, cells and materials. The effect of EV adoption scenarios,
variability in LIB lifespan distribution, battery energy storage, LIB chemistry and form factor on
the volume, recyclability and material value of the forecasted waste stream was analyzed.
Because of the potential “lifespan mismatch” between battery packs and EVs, LIBs with high
reuse potential are expected in the waste stream. Results of the MFA model projected annual EV
LIB waste flows of as high as 340,000 metric tons by 2040. Apart from the high volume, the
projected EV LIB waste streams were characterized by the presence of a variety of recyclable
metals, high percentage of non-recyclable materials, high variability in the potential economic
value, and potential for battery reuse. Hence, a robust end of life battery management system
would include an increase in reuse avenues, expanded recycling capacity, and safe disposal

iv
routes accompanied by policy incentives to promote environmentally and economically
favorable EOL management of EV LIBs.
Second, the environmental trade-offs of cascaded use of retired EV LIBs in stationary
energy storage was investigated using cradle-to-grave life cycle assessment (LCA). The LCA
model was framed from the dual perspective of stakeholders in the: (a) the EV sector, to
understand if there is there a meaningful reduction in EV lithium ion battery environmental
impact due to cascaded reuse, and (b) the Energy Utility sector, to understand if the utility sector
could environmentally benefit from using refurbished EV lithium ion batteries for energy
storage. In both the cases, an environmental benefit was obtained owing to avoiding the
production and use of an incumbent lead-acid battery based system. However, there were
diminished to no environmental benefits in scenarios where very few of the initial battery cells
and modules could be reused and where service life was low in secondary application for
refurbished EV LIB cells. Hence, environmental feasibility of cascaded use systems was found
to be directly related to technical feasibility and reliability. An important methodological
challenge addressed was the allocation of environmental impact associated with production and
EOL management of LIBs across the EV and stationary use systems. The allocation modeling
choices explored here were based on the concept of closed-loop recycling for material cascades.
These modeling approaches can guide LCA of similar product cascade systems where a product
is used for a cascaded second use in a different application.
Finally, a circular economy-inspired waste management hierarchy was proposed for EOL
EVs from LIBs that included limited reuse in EVs, cascaded use in stationary applications,
recycling and finally, landfill. To validate this circular economy approach, an eco-efficiency
analysis was conducted across proposed waste management strategies for an EV LIB waste
stream (modeled as 1,000 battery packs coming out of use in EV applications in the U.S.).
Results demonstrated that a circular economy-centric waste management hierarchy can be
environmentally and economically effective in managing the EV LIB waste stream in future,
owing to benefits from reuse, cascaded use and recycling. However, such benefits would rely
significantly on LIB size, testing procedures, the incumbent battery systems that used LIBs
would displace, future prices of these batteries, and future recycling costs. Hence, these EOL
management strategies would need policy and technology push to be viable. Although much
attention has been placed on landfill disposal bans for batteries, results actually indicated that

v
direct and cascaded reuse, followed by recycling can together negate the eco-toxicity burden of
unavoidable metal flows into landfill. When combined with regulations deterring landfill and
policies promoting life cycle approaches that additionally consider design-for-EOL, battery
maintenance, collection and safe transport, circular waste management systems can be improved
for these batteries. Overall, a circular waste management system for EV LIBs is likely to
complement existing and guide future policies governing EV LIB waste.

vi
ACKNOWLEDGEMENTS
First and foremost, I would like to express my very special gratitude to Dr. Callie Babbitt,
my Ph.D. advisor and mentor for her invaluable guidance and support throughout my doctoral
journey. She has been an amazing role model for me during my graduate work and has been a
continuous source of inspiration. Thank you for your constant encouragement, for challenging
me and for pushing me forward throughout these years which has helped me grow as a
researcher.
I would also like to thank my dissertation committee members Dr. Gabrielle Gaustad and
Dr. Nenad Nenadic for their valuable insights during my dissertation work. The quality of my
research papers greatly improved owing to the constructive feedback provided by Dr. Gaustad
and the technical know-how of Dr. Nenadic.
I would additionally like to thank the Golisano Institute for Sustainability (GIS) for
funding me during the first year of my Ph.D. and the National Science Foundation for
subsequent years. A special thanks goes to the entire GIS family, faculty and staff, specially Dr.
Nabil Nasr, Paul Stiebitz, Dr. Thomas Trabold, Dr. Eric Williams, Lisa Dammeyer, and Donna
Podeszek.
I would further want to extend my gratitude to friends in India, US and Europe for
making me believe that I can do it. Special thanks goes to my amazing friend Mugdha
Patwardhan for always being there for me, during the difficult times and the happy days, for the
constant support, the unending laughs and also, the car rides! I would also like to thank Mitesh
Shah, for being a positive influence in my life which kept me going. Thanks Mitesh and Mugdha
for being my family away from home and for being an immense source of motivation. Thanks
Parin Maru for being such a sweet friend and for making the long trip to Rochester to attend my
academic convocation.
Last, but not the least, I want to thank my family back in India for their unconditional
love and constant faith in me. Mom, Dad and Ritwik, even though you all were thousands of
miles away, I always felt your infinite support and the impact of your constant prayers.

vii
TABLE OF CONTENTS
List of figures……………………………………………………………………………………..ix
List of tables………………………………………………………………………………............xi
Chapter 1: Introduction……………………………………………………………………............1
1.1 Lithium-ion batteries…………………………………………………………………………..1
1.2 Lithium-ion battery use in electric vehicles……………………………………………...……2
1.3 Sustainability implications………………………………………………………………….…5
1.4 Dissertation outline……………………………………………………………………...…….8
Chapter 2: A future perspective on lithium-ion battery waste flows from electric vehicles…….11
2.1 Introduction…………………………………………………………………………………..11
2.2 Method……………………………………………………………………………………….12
2.2.1 Model formulation……………………………………………………………………..13
2.2.2 Economic value of materials in EV battery waste stream……………………………..23
2.3 Results and discussion……………………………………………………………………….24
2.3.1 Estimation of number of EOL battery packs…………………………………………..24
2.3.2 Lithium-ion cells and attendant material flows in the EV battery waste stream………26
2.3.3 Economic value of materials in EV battery waste stream……………………………..29
2.3.4 Uncertainty Analysis…………………………………………………………………...31
2.4 Conclusions………………………………………………………………………………….36
Chapter 3: Environmental trade-offs across cascading lithium-ion battery life cycles………….38
3.1 Introduction………………………………………………………………………………….38
3.2 Method……………………………………………………………………………………… 42
3.2.1 Goal 1: To analyze environmental implications of extending the life of an EV LIB pack
with a cascading second use phase………………………………………………………42
3.2.2 Goal 2: To compare the environmental impacts of a stationary energy storage system
based on refurbished EV LIBs with an equivalent PbA battery based system………….44
3.2.3 Life Cycle Inventory and Life Cycle Impact Assessment……………………………..45
3.2.4 Sensitivity Analysis……………………………………………………………………48

viii
3.2.5 Allocation………………………………………………………………………………50
3.3 Results and discussion……………………………………………………………………….53
3.3.1 Extended life cycle (Case 1)…………………………………………………………...53
3.3.2 Stationary Energy Storage (Case 2)……………………………………………………56
3.3.3 Sensitivity to Allocation Choices………………………………………………...........60
3.4 Conclusions………………………………………………………………………………….62
Chapter 4: Eco-efficiency analysis of a lithium-ion battery waste hierarchy inspired by circular
economy………………………………………………………………………………….64
4.1 Introduction…………………………………………………………………………………..64
4.2 Method……………………………………………………………………………………….68
4.2.1 Reuse in EV applications…………………………………………………………........70
4.2.2 Cascaded use in stationary applications………………………………………………..72
4.2.3 Recycling………………………………………………………………………………72
4.2.4 Landfill…………………………………………………………………………………73
4.3 Results………………………………………………………………………………………..74
4.3.1 Eco-efficiency analysis of proposed LIB EOL hierarchy……………………………...74
4.3.2 Policy Analysis………………………………………………………………………...82
4.4 Conclusion…………………………………………………………………………………..90
Chapter 5: Conclusion and major contributions…………………………………………………92
Appendix A………………………………………………………………………………………98
Appendix B……………………………………………………………………………………..122
Appendix C……………………………………………………………………………………..150
References………………………………………………………………………………………170

ix
LIST OF FIGURES
Figure 1.1 Schematic of the electrochemical process in a Li-ion cell…………………………….1
Figure 1.2 (a) EV sales forecast-2020 (U.S.)……………………………………………………...3
Figure 1.2 (b) EV sales forecast-2020 (Global)…………………………………………………...4
Figure 1.3 (a) LIB market revenue share by application in 2013…………………………………4
Figure 1.3 (b) LIB market revenue share by application in 2020…………………………………4
Figure 2.1 Energy Information Administration (2012) EV sales forecasts……………………...14
Figure 2.2 Truncated lifespan distribution of EV batteries for three scenarios………………….16
Figure 2.3 Conceptual basis of estimating future EV Li-Ion battery outflows…………………..18
Figure 2.4 End-of-life EV Li-Ion batteries generated annually between 2015 and 2040………..25
Figure 2.5 Mass of Li-Ion cells in EV battery waste stream…………………………………….27
Figure 2.6 EV battery material inflow and outflows-Baseline Scenario. Thickness of each bar
corresponds to the relative mass of material in each category…………………………...28
Figure 2.7 Recyclability of EV battery waste stream under different scenarios of Li-Ion cell
cathode chemistry and form factor (cumulative flows from 2015 to 2040)……………..34
Figure 2.8 Cumulative material value of EV battery waste stream (2015-2040)………………..35
Figure 3.1 System boundary to assess environmental implications of EV LIB with a cascading
second use phase in its life cycle………………………………………………………...43
Figure 3.2 System boundary to compare environmental implications of battery choice for
stationary energy storage………………………………………………………………...45
Figure 3.3 CED (a) and GWP (b) impacts of an EV LIB with cascading reuse…………………54
Figure 3.4 Sensitivity analysis: CED of EV LIB with extended life under different scenarios of
cell conversion rate and refurbished EV LIB lifespan…………………………………...56
Figure 3.5 CED of stationary energy storage system, comparing the baseline LIB scenario to
three scenarios of PbA battery efficiency………………………………………………..57
Figure 3.6 Impact of cell conversion rate and refurbished LIB lifespan on environmental
feasibility of EV LIB reuse………………………………………………………………60
Figure 3.7 CED of refurbished EV LIB-based energy storage system under different allocation
approaches………………………………………………………………………………..62
Figure 4.1 Theoretical waste management hierarchy for retired EV LIBs………………………67

x
Figure 4.2 Diagrammatic flows of 1,000 EOL EV LIBs across different waste management
routes……………………………………………………………………………………..70
Figure 4.3 Net environment impact of EV LIB EOL management routes for different fractions of
the analyzed waste stream……………………………………………………………75-76
Figure 4.4 Net economic benefit or cost of EV LIB EOL waste management routes for different
fractions of the analyzed waste stream…………………………………………………..78
Figure 4.5 Landfill leaching potential of unrecovered metals for 115 mT of LIB waste in
landfill................................................................................................................................81

xi
LIST OF TABLES
Table 1.1 Major components of lithium ion batteries and their common chemical constituents…2
Table 1.2 Cumulative energy demand of some common LIB metals……………………………..6
Table 2.1 Vehicle consumption rate, battery efficiency, percent available energy and EV battery
energy storage for the three scenarios……………………………………………………22
Table 2.2 Percentage of Type 1 and Type 2 EOL EV batteries accrued in the waste stream
between 2015 and 2040………………………………………………………………….26
Table 3.1 Parameters varied for sensitivity analysis……………………………………………..50
Table 4.1 Average leaching potential of LIB metals…………………………………………….74
Table 4.2 Current policies governing LIB EOL management and future policy mechanisms…..83

1
CHAPTER 1: INTRODUCTION
1.1 Lithium-ion batteries
Lithium ion batteries (LIBs) were developed by Asahi Kasei Co. in Japan and were
eventually commercialized by Sony Co. in 1991 (Yoshio et al., 2009). Owing to their high
energy and power density and longer cycle and calendar life than the incumbent Nickel
Cadmium (NiCd) and Nickel Metal Hydride (NiMH) battery technologies, LIBs quickly became
very popular for use in consumer electronics such as cell phone and laptops.
In a typical LIB cell, lithium ions move between the anode and cathode, causing electric
current. During charging, lithium ions are released from the cathode and move through a
polymer separator to the anode. This enables the cell to store energy. During cell discharge,
lithium ions in the anode move back into atomic-sized holes in the cathode material, thus
producing energy. In both cases electrons flow in the opposite direction in an outer circuit.
Owing to the reversibility of this chemical reaction, these cells are rechargeable (Linden &
Reddy, 2003).
Figure 1.1 Schematic of the electrochemical process in a Li-ion cell (Linden & Reddy, 2003)
A lithium-ion battery cell contains four major components, viz. cathode, anode,
electrolyte and separator. In general, the lithium-ion system consists of an inorganic lithium-
intercalating compound as positive electrode, a lithium salt in an organic liquid as electrolyte,

2
and a lithium-intercalating negative electrode (generally carbon) (Vimmerstedt et. al., 1995).
Table 1.1 lists some common materials used in lithium ion batteries.
Lithium-ion battery
component
Materials
Anode Carbon Graphite, Lithium Titanate (Li4Ti5O12)
Cathode Lithium cobalt oxide (LiCoO2)
Lithium nickel oxide (LiNiO2)
Lithium nickel cobalt oxide (LiNi0.8Co0.2O2)
Lithium nickel cobalt aluminum oxide
(LixNi0.8Co0.15Al0.05O2)
Lithium manganese nickel oxide (LiMn0.5Ni0.5O2)
Lithium manganese nickel cobalt oxide
(LiMn1/3Ni1/3Co1/3O2; LiMn0.4Ni0.4Co0.2O2)
Lithium manganese oxide (LiMn2O4)
Lithium aluminum manganese oxide (LiAlMnO2)
Lithium iron phosphate (LiFePO4)
Electrolyte solvent Propylene carbonate (PC)
Ethylene carbonate (EC)
Diethyl carbonate (DEC)
Dimethyl carbonate (DMC)
Dimethoxyethane (DME)
Ethyl methylcarbonate (EMC)
Electrolyte salt Lithium hexafluorophosphate: LiPF6
Lithium tetrafluoroborate: LiBF4
Lithium(bis)trifluoromethanesulfonimide: LiN(SO2CF3)2
Lithium tris (trifluoromethanesulfonyl)methide:
LiC(SO2CF3)3
Lithium trifluoromethanesulfonate: LiCF3SO3
Current collector Aluminum, Copper
Separator Polypropylene, Polyethylene
Table 1.1 Major components of lithium ion batteries and their common chemical constituents. Sources:
Vimmerstedt et. al. (1995); Gaines and Cuenca (2000); Linden & Reddy (2003); Yoshio and Noguchi (2009)
1.2 Lithium-ion battery use in electric vehicles
The demand for consumer electronics is currently driving the LIB market with a global
revenue-based market share of 60% in year 2013 (Frost and Sullivan, 2014). However over the
last decade, these batteries have been introduced in electric vehicle (EV) applications with the
Tesla Roadster being the first commercial battery electric vehicle (BEV) to be powered by LIBs
(Berdichevsky et al., 2006). Owing to more than two decades of progress made towards
improving the LIB technology both in terms of energy and power density as well as safety
improvements (Howard & Spotnitz, 2007), they have become the preferred battery system
adopted by leading EV manufactures like Chevrolet, Honda, Nissan, Ford, etc. While many
hybrid electric vehicles (HEVs) in markets still use NiMH batteries, for plug-in hybrid electric
vehicles and BEVs, LIBs are more attractive due to light weight, more than double the energy

3
density of NiMH batteries and four times that of lead acid batteries, longer cycle life, and the
ability to provide deeper discharges.
Several agencies have predicted widespread diffusion of electric-drive vehicles in the
future, both in the U.S. and at a global level. Forecasts of future EV sales (Figure 1.2) have been
produced by the U.S. Energy Information Administration (EIA, 2012), J.D. Power and
Associates (Humphrey et al., 2010), Credit Suisse (Jobin et al., 2009), International Energy
Agency [IEA] (2011), Deutsche Bank (Watabe & Mori, 2011), Deloitte Consulting (Giffi et al.,
2010), Lazard Capital Markets (Shrestha et al., 2010) and Morgan Stanley (Steinmetz &
Shankar, 2008). The range of deployment scenarios by these agencies vary significantly across
parameters (economic growth, oil price, proposed Corporate Average Fuel Economy [CAFE]
standards, battery technology etc.), and indicate anywhere between 0.45 million to 4 million EVs
sold in the United States in 2020 (Figure 1.2(a)) and international sales ranging between 5.2
million to 19.8 million in the same time frame (Figure 1.2 (b)). Powering these vehicles will
clearly require a large scale deployment of lithium ion batteries (Gaines & Nelson, 2010; Gruber
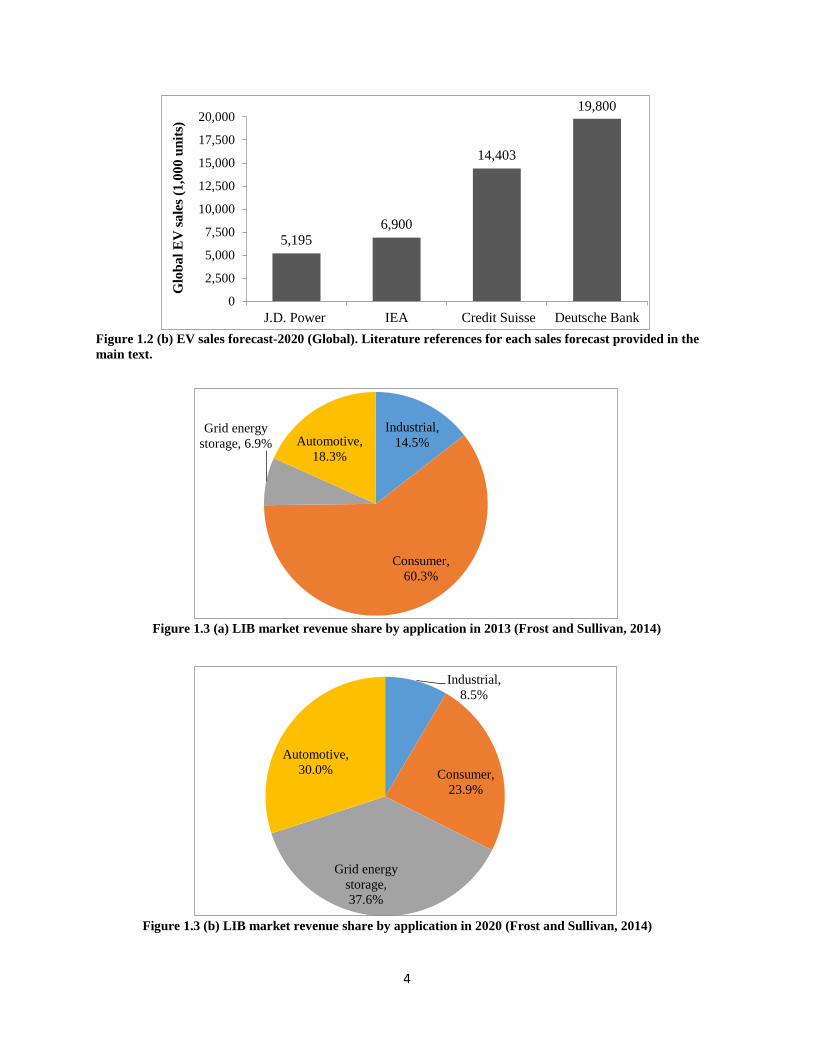
et al., 2011; Kushnir & Sandén, 2012). In fact, it is predicted that in year 2020 EV batteries can
account for about 30% of the LIB market shares (Frost and Sullivan, 2014), while the share of
consumer electronics LIBs would drop from 60% to 24% (Figure 1.3).
Figure 1.2 (a) EV sales forecast-2020 (U.S.). Literature references for each sales forecast provided in the main
text.
449 465 736
1,146 1,196
1,781 2,000
4,000
0
400
800
1,200
1,600
2,000
2,400
2,800
3,200
3,600
4,000
EIA Low Deloitte
(PHEV+BEV)
EIA
Reference
EIA High Lazard Capital
(PHEV+BEV)
J.D. Power Morgan
Stanley(PHEV+HEV)
Deutsche
Bank
US
EV
sale
s (1
,00
0 u
nit
s)
4
Figure 1.2 (b) EV sales forecast-2020 (Global). Literature references for each sales forecast provided in the
main text.
Figure 1.3 (a) LIB market revenue share by application in 2013 (Frost and Sullivan, 2014)
Figure 1.3 (b) LIB market revenue share by application in 2020 (Frost and Sullivan, 2014)
5,195 6,900
14,403
19,800
0
2,500
5,000
7,500
10,000
12,500
15,000
17,500
20,000
J.D. Power IEA Credit Suisse Deutsche Bank
Glo
ba
l E
V s
ale
s (1
,00
0 u
nit
s)
Industrial,
14.5%
Consumer,
60.3%
Grid energy
storage, 6.9% Automotive,
18.3%
Industrial,
8.5%
Consumer,
23.9%
Grid energy
storage,
37.6%
Automotive,
30.0%

5
1.3 Sustainability implications
The rapid growth in LIB demand for EV application is likely to be accompanied with its
own sustainability tradeoffs: as replacements for NiMH batteries, LIBs reduce demand for rare
earth metals but increase consumption of lithium, cobalt, manganese and nickel (Alonso et al.,
2012; Gruber et al., 2011). Several studies have investigated the implications of EV penetration
on material demand, particularly lithium (Gaines & Nelson, 2010; Gruber et al., 2011; Grosjean
et al., 2012; Kushnir & Sandén, 2012; Yaksic & Tilton, 2009). Though concerns over lithium
scarcity in the long-term have been lessened by reassuring results from such studies, there may
still be future challenges for the U.S. to access world lithium resources. A large portion of
lithium deposits are found in only a few countries of the world, with the U.S. accounting for only
0.3% of current lithium reserves (USGS, 2012) and about 3.7% of the world lithium reserve base
(USGS, 2009). Trade embargoes or political instability in the future may drastically impact the
U.S. EV and LIB industries, as many lithium-supplying countries are already politically volatile.
Furthermore, cobalt, manganese and nickel, which are major inputs to the lithium ion battery
industry are not significantly mined in the U.S., leading to primary dependence on imported
supplies (USGS, 2012).
Another major sustainability concern in the future would be the possibility of unchecked
disposal of EV LIB waste that can cause environmental and health hazards, as demonstrated by
unregulated electronic waste in past (Widmer et al., 2005; Robinson, 2009). The toxicity hazards
caused by these batteries would depend on the materials comprising these batteries (Wang et al.,
2014a). Due to the presence of metals like lithium, copper, cobalt, manganese, nickel, etc. the
battery waste can create risk for soil and water contamination when disposed in landfills (Kang
et al., 2013; Vimmerstedt, 1995). Currently the US EPA does not consider these batteries to be
hazardous for the environment based on Toxicity Characteristic Leaching Procedure (TCLP)
tests (Pistoia et al., 2001). A typical laptop battery consists of 6 to 9 LIB cells, but EVs would
comprise of several hundred to thousands of cells per battery pack depending on the vehicle
range (Berdichevsky et al., 2006; Nelson et al., 2011). The increase in magnitude of battery size
as well as scale of battery production is expected to increase the extent as well as the probability
of the hazards associated with these batteries. Hence, there is a need to analyze the health,
environmental and safety hazards associated with them.

6
Many studies have investigated the life cycle environmental impacts of EV LIBs
(Majeau-Bettez et al., 2011; Notter et al., 2010; Zackrisson et al., 2010; Samaras and
Meisterling, 2008; Ishihara et al., 2002; Hawkins et al., 2013; Matheys et al., 2009, Ellingsen et
al., 2013). LIBs have a much lower cumulative energy demand (CED) of virgin material in terms
of MJ/Wh when compared to other battery chemistries such as nickel cadmium and nickel metal
hydride batteries (Rydh and Sanden, 2005). However, some of the LIB materials still have
relatively high CED and hence recovery of these materials would be beneficial from an
environmental perspective (Table 1.2). Since lithium and manganese are currently not recycled
at a commercial scale (Gaines, 2014; Wang et al., 2014b), the CED benefit of these metals in
secondary form is yet to be established. EV LIB end-of-life (EOL) management strategies in
terms of recycling and reuse would enable to deal with supply uncertainty issues of these
materials and waste disposal concerns, as well as provide an environmental incentive by
avoiding primary material mining and production.
LIB material
CED –Primary
metal (MJ/kg)
CED –Secondary
metal (MJ/kg)
Lithium 415 -
Aluminum 194 23.8
Nickel 187 14.7
Cobalt 128 38.4
Copper 60.5 28.1
Manganese 58.6 -
Steel 30.9 8.91
Table 1.2 Cumulative energy demand of some common LIB metals (ecoinvent Centre, 2010)
Moreover, recycling of EOL EV LIBs can be a valuable source of metal recovery.
Forecasts estimate that EV LIB recycling markets can be worth more than 2 billion in year 2022
(Frost and Sullivan, 2010). However, the revenue from the EV battery recycling sector would
depend on the cathode chemistry mix of this waste stream. Currently, most EOL batteries from
consumer electronics contain high levels of cobalt, a metal whose high economic value catalyzes
current LIB recycling systems, but the trajectory of battery technology could result in
introduction of different material and value streams, which may change the economic and policy
implications of battery recycling (Wang et al., 2014a; Wang et al., 2014b). For instance, lithium-
iron phosphate and lithium manganese oxide batteries do not provide much economic incentive
for recycling since recovery of battery grade manganese and lithium from these batteries proves
to be more expensive than obtaining these metals from their ores (Gaines, 2014; Frost and

7
Sullivan, 2010; Wang et al, 2014b). However, economies of scale are expected in the future due
to the large scale EV LIB waste to be generated that can drive recycling of these LIBs (Wang et
al., 2014b). In case of lack of an economic incentive, policy mechanisms may be required to
mandate or provide incentives to encourage recycling of low material value LIB waste streams.
Additionally, it is estimated that LIBs after the end of their useful life in EVs would have
70-80% of their capacity intact, thus capable of serving less demanding energy storage functions
in the utility sector (Heymans et al., 2014, Williams and Lipman, 2010; Neubauer et al., 2012;
Neubauer & Pesaran; 2011; Cready et al., 2003, Narula et al., 2011 etc.). Several economically
and technically feasible secondary use possibilities for retired EV LIBs have been identified such
as transmission support, light commercial load following, residential load following, and
distributed node telecommunications backup power (Cready et al., 2003). Additionally,
collaborations have been established between automobile manufacturers and utility providers to
test the technical feasibility of EV LIB repurposing and “cascaded” use for stationary energy
storage such as those between Nissan and Sumitomo Corporation or General Motors and ABB
Group. In fact, a recent study by Sathre et al. (2015) demonstrated that second use of retired
plug-in electric vehicles in California has the capability of delivering 5% of electricity demand of
the state in year 2050. However, as in the case of recycling, the cascaded use model would be
accompanied with its own obstacles in terms of the performance, reliability, technology and
design requirements, business models, as well as lower perceived value by consumers (Neubauer
& Pesaran, 2011; Cready et al., 2003; Frost and Sullivan, 2010; Hein et al., 2012). Moreover,
since LIB cells have the potential safety threat of “thermal runaway”, the cascaded use pathway
can face additional regulatory barriers governing the shipping and collection of EV LIBs and
siting of large stationary energy storage systems (Elkind, 2014). Overcoming these roadblocks
and economic and technical constraints of EV LIB secondary use in stationary application can
create a sustainable market of repurposed EV LIBs grid-based, off-grid and renewable energy
storage applications.
Irrespective of the barriers and concerns associated with recycling and reuse pathways of
EV LIBs, both the EOL management routes provide the possibility of reducing net
environmental impacts of these batteries by reducing battery waste deposition as well as
avoiding resource depletion, energy use and other environmental impacts (e.g. toxicity,
greenhouse gas emissions etc.) associated with production of LIBs or their constituent materials.

8
From a systems perspective, both cascaded use of whole LIB packs, module or cells and
recycling of constituent LIB materials have the potential of magnifying the environmental gains
from use of EV technology (Ahmadi et al., 2014a). Since LIBs constitute a major cost
component of EV ownership, development of EV LIB reuse avenues and economically feasible
recycling technology for closing the loop of LIB materials has the ability of reducing the battery
cost and encouraging EV adoption.
1.4 Dissertation outline
This dissertation aims to analyze the environmental and economic implications of EOL
EV lithium-ion batteries by:
(1) Estimating and characterizing the EV LIB outflows potentially entering the waste stream
due to their increasing deployment in electric vehicles over the short and long term future
in the United States (Chapter 2)
(2) Analyzing the life cycle environmental benefits of cascading batteries from the EV waste
stream into a second use in stationary energy storage applications (Chapter 3)
(3) Assessing the environmental and economic trade-offs of different end-of-life
management pathways of EV LIBs along a circular economy inspired waste management
hierarchy (Chapter 4)
To achieve these objectives, a combination of techniques from industrial ecology were
applied, including material flow analysis and life cycle assessment, coupled with scenario
analysis, systems analysis, cost-benefit analysis and empirical approaches.
As a proactive step towards understanding future waste management challenges, Chapter
2 presents a future oriented material flow analysis (MFA) used to estimate the volume of LIB
wastes to be potentially generated in the United States due to EV deployment in the near and
long term future. Because such an analysis is complicated by significant uncertainty about
technology adoption and performance, this MFA is also informed by approaches used in
previous studies to develop scenario-based MFA for materials ranging from steel (Park et al.,
2011; Pauliuk, Wang, & Muller, 2011; Michaelis & Jackson, 2000) to electronic waste (Steubing
et al., 2010; Kang & Schoenung, 2006; Streicher-Porte et al., 2005). From a methodological
standpoint, Chapter 2, thus, also seeks to highlight the uncertainties associated with conducting a
scenario-based MFA of EV LIBs, as a means of establishing future research priorities that must

9
be resolved as additional data and system parameters become available. Key uncertainties
addressed here include EV adoption dynamics, battery lifespan and constituent LIB cells. Hence,
a set of scenarios was developed to bound the parameters most influential to the MFA model and
to forecast “low,” “baseline,” and “high” projections of future EOL battery outflows from years
2015 to 2040. These models were implemented using technology forecasts, technical literature,
and bench-scale and battery modeling data characterizing battery material composition. The
waste stream under the different modeling scenarios was analyzed for material volume, reuse
potential, recyclability and material value. By highlighting the timing, variety and volume of
materials expected in the future EV LIB waste stream, the MFA model would help policy makers
to develop proactive measures for EOL battery reuse, recycling and safe waste disposal.
Additionally the EV-LIB MFA system in Chapter 2 presents a unique case of MFA modeling of
“dual-product systems” where a lifespan mismatch is expected between EV and the LIBs. This
MFA therefore serves as a model to analyze waste flows and obsolescence dynamics of similar
systems such as photovoltaic cells and their parent-modules, electronic equipment and parts or
automobiles and their components.
To build on the several techno-economic analyses of EV LIB cascaded second use in
stationary energy storage (Neubauer and Pesaran, 2011; Neubauer et al., 2012; Cready et al.,
2003; Williams and Lipman, 2010; Viswanathan et al., 2011; Narula et al., 2011, etc.), in
Chapter 3 the environmental tradeoffs from cascaded use of retired EV LIBs in stationary energy
storage application was analyzed. A cradle-to-grave life cycle assessment (LCA) approach was
employed to jointly model two systems to address the consideration of stakeholder groups
corresponding to both first (EV) and second life (stationary energy storage) battery applications.
The environmental feasibility criterion was defined by an equivalent-functionality lead-acid
(PbA) battery which is the incumbent technology widely adopted for stationary energy storage
applications (Soloveichik, 2011). The dual-stakeholder approach was adopted to understand the
potential for dual benefit from EV LIB second use– both from the perspective of offsetting initial
manufacturing impacts by extending the lifespan as well as avoiding production and use of a
PbA battery system. The LCA model also tested sensitivity to parameters such as the fraction of
battery cells viable for reuse, service life of refurbished cells, and PbA battery efficiency. A
critical methodological challenge addressed in Chapter 3 was the allocation of environmental
impacts associated with producing LIBs across the EV and stationary use systems.

10
In Chapter 4, a waste management hierarchy inspired by circular economy principles was
proposed for EOL management of retired EV LIBs entering the US waste stream in year 2030.
Four EOL management pathways were modeled: 1) a small fraction of LIBs would meet
technical requirements for limited reuse in used EVs, 2) a majority of used LIBs would be
directed to “cascaded use” in a secondary grid energy storage application, 3) non-reusable
batteries would be recycled, and 4) all remaining materials would be landfilled. In fact, the EU
Waste Framework Directive (2008/98/EC) promotes the circular economy concept and
recommends a waste management hierarchy of prevention, reuse, recycling, energy recovery
and disposal, with prevention and reuse the preferred waste management approaches (European
Parliament, 2008).
The environmental and economic implications of different EOL pathways of waste
electronics have been explored in the past (Wang and Gaustad, 2012; Iakovou et al., 2009;
Williams et al., 2008; Kiritsis et al., 2003; etc.) to guide policies to include both regulatory
interventions and economic incentives for producers to take up extended producer responsibility.
In general, a waste management hierarchy depicts priorities from an environmental, as well as
from an economic perspective for electronics (Brandstotter et al., 2004) but it is yet to be
analyzed for LIBs. While the European Union and few states in the US ban the landfill of
batteries (CA Code, 2006; New York State Rechargeable Battery Law, 2010, European
Commission, 2006), waste regulations in both EU and US can potentially be expanded to more
specifically address management of LIBs from vehicles along different EOL pathways. Since a
comprehensive eco-efficiency analysis of EV LIB waste management routes is currently absent,
a lack of understanding of the economic costs or benefits of the different EOL management
pathways of LIBs may delay proactive policy instruments to be implemented to facilitate the
adoption of the environmentally preferable battery waste management route. Hence, in Chapter
4, a case study was developed to examine the eco-efficiency of the proposed waste management
framework along metrics like cost savings, cumulative energy demand (CED), eco-toxicity, and
metal depletion. Since EOL management pathways for LIBs along the proposed hierarchy must
also consider policy implications, gaps in current policies were identified and the results of the
case study were used to set a roadmap for EV battery EOL management research and policy to
improve the “circularity” of the proposed system.

11
CHAPTER 2: A FUTURE PERSPECTIVE ON LITHIUM-ION BATTERY WASTE
FLOWS FROM ELECTRIC VEHICLES
2.1 Introduction
Lithium-ion batteries (LIBs) have emerged as a promising energy storage solution for
electric vehicles (EVs) and renewable energy systems, but their potential environmental tradeoffs
are not well characterized. Although recent work has focused on supply side issues, such as
lithium availability, key uncertainties surround the emergence and management of these batteries
in the waste stream and the ability of domestic recycling infrastructure to recover scarce and
valuable materials from a highly variable mix of discarded batteries. A proactive approach is
required to prevent unanticipated environmental impacts of end-of-life (EOL) battery generation
associated with forecast growth in electric vehicle deployment.
Clearly, a better understanding of the ultimate management and fate of batteries in the
waste stream is required, but such an analysis is complicated by key uncertainties, including the
expected timing and volumes of batteries reaching their end of life; the quality, concentrations,
and variability of specific materials contained in spent batteries; and the capacity for recycling
systems to recover scarce and valuable materials from a highly variable battery waste stream.
While the lag in deploying EV technologies may suggest that battery waste will not be a priority
for several years, “lessons learned” from our current sub-optimal management of electronic
waste show the perils of introducing complex products without proactive development of a waste
management system. In the case of electronic waste, low end-of-life value, difficulty recovering
valuable materials and insufficient domestic infrastructure has lead to exploitation of developing
countries and loss of valuable material resources (Babbitt et al., 2011; Williams et al., 2008;
Widmer et al., 2005; Wang & Gaustad, 2012). Since many of these factors are similar to LIBs,
avoiding negative environmental, economic, and social outcomes at EOL requires a more
proactive approach in planning for this new waste stream.
As a step towards addressing EOL LIB management, this chapter applies a scenario-
driven material flow analysis (MFA) to project the potential volume and timing of lithium-ion
batteries entering the waste stream as a result of their forecasted deployment in electric vehicles.
Towards this objective, the number of EV LIB units entering the waste stream as well as the
mass of battery cells in that stream is estimated on an annual basis between years 2015 and 2040
for three different scenarios. To estimate recycling potential and waste management needs of

12
EOL EV LIBs in the future, this chapter also aims to characterize the materials that would be
present in the EV battery waste stream on the basis of their recyclability and their commodity
value under different technology trajectories of battery chemistry and form factor. Furthermore,
this MFA model also seeks to characterize the potential for diverting EV batteries from this
waste stream into reuse applications depending on the remaining battery life.
MFA is a well-established method for investigating the material, energy and
environmental implications of commodity products (Oguchi et al., 2008; Yoshida et al., 2009;
Chang et al., 2009; Steubing et al., 2010 etc.). While some MFA studies have addressed issues
related to LIBs, the existing literature focuses on analyzing the stock and flows of laptops and
cell phones batteries (Chang et al., 2009), tracking flows of cobalt (Harper et al., 2012), and
assessing supply and demand for lithium due to EV technology (e.g., Gaines and Nelson, 2010;
Grosjean et al., 2012; Kushnir and Sandén, 2012). As such, no study has yet applied MFA to
fully model future outflows of batteries from EV systems.
2.2 Method
A future oriented top-down MFA was conducted to estimate the volume of lithium-ion
batteries projected to enter the waste stream in the near and long term future, after use in electric
vehicles. MFA is a systematic assessment of the flows and stocks of materials within a defined
temporal and spatial system (Brunner & Rechberger, 2004) that can be used to track the flow of a
specific substance or of products within a system. In the top-down MFA methodology, the
product inflows are determined from specific ‘final goods’ categories entering the system and the
outflows are determined from discards, based on product lifespan, with the material stocks being
inferred from these inflows and outflows (Graedel & Allenby, 2010). Here, the annual inflow of
EV batteries was estimated from projected EV sales, and the annual outflow of batteries was
calculated based on battery and vehicle lifespans. Given the significant uncertainty about future
EV adoption rates and battery technologies, bounding scenarios were developed to forecast
“low,” “baseline,” and “high” projections of future waste battery outflows and their attendant
material implications. Key differences among these scenarios stemmed from variability in EV
sales projections, battery lifespan distribution and parameters governing number of cells per
battery pack, which will be discussed in the subsequent sections.

13
2.2.1 Model formulation
The EV battery MFA model was implemented in three sequential steps, each described in
more detail in the following sections:
(1) Material flow analysis to estimate the waste flows of entire EV battery packs
(2) Estimation of individual lithium-ion cells contained in the EV battery pack waste stream
(3) Assessment of specific materials comprising each cell within the EV battery waste stream
Furthermore, based on the material and mass composition of the EV battery waste stream, the
economic value of the waste stream was estimated on an annual basis.
Material flow analysis to estimate the flows of waste EV battery packs: The first part of the
model calculated the number of lithium-ion EV battery packs entering the U.S. waste stream on
an annual basis from years 2015 to 2040. This time period was chosen based on available data
from the Department of Energy on both near- and long-term EV deployment projections. The
annual inflow of EV batteries was estimated from EV sales forecasts, and the annual outflow of
waste batteries was determined based on the battery lifespans once they entered vehicle use, as
well as the lifespan of the EV itself.
EV sales forecast: U.S. level EV sales forecasts were obtained from the Light Duty Vehicle
(LDV) Sales Projections through the year 2035 provided by the U.S. Energy Information
Administration [EIA] (EIA, 2012). Three types of electric-drive vehicles were considered in the
EIA LDV sales forecasts: hybrid- [HEVs], plug-in hybrid- [PHEVs] (10 miles and 40 miles
ranges) and all-electric or battery electric vehicles [BEVs]. For the baseline scenario, the EIA
Annual Energy Outlook “reference case” LDV sales projections were used. The reference case
used in EIA projections is a baseline scenario assuming business-as-usual with current laws and
regulations being the same across the timeline of the projections (EIA, 2012). The low and high
scenarios reflect EIA forecasts that consider low and high oil prices, respectively. These
forecasts are shown in Figure 2.1.

14
Figure 2.1 Energy Information Administration (2012) EV sales forecasts
Battery lifespan: The lifespan or service life of a lithium-ion battery can be expressed either in
terms of its cycle life or its calendar life. Cycle life is defined as the number of charge-discharge
cycles the battery can undergo before failing to meet specific performance criteria. Calendar life
on the other hand is defined as the length of time a battery can be stored with minimal discharges
before capacity diminishes. In general, a battery is considered to have reached its end of life in
EV application when it reaches about 80% of its original capacity (William and Lipman, 2010).
EV battery lifespan is highly uncertain and dependent on many factors which are still poorly
understood. Marano et al. (2009) indicates that lithium-ion batteries usually have a calendar life
of 10 years, subject to favorable operating conditions that avoid overcharging, aggressive driving
leading to rapid discharge and more frequent charging, and operation at high temperatures. Most
previous studies have assumed a fixed EV battery lifespan of either 8 or10 years (Gruber et al.,
2011; Yaksic & Tilton, 2009; Harper et al., 2011), which is consistent with the length of many
vehicle manufacturers’ warranty terms. However, some literature indicates lower lifespan of
about 5 years for EV LIBs (Anderman, 2007). As per Dinger et al. (2010), EV battery life span
could be anywhere between 5 to 10 years, while Nemry et al. (2009) assume a lifespan of 10-15
years. Significant research efforts are aimed toward achieving a higher lifespan for almost 15
years for EV batteries (Kalhammer et al., 2009; Chalk & Miller, 2006).
Applying a lifespan distribution to determine the EV-LIB outflows would address the fact
that the lifespan of a battery would depend on its usage and charging patterns, which vary from
0125250375500625750875
1,0001,1251,2501,3751,5001,6251,7501,8752,000
200
9
201
1
201
3
201
5
201
7
201
9
202
1
202
3
202
5
202
7
202
9
203
1
203
3
203
5
US
EV
sa
les
(1,0
00
un
its)
Year High Oil Price Scenario Reference Case Low Oil Price Scenario

15
user to user. Assuming that electric vehicles are charged 1.5 times per week, the U.S.
Department of Energy (U.S. DOE, 2010) predicted that the calendar life of a typical EV battery
would increase from 4 years in 2009 to 14 years in 2015 owing to the ongoing innovation in this
field. Hence, the different scenarios in the model have considered battery life spans ranging from
4 to14 years. Rather than a single point estimate, a lifespan distribution (Figure 2.2) was applied
to model a more realistic scenario, taking into consideration early battery failures as well as
batteries surviving for more than 10 years. Since a lifespan distribution of EV LIBs is not yet
established, this technology being in its early stages of adoption, a truncated normal distribution
of EV LIB lifespan has been used in the three scenarios (with a mean lifespan of 8 to 10 years).
The variation in assumed battery lifespan distribution among the three scenarios not only
indicate the uncertainty in the lifespan of EV LIBs but also highlight that the volume of EV
battery waste stream would be dependent on battery lifespan to a certain extent. For instance, in
the low scenario, 70% of EV LIBs have been assumed to have lifespan exceeding 8 years,
whereas this percentage is 50% and 35% respectively for batteries in the baseline and high
scenarios respectively. In spite of these variations, the distributions selected result in a majority
of EV LIBs used in EVs modeled as having a lifespan in the range of 8 to 10 years, consistent
with warranty terms and recent literature.
Similar to EV batteries, the lifespan of electric vehicles too would follow a distribution
which may be even wider than that for batteries, depending on early vehicle failure or car crashes
as well as extended life through multiple resales. However, to keep this initial MFA model
tractable, the EV lifespan has been fixed. In general, traditional vehicle lifespan assumptions
vary across studies in the range of 10 to 16 years (Huang et al., 2011; Greene & DeCicco, 2000;
Lemp & Kockelman, 2008; Greene et al., 2005; Kumar & Sutherland, 2008). Only limited
information is available on electric vehicle lifespan, but this parameter is modeled as 10 years in
a recent study by Gruber et al. (2011). While the uncertainty associated with lifespan and the
need for future work in this area is recognized, this MFA model assumed a moderate, fixed EV
lifespan of 10 years as a starting point for analysis, with sensitivity analysis on a 16 year EV
lifespan shown in section S7.3 of Appendix A.
16
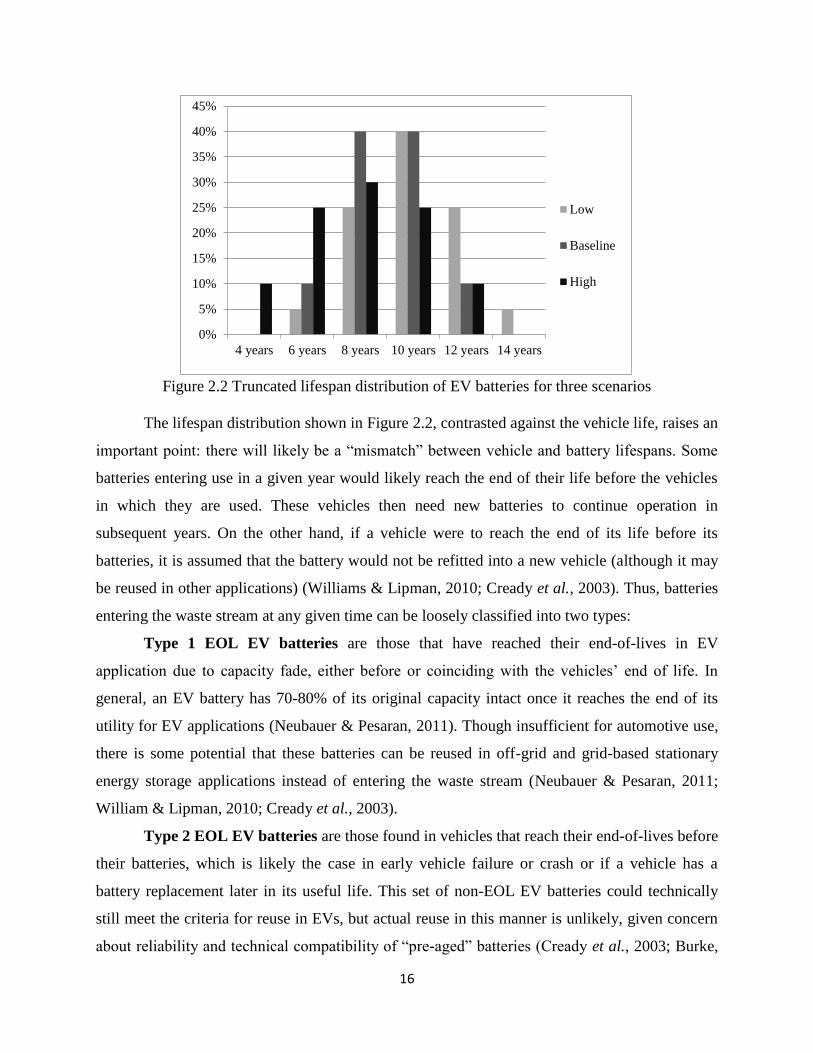
Figure 2.2 Truncated lifespan distribution of EV batteries for three scenarios
The lifespan distribution shown in Figure 2.2, contrasted against the vehicle life, raises an
important point: there will likely be a “mismatch” between vehicle and battery lifespans. Some
batteries entering use in a given year would likely reach the end of their life before the vehicles
in which they are used. These vehicles then need new batteries to continue operation in
subsequent years. On the other hand, if a vehicle were to reach the end of its life before its
batteries, it is assumed that the battery would not be refitted into a new vehicle (although it may
be reused in other applications) (Williams & Lipman, 2010; Cready et al., 2003). Thus, batteries
entering the waste stream at any given time can be loosely classified into two types:
Type 1 EOL EV batteries are those that have reached their end-of-lives in EV
application due to capacity fade, either before or coinciding with the vehicles’ end of life. In
general, an EV battery has 70-80% of its original capacity intact once it reaches the end of its
utility for EV applications (Neubauer & Pesaran, 2011). Though insufficient for automotive use,
there is some potential that these batteries can be reused in off-grid and grid-based stationary
energy storage applications instead of entering the waste stream (Neubauer & Pesaran, 2011;
William & Lipman, 2010; Cready et al., 2003).
Type 2 EOL EV batteries are those found in vehicles that reach their end-of-lives before
their batteries, which is likely the case in early vehicle failure or crash or if a vehicle has a
battery replacement later in its useful life. This set of non-EOL EV batteries could technically
still meet the criteria for reuse in EVs, but actual reuse in this manner is unlikely, given concern
about reliability and technical compatibility of “pre-aged” batteries (Cready et al., 2003; Burke,
0%
5%
10%
15%
20%
25%
30%
35%
40%
45%
4 years 6 years 8 years 10 years 12 years 14 years
Low
Baseline
High

17
2009). These batteries may have high potential for other reuse markets, like those described
above. The distinction between these two battery types is intended to indicate the potential for
diverting batteries from the waste stream into reuse applications.
Lithium-ion battery use in hybrid electric vehicles
Currently most HEVs on the market use nickel metal hydride [NiMH] batteries, rather
than lithium-ion, and NiMH batteries would continue to be a feasible option for HEV for several
years (Frost & Sullivan, 2009). However, it is predicted that lithium-ion batteries’ share of the
HEV market would grow and eventually surpass NiMH usage between 2018 and 2025 (Jobin et
al., 2009; Madani, 2009; Fu, 2009). Estimates from a Credit Suisse report prepared by Jobin et
al. (2009) were applied to the scenarios used here, as their study provided both conservative and
optimistic estimates for HEV lithium-ion battery adoption. The high and baseline scenarios
started from the Credit Suisse bottom-up estimates, which were optimistic towards rapid LIB
adoption in HEV (Jobin et al., 2009), leading to an assumption that all HEVs use lithium-ion
batteries by year 2015 and 2025, respectively in these two scenarios. The Credit Suisse top-down
estimate for HEV lithium-ion battery adoption was used for the low scenario, with an assumption
that 100 percent of HEVs would not rely on lithium-ion batteries until the year 2032. Details
about HEV lithium-ion battery adoption are provided in Appendix A.
Estimation of EV battery pack outflows
Considering the sales and lifespan assumptions stated above, Figure 2.3 illustrates the
conceptual basis of estimating EV battery outflows by this model:

18
EV Sales
Forecast
EV Battery Input
EV battery
lifespan
distribution
Lifespan, l
Non-EOL
EV
EOL Battery
Type 1
EOL EV
EOL Battery
Type 1
EOL EV
Non-EOL
Battery
Type 2
EV Li-ion
batteries in waste
stream
Percentage using Li-ion
Batteries
}
Non-EOL EV
Fixed EV Lifespan
Probability, Pl
Figure 2.3 Conceptual basis of estimating future EV Li-Ion battery outflows
The number of new LIBs entering EV use in any year t would depend on EV sales in year
t, as well as the number of non-EOL EVs which would require a replacement battery in that year
(Figure 2.3). Here, it was assumed that all non-EOL EVs would use a replacement battery, while
it is recognized that realistically, all vehicles may not be put back into use due to high
replacement battery cost or damages due to automotive accidents. The lifespan distribution was
based on "𝑃𝑙", the percentage of batteries sold in any given year to have a useful life of l years in
EV application, which varied based on the scenario (Figure 2.3). Kt, the total number of lithium-
ion battery packs entering use in EVs in year t was determined as follows:
)( ,, i
titit WSK (1)
Si,t = Sales of new EVs of type i that use LIBs in year t
Wi,t = Non-EOL EVs of type i requiring a replacement LIB in year t
The above relationship was distinguished by “i” vehicle types: BEV, PHEV10, PHEV40,
and HEV (the percentage of HEVs that use lithium-ion batteries). The number of batteries
entering new EVs (Si,t) was determined by the sales forecast for that year, as described in a

19
previous section. The non-EOL EVs requiring a replacement battery (Wi,t) was based on the
scenario-specific cases of first-use batteries with a shorter lifespan than the vehicles in which
they were used. In cases of extreme “lifespan mismatch,” vehicles with very long lifespans
paired with batteries with very short lifespans may require two battery replacements. Hence, for
a given year, t,
i l
ltiltilti WSPW )(* )(,)(,, (2)
l= EV battery lifespan,
s.t. l< EV lifespan,
lP = Percentage of EV LIBs sold in any given year to have a useful life of l years in EV
application
)(, ltiS = Sales of new EVs of type i in year (t-l)
)(, ltiW = Non-EOL EVs of type i requiring a replacement battery in year (t-l)
Thus, the number of EV LIB packs entering the waste stream (B) in a given year t after an l year
lifespan is expressed as:
i l
ltilt KPB )(* )(, (3)
)(, ltiK = Total number of LIB packs entering use in EVs of type i in year (t-l)
Estimation of individual lithium-ion cells contained in the EV battery pack waste stream
The approach described thus far focused on total battery packs, which each may contain a
varied number and type of cells, depending on technical specifications such as EV type and
cathode chemistry. Next, the number of lithium-ion cells in this EV battery waste stream was
estimated, for a given year t as
i j
jijtitt DPCPEBN )**(* ,, (4)
tB =Number of LIB packs in EV battery waste stream in year t
i=EV type (BEV, PHEV10, PHEV40, HEV)
j= LIB cathode chemistry
PEi, t= Percentage of waste LIB packs belonging to EV type i in year t

20
PCj= Percentage of LIBs of battery chemistry j in EV battery waste stream
Di, j=Number of cells per LIB pack, specific to EV type and cathode chemistry
Parameters Bt and PEi,t change with time as well as with the scenario under consideration
as they are functions of annual EV sales within a given scenario. On the other hand, PCj and Di, j
were assumed constant with time, though Di, j does vary across the scenarios as shown in Table
S3.2 in Appendix A.
The number of battery packs in a given year t (Bt) was obtained from the EV battery
MFA results discussed in the previous section. PEi,t, percentage of waste batteries belonging to a
given EV type in year t was based on the relative prevalence of each type of EV sold, and thus
entering the waste stream. Four prevalent lithium-ion cathode chemistries (i.e. j) were
considered, namely, lithium cobalt oxide (LiCoO2), lithium manganese oxide (LiMn2O4), lithium
iron phosphate (LiFePO4) and lithium nickel cobalt manganese (NCM) oxide, all having 18650
form factor cells (cylindrical cells with 18 mm diameter and 65 mm length). The selection of this
form factor was based on data availability, with the recognition that results may change with
alternative form factors, like the prismatic cells, expected to be used in most EVs. Sensitivity
analysis was conducted on this assumption as described in following sections. While the current
LIB waste stream is almost entirely made up of consumer electronic batteries, which typically
contain 100% LiCoO2 cathode chemistry (Wang et al., 2014b), the distribution of cathode
chemistries assumed in this chapter (i.e. PCj) for all three scenarios is 10% LiCoO2, 30%
LiMn2O4, 30% LiFePO4, and 30% NCM. This distribution was selected to reflect that all three
latter cathode chemistries are likely candidates to replace the existing lithium cobalt oxide based
batteries for EV application, aside from limited application as in the case of Tesla vehicles. The
number of cells per battery pack for a given EV type using a given battery chemistry (𝐷𝑖,𝑗)
varied with the scenario under consideration as described in the following section.
Determination of number of cells per battery pack (Di,j)
The number of cells per LIB pack for a given EV type and a given battery chemistry
(Di, j) was estimated from the energy storage capacity of the EV battery pack (Epacki), dependent
on the EV type i and the energy storage of individual cells (Ecellj), dependent on the cell cathode
chemistry j and was estimated as follows:
))(/)((, WhEcellWhEpackD jiji (5)

21
Battery energy storage (Epacki)
The battery pack energy storage (Epacki) depends on the EV type and its associated
electric range, as well as other parameters like vehicle consumption rate and percent battery
efficiency and available energy:
)*/()*( iii ACREpack (6)
Ri =Electric range of EV type i (miles)
C = Electric vehicle consumption rate (Wh/miles)
𝜂= Percent efficiency of EV LIB
Ai = Percent available energy of the total EV LIB energy for a given EV type i
While the vehicle electric range remains constant with each scenario, the other three parameters
in Equation 6 will vary over the three scenarios:
(1) Vehicle electric range (Ri)
The electric ranges for the three EV types were determined based on EIA (2012) and
Gaines and Nelson (2010) and were kept fixed across all scenarios. The BEVs were assumed to
have 100 miles electric range, the HEVs were assumed to have 4 miles electric range. In case of
PHEVs, both 10 and 40 miles electric ranges were considered.
(2) Vehicle consumption rate (C)
The consumption rate of an electric vehicle can be defined as the electrical energy
consumed per mile of travel. Table S5.1 in Appendix A lists the energy consumption rates of
electric vehicle models in the recent years (according to EPA tests), and assumptions
documented in the literature. Based on these values, the consumption rate of EVs was assumed
to be 250 Wh/mile, 300 Wh/mile and 350 Wh/mile for the low, baseline and high scenarios,
respectively.
(3) Battery efficiency (𝜼)
The overall energy stored by the battery available for electric vehicle application depends
on the energy efficiency of the battery, so there is an inverse relationship between efficiency and
number of cells. The battery efficiency determines the amount of energy taken out during

22
discharge after it was initially charged. The most common energy efficiency value for lithium-
ion batteries reported in literature is 90% (Van den Bossche et al., 2006; Gondelach, 2010; Shiau
et al., 2009; Karden et al., 2007; Tanaka et al., 2001; Matheys et al., 2008). For the Tesla
Roadster BEV, the efficiency of the charge-discharge cycle of lithium-ion batteries was reported
to be approximately 86% (Eberhard & Tarpenning, 2006). Campanari et al. (2009) have assumed
a 92% efficiency of lithium-ion batteries used in electric vehicles. According to Rydh and
Sandén (2005), the efficiency of lithium-ion batteries can lie anywhere between 85% and 95%.
Hence, the EV battery efficiency was assumed to be 95%, 90%, and 85%, respectively for the
low, baseline, and high scenarios (see Table 2.1).
(4) Available energy of EV battery (Ai)
The available energy of an EV battery is typically less than the total energy stored
because the depth of discharge is restricted to preserve battery life and for safety purposes
(Axsen, Burke, & Kurani, 2008). According to Srinivasan (2008), the available energy of a HEV
battery is 20-30% of its total energy, while for a BEV or PHEV battery it could be as high as 70-
80%. As per the Argonne National Laboratory [ANL] (2012) BatPaC model, the energy utilized
by a HEV battery is 25 % of the total energy, while it is 70-75% and 85-90% for a PHEV and
BEV battery respectively. Based on these ranges, assumptions for the available energy
percentage of the total battery energy for each of the vehicle type and for the three scenarios are
as shown in Table 2.1, which also includes assumptions for the vehicle consumption rate, battery
efficiency and available energy for the three scenarios, and the calculation of EV battery energy
storage based on these factors:
Scenario
Vehicle
Consumption
Rate (Wh/mile)
Battery
Efficiency
Battery Available
Energy (Percentage) EV Battery Energy Storage (kWh)
BEV PHEV HE
V
BEV PHEV10 PHEV40 HEV
Low 250 95% 90% 80% 30% 29.2 3.3 13.2 3.5
Baseline 300 90% 85% 75% 25% 39 4.4 18 5.3
High 350 85% 80% 70% 20% 51 5.9 24 8.2
Table 2.1 Vehicle consumption rate, battery efficiency, percent available energy and EV
battery energy storage for the three scenarios

23
Cell energy storage (Ecellj)
The energy storage of 18650 cells for the four battery chemistries considered was
obtained as the product of cell capacity and the nominal or average cell voltage as described in
section S3 in Appendix A. The cell capacity (mAh) was estimated as the product of the cathode
mass and the specific capacity (mAh/g) of lithium-ion cells for each of the four cell chemistries
considered in the model. The specific capacity of the lithium-ion cells was obtained from Dahn
and Erlich (2011). The cathode mass of each of the cell types was estimated from their respective
bill of materials. The cell energy storage of each of the lithium-ion cell types was assumed to be
constant with time as well as across the three scenarios. Using the approach described above, the
final input to the MFA model pertaining to number of cells per LIB pack was determined
(summarized in Table S3.2 in Appendix A, which distinguishes across scenarios, vehicle types,
and cathode chemistries).
Assessment of specific materials comprising each cell within the EV battery waste stream
In the final stage of modeling, the specific materials contained in the battery cells were
taken into account. Based on Bt, the total number of waste LIB packs in year t, the percentage of
waste LIBs belonging to EV type i in year t (PEi,t), the percentage of battery chemistry j in EV
battery waste stream (PCj), and the number of cells per battery pack for EV type i and battery
chemistry type j (Di,j), the amount of any material y present in the EV battery waste stream for a
given year t was estimated as,
i j
jyjijtitty mDPCPEBMO )***(* ,,,, (7)
jym , =Mass of a given material y (aluminum, copper, lithium etc.) in a lithium-ion cell of cathode
chemistry j
The variable jym , was obtained from the bill of materials of lithium-ion cells of the four
cathode chemistries from the disassembly of 18650 lithium-ion cells (Wang et al., 2014a) and
remained constant across the scenarios as well as with time (Table S4.1, Appendix A). The other
variables in this part of the model have been discussed in previous sections.

24
2.2.2 Economic value of materials in EV battery waste stream
The annual value of materials present in the EV battery waste stream was estimated using
global spot prices (London Metal Exchange, 2012; Shanghai Metals Market, 2012) and USGS
(2012) commodity values of LIB materials (Table S9.1, Appendix A). This estimation only
included currently recycled materials (aluminum, cobalt, copper, nickel, steel and iron) as well as
high value materials not currently recycled in the U.S. but with high potential for recovery in the
future (lithium and manganese) to calculate the “maximum theoretical commodity value” of the
EV battery waste stream. The future-oriented characterization of lithium and manganese as high
value materials is based on several factors, including current LIB recycling efforts aimed at
developing recovery processes for these materials (Paulino et al., 2008; Dunn et al., 2012; Zou et
al., 2013; Yang et al., 2013 etc.), limited lithium and manganese resources in the U.S. and the
resultant dependence on import of these metals (USGS, 2012), and the potential price rise of
these metals with growing demand for EV LIBs. Manganese comprises about 20-25% of a
typical lithium-ion cell (Wang et al., 2014a; ANL, 2012) making these cells a viable source for
recovery of manganese. Though lithium constitutes only 1-2% of the total cell mass of typical
LIBs (Wang et al., 2014a; ANL, 2012), considering an EV battery pack comprising of thousands
of cells, the amount of lithium available for recovery would not be negligible. Although lithium
carbonate is currently a lower cost input to LIB production (USGS, 2012), the forecast increase
in lithium demand by 2020 (Jobin et al., 2009) and potential lag in supply (Kushnir & Sandén,
2012) may trigger lithium price rise in future. In fact, lithium spot prices of about $62/kg have
been listed in the Shanghai Metals Market (2012).
Recycling efficiencies of materials and the collection rate of spent EV LIBs were not
considered in estimating the commodity value of EV battery waste stream. Other materials in
this waste stream that are unlikely to be recycled (graphite, electrolyte, plastics, etc.) were
excluded from this valuation. The baseline scenario MFA results were used as basis for these
economic estimations.
2.3 Results and Discussion
2.3.1 Estimation of number of EOL battery packs
Based on the parameters defined for each of the three scenarios, the number of EV LIB
packs potentially entering the waste stream on an annual basis was estimated (Figure 2.4).

25
Figure 2.4 End-of-life EV Li-Ion batteries generated annually between 2015 and 2040
While the three scenarios projected similar increase in EV battery waste flows in the U.S.
during the first five years of the analysis, results quickly diverge due to differences in input sales
and battery lifespans. As per the baseline, approximately 1.9 million LIB packs (each consisting
of many cells) could be entering the waste stream annually by year 2040. However, considering
the range from the most conservative to most extreme estimates, the waste stream could
hypothetically fall anywhere between 0.83 and 2.87 million LIB packs per year by 2040. The
cumulative baseline outflow of LIB packs between 2015 and 2040 (21 million packs) was
approximately two and a half times greater than the total number of EV battery packs calculated
in the “low” scenario (8.7 million packs) and about two times fewer than that of the “high”
scenario (40 million packs). Of these LIB packs, between 27-35% would be coming from all-
electric and plug-in hybrid electric vehicles, and the remaining 65-73% were estimated to be
from hybrid electric vehicles, reflecting the projected sales of each vehicle type.
The battery waste flows were differentiated based on the “Type 1” and “Type 2”
classifications of remaining life as described earlier (Table 2.2, also summarized in Figure 2.6
for the baseline). Characterization of EOL batteries into these categories provides some
indication of the volume of batteries with the highest potential for suitable reuse applications.
For instance, type 2 EOL batteries still hypothetically have remaining EOL life, making them
better suited for applications requiring high capacity. In each of the scenarios, Type 2 batteries

26
represent a sizeable fraction, and despite current hesitance surrounding reuse in vehicles, the
number of batteries expected suggests that “re-matching” Type 2 batteries with older vehicles or
some other form of cascading use should be studied further.
Scenario Percentage of Type
1 EOL batteries
Percentage of
Type 2 EOL
batteries
Low 57% 43%
Baseline 63% 37%
High 62% 38%
Table 2.2 Percentage of Type 1 and Type 2 EOL EV batteries accrued in the waste stream between 2015 and 2040
2.3.2 Lithium-ion cells and attendant material flows in the EV battery waste stream
The EOL EV batteries generated on an annual basis would contain hundreds or even
thousands of cells, each consisting of different metals, carbonaceous materials (carbon black and
graphite) and other miscellaneous materials such as organic carbonates, lithium salts, binder,
plastics, etc. Considering the parameters specified for the baseline scenario, approximately 3.3
billion individual lithium-ion cells may be entering the waste stream annually by 2040. By that
point, the cumulative outflows between years 2015 and 2040 would be on the order of 30 billion
cells requiring EOL management. The annual waste flows could be as low as 0.88 billion cells
(low scenario) or as high as 8 billion cells (high scenario) per year by 2040.
For the baseline scenario in year 2020, the LIB waste stream could contain approximately
3,400 metric tons of lithium-ion cells just from EV application, which is about 4 times the
estimated collection volume of waste LIBs from consumer electronics in 2012 (Wang et al.,
2014b). In terms of the resultant material flows, the range of scenarios indicate a total EV battery
waste stream between 0.33 to 4 million metric tons, with a baseline estimate of 1.3 million
metric tons generated cumulatively between 2015 and 2040. Figure 2.5 summarizes annual
outflows of battery materials on five-year increments over the long and short term future
(Extensive annual estimates of EOL EV LIB material outflows are provided in Appendix A,
section S6.3). In this initial estimate, the material-specific composition of that waste stream does
not vary, and is also summarized in Figure 2.5.
In comparison with the small body of recent literature on lithium demand for EVs, this
MFA predicted relatively conservative outflows, even for the “high” scenario. For instance,
Gaines and Nelson (2010) estimated a maximum waste flow of 20,000 metric tons of lithium in
2040 from “optimistic” EV deployment, a prediction about 10 times greater than our baseline

27
scenario estimates for that year. To put our estimates in a global context, this study forecast
cumulative lithium outflows between 2020 and 2040 between 4.5 thousand to 55 thousand metric
tons for the U.S. On a global basis, Gruber et al. (2011) estimated 860 thousand metric tons of
potentially recoverable lithium from EV batteries in the same time frame (with 100% recycling
participation and 100% lithium recovery).
Figure 2.5 Mass of Li-Ion cells in EV battery waste stream (In the pie-chart, “carbon” includes carbon black and
graphite. “Others” include plastics, binders, electrolytes and other non-metals like phosphorus etc.)
The disparity observed between the low and high scenario in this chapter is indicative of
the variability in estimates of EV sales, the battery lifespan (and resultant need for replacement
battery packs, particularly in the high scenario) as well as the parameters determining the number
of cells per EV battery pack. Even with these uncertainties, one can begin to analyze results
further, using the baseline scenario as a focal point (to minimize the amount of data presented in
the main text). The baseline scenario was further characterized on the basis of battery inputs,
outputs, and material characteristics. Figure 2.6 summarizes these characteristics for the
cumulative input of LIBs in electric vehicles between 2009 and 2034, and the net EOL battery
outflows between 2015 and 2040.

28
LIB input in new EVs
(18.5 million packs)
Replacement LIBs in old EVs
(4.5 million packs)
12 million
EV battery
packs
Type1: 840 thousand
metric tons
Type 2: 480 thousand
metric tons
High value-not
recycled: 10%
Currently
recycled:
42%
Low value-not
recycled: 48%
EV battery input: 2009-2034 Battery stock:
year 2034
EOL EV batteries:
2015-2040
Figure 2.6 EV battery material inflow and outflows-Baseline Scenario. Thickness of each bar corresponds to the
relative mass of material in each category.
The majority (80%) of new batteries entering use would be paired with new EVs sold in
the market, while the remaining 20% would be replacement batteries for existing in-use EVs
(Figure 2.7). About 63% of the batteries leaving use were “Type 1,” with no remaining life for
EV applications; while the remaining 37% “Type 2” batteries may have been discarded before
their true EV end-of-life. Previously shown materials analysis (Figure 2.5) distinguishes
different materials contained in the battery waste stream, but the ultimate fate of these materials
depends on whether an infrastructure and market exist for their recycling back into productive
use. The potential of each material to be recycled was determined by assessing current recycling
practices and secondary markets available for these materials (USGS 2012). Based on the
potential to be recycled, the materials expected in the EV battery waste stream were categorized
as currently recycled, high value-not recycled, and low value-not recycled materials.
Of the estimated battery outflows, low value materials, which are currently not being
recycled and are not expected to be in the future, could constitute 48% of the EV battery waste
stream and include constituents such as graphite, carbon black, lithium hexafluorophosphate
(LiPF6), organic carbonates (such as ethylene carbonate or dimethyl carbonate), binder
(polyvinylidene fluoride) and mixed plastics (polypropylene, polyethylene). Apart from plastics,
none of these materials have a secondary market at present and it would not be economically
viable to recover them from the waste stream. Moreover, as a mixed grade of plastics would be
29
present in the battery waste stream, their recovery would not be likely due to high contamination.
Because these materials are not suitable for recycling, infrastructure must be equipped to
accommodate their introduction to landfills or other disposal routes. As such, relevant
environmental and health impacts should be anticipated. The carbonaceous material present in
the EV battery waste stream could raise concern in the future owing to their large quantity in the
waste stream (Figure 2.5) and knowledge of potential health impacts of particulate carbon (e.g.,
exposure to graphite dust can adversely affect respiratory system and pulmonary function
(NIOSH, 2007)). The electrolyte chemicals present in LIBs can have toxicity concerns as well.
For instance, the electrolyte salt LiPF6 is a hygroscopic substance and in presence of moist air or
water forms hydrogen fluoride gas (Archuleta, 1995), which has severe environmental risks and
toxicity concerns (EPA, n.d.). Similarly, organic carbonates used as electrolyte solvents are
mildly toxic, volatile and flammable compounds, producing toxic fumes on decomposition
(Vimmerstedt et al., 1995). Environmental impacts of EV battery waste could also be a concern
due to the non-biodegradability of binder and other plastics in lithium-ion cells.
Another 42% of the materials in the cumulative EV battery waste stream would include
materials that are currently and expected to continue being recycled according to statistics from
the USGS (2012). This fraction includes metals such as aluminum (57,000 metric tons), cobalt
(52,000 metric tons), copper (75,000 metric tons), nickel (32,000 metric tons), steel (295,000
metric tons) and iron (43,300 metric tons). These material masses in waste stream are on a
cumulative basis estimated between years 2015 and 2040. The remaining 10% of the EV battery
waste stream would include two high value materials that are currently not recycled in the U.S.,
i.e., lithium (18,000 metric tons) and manganese (116,000 metric tons). Many of these metals
(lithium, aluminum, nickel and cobalt) have high embodied energy when extracted from virgin
resources (ecoinvent Centre, 2007). Hence, recycling of LIBs offers a dual benefit: avoided
energy inputs for production of primary metals and potential economic revenue from material
recovery, which is particularly high for cathode chemistries like Li2CO3 and NCM that contain
10-17% by weight of high-value cobalt.
2.3.3 Economic value of materials in EV battery waste stream
Considering the baseline scenario with a mix of lithium-ion cell chemistries, the total EV
LIB waste stream may contain materials valued at approximately 3.8 billion USD on a

30
cumulative basis between 2015 and 2040. This estimate is the maximum theoretical commodity
value of the EV battery waste stream considering the potential value for materials that currently
have recycling infrastructure in the U.S, and does not take into account material losses that
would occur due to recycling inefficiencies. The total possible waste stream value would be
increased by over 1.5 billion USD if Li and Mn are also included.
The actual economic value of the EV battery waste stream would depend on the LIB
collection rates, the recovery rates of the various materials present in the stream, and the cost of
recycling itself. Considering recent recycling efficiencies (see Appendix A, Table S10.1),
commodity value of approximately 3 billion USD could be obtained between 2015 and 2040 by
recovery of metals such as aluminum, copper, nickel, cobalt, iron and steel assuming that 100%
of batteries in the waste stream can be collected for recycling. Wang et al. (2014b) analyzed the
profitability of LIB recycling facilities for several possible future co-mingled LIB waste streams
based on the current recycling efficiency of materials in LIBs: the potential value from recycling
one metric ton of LIBs ranged from $860 for LiMn2O4 cathode batteries to $8,900 for LiCoO2
cathode batteries. Continued development of advanced separation processes could increase the
recycling efficiencies of materials present in EV LIBs and hence the economic motivation for
recovering materials from these batteries. For example, a 10% improvement over current
recycling efficiency for cobalt could raise the recycling revenue by 9% for cobalt based LIBs
while a 10% improvement in copper recycling efficiency would only improve revenue from LIB
recycling by 1% to 5%, depending on the cathode chemistry (Wang et al., 2014b).
The materials potentially recoverable by EV LIB recycling could be used as inputs to the
parent battery industry, as this sector is predicted to become more resource intensive as vehicle
deployment increases. Increasing availability of secondary material sources would reduce U.S.
dependency on foreign resources in the long run. Gaines and Nelson (2010) estimated that
recycling LIBs could meet almost 50% of the lithium required for battery production in the U.S.
by 2040. However, the recyclability of the EV battery waste stream and hence, the economic
gains from battery recycling is likely to depend on the battery technology prevalent in the future
in terms of cathode chemistry as well as the form factor of the lithium-ion cells used in these
batteries. At present there is significant uncertainty in this domain, which is analyzed in the
subsequent sections, along with the uncertainty due to differences in MFA parameters such as
EV sales, battery lifespan and number of cells per EV battery pack.

31
2.3.4 Uncertainty Analysis
EV sales and battery lifespan: It was established by the range of scenario results that the
volume of LIBs in the EV battery waste stream would be highly dependent on EV sales and the
actual battery lifespan. The sales of electric vehicles will depend on a number of factors in the
mid- and long-term, such as oil prices, battery and vehicle cost, EV and battery technology,
government subsidies, policies and regulations etc. (EIA, 2012). The lifespan of lithium-ion
batteries in EV application will depend on battery technology progress as well as usage patterns
at the consumer level. Long battery lifespans would have a two-fold benefit, first reducing the
need for a second (or even third) replacement battery and thereby reducing the cost of ownership
of electric vehicles, and second, raising the potential for post-EV battery reuse, which can also
defray costs across the battery life cycle.
Uncertainty analysis was performed to tease apart the role of sales and lifespan
parameters on LIB waste flows, by holding one parameter constant and varying the other
(Appendix A section S7.1). When the EV sales estimates are held constant at the baseline level,
cumulative (2015-2040) LIB outflows increased 16% or decreased 15% from the shortest
lifespan (“high” scenario) to the longest (“low” scenario). On the other hand, when the baseline
EV LIB lifespan distribution was combined with the high and low scenario EV sales figures,
cumulative (2015 to 2040) outflows of EOL packs could increase by as much as 62% and
decrease by 52%, respectively. It is evident that even though the battery lifespan distribution
plays a role in influencing the volume of EV battery waste stream, electric vehicle sales will be
the governing factor influencing EV LIB waste flows in the future.
When a longer EV lifespan of 16 years was tested for model sensitivity, the cumulative
(2015 to 2040) outflows of these batteries into the waste stream changed by less than 2%,
although the annual waste stream volumes varied, as shown in Appendix A, section S7.3.
Further, the percentage of Type 1 and Type 2 EV batteries also changed with increasing lifespan
of EVs. For instance, when a longer EV lifespan of 16 years was assumed for the baseline
scenario, the percentage of Type 2 EV batteries estimated to accrue in the waste stream between
2015 and 2040 reduced from 37% to 23% percent (Detailed analysis in Appendix A section
S7.3).

32
Cell and battery energy storage and battery pack components
The energy storage of the battery pack also plays an important role in determining the
amount of cells per pack, and thus the materials present in the EV battery waste stream. A
sensitivity analysis was conducted wherein the baseline cumulative outflow of EOL EV battery
packs was held constant while the estimated EV battery pack energy assumptions were varied
between the low and high scenarios (Appendix A, section S7.2). The resulting estimates of total
material mass of the EV battery waste stream decreased by up to 29% or increased by up to 40%
when the low or high scenario cells per pack assumptions were applied, as compared to baseline
flows.
Hence, it follows that battery and EV technology (in terms of electric miles and vehicle
mileage) would play a major role in governing flows of EV batteries in the waste stream.
Throughout the EV sales forecast timeline considered in the model (2009 to 2034), the same
battery chemistries were assumed and the energy storage by individual cells was held constant.
According to Srinivasan (2008), the energy density of lithium-ion batteries has been increasing at
the rate of approximately 5% per year over the last one and a half decade. The average energy
density of a typical 18650 cell is approximately 200 Wh/kg (Howard & Spotnitz, 2007).
According to Srinivasan and Lipp (2003), when lithium-ion batteries were introduced in the early
1990s, this number was around 90 Wh/kg. In other words, technological innovation has doubled
the energy density of these batteries. It is expected that this trend will continue in the future, with
ongoing research and development to introduce nano-materials and mixed-metal technology for
higher energy density (Ritchie & Howard, 2006; Howard & Spotnitz, 2007). As this technology
advances, fewer cells per pack and/or less material per cell may be achievable, which may
reduce total material flows to the EV battery waste stream.
The mass and composition of the EV battery waste stream modeled here has considered
only the cells within EV battery packs. For a typical Tesla Roadster EV battery, with 6,800 cells
weighing approximately 46 grams each, the total cell weight is about 313 kg, but the entire
battery mass is about 450 kg (Berdichevsky et al., 2006). The difference in weight is attributed to
the battery pack casing, module components, electronic parts, thermal insulation, etc. (Dunn et
al, 2012), which can account for anywhere between 10-30% of the EV battery weight.
Considering this entire battery system, the actual material flow entering the waste stream would
be even greater than estimates calculated here. However, including other EV battery pack

33
components would require further modeling, as these components may have much higher reuse
potential than the batteries themselves and may not enter the waste stream at the same time as the
LIB cells (Cready et al., 2003).
Battery chemistry and form factors
All results shown to this point have followed an assumed mixture of different cathode
chemistries, and are based only on 18650 (cylindrical) form factors. In the future, composition of
the EV battery waste stream will depend heavily on the actual cathode chemistries and form
factors selected by auto manufacturers. For example, new EV models such as the GM Volt and
Nissan Leaf employ prismatic cells, while the 18650 form factor continues to be used in the
Tesla roadster BEVs. Though this MFA model enables a reasonable approximation of the
material and economic flows of the EV battery waste stream, there is a need to assess the role
that a single dominant chemistry and prismatic form factor could play in determining the
volume, composition, economic value, and recycling potential of this waste stream. Using the
baseline scenario estimation for EOL LIB packs, the number of cells and material mass were
estimated for the following cases:
(A) Scenarios in which a single dominant lithium-ion cathode chemistry (18650 form-factor)
would be employed in all EV batteries. The four candidate chemistries were Li2CO3
(LCO), LiMn2O4 (LMO), LiFePO4 (LFP) and mixed metal (NCM), each modeled
individually as a dominant cathode chemistry.
(B) A scenario in which prismatic cells instead of 18650 cells were used. The chemistry mix
of EV battery waste stream was assumed to be same as in the 18650 scenario (10% LCO,
30% each of LMO, LFP and NCM cells), however here only the LCO cells were of
18650 form factor (consistent with adoption by some auto makers, like Tesla) while the
remaining 90% of the LIBs consisted of prismatic cells. See Appendix A for scenario
details.
When compared to the baseline EV LIB outflows (a mix of potential chemistries in
18650 cells), the number of lithium-ion cells in the waste stream was roughly the same for the
different dominant chemistry scenarios. The LFP scenario resulted in the highest number of
waste cells, approximately 35 billion, cumulatively between 2015 and 2040 (as compared to the
baseline 30 billion cells). When considering prismatic cells, results showed an interesting

34
dichotomy: the total number of cells in the EV battery waste stream would reduce drastically if
most EVs employed prismatic cells- to almost 4.4 billion cells in the waste stream between 2015
and 2040, but the net flow and type of materials into the waste stream would remain relatively
constant. This consistency held across all different scenarios of cathode chemistry and form
factor, which ranged between 1 and 1.5 million metric tons of battery waste on a cumulative
basis between 2015 and 2040 (Figure 2.7). Further, the recyclability of the EV battery waste
stream would also vary with the battery chemistry and form factor (Figure 2.7). For instance, if
the LiMn2O4 chemistry is predominantly used, then the EV battery waste stream would contain
negligible amount of currently recyclable materials and large quantities of low value materials
that are not recycled. However, its recycling can generate value if the currently non-recycled
high value materials like lithium and manganese can be recovered (Figure 2.8). Similarly, even
though both the form factor scenarios (Chemistry mix “Base Case” and 90% prismatic) consisted
of the same distribution of LIBs belonging to the four cathode chemistries in the waste stream,
the fraction of recyclable materials is slightly higher in the case of cylindrical cells, which
require more metallic casing components (typically aluminum or steel).
Figure 2.7 Recyclability of EV battery waste stream under different scenarios of Li-Ion cell cathode chemistry and
form factor (cumulative flows from 2015 to 2040)
An important caveat to these findings is that the high percentage by weight of recycled
materials in the EV battery waste stream may not translate into high economic gains from LIB

35
recycling. For instance, even though 58% of a LiFePO4 cell waste stream consists of currently
recycled materials, the relative economic value of this stream is lower than any other chemistry
(Figure 2.8). While the relative volumes of recycled materials are higher in the case of all
cylindrical cells, as compared to the prismatic form, there is no significant difference in the total
commodity value of materials in the waste stream associated with these two scenarios.
In fact, the economic feasibility of EV lithium-ion battery recycling in the future would
not only depend on collection and recycling efficiencies, but also on the chemistries selected for
EV battery manufacturing and ultimately ending up in the waste stream. A large scale use of
LCO and NCM chemistries for EV batteries would translate into high economic values of the EV
battery waste. In the LCO and NCM chemistry scenarios, currently recycled materials would
constitute about 50% of the materials in the battery waste stream by mass, but could account for
86% of the economic value of that stream. However, as battery manufacturers shift to cheaper
chemistries such as LMO and LFP, to improve performance and avoid high cost and scarcity of
cobalt resources (Nishi, 2001), the resulting value of the currently recycled portion of the waste
stream could be reduced to as low as 340 million USD, on a cumulative basis (2015-2040).
Figure 2.8 Cumulative material value of EV battery waste stream (2015-2040)
Cost efficient recycling procedures for the recovery of high value materials, like lithium
and manganese, which are currently not recycled in the U.S. would add some incentive towards
recycling of economically unattractive LIB chemistries. In the LMO chemistry scenario,
0
1
2
3
4
5
6
7
8
9
10
11
Chemistry
Mix (Base
Case)
LiMn2O4 LiFePO4 LiCoO2 Mixed
metal
(NCM)
Chemistry
Mix (90%
prismatic)
U.S
. d
oll
ars
(B
illi
on
)
Currently Recycled High Value-Not Recycled

36
currently non-recycled high value materials constitute 22% of the waste flows by mass, but
account for 87% by value. Even more extreme, in the LFP battery chemistry scenario, the
currently non-recycled high value materials accounted for only 1% of the waste EV battery cells
by mass, but could make up to 38% of the total material value. Although Wang et al. (2014b)
conclude that for a LIB recycling facility to be profitable, the proportion of LiCoO2 cathode
batteries in the waste stream needs to be 21%, improved recycling processes in the future is
expected to improve the overall profitability of recycling EOL LIBs.
2.4 Conclusions
It is clear that EV batteries will emerge as a future waste management challenge, with
projected annual waste flows reaching as high as 340,000 metric tons by 2040. Because of the
high volume, complexity and variety of materials forecast in the EV battery waste stream, it is
evident that multiple waste management routes must be developed for EOL LIBs from electric
vehicles:
1) reuse avenues for battery cells and packs with remaining life,
2) recycling infrastructure capable of recovering high value material from multiple battery
chemistries, and
3) safe disposal routes for materials with minimal or no secondary value or recovery
infrastructure.
Results also indicate that high variability in the potential economic value associated with
the projected LIB waste stream may pose challenges for development of recycling infrastructure.
At present, profit from LIB recycling is constrained by high collection and processing costs
(Wang et al., 2014b). Currently, there is no federal regulation that mandates LIB recycling, and
only two states - California and New York - have passed regulations banning landfill of these
batteries. To overcome potential economic constraints of LIB recycling, particularly for less
valuable, non-cobalt chemistries, the recovery process and infrastructure may require policy
intervention to reach economies of scale.
Apart from economics, environmental health and safety may also motivate policy
attention to future EOL LIB management. The absence of consistent infrastructure and
regulations for lithium-ion battery recycling may increase the potential risk of environmental
impact due to EOL EV batteries. Though the state of California classifies them as hazardous due

37
to the presence of cobalt, LIB wastes are included under EPA’s Universal Waste Rule (Gaines
and Cuenca, 2000) and are in general not considered to be hazardous for the environment due to
absence of toxic elements like lead, mercury or cadmium. However, landfill of EV LIBs may
introduce environmental risks due to leakage of organic electrolytes, presence of heavy metals
such as copper and nickel (Shin et al., 2005), reactive lithium salts, and large quantity of
carbonaceous materials (graphite and carbon black).
A number of uncertainties still exist, and exact estimation of future waste flows will
depend on the ability to further refine the forecasts of EV sales, battery and EV lifespan, and
trajectories of battery technology deployment. Waiting until such refinements are possible,
though, presents a risk of not allowing sufficient time for domestic infrastructure and policies to
react to the emergence of a full scale battery waste stream. Thus, proactive advancement of a
robust EOL battery reuse, recycling, and disposal system will be required to handle the variety
and volume of materials expected. Moreover, the MFA model provided here can be adapted to
extend the analysis of LIB wastes as more definitive data become available.

38
CHAPTER 3: ENVIRONMENTAL TRADE-OFFS ACROSS CASCADING LITHIUM-
ION BATTERY LIFE CYCLES
3.1 Introduction
While electric vehicles have the potential to reduce greenhouse gas emissions from the
transport sector, a major obstacle towards their large scale adoption has been the high cost of
lithium-ion batteries (Axsen et al., 2010). Recent literature and technical analysis estimate that at
the end of their service life in EVs, LIBs would still have 80% of their original capacity intact
(Hoffart, 2008; Cready et al., 2003; Neubauer & Pesaran; 2011; Marano et al., 2009). Though
insufficient for automotive application, they can be reused in stationary applications which have
a much lower capacity limit and hence, are less demanding applications (Hein et al., 2012). As
indicated from the results in Chapter 2, as high as 43% of the future EV LIB waste stream can
have reuse capability in stationary use, hence immense potential exists in utilizing these battery
systems for small and large scale stationary energy storage applications. This cascaded reuse of
EV LIBs would enable original equipment manufacturers (OEMs) to distribute the high initial
cost of the EV battery over two lifespans. Several studies confirm the economic feasibility of EV
LIB reuse for stationary energy storage applications like intermittent renewable storage, grid
support, and power back-up (Heymans et al., 2014, Williams and Lipman, 2010; Neubauer et al.,
2012; Neubauer & Pesaran; 2011; Cready et al., 2003, Beer et al., 2012, Narula et al., 2011 etc.).
As a result, stakeholders in both the EV and the utility sectors have interest in pursuing EV
battery reuse.
In the EV sector, successful battery reuse applications can potentially reduce the net life
cycle costs of EV and LIB systems, and by extension, the battery cost borne by EV customers,
thus impacting consumer purchase decisions and battery usage patterns (Neubauer et al., 2012;
Williams and Lipman, 2010). Opening new reuse pathways may also mitigate rising disposal and
compliance concerns over the growing battery waste stream as forecasted in Chapter 2 (Richa et
al. 2014). For example, California and New York state legislators have issued disposal bans on
rechargeable batteries (including but not limited to LIBs) in their states (CA Code, 2006; New
York State Rechargeable Battery Law, 2010) restricting their disposal as solid wastes. As a
result, OEMs now face disposal costs for these cells. Although these costs can be offset by
recycling revenue, the materials contained in EV LIBs have been evolving towards less-

39
expensive cathode chemistries, which is expected to reduce the overall economic incentive for
recycling under current conditions (Wang et al., 2014a; Wang et al., 2014b).
Similarly, studies suggest that reuse of EV LIBs in stationary applications would provide
cost-efficient services to the stationary energy storage markets, improve utility operation and
provide a low-cost revenue source for this sector (William and Lipman, 2010; Beer et al., 2012).
Battery energy storage has a considerable demand for grid as well as off-grid applications. These
applications range from power backup, load following, renewable firming, peak shaving, energy
arbitrage, etc. (Cready et al., 2003; Albright et al., 2012; Soloveichik, 2011). Over the years, a
range of battery technologies have been tested as well as applied for these utility applications.
These applications can be broadly categorized into two (Doughty et al., 2010):
(a) Energy applications that involve long charging sessions, followed by discharging the
battery over several hours. Typically, such application would require a single charge-
discharge cycle of the battery in a day.
(b) Power based applications that involve short charging periods and discharges of few
seconds to minutes. Such applications may require the battery to be charged or
discharged several times a day.
The major criteria for selecting battery systems for these utility applications have been
costs, reliability, performance, and battery design. While a range of battery technologies have
been developed and tested for utility sector applications, only few such as lead acid (PbA),
nickel-cadmium, sodium-sulfur, and vanadium-redox flow batteries have been commercially
adopted due to their favorable cost and reliability factors (Doughty et al., 2010). However,
among these technologies, PbA batteries (both flooded and valve regulated) are the most widely
used for different types of energy storage applications (Soloveichik, 2011). In future, cascaded
use of retired EV LIBs in such applications can prove to be competitive with PbA battery
technology.
According to Beer et al. (2012), retired EV LIBs are expected to have higher capacity and
cycle life expectancy than incumbent PbA batteries in stationary applications. This may not hold
true in all cases, as the reuse potential of LIBs would depend on the battery itself, particularly the
cathode chemistry (Burke, 2009) and its condition post-EV use, which can be highly variable
depending on vehicle usage cycles and temperature conditions to which LIBs are subjected
during EV use (Cready et al., 2003). Currently, the remaining and degrading capacity and the

40
declining efficiency of used batteries in secondary application are relatively unknown (Ahmadi
et al., 2014b). If refurbished EV batteries provide a considerably low level of functionality or
service life, the probability of the cascading reuse route may decrease.
In addition to these economic incentives, environmental benefits could also be realized
due to cascading reuse of EV batteries in secondary applications. By extending EV battery
lifespan through reuse, LIB and EV producers can conceivably reduce the net environmental
impact of the battery pack attributed to the EV itself. Similarly, by utilizing used vehicle
batteries, energy utility providers can avoid the impacts associated with producing and using a
new PbA battery. The degree of benefit would, however, depend on the reliability of reused EV
batteries, which will ultimately impact the reuse decision by stakeholders, as well as
methodological choices in the approach to allocating battery impacts between the first and
second lives. To obtain a better understanding of the feasibility issues of EV LIB reuse, life cycle
assessment (LCA) can be applied to estimate such environmental tradeoffs relevant to each
stakeholder’s perspective across a wide variety of technical and methodological parameters.
Several LCA studies have analyzed environmental impacts of LIBs as part of a broader
effort to understand tradeoffs in the EV life cycle (Majeau-Bettez et al., 2011; Notter et al.,
2010; Zackrisson et al., 2010; Samaras and Meisterling, 2008; Ishihara et al., 2002; Hawkins et
al., 2013; Matheys et al., 2009, Ellingsen et al., 2013). These studies are primarily restricted to
the production and use phase of LIBs. Due to a lack of publicly available and transparent data,
only in rare cases has recycling of EV LIBs for constituent metals been considered to be part of
the LCA scope (e.g. Ishihara et al., 2002; Matheys et al., 2009; Dunn et al., 2012). Considering
that battery reuse post-EV application could be a common practice in future (Howell, 2012), it is
essential to include a consideration of secondary usage in LCA studies to provide a more
comprehensive understanding of battery and EV environmental impacts.
A few recent LCA studies by Ahmadi et al. (2014a), Cicconi et al. (2012) and
Genikomsakis et al. (2013) demonstrated a net reduction in CO2 emissions can be achieved by
reusing EV LIBs, particularly due to their utility for smart grid or renewable energy applications
and the attendant reduction of fossil fuel use. Building upon these LCAs, this study analyzes the
environmental performance of post-EV LIBs against basic feasibility criteria for reuse (e.g.
battery lifespan in secondary application), thus attempting to provide an enhanced perspective of
environmental implications of battery reuse. Given the interrelated objectives of both the EV and

41
the utility sectors, this LCA was framed in dual ways to address both perspectives individually,
so as to avoid double counting the potential benefits or impacts and to provide scenario-specific
findings relevant to decisions being made within each sector:
1. From the perspective of EV and LIB producers, to what extent can the addition of a
secondary reuse application minimize the net environmental impacts across the battery
life cycle (the “extended life cycle” case)?
2. From the perspective of the utility, how does the environmental impact of a post-EV, used
LIB compare to that of a new PbA battery, particularly given unknowns in reliability of
used LIB (the “stationary energy storage” case)?
To address these questions with LCA requires concurrent resolution of the
methodological challenges surrounding allocation of environmental impacts of LIB production
and end-of-life (EOL) management between EV and stationary use battery. While this challenge
can be avoided for the first case by system expansion to account for the avoided PbA system, a
direct comparison of cascaded LIBs to incumbent PbA batteries requires allocation choices for
upstream LIB impacts. The EV and stationary use battery life cycles together represent a
“cascaded use multi-functional system” where LIB cells and module components are passed on
from EV application to stationary application, and as such part of the environmental burdens
from the upstream can be considered to be transferred to the downstream battery system in the
cascade thus creating a need to allocate impacts of a set of common activities to the stationary
energy storage system. These allocation decisions are further complicated by system attributes,
such as the change in function and use of the battery between life cycles, the lack of an organized
recycling network for EV LIBs (Hoyer, 2011), and the immense uncertainty surrounding the
roles and business models to be adopted by each stakeholder group in EV LIB recycling (Idjis et
al., 2013).
The focus of most studies dealing with allocation problem in LCA of multi-functional
systems has been material cascades or “open-loop recycling” of materials (e.g. Ekvall and
Tillman, 1997; Azapagic and Clift, 1999; Boguski et al., 1994; Klöpffer et al., 1996; Kim et al.,
1997; Newell and Field, 1999; Rydberg, 1995, etc.).Very few studies have explored allocation in
LCA of product cascaded reuse, such as Werner et al. (2007) and Streicher-Porte et al. (2009).
The choice of allocation methodology employed can have a decisive impact on results of LCA

42
studies (Rydberg, 1995; 1998; Streicher-Porte et al., 2009). Therefore, one additional objective
of this study is to determine the extent to which allocation choices across the product cascade
influence the decisions resulting from analysis of the two cases.
3.2 Method
While much of the modeling and data analysis is the same for the two cases analyzed,
each is described independently here, and points of methodological divergence are highlighted.
To reflect the two stakeholder perspectives, two goals and scopes were specified to analyze
environmental issues surrounding cascading reuse for 1) the EV sector (to analyze environmental
implications of extending the life of an EV LIB pack with a cascading second use phase), and 2)
the utility sector (to compare the environmental impacts of a stationary energy storage system
based on refurbished EV LIBs with an equivalent PbA battery based system). The two goals are
described in turn.
3.2.1 Goal 1: To analyze environmental implications of extending the life of an EV LIB
pack with a cascading second use phase:
For the first objective, an extended life cycle model has been adopted, wherein all stages
in the life cycle of an EV battery are taken into consideration (Fig. 3.1). The primary objective is
to determine if, from the perspective of the OEM, cascading reuse of the LIB can create a
significant reduction in the net EV LIB life cycle environmental impacts. Here, the system is
expanded to include the “avoided product system” for a PbA battery that would provide
equivalent functionality in the energy storage system. The PbA battery is modeled here as the
avoided system because it is a widely used incumbent technology for stationary and industrial
purposes due to its affordability (Soloveichik, 2011).
Functional unit - Case 1: The functional unit for this system is a 24 kWh lithium manganese
oxide (LiMn2O4 ) battery pack for a battery EV (BEV) weighing 223 kg and giving 100,000
miles operation during the EV lifetime; the cells from which are subsequently used in stationary
energy storage. This mileage corresponds to an 8 year service life, based on similar warranty
terms for the Nissan Leaf BEV battery (Nissan North America, Inc., 2014). The choice of
LiMn2O4 cathode chemistry was due to its current use in Nissan Leaf and GM Volt cars (Lu et

43
al., 2013), which are the largest selling all-electric and plug-in hybrid electric vehicles,
respectively in the United States (Inside EVs, 2015). While there is no common consensus as to
which LIB chemistry would dominate the future EV market, several studies have suggested that
owing to high cost and safety concerns of cobalt batteries, EV manufacturers could replace
cobalt based LIBs with less expensive technologies (Ritchie and Howard, 2006; Wang et al.,
2014b; Nishi, 2001). LiMn2O4 cathode chemistry is one of the likely candidates due to low cost
and high availability of manganese (Wellbeloved et al., 1990). The EV battery pack was
modeled using the Argonne National Laboratory [ANL] BatPac model (ANL, 2011) by drawing
parallels with the existing design of a Nissan Leaf battery pack (Blanco, 2010) as the reference
for a BEV battery pack design, which was comprised of 192 prismatic form factor cells grouped
into 48 modules.
System boundary- Case 1: The system modeled includes LIB production, LIB use during the
EV life, battery refurbishment, secondary use in stationary energy storage, recycling of batteries,
as well as the avoided life cycle of a PbA battery system for stationary energy storage (Fig. 3.1).
In this case, allocation has been avoided, by system expansion to include the eliminated demand
for a PbA battery.
Figure 3.1 System boundary to assess environmental implications of EV LIB with a cascading second use phase in
its life cycle (case 1: extended life cycle). The dotted lines represent the extended system boundary that provides

44
credits for avoiding the life cycle of an equivalent functionality PbA battery. This system corresponds to results
shown in Figs. 3.3 and 3.4
3.2.2 Goal 2: To compare the environmental impacts of a stationary energy storage system
based on refurbished EV LIBs with an equivalent PbA battery based system.
For the second objective of this LCA, the refurbished EV LIB based energy storage
system is considered independently, from the perspective of a utility operator facing the choice
of either using a refurbished LIB or a new PbA battery system. Thus, an equivalent functionality
PbA battery based stationary energy storage system is used as a basis for comparison.
Functional Unit - Case 2: The functional unit for this goal is defined as a stationary energy
storage system, delivering 150 kWh of energy on a daily basis for 20 years. This definition is
based on a similar assumption by Rydh (1999) for a battery system providing electricity
requirements for several remote houses for 10–70 persons. To translate this functional unit into a
specific battery case, the expected depth of discharge (DoD) (the percentage of the battery
capacity that is discharged while delivering energy) was taken into account. DOD is restricted to
preserve battery life, minimize capacity fade, and ensure safe operation (Axsen et al., 2008,
Peterson et al. 2010). For stationary battery operation, DoD is assumed to be between 33-42%,
which is capable of providing a 5-year lifespan for PbA battery (Rydh and Sanden, 2005;
Bindner et al., 2005), while representing a safe operating range for second use LIBs. This DoD
assumption results in an extreme sizing scenario wherein both stationary battery systems are
sized equally at 450 kWh while delivering only a fraction of stored energy, i.e. 150 kWh (Rydh,
1999; Rydh and Sanden, 2005) (See Appendix B, section S4). For a refurbished LIB-based
system, meeting this functional unit would call for 4,500 post-EV cells with a combined energy
storage capacity of about 450 kWh. Such a system would weigh 4,446 kg, as compared to a PbA
system with equivalent functionality but higher weight (13,044 kg), due to the lower energy
density provided by PbA batteries (Rydh and Sanden, 2005; Matheys et al., 2009).
System boundary - Case 2: For the PbA battery system, the life cycle stages considered were
battery production, stationary application (i.e. charge discharge losses) and battery recycling.
For the cascaded EV LIB stationary storage system, life cycle stages included were LIB
production, battery refurbishment, secondary use and LIB recycling. If a utility is making a

45
direct comparison between a used LIB and a new PbA battery, then allocation is necessary to
partition impacts of the initial LIB manufacturing (P1) and EOL management stages (E1 and E2)
between the first and second (cascaded) lives since these activities are common to both the
battery uses. Fig. 3.2 illustrates the analyzed life cycle stages of EV LIB with an extended use in
stationary application, with a demarcation of stages for which environmental impact allocation is
required.
(a) (b)
Figure 3.2 System boundary to compare environmental implications of battery choice for stationary energy storage
(case 2). System (a) shows the allocation of upstream EV LIB production and subsequent EOL management impacts
to the stationary energy storage system. System (b) shows the stages considered for the incumbent PbA system.
These systems correspond to results shown in Figs. 3.5, 3.6, and 3.7
3.2.3 Life Cycle Inventory and Life Cycle Impact Assessment
All battery material production, processing and use phase stages were modeled in
SimaPro LCA software using the ecoinvent database version 2.2 (ecoinvent Centre, 2010). U.S.
based electricity grid mix was used for electricity input data. The environmental impacts
considered were Cumulative Energy Demand (CED) and Global Warming Potential (GWP). For
CED calculation, characterization factors and primary energy sources provided in SimaPro

46
software CED calculation methodology were used. For the estimation of GWP, all emissions
contributing to GWP were considered and IPCC 100 year GWP impact factors were used. LCI
data were obtained from a variety of sources including LCI databases, lab-scale tests, technical
literature and previous LCA studies, as described below for each life cycle stage analyzed, with
additional information provided in the Appendix B.
EV LIB production: The approach for modeling LIB production is process-based, similar to
methodology employed by Dunn et al. (2012), U.S. EPA (2012) and Notter et al. (2010). This
stage includes the manufacture of various EV LIB components such as the LiMn2O4 cathode,
graphite anode, plastic separator, electrolyte salt (Lithium hexafluorophosphate [LiPF6]),
electrolyte solvent (Ethylene Carbonate), and battery management system (BMS) as well as
processes involved in assembly of the cells and battery pack. (See also Section S.1 in the
Appendix B).
EV battery use: The EV use phase of the LIB was modeled as the electricity lost due to battery
efficiency over the lifetime of the EV and the additional energy needed to carry the weight of the
battery, based on approaches adopted in previous studies (Van den Bossche et al., 2006;
Zackrisson et al., 2010). At the beginning of life of EV LIB, a roundtrip efficiency of 95% has
been assumed based on advanced vehicle tests for the Nissan Leaf battery (Garetson, 2013)
which gradually reduces to 80% at battery EOL in EVs, which is defined as the point at which
battery capacity fades to 80% (Ahmadi et al., 2014b). In addition to electricity consumption, the
use phase also includes transport of the battery from the manufacturer to the car assembly site.
(See also Section S.2 in the Appendix B)
EV LIB refurbishment: This stage includes the transport of EV LIBs to a refurbishment
facility, testing of LIB cells to assess electrical performance for feasibility in stationary
application, and repackaging cells into stationary battery modules (Cready et al., 2003). Apart
from cells, some module components are assumed to be reused while additional components are
added during refurbishment, such as copper connectors, battery cabinet and a new BMS (See
also Section S.3 in Appendix B).

47
Stationary battery use: This stage includes transport of the battery (refurbished EV LIB or a
new PbA battery) to the site of stationary usage as well as charge discharge electricity losses due
to battery efficiency during operation. Capacity fade with aging and the corresponding energy
efficiency fade for the refurbished EV LIB based energy storage system has been modeled
similar to Ahmadi et al. (2014b). For the PbA battery, a direct correlation between increase in
battery internal resistance and increase in efficiency losses with aging is considered (See also
Section S.4 in Appendix B).
LIB EOL management: The recycling of cells and module components from an EV battery
pack occurs at two stages. First, recycling may be required for any rejected cells coming out of
EV use that are deemed unsuitable for stationary application. At the same time, many EV LIB
pack components such as the battery jacket and BMS would be separated and recycled during
refurbishment. Second, once batteries reach their final EOL after stationary use, all cells and
additional components added to the stationary battery during refurbishment (e.g. BMS, copper
connectors) would be recycled. Non-recyclable materials such as mixed plastics, graphite,
electrolyte, binders etc. are considered to be sent to the landfill as indicated in Chapter 2 (Richa
et al., 2014). Recycling impacts and recovery is modeled assuming a mix of hydrometallurgical
and pyrometallurgical processing (Mudgal et al., 2011), with credit provided for avoiding the
production of primary material based on calculated recovery potential. (See S.5 in Appendix B)
PbA battery production: The material composition of the PbA battery was estimated from
Rydh (1999), Rantik (1999) and Sullivan and Gaines (2012). This included lead inputs (for
active material, grid, and poles), electrolyte, plastic cases and covers, glass separator and copper
connectors. A 47:53 mix of recycled and virgin lead was employed (Hittman Associates, 1980;
Sullivan and Gaines, 2012). Energy inputs for PbA battery manufacturing was obtained from
Hittman Associates (1980). (See also Section S.6 in the Appendix B).
PbA battery recycling: A smelter based process for secondary lead production was modeled
(ecoinvent Centre, 2010; Fisher et al., 2006) and recycling credit was provided for avoiding the
production of virgin lead, according to the initial fraction of lead from primary and secondary
sources specified for PbA battery production.

48
3.2.4 Sensitivity Analysis
The LCA model is sensitive to choices made when defining model assumptions and
specifying technical parameters in battery reuse. These parameters are characterized with a high-
degree of uncertainty, as the feasibility of reuse is still an emerging area of research and
application. To capture likely areas of uncertainty, key technical parameters are explored further,
which are selected on potential performance constraints of second use LIBs (Cready et al., 2003),
variability in PbA battery types available in the market, and data availability. The three variables
meeting these criteria are described below. Other parameters, like degradation of LIB efficiency
over time and in different applications, are clearly important factors in comparison to new PbA
cells, but are outside the scope of this study, as technical studies have not yet generated sufficient
data to fully characterize sensitivity in LCA.
Cell conversion rate (F) represents the percentage of EV LIB cells that can feasibly be
repurposed for stationary application. The failure to convert cells between life cycles, (thus
leading to EV LIB cells being “rejected” for stationary use) may be due to either conditions
during the EV life cycle (temperature, driving patterns, charging frequency) or to specific
conditions that must be met (capacity) for use in stationary energy storage systems (Cready et al.,
2003; Neubauer et al., 2012). To reflect the importance of the parameter F and to capture the
high degree of uncertainty around its value under different operating conditions, a wide range of
values (between 10-100%) for F was analyzed. The baseline model considered a mid-range
scenario of 50% F value (Table 3.1), which falls between the extremes of either the entire battery
pack being rejected or being viable.
In the extended life cycle case, F would determine the size of the stationary battery
system resulting from a single EV battery. For the stationary energy storage case, F would
determine the number of EV LIB cells required to build a single stationary battery with
equivalent functionality to the PbA alternative.
Refurbished LIB lifespan represents the calendar years after which refurbished EV LIB cells
fail to meet specific performance criteria in stationary application. Typically, how often the
battery is charged would depend on the stationary application and the demand for battery stored

49
energy (Cready et al., 2003). Similar to previous studies (Ahmadi et al., 2014a; Ahmadi et al.,
2014b; Rydh and Sanden, 2005), a single daily charge-discharge cycle over the battery lifespan
has been assumed to demonstrate a generic example of battery operation. Recent studies have
assumed a lifespan of refurbished EV LIBs in stationary application ranging from 1 to 10 years
(Ahmadi et al, 2014a; Cicconi et al., 2012; Beer et al., 2012; Cready et al., 2003; Narula et al.,
2011). Hence, this parameter has been varied across the same scale, resulting in a cycle life of
365 (1 year lifespan) to 3650 (10 year lifespan) charge-discharge cycles. This range should
capture the wide variability expected due to vehicle use patterns and climate extremes during the
automobile use phase of the LIB. The lifespan of PbA battery is considered to be 5 years in all
scenarios based on the DoD range (Rydh and Sanden, 2005; Bindner et al., 2005). In the
extended life cycle case, the lifespan determines the total number of refurbished LIB based
systems that can replace a corresponding number of equivalent functionality 5 year lifespan PbA
batteries. For the stationary energy storage system case, the lifespan parameter determines the
number of system replacements needed to provide the 20 year use specified by the functional
unit.
PbA battery efficiency is usually between 70% and 85% (Rydh and Sanden, 2005; Matheys et
al., 2009; Matheys and Autenboer, 2005; Albright et al., 2012; Parker, 2001; Celik et al., 2008;
Rydh, 1999), depending on battery type and manufacturer. This range determines the low and
high efficiency of PbA batteries with a mid-range baseline efficiency of 77.5%. This parameter
determines the relative energy used or lost during use of the stationary energy system. Similar to
LIBs, the PbA battery efficiency is also modeled to decline gradually with aging as explained in
the Appendix B (Section S4).
Apart from these parametric variations, the comparison among LCA allocation methods
provides for an assessment of sensitivity to methodological choices (specific to Case 2) which is
described in the next section. The parameters used for sensitivity analysis based on these criteria,
indicating best to worst scenarios for EV LIB reuse are provided in Table 3.1.

50
Table 3.1: Parameters varied for sensitivity analysis Sensitivity
criteria Values/Methods
Best Case
Scenario
Base Case
Scenario
Worst Case
Scenario Case applicable to
Cell conversion
rate 10% to 100% 100% 50% 10%
Extended life cycle (Case
1), Stationary energy
storage (Case 2)
Refurbished
LIB lifespan 1 to 10 years 10 years 5 years 1 year
Extended life cycle,
Stationary energy storage
PbA battery
efficiency 70% to 85% 70% 77.5% 85% Stationary energy storage
a
Allocation 50/50, Quality-
based; Cut-off Cut-off Cut-off 50/50 Stationary energy storage
a For the extended life cycle (case 1), the baseline PbA efficiency (77.5 %) is applied in all scenarios
3.2.5 Allocation
The cascading reuse of refurbished EV battery has been considered similar to open-loop
recycling, which is a special case of a multi-functional system (ISO, 2006). In open-loop
recycling, the material under consideration is recovered for use in a different product than the
one from which it is recycled. Similarly, in the case of cascading reuse, the product (the EV
battery) is reused in an application that has a different function and use than the first life cycle.
Here, the need for allocation specific to an “open-loop product cascade” – a concept not yet fully
explored in LCA – is based on existing open-loop recycling allocation procedures (quality
based, cut-off, and 50/50; Ekvall and Tillman, 1997), but with case-specific modifications. For
allocating impacts of EV LIB production and EOL management to the stationary battery, only
those components that were considered for reuse (i.e. EV LIB cells and module components)
were accounted for and life cycle impacts of any components rejected or recycled during LIB
refurbishment (BMS, battery jacket) were not allocated to the stationary battery. In this section,
the following nomenclature is applied:
Ibs = Environmental impacts of EV LIB cell and module production and EOL management
that are allocated to stationary energy storage system
Ie,v1 = Environmental impacts of EOL management of EV LIB cells and module
components not used in stationary battery (v1)
Ie,v2 = Environmental impacts of EOL management of EV LIB cells and module
components used in stationary battery (v2)

51
Ipn,v = Environmental impacts of producing all EV LIB cells and module components, (v =
v1+v2)
The overall environmental burden of the refurbished EV LIB based stationary energy
storage system would include the allocated environmental impacts due to EV LIB cells and
modules production and EOL management (Ibs), EV battery refurbishment, efficiency losses due
to use phase and EOL management of additional stationary battery components added during
refurbishment. Different allocation approaches for determining Ibs are explained:
a) Quality based allocation: This approach is usually based on physical qualities such as
material mass, purity, and energy content or economic attributes of the virgin and recycled
material in the case of open-loop recycling (Knoepfel, 1994; Ekvall and Tillman, 1997; Kim et
al., 1997; Nicholson et al., 2009; Borg et al., 2001; Guinee et al., 2004, etc). In the case of EV
LIB reuse, the cogent properties are associated with the battery’s chemical and physical
properties (e.g., energy storage capacity), which determine the extent to which the used LIB can
meet the functional demands of secondary energy storage. The market price in the two life cycles
also reflects the value of refurbished stationary LIB relative to the EV LIBs. The environmental
burden for production of EV LIB pack components (Ipn,v) that are considered for reuse (i.e. cells
and module components) is clearly shared to some degree by both battery systems. While the
impacts of some EOL processes (Ie,v1) occur prior to the construction of the stationary battery,
they are the result of some EV LIB cells and module components being rejected for stationary
use, and thus the stationary system bears some part of this burden (or incentive in the case of
recycling credits). It is possible that the utility sector would be responsible for some part of this
EOL management, especially if the infeasibility of the cells for stationary use is detected towards
the final stages of testing and not in a preliminary analysis in a battery collection center. The
second aspect of LIB EOL is associated with the waste management of EV LIB components
used in both the initial and cascaded life cycles. Hence, the environmental impacts associated
with these life cycle stages, Ie,v2 would be shared between the two battery systems. Based on
these arguments, the two quality based allocation approaches are described:
Energy storage based allocation: As LIB cells are passed on from their first to second life, there
is also an “export” of energy storage capacity from the more demanding EV application to the

52
stationary energy storage application. Using energy-based allocation to partition environmental
impacts between the two battery systems provides a reasonable basis for allocation since it gives
a clear indication of this “function transfer.” The energy storage of the stationary battery (Es) is
450 kWh based on the functional unit for case 2. The energy storage (Eev) of the EV battery
system was determined by the number of EV LIBs required to build a single stationary battery,
accounting for any fraction of LIB cells that were rejected for reuse. The factor (Es/(Es+Eev))
represents the energy storage quality of the stationary battery system with respect to the overall
quality of the multifunctional system. Based on this factor and the quality based allocation
methodology suggested by Ekvall and Tillman (1997), environmental impact, Ibs, allocated to the
stationary battery due to EV LIB cells and modules production and EOL management would be:
bsI 2,1,v, vevepn
evs
s IIIEE
E
(1)
Market price based allocation: The use of market price for new and refurbished LIBs in terms of
$/kWh combines considerations of the energy storage function and the market price of the
battery. This allocation is useful for both stakeholder groups, since it reflects the functional
quality of the LIB within a techno-economic system comprising the EV and utility sectors. The
price of a retired EV LIB would not be reduced by the same percentage as its capacity fade post-
EV application. For this study, the selling price of refurbished EV LIB was considered to be 30%
of future new EV LIB cost in terms of $/kWh based on Neubauer et al. (2012).
Vev is defined as the initial value of the EV battery system comprising of multiple LIB
packs and is calculated as the product of energy storage capacity of EV battery system (i.e. Eev )
and the price in $/kWh for a new EV LIB pack. Vs is the market value of the stationary battery
and is defined as the product of energy storage capacity of stationary energy storage system (Es)
and the price in $/kWh for a refurbished EV LIB. The factor Vs/Vev represents the market value
of the stationary battery system with respect to the market value of multiple LIBs that constituted
the EV battery system. Similar LCA allocation methodology based on economic value or quality
reduction parameters has been suggested in prior studies (Werner et al., 2007; Borg et al., 2001;
Karlsson, 1994, etc.). In this approach, Ibs would be:
bsI 2,1,v, vevepn
ev
s IIIV
V (2)

53
b) Cut-off allocation: Cut-off allocation methodology is based on the argument that each
product should only be assigned the environmental impacts directly caused by its life cycle
(Ekvall and Tillman, 1997; Werner et al., 2007). In this case, cut off implies that an EV LIB was
manufactured primarily for vehicle application and no impacts of initial battery manufacturing or
EOL management not leading to reuse are allocated to the stationary energy storage system.
Since the second level of LIB EOL management processes (Iv2, e) occur at the EOL of the
stationary battery, for which the stakeholder in the utility sector are likely to be responsible, their
burden should be borne completely by the stationary system. Cut-off represents the best case
scenario for the stationary energy storage system, as the raw materials are, in effect, “free” of
impact. Based on the above arguments, the following allocation method expresses the
environmental impacts, Ibs:
2,vebs II (3)
c) 50/50 allocation: This allocation scenario was selected to represent a conceptual
“worst case” for allocation to the stationary energy system, implying that the LIB manufacturing
and EOL impacts assigned to the cascaded system would not be any higher than those assigned
to the original application for which the battery was designed and produced. The underlying
argument is that EV application and stationary application are both part of the same life cycle of
LIB, which could become increasingly valid if reuse partnerships between EV and utility are
arranged in advance, hence all environment burden of LIB production and EOL management
would be shared equally between the EV battery system and the stationary battery system:
bsI 2,1,v,*50.0 vevepn III (4)
3.3 Results and Discussion
3.3.1 Extended life cycle (Case 1): Results show that EV use phase followed by LIB production
are the life cycle stages contributing to the highest impact for the LIB (Fig. 3.3). This trend is
consistent with previous LCA studies that have estimated GHG emission impacts of EV LIBs
(Zackrisson et al., 2010; Samaras and Meisterling, 2008; Hawkins et al., 2013). The CED and
GWP of EV battery production was calculated at 1037 MJ/kWh and 59 kg CO2eq./kWh,
respectively. These findings are close to the estimations made by other process-based LCA
studies which range from 613-948 MJ/kWh and 50-62 kg CO2eq./kWh for CED and GWP

54
impacts (Notter et al., 2010; U.S. EPA, 2012). Variability in EV use phase impacts are observed
due to differences in the choice of electricity grid mix, modeled parameters such as number of
cycles during battery lifespan or the distance travelled by the EV during its lifetime (Ellingsen et
al., 2014), and system specifications which include considering total energy used for charging
the LIBs (Samaras and Meisterling, 2008; Hawkins et al., 2013) or accounting for only the
energy used to carry the battery weight and charge discharge losses (Zackrisson et al., 2010).
Extending the battery’s life by stationary use introduces trade-off between the
environmental cost of LIB refurbishment and use and the benefit of avoiding the production and
use of a stationary battery based on existing PbA technology. For the baseline scenario, which
assumes a 50% cell conversion rate from EV to stationary application and a 5-year refurbished
LIB lifespan, the environmental benefits outweigh potential costs, providing an overall CED and
GWP credit of 12,850 MJ and 740 kg CO2-eq, respectively; a net reduction of15% in these
impacts over the EV LIB life cycle (Fig. 3.3).
Figure 3.3 CED (a) and GWP (b) impacts of an EV LIB with cascading reuse. These results reflect the baseline
assumptions that 50 % of the EV LIB cells can be converted for stationary use application and that the stationary

55
battery will have a 5-year life span. For comparison purposes, the shading used above is applied to denote the
“baseline” results in subsequent figures. The dotted line reflects the impact of the EV LIB life cycle with no reuse in
stationary application
Sensitivity analysis on parameters applicable to Case 1 (see Table 3.1), demonstrated that
net environmental credits due to EV LIB reuse reduced with decreases to both cell conversion
rate (F) and refurbished LIB lifespan. This result is due to the environmental burden of
transporting and testing more cells than required by the stationary energy storage system and
multiple replacements of cells in the stationary battery. However, overall reduction in EV LIB
environmental impact was observed for almost all scenarios (Fig. 3.4), with reductions from as
low as 0.3% to as high as 69% for CED, across the range of all scenarios. Similar reductions
(between 0.2 to 68%) were observed in GWP (Fig. S1 in Appendix B). For a very few extreme
scenarios (notably 1-year lifespan and cell conversion rates less than 50%), a small net increase
(<3%) in these environmental impact categories was shown (Fig. 3.4). These results suggest that
second use of EV LIBs is capable of further amplifying the environmental benefits accrued due
to adoption of EV technology, which more broadly can enable CO2 emission reductions of about
20-50% when compared to conventional gasoline vehicles (considering country specific/regional
grid mixes for battery charging) (Samaras and Meisterling, 2008; Sustainable Energy Ireland,
2007; Hawkins et al., 2013). Reductions in environmental impacts are expected to parallel
decreases in battery cost adjacent to technological progress. The U.S. Department of Energy has
estimated that by 2020, used EV batteries would be available in significantly large quantities to
reduce LIB costs by 70% and meet targets as low as $125/kWh (Howell, 2012; Neubauer and
Pesaran, 2011).
EV LIB recycling is likely to provide minor environmental benefit: 8-9% of total
environmental credits over the extended life cycle of the battery in the baseline scenario (Fig.
3.3). One barrier to EV battery recycling routes has been the gradual adoption of low cost LIB
chemistries (e.g. manganese oxide and iron-phosphate) by EV manufacturers, which result in
lower material recovery value than cobalt based chemistries (Wang et al., 2014a, Wang et al.,
2014b). Declining economic motivation for recycling, in parallel to the growing trend in battery
landfill bans in the U.S. and Europe (CA Code, 2006; New York State Rechargeable Battery
Law, 2010, European Commission, 2006), and extended producer responsibility for vehicle EOL
in Europe (EU, 2000) all underscore the importance of second use applications for EV LIBs.

56
Many OEMs are actively considering proactive EOL management options, including stationary
storage, in advance of widespread EV deployment (Doggett, 2011; Williams, 2011; Kuo, 2011).
Figure 3.4 Sensitivity analysis: CED of EV LIB with extended life under different scenarios of cell conversion rate
and refurbished EV LIB lifespan
3.3.2 Stationary Energy Storage (Case 2): In a direct comparison of reused LIB to new PbA
battery systems for stationary energy storage, the baseline scenario indicates that CED and GWP
impacts of refurbishing EV LIBs for a five year service life in stationary application (i.e. 4
battery replacements during the total system lifetime) represent less than half of the impacts of
manufacturing a new PbA battery. Particularly, the use phase GHG and CED impacts of the
refurbished LIB system were 21% lower than the PbA battery with mid-range (baseline) energy
efficiency of 77.5% (Fig. 3.5). However, if the incumbent battery system had a significantly
higher beginning-of-life efficiency (85%), these use-phase impacts of the LIB system were
actually higher by about 8%. Recycling the PbA battery provides no environmental credit, as the
lead used to produce these systems already has a high proportion of secondary content. On the
other hand, for LIB recycling, there is some environmental credit obtained due to metals
recovery, assuming closed-loop recycling. In general, the baseline scenario refurbished EV LIBs
were found to be environmentally favorable than PbA systems, even including the most efficient
technology for the latter. A net reduction of 13 to 46% in CED and 12 to 46% in GWP impacts
was estimated for the stationary LIB in the baseline scenario relative to equivalent functionality
PbA battery over a range of energy efficiency scenarios for the latter (Fig. 3.5; For GWP impacts
refer to Fig. S2 in section S7 of Appendix B).

57
Figure 3.5 CED of stationary energy storage system, comparing the baseline LIB scenario to three scenarios of PbA
battery efficiency
These environmental benefits could potentially be reduced under scenarios in which the
refurbished LIB does not provide the reliability required by stationary energy storage or if a high
volume of cells is rejected during refurbishment (Fig. 3.6). The best outcome for the refurbished
stationary battery (using cut-off allocation) was that of 100% F and 10 year lifespan of
refurbished cells, requiring only a single replacement during the lifespan of the stationary battery
system. For these parameters, a 49% reduction in the CED impact of the stationary battery is
possible when compared to low efficiency PbA batteries in the market (Fig. 3.6(a)). It is likely
that these LIBs with high reuse potential could be obtained from EV applications where the
vehicle itself reaches EOL before the battery (e.g., in cases of accident) or the battery is replaced
early due to EV resale (Richa et al., 2014).
A prominent factor that can define reuse feasibility and environmental performance is the
allowable DoD of second use LIBs, which would govern sizing of these stationary energy
storage systems relative to equivalent functionality PbA batteries. In this study, the DoD of both
the stationary PbA and LIBs were assumed to lie in the range of 33-42% and hence both systems
are considered to be of equal size (i.e. 450 kWh), which is extremely conservative for LIBs. In
general, new LIBs can provide deep discharges of as high as 80% (Rydh and Sanden, 2005;
Albright et al., 2012). However, there is immense uncertainty over the safe DoD range for
second use LIBs, with previous studies assuming DoD within a broad range of 20-80% (Ahmadi

58
et al., 2014a; Neubauer et al., 2012; Neubauer and Pesaran, 2011; Ahmadi et al., 2014b). Robust
and more stable LIB chemistries, such as lithium iron phosphate (LiFePO4), (Xu et al., 2010;
Choi et al., 2010; Krieger et al., 2013) that have demonstrated slower capacity fade compared to
manganese spinel based chemistry (Han et al., 2014) are likely to be operated at higher DoD
(Ahmadi et al., 2014b). However, a moderate DoD range for Mn-based batteries is a reasonable
assumption before performance uncertainties of second use LIBs can be resolved. If these LIBs
can be operated over a higher DoD range (65-80%) in stationary application, then a much
smaller sized LIB system would be needed (approximately 230 kWh to deliver 150kWh of
energy on a daily basis). In that instance, the CED impact for the stationary energy storage
system (Case 2) can be reduced by as much as 74% (instead of 49% for the 450 kWh LIB) when
compared to a low efficiency 450 kWh PbA battery system.
Second-life batteries are currently ineligible for incentive programs or federal investment
tax credits for grid storage, onsite or residential energy storage systems in the U.S. However,
quantifying the environmental benefits along with economic gains can stimulate policy support
to promote cascaded battery installations to help meet the ambitious renewable energy generation
and energy storage targets in U.S. states like California (Elkind, 2014). The U.S. DOE has
already made investments in projects to test the feasibility of such systems (Neubauer and
Pesaran, 2011). Similarly, partnerships have been undertaken by automakers such as Nissan,
General Motors (GM) and BMW and utility providers such as ABB, Sumitomo and Vattenfall
towards collaborative research efforts (Bond, 2013; Doggett, 2011; Sumitomo Corp., 2011;
Gordon-Bloomfield, 2015). In fact, the scenario of 100% cell conversion rate and long lifespan
can be considered similar to business models in which entire LIB packs are reused and where
significant information is available about battery performance during EV use (e.g., as captured
by systems like OnStar for the GM Volt). One example is the collaborative pilot project between
ABB and GM resulting in a prototype backup power storage unit from five used GM Volt
batteries that can power 3-5 homes for 2 hours (Bond, 2013).
The worst environmental performance of the refurbished stationary LIB estimated under
the cut-off allocation methodology was that of 10% F and 1 year refurbished LIB cells’ lifespan.
This scenario saw a three-fold increase in the environmental impact of the stationary energy
storage system when compared to high-efficiency PbA battery system. Such low performance
LIB cells might result from highly cycled EV batteries, cells used in temperature extremes, or

59
those of the highest age on a potential lifespan distribution as demonstrated in Chapter 2(Richa et
al, 2014). However not all scenarios of low cell conversion rate offset the environmental benefits
of EV LIB reuse (Fig. 3.6 (a)). A sufficient lifespan in stationary use is capable of compensating
for some of the environmental losses incurred due to a large number of EV LIB cells found to be
technically infeasible for stationary application. For example, even with an extremely low F of
10%, the stationary battery based on refurbished cells was estimated to have a life cycle CED
comparable to a high efficiency PbA battery if a 10 year lifespan of refurbished cells was
attained. For extremely low lifespan of refurbished cells (1 year), the cut-off for environmental
feasibility was found at F values of higher than 50%, when comparing to a high-efficiency PbA
battery. However, this criterion can be relaxed when comparing to low-efficiency PbA batteries.
Conversely, high F value can enable second use LIBs with poor lifespan to be environmentally
superior to PbA based systems. In terms of real world applications, cascading whole EV LIB
packs, even with extremely low lifespan, would still be environmentally preferable for less
intensive stationary storage or ad-hoc applications. These can include low demand (~twice per
year) power back up systems such as those for telecommunication applications.
However, environmental feasibility is not the only criteria that would determine the
adoption of retired EV LIBs in utility based applications. Low conversion or low lifespan of used
EV LIB cells is likely to be accompanied with high refurbishment, battery maintenance and
replacement costs. In general, a PbA battery system cost lies in the range of 65-120 $/kWh
depending on the technology (Albright et al, 2012). The pricing of second use stationary LIB is
uncertain, but may range from 38 to 132 $/kWh, depending on future EV adoption and new LIB
costs (Neubauer et al, 2012). Additionally battery re-installation costs can vary from 4-17 $/kWh
with labor cost being as high as 100 $/hour to replace a LEAF sized battery (Neubauer et al,
2012). These factors would ultimately influence the economic feasibility of low lifespan retired
EV LIBs when compared to PbA battery based systems, and need to be further analyzed to
estimate the overall eco-efficiency of LIB reuse.
Additionally, this study presents a relatively conservative estimate for EV battery
refurbishment by analyzing a system in which refurbishment would require disassembly and
testing of the individual cells contained in EV battery packs (Nenadic et al. 2014). However, a
more realistic approach will likely be based on testing battery modules (or even whole packs)
instead of cells which could result in lower electricity inputs during LIB refurbishment.

60
However, module level testing can be accompanied with additional environmental trade-offs as
the energy used during refurbishment may decrease by as much as 27-41% (Cready et al. 2003),
but may result in aggregate diagnostics that result in a lower “module yield rate” (Neubauer et
al., 2012), leading to a large number of technically viable cells entering the waste stream.
3.3.3 Sensitivity to Allocation Choices
Beyond sensitivity to technical parameters, tradeoffs between the two battery systems
compared also depends on the method of allocating upstream impacts for the EV LIB production
and EOL management. While cut-off allocation, shown in results of Fig. 3.6(a), is the best
scenario for refurbished LIB based stationary energy storage system, a choice of 50/50 allocation
results in a higher impact for the secondary life (Fig. 3.6(b)). In many instances, the cut-off
points beyond which a refurbished battery was no longer the preferable option were changed
substantially. For example, now for a 5-year lifespan refurbished LIB, a minimum F of 20% or
95% conversion rate of EV LIB cells would be required to be environmentally comparable with
a low or high efficiency PbA battery, respectively. For cut-off allocation, these conversion rates
were as low as 5-19%.
Figure 3.6 Impact of cell conversion rate and refurbished LIB life span on environmental feasibility of EV LIB reuse
(CED impacts) under (a) cutoff allocation scenario and (b) 50/50 allocation scenario

61
When comparing all allocation methods tested, quality-based approaches resulted in
intermediate environmental performance. For example, for the baseline scenario refurbished
LIB, allocating based on market price and energy storage resulted in net CED impacts that were
12-21% higher, respectively, than calculated using cut-off, but 16-9% lower, respectively, than
50/50 (Fig. 3.7). The difference in the environmental impact of stationary battery under different
impact allocation methods diverges further under scenarios of extremely low cell conversion
rate. In general, allocating based on market prices of the initial and reused LIBs resulted in lower
impacts assigned to the stationary energy system than when using energy storage as the quality
indicator. However, it must be noted that any forecasts of prices are estimates only, as a reuse
market has not yet been established at this early stage of EV adoption. For the utility sector, the
choice of allocation method could primarily depend on the parameter (i.e. energy or price) that
determines their perceived value of a cascaded LIB battery. Allocation could also reflect by the
battery ownership and EOL liability in reuse cascade. Since neither the EV market nor the
battery technologies are fully evolved yet, it may take some time for an Extended Producer
Responsibility (EPR) network to be established in this domain. In general, the EPR principle is
an integral part of EU waste directives such as WEEE, Battery and ELV directives (European
Commission, 2014) – regulations which can potentially cover EV LIBs in future. The recycling
of spent LIBs would involve different actors from the EV sector, namely the battery material
producers, battery producers, vehicle producers, vehicle dealers, and vehicle treatment operators
(Hoyer et al, 2011). However, once the reuse application becomes business as usual, new actors
from the utility sector will be involved as well. Modeling choices must evolve to reflect changing
stakeholders in this dynamic system.

62
Figure 3.7 CED of refurbished EV LIB-based energy storage system under different allocation approaches (for a 5-
year battery life span in stationary application)
3.4 Conclusions
Use of refurbished EV LIB cells in energy storage applications shows promise of
reducing the environmental impacts of these systems. Such reductions would be primarily due to
avoiding the life cycle of an equivalent PbA battery based system. Additionally, lifespan
extension would delay the entry of EOL LIBs into the waste stream, creating ancillary benefits
by allowing additional time for capacity building in the nascent LIB recycling sector. A wide
array of technical and modeling choices were analyzed here, and despite variability in results,
LIB reuse almost universally creates benefit either to the EV sector by extending battery life and
improving the competitiveness of EV technology or to the stationary energy sector by avoiding
production and use of a less-efficient PbA system. However, given the prospective nature of this
study, there is still immense uncertainty, particularly related to how closely actual battery reuse
parameters will align with modeling choices applied here.
Additional improvements can be gained via engagement and partnerships by both
stakeholder groups. One promising approach may be to directly engage vehicle battery OEMs in
rebuilding the packs for the secondary application. This approach leverages historical knowledge
of the cells such as their usage and deep discharge event, which has the potential to minimize or
even obviate the expensive process of refurbishing. Furthermore, the engagement of OEMs in

63
grid applications may alleviate apprehensions associated with usage of vehicle batteries as an
additional storage for smart grid applications. Battery OEMs and refurbishers may adopt
different strategies depending on LIB pack design, economic viability, or policy incentives.
Comparisons of cascaded use of retired EV LIBs with PbA battery technology were made
since currently the latter is the most widely used energy storage technology for grid support,
primarily owing to its low cost (Albright et al., 2012; Soloveichik, 2011). However, it is
expected that both redox-flow batteries and high temperature sodium batteries are going to be
widely adopted by the utility sector in future because of their higher energy density, electrical
efficiency and lower maintenance which can make them cost competitive for stationary
applications (Dunn et al., 2011; Doughty et al., 2010). Furthermore, as the market for lithium-ion
batteries grows both for consumer electronics as well as for electric vehicles, they could be a
feasible option for grid based energy storage applications due to the economies of scale
expected. Hence, further research is required to compare the environmental and economic
benefits of cascaded use of retired EV LIBs with respect to new LIBs and other upcoming
battery technologies.
Many uncertainties still exist, and empirical and modeling studies are necessary to further
refine the estimates surrounding cascaded battery reliability, incumbent technology
displacement, and scale up of battery reuse and recycling sectors. As this information becomes
available, the LCA model and uncertainty analysis shown here can be iteratively improved.
However, this proactive analysis of battery reuse alternatives allows stakeholders in both the EV
and utility sectors to plan more effectively for the design, technology requirements, and business
models needed to enable economically and environmentally feasible reuse strategies. More
broadly, the methodological contributions to modeling allocation in cascaded product systems
can also be applied in other sectors where components or whole products are repurposed and
applied in a new application (for e.g. refurbished solar modules used in smaller scale
applications) or even “upcycled” into value added product life cycles.

64
CHAPTER 4: ECO-EFFICIENCY ANALYSIS OF A LITHIUM-ION BATTERY WASTE
HIERARCHY INSPIRED BY CIRCULAR ECONOMY
4.1 Introduction
While use of electric vehicles (EVs) can reduce dependence on fossil based transportation
fuels and may ultimately curb carbon dioxide emissions, a major concern is the management of
potential wastes generated when the lithium-ion batteries (LIBs) from EVs reach their end-of-life
(EOL) (Richa et al., 2014; Wang et al., 2014b). The material flow analysis (MFA) of EOL EV
batteries in Chapter 2 predicted a waste stream of 4 million metric ton (mT) of LIB cells between
years 2015 and 2040 (Richa et al., 2014). Considering the pronounced scale of LIB usage as the
number of EVs increases, a well-defined, proactive EOL management strategy is needed for
these batteries. Such a strategy can be informed by “circular economy” principles such as reuse,
recycling and landfill disposal (Ramoni and Zhang, 2013). A circular or closed-loop economy
aims to eliminate waste by cycling materials and products within the system to achieve resource
and energy efficiency as well as profitability (Ellen MacArthur Foundation, 2013; McKinsey &
Company, 2014; Allwood et al., 2012; Allwood et al., 2011; Gregson et al., 2015; Ghisellini et
al., 2016). Hence, both reuse and recycling propagate this concept by enabling a resilient
infrastructure of LIB materials by avoiding primary metal production and reducing landfill
disposal of potentially hazardous materials.
While few companies (e.g. Retriev, Chemetall, Umicore and Recupyl) commercially
recycle LIBs, a significant body of knowledge has explored novel technologies for recovering
constituent metals at bench scale including both hydrometallurgical and pyrometallurgical
recycling pathways (Espinosa et al. , 2004; Xu et al., 2008; Dunn et al., 2012; Georgi-Mascheler
et al. 2012; Ramoni and Zhang, 2013; Hendrickson et al., 2015; Nan et al. 2005; Dorella and
Mansur 2007; Swain et al. 2007; Ferreira et al. 2009; Li et al. 2009; Chen et al. 2011; Li et al.,
2013, etc.). While life cycle assessment (LCA) studies confirm the environmental benefit from
recovery of LIB materials along different recycling pathways (Dewulf et al., 2010; Hendrickson
et al., 2015; Dunn et al., 2012, 2015; Amarakoon et al., 2013), recycling will never be 100%
efficient and it can only recoup a fraction of the embodied energy for materials – it does not even
address energy input to battery assembly and manufacturing steps. Though LIB recycling could
serve as an enormous source of high value materials as evident from the results in Chapter 2
(Richa et al., 2014), major economic barriers to commercial EV LIB recycling may emerge,

65
particularly potential transitions away from cobalt-rich battery chemistries (where cobalt drives
the economic revenue of recycling) to lower cost chemistries (e.g. manganese oxide and iron-
phosphate) by EV manufacturers (Wang et al., 2014b; Richa et al., 2014) and energy intensive
pyrometallurgical recovery processes (Fisher et al., 2006).
Despite the wide commercial and research attention on recycling, it may not be the first
priority for LIB waste management, at least without prior consideration of battery reuse. While
conventional solid waste hierarchies place “reuse” above “recycling” in order of preference, LIB
reuse has been far less studied. Yet clear benefits are promised: studies suggest that retired EV
LIBs would still have 80% of their initial capacity intact (Nagpure et al. 2011; Marano et al.
2009; Zhang et al. 2011; Hoffart, 2008; Cready et al., 2003; Neubauer & Pesaran; 2011), and,
directly recycling them without any consideration for reuse can forgo the benefit obtained from
taking advantage of this remaining capacity.
Reuse of EV LIBs can theoretically have two forms – direct reuse in the application from
which the battery was obtained (i.e., reuse in EVs) and cascaded use in a different and less
demanding stationary application. LCA studies suggest that reuse of EV LIBs in stationary
applications can provide environmental credits by avoiding the burden of manufacturing new
battery packs for these end uses (Richa et al., 2015; Cicconi et al., 2012; Genikomsakis et al.,
2013). For example, it was demonstrated in Chapter 3 that the extension of EV LIB life by use in
a cascaded secondary application that displaces production of a lead acid battery system can
result in Cumulative Energy Demand savings and Global Warming Potential reduction of as high
as 69% and 68%, respectively (Richa et al., 2015). Additionally, reuse pathways would provide
economic advantages for the EV user by potentially reducing the cost of EV batteries or EV
lease payments, providing resale value for retired EV LIBs (Viswanathan et al., 2011; Neubauer
and Pesaran, 2011; Neubauer et al., 2012; Williams and Lipman, 2010), and avoiding the cost of
purchasing a new battery for the reuse application, as well as revenue generation potential for the
utility sector (Neubauer and Pesaran, 2011; Narula et al., 2011; Heymans et al., 2014; Neubauer
et al., 2012; Williams and Lipman, 2010; Viswanathan et al., 2011; Peterson et al., 2010, etc.).
While the general focus of recent literature has been on cascaded use of LIBs in
stationary applications, reuse of these batteries in automobile application has not received much
attention. A recent study by Saxena et al. (2015) suggests that LIBs can be used well below the
80% remaining energy capacity limit for less demanding daily travel needs of EV users or

66
extensive battery charging infrastructure, thus highlighting their automotive reuse possibilities.
Even with the 80% LIB capacity fade limit, early vehicle failure (e.g. significant repairs,
collisions) and EVs with battery replacement later in their useful life are likely to yield LIBs with
high reuse potential as indicated in Chapter 2 (Richa et al., 2014) that could hypothetically be
employed as replacement batteries for used EVs if technology and a market exists to support this
system.
The last option for EV LIB waste management would be landfill disposal which is not
expected to provide any environmental or economic benefit. The US EPA does not consider EV
LIBs to be a major threat to environmental health as they do not usually contain toxic elements
like lead, mercury or cadmium (Gaines and Cuenca, 2000). However, these batteries contain
metals like lithium, aluminum, cobalt, manganese, nickel, and copper, which do have the
potential to leach slowly into the soil, groundwater, and surface water if not disposed properly
(Kang et al., 2013; Vimmerstedt, 1995). Similar to the case of electronic waste (Williams et al.,
2008), risk of material leaching in well-managed sanitary landfills may be negligible, but the
greater risk is loss of valuable materials, and the economic benefits of the reuse and recycling
sectors should still avoid landfill of EV LIBs to promote a circular economy.
To delay or avoid landfill flows and tap into the potential benefits of reuse and recycling
routes, the priority for managing the EV LIB waste stream is likely to follow a “waste
management hierarchy”. The EU Waste Framework Directive and the US EPA strongly advocate
this circular thinking with a waste management hierarchy of prevention, reuse, recycling, other
recovery (i.e. energy recovery) and disposal, with the highest priority waste management route
resting at the top (European Parliament, 2008; US EPA, 2015b). In general, such a hierarchy
depicts priorities from an environmental, and sometimes economic perspective for a variety of
waste streams such as EOL electronics (Brandstotter et al., 2004), food waste (US EPA, 2016;
Papargyropoulou et al., 2014; Glew et al., 2013), municipal solid waste (Cleary, 2009),
packaging (Rossi et al., 2015), and construction waste (Batayneh et al.,2007), etc. but its validity
is yet to be analyzed for LIBs.
Using concepts from circular economy and traditional waste management hierarchies, a
theoretical waste management framework has been proposed here for EOL EV LIBs that
includes reuse in EVs, cascaded use in stationary application, recycling and finally, landfill
(Figure 4.1). A case study has been developed to examine the feasibility of this framework and
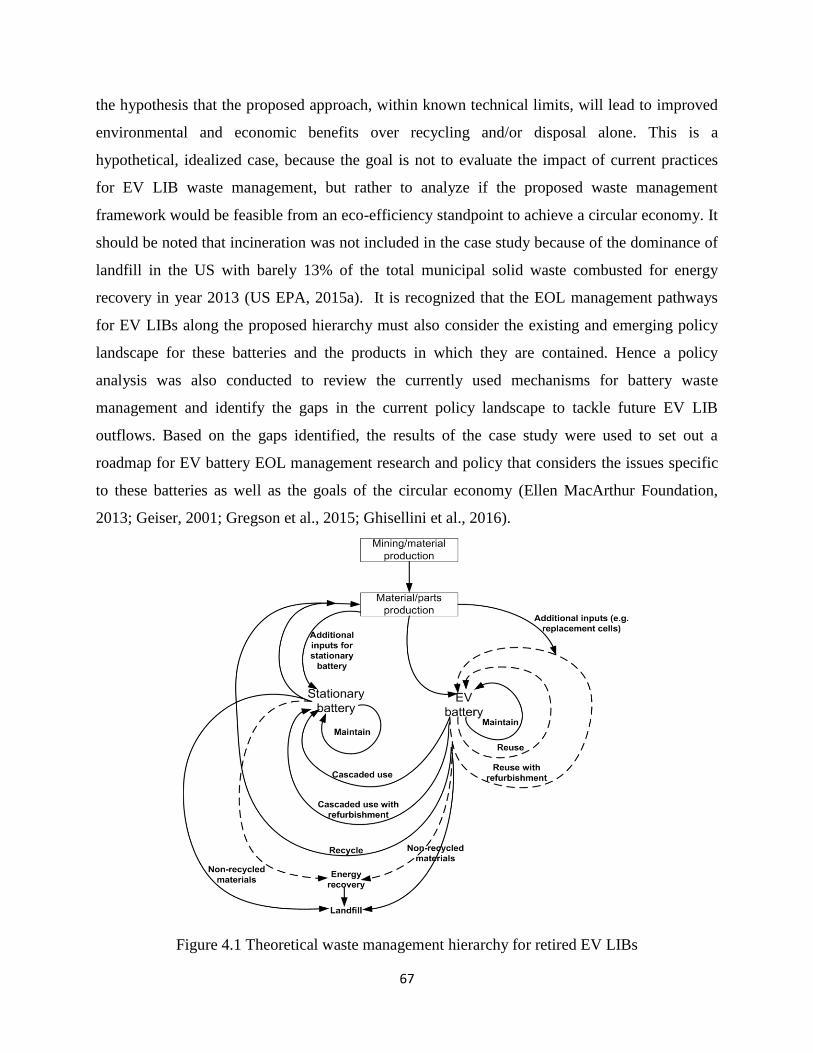
67
the hypothesis that the proposed approach, within known technical limits, will lead to improved
environmental and economic benefits over recycling and/or disposal alone. This is a
hypothetical, idealized case, because the goal is not to evaluate the impact of current practices
for EV LIB waste management, but rather to analyze if the proposed waste management
framework would be feasible from an eco-efficiency standpoint to achieve a circular economy. It
should be noted that incineration was not included in the case study because of the dominance of
landfill in the US with barely 13% of the total municipal solid waste combusted for energy
recovery in year 2013 (US EPA, 2015a). It is recognized that the EOL management pathways
for EV LIBs along the proposed hierarchy must also consider the existing and emerging policy
landscape for these batteries and the products in which they are contained. Hence a policy
analysis was also conducted to review the currently used mechanisms for battery waste
management and identify the gaps in the current policy landscape to tackle future EV LIB
outflows. Based on the gaps identified, the results of the case study were used to set out a
roadmap for EV battery EOL management research and policy that considers the issues specific
to these batteries as well as the goals of the circular economy (Ellen MacArthur Foundation,
2013; Geiser, 2001; Gregson et al., 2015; Ghisellini et al., 2016).
Figure 4.1 Theoretical waste management hierarchy for retired EV LIBs

68
4.2 Method
The different EOL management pathways of EV LIBs that were considered are reuse (in
EV), cascaded use (in stationary applications), recycling and landfill (Figure 4.1). Both reuse and
cascaded use pathways would include some level of testing and refurbishment to bring batteries
back to a usable condition or prepare packs for new applications (Standridge and Corneal, 2014
and Richa et al., 2015).
For each of these pathways, the environmental metrics quantified by a life cycle approach
were metal input, cumulative energy demand (CED), and eco-toxicity. These metrics were
selected to demonstrate the environmental benefit or cost of the different waste management
routes across the proposed hierarchy in terms of material resource, energy consumption and
ecosystem quality, respectively. The net metal input in metric ton for different EOL pathways
was estimated from the bill of materials of LIB cell and pack components, additional inputs and
avoided battery systems in case of reuse/cascaded use of EV LIBs, and recycling efficiencies.
The CED in megajoule (MJ) was calculated by using characterization factors and primary energy
sources provided in SimaPro software CED calculation methodology. USEtox LCA impact
assessment methodology was used to estimate the eco-toxicity impacts in terms of Comparative
Toxic Unit for ecosystems (CTUe) (Rosenbaum et al., 2008). U.S. based electricity grid mix was
used for electricity input data (ecoinvent Centre, 2010).The case study was applied to a
theoretical stream of 1,000 LIB packs coming out of EV application in the future. This functional
unit was selected to create results that could easily be scaled to an actual volume of waste packs,
regardless of the time frame or total waste stream. Considering a conservative baseline of EV
adoption, MFA results for year 2030 from Chapter 2 were normalized to 1,000 LIB packs to
indicate a functional unit representing future annual EV LIB waste stream for a given year “n”
(Refer to Appendix C Section S1). This waste stream was comprised of 25% BEV, 36% long
range PHEV and 39% short range PHEV LIB packs (Richa et al., 2014)
Lithium Manganese Oxide (LMO) cathode chemistry was considered for EV LIBs due to
its use as a constituent in blended cathode material of leading BEV and PHEV batteries (Lu et
al., 2013) and has been used in the past to highlight the environmental impact of EV batteries
(e.g. Notter et al., `2010; Dunn et al., 2012; Amarakoon et al., 2013). The energy capacity of
these battery packs were based on the baseline scenario capacities from Chapter 2 (Richa et al.,
69
2014). The battery packs were modeled in Argonne National Laboratory BatPac tool (Nelson et
al., 2011) resulting in an estimated waste stream of 160 mT of BEV and PHEV LIB packs for the
chosen functional unit. The electric ranges of BEV, short range PHEV and long range PHEV
were calculated in BatPac as 132 miles (39 kWh), 12 miles (18 kWh) and 50 miles (4.4 kWh),
respectively. Additional comparisons were made on how some of the results of the case study
would change if Lithium Nickel Manganese Cobalt Oxide (NMC) or Lithium Ferrous Phosphate
(LFP) cathode or an equal proportion of all three (LMO, NMC and LFP) cathode types was used
in EV LIBs, based on a similar approach by Richa et al. (2014) (For details, refer to Appendix
C). Figure 4.2 illustrates the path of this EV LIB waste stream along waste management routes in
the proposed hierarchy. These flows have been estimated from results in Chapter 2 and 3 (Richa
et al., 2014; 2015) and are discussed in next sections. It is important to note that batteries
entering into waste management in any given year “n” will cycle through multiple systems at
various times in the future. These “cycles” (denoted by C1, C2 and C3) will each be separated by
a time lag during which the battery is either in its reuse or cascaded use application or is
recycled. For example, for year “n”, 40% (by weight) of the EOL EV LIBs would not meet
technical criteria required for reuse or cascaded use, and would therefore be sent for recycling in
the same year (C1 recycling), while the rest of the waste would be recycled in later years after
reuse and/or cascaded use, denoted by C2 and C3 recycling (Fig 4.2). Following sections discuss
the approach employed for the eco-efficiency analysis of each of these EOL pathways for EV
LIBs.

70
Figure 4.2 Diagrammatic flows of 1,000 EOL EV LIBs across different waste management routes. C1 denotes a
given year “n” in which the battery waste flows out from first use in EVs and into the waste stream, C2 denotes year
(n+4.5), to correspond with maximum expected lifespan for reuse in EVs, or (n+5), the maximum expected lifespan
for cascaded use in stationary applications, and C3 denotes year (n+9.5), for batteries which were technically
feasible to cycle through both direct and cascaded reuse.
4.2.1 Reuse in EV application
A maximum of 35% (by weight) of the EV LIB outflows in year n will have remaining
capacity for use in EVs, having not yet reached the 80% capacity level due to early vehicle
failure or crash or cases when an EV received a battery replacement and then reached the end of
its life before the battery capacity is fully used (“lifespan mismatch” as described in Richa et al.
(2014); Figure 4.2). An average of 9 years is considered as the “design lifespan” of LIBs for EV
application (Standridge and Corneal, 2014 and Richa et al., 2014) corresponding to 3,285 cycles
over the EV use phase of the LIB when cycled daily. Half of this design lifespan of the LIB is
considered to be already spent in the first life EV use, leaving 4.5 years for reuse in EVs. This is
a theoretical assumption, as direct reuse is not occurring in practice, to our knowledge, but a
conceivable future scenario as EVs become more widely adopted. An underlying assumption for

71
this pathway is that 10% of the LIB cells would need to be replaced during refurbishment
(Standridge and Corneal, 2014). Electrical performance is analyzed by using a conservative
approach of testing whole battery packs by charging once to 70% battery capacity (Notter et al.,
2010).
The net environmental impact of reusing EV LIB in vehicle application, Ereuse, EV was
calculated from the Avoided environmental impact of manufacturing new LIB pack (Em), Design
lifespan of EV LIB (ld), Lifespan of EV LIB in reuse application (lr), Impact of manufacturing
replacement cells (Em,cells), Impact of battery pack (or cells) testing (Et), Impact of charge-
discharge efficiency losses of refurbished LIB in EV application (Ec-d, reuse) and the Avoided
impact of charge-discharge efficiency losses of new LIB in EV application (Ec-d,new):
𝐸𝑟𝑒𝑢𝑠𝑒,𝐸𝑉 = −(𝐸𝑚/𝑙𝑑) ∗ (𝑙𝑟) ∗ 𝐸𝑚,𝑐𝑒𝑙𝑙𝑠 + 𝐸𝑡 + 𝐸𝑐−𝑑,𝑟𝑒𝑢𝑠𝑒 − 𝐸𝑐−𝑑,𝑛𝑒𝑤 (1)
Life cycle inventory (LCI) data for LIB pack production was obtained from Richa et al.
(2015) and the efficiency loss calculations were based on Zackrisson et al. (2010). A direct
correlation between capacity decay and battery charge-discharge efficiency was considered and
after reuse in EVs, the capacity and efficiency was reduced to 80% (Ahmadi et al., 2014a; Richa
et al., 2015) [Refer to Appendix C, Section S4].
The economic cost or benefit (in USD) of reusing old EV batteries for a second time in
EV application (Vreuse, EV) was determined from the Avoided cost of buying new replacement LIB
(BLIB,new), Avoided resale value of the new EV battery at vehicle EOL (SLIBused, new ), Cost of
buying a refurbished EV LIB (BLIB, refurb) and Resale value of refurbished LIB at vehicle
EOL(SLIBused, refurb) most likely for stationary applications:
𝑉𝑟𝑒𝑢𝑠𝑒,𝐸𝑉 = (𝐵𝐿𝐼𝐵,𝑟𝑒𝑓𝑢𝑟𝑏 − 𝑆𝐿𝐼𝐵𝑢𝑠𝑒𝑑,𝑟𝑒𝑓𝑢𝑟𝑏) − (𝐵𝐿𝐼𝐵,𝑛𝑒𝑤 − 𝑆𝐿𝐼𝐵𝑢𝑠𝑒𝑑,𝑛𝑒𝑤) (2)
Future new EV LIB cost ($125/kWh), refurbished battery buying price ($38/kWh) and
used battery selling price ($20/kWh) was obtained for a low LIB cost scenario from Neubauer et
al. (2012) based on similar future LIB cost estimates by U.S. Department of Energy (Howell et
al., 2012; Neubauer and Pesaran, 2011).

72
4.2.2 Cascaded use in stationary applications
LIB packs from the EV LIB waste stream in year n would be employed for cascaded use
in stationary application over two cycles, C1 (immediately on entering the waste stream) and C2
(after reuse in EVs). Some additional component input is required for refurbishing and
assembling these systems (wiring, BMS, etc.) while some existing components may be discarded
(Richa et al., 2015). Based on the expected cell failures during testing and technical limits of
cascaded reuse, only 50% of the LIBs that outlived their usage capacity in EVs, were assumed to
be feasible for stationary use, with a 5 year lifespan in stationary application (Richa et al., 2015).
The environmental benefit of cascaded use of retired EV LIBs was obtained from
avoiding the production and use of lead-acid (PbA) batteries (450 kWh each) (Richa et al.,
2015), the latter being the widely used technology for certain stationary and industrial purposes
(Soloveichik, 2011) such as grid storage and off-grid renewable systems (Albright et al., 2012).
The net environmental benefit from cascaded use of refurbished EV LIBs for stationary energy
storage (Ereuse, stat) was calculated from the environmental impact of a refurbished EV LIB based
stationary energy storage system (Erefurb, LIB) and the avoided impact of an equivalent
functionality PbA battery system, EPbA:
𝐸𝑟𝑒𝑢𝑠𝑒,𝑠𝑡𝑎𝑡 = 𝐸𝑟𝑒𝑓𝑢𝑟𝑏,𝐿𝐼𝐵 − 𝐸𝑃𝑏𝐴 (3)
LCA data for modeling environmental impact of production and use of PbA and cascaded
use EV battery systems was obtained from Richa et al. (2015). The economic cost or benefit of
the second use pathway (Vreuse,stat) was calculated from Refurbished battery buying price,
BLIB,refurb (Neubauer et al., 2012) and valve regulated PbA (VRLA) battery buying price, BPbA new
(Albright et al., 2012) for the utility sector:
𝑉𝑟𝑒𝑢𝑠𝑒,𝑠𝑡𝑎𝑡 = 𝐵𝐿𝐼𝐵,𝑟𝑒𝑓𝑢𝑟𝑏 − 𝐵𝑃𝑏𝐴 𝑛𝑒𝑤 (4)
4.2.3 Recycling
Recycling of EOL EV LIBs generated in year n and the additional material input for the
reuse and cascaded use stages is likely to occur in three cycles C1, C2 and C3 separated by time
lags (Figure 4.2). Net environmental impact of EV LIB recycling (Erec) along these cycles was
calculated considering equal proportion of the waste stream would be going to
hydrometallurgical and pyrometallurgical recycling processes (Mudgal et al., 2011; Richa et al.,

73
2015) and was based on Environmental impact of recycling process (Erec process) and the Avoided
environmental impact due to material recovery (Ematerial recovery):
𝐸𝑟𝑒𝑐 = 𝐸𝑟𝑒𝑐 𝑝𝑟𝑜𝑐𝑒𝑠𝑠 − 𝐸𝑚𝑎𝑡𝑒𝑟𝑖𝑎𝑙 𝑟𝑒𝑐𝑜𝑣𝑒𝑟𝑦 (5)
All metals in EV and stationary LIB packs were assumed to be recycled, however, owing
to recycling inefficiencies, there will always be some fraction of these metals which would go to
landfill. Erec process and Ematerial recovery were calculated from LIB cell recycling and secondary
metal production LCA data (Hischier et al., 2007; ecoinvent Centre, 2010; Fisher et al., 2006;
Richa et al., 2015), and recycling efficiencies of metals contained in LIBs (Graedel, 2011;
Sibley, 2011; Mantuano et al., 2006). Speculative recycling efficiency from bench scale
recycling data for lithium and average recycling efficiency for manganese was used since these
metals are not currently recovered from LIBs commercially (Gaines, 2014). Therefore, results
represent the maximum theoretical value achievable from recycling.
The economic cost or benefit of EV LIB recycling (Vrec) was calculated from the Total
cost of recycling operations (TCrec) and Value of recovered materials (Vmaterial recovery).
𝑉𝑟𝑒𝑐 = 𝑇𝐶𝑟𝑒𝑐 − 𝑉𝑚𝑎𝑡𝑒𝑟𝑖𝑎𝑙 𝑟𝑒𝑐𝑜𝑣𝑒𝑟𝑦 (6)
Vmaterial recovery was calculated using yearly average metals prices (USGS, 2015; Infomine,
2015) and recycling efficiencies. TCrec was calculated based on methodology from Wang et al.
(2014b) using fixed cost (1,000,000 $/year), maximum recycling capacity (34,000 mT annually),
and variable cost (1,100 $/mT) for a recycling facility [Refer to Appendix C, Section S8].
4.2.4 Landfill
Some LIB materials, such as mixed plastics, graphite and electrolyte cannot be recycled
due to lack of economic motivation or infrastructure (Richa et al., 2014). In addition, some
metals will be lost from the value stream due to recycling inefficiencies. Thus, ultimate disposal
options must still be considered for non-recoverable materials generated over the three temporal
cycles. CED and indirect eco-toxicity impact of LIB materials landfilled was estimated using
battery waste transportation and landfill operation LCI data (ecoinvent Centre, 2010). Results
from laboratory based Toxicity Characteristic Leaching Procedure (TCLP) (see Appendix C,

74
Section S13) were used to estimate potential leaching of metals contained in LIBs disposed in
landfills (“average leaching potential” ) [Table 4.1].
LIB metal Average leachate
concentration (mg/l)
Average Leaching
potential (mg/kg)
Aluminum 131 11,000
Copper 1.61 200
Lithium 273 420,000
Manganese 335 110,000
Steel 13.7 3,100
Cobalt 15 36,000
Nickel 160 21,000
Table 4.1 Average landfill leaching potential of LIB metals
The TCLP represents an average leachate concentration over a moderate to long-term
period of 3 to 10 years and for specific landfill design, waste composition and landfill water
percolation characteristics (Frampton, 1998). These releases represent environmental loads, and
their impacts on ecosystem quality were calculated by multiplying the total mass of a metal
leached with the USEtox eco-toxicity characterization factor (in CTUe/kg) for that metal.
Currently the eco-toxicity impacts of copper, manganese, iron, cobalt and nickel are
characterized by USEtox.
The implicit assumption is that non-recoverable materials from recycling operations will
be sent to a municipal landfill, based on similar assumption for these batteries in E-waste in
recent studies (Wang et al., 2014b; Kohler et al., 2008; Espinoza et al., 2014; Asari and Sakai,
2013). However it cannot be overruled that in many jurisdictions in future the EV LIB recycling
residue maybe directed to industrial landfills and the metal leaching potential would vary in that
case. An average landfill disposal cost of $1,170/mT of LIB waste was employed for estimating
the economic cost of disposing waste LIBs in landfill. This included a collection fee of
$1,120/mT (Wang et al., 2014b) and average landfill tipping fee for municipal solid waste in the
US at $49.78/mT for year 2013 (US EPA, 2015a).
4.3 Results
4.3.1 Eco-efficiency analysis of proposed LIB EOL hierarchy
The eco-efficiency analysis of the proposed EV LIB waste management hierarchy,
including reuse, cascaded use, recycling and landfill, is discussed in the next sections. The

75
environmental results (Figure 4.3) are required to determine if a circular economy-inspired
system will actually generate net environmental benefits or introduce unforeseen tradeoffs. The
economic cost-benefit analysis for the case study is presented in Fig 4.4. Additionally, areas of
uncertainties, which may cause deviations from these results, are discussed for specific cases.
(a)
(b)

76
(c)
Figure 4.3 Net environment impact of EV LIB EOL management routes for different fractions of the analyzed waste
stream (1,000 LIB packs, during specific temporal cycles C1, C2, and C3) in terms of (a) CED, (b) eco-toxicity, and
(c) metal input. The dotted lines represent impact due to production of these 1,000 LIB packs. A negative value of
impacts denotes environmental benefit due to avoided production of new battery systems or avoided energy use in
less-efficient displaced systems. These results showcase a circular economy inspired holistic approach of handling
this waste stream and are not meant to be a comparison of different waste management routes. Figures showcasing
the contributors to these net results in absolute terms are provided in Appendix C.
Reuse in EVs: Even though circular economy approaches would put product reuse at the top of
the waste hierarchy, results actually show small if any benefit due to direct reuse of LIBs in EVs.
LCA results (for e.g. in Chapter 3) have consistently pointed out the importance of the use phase
in LIB life cycle associated with the declining round-trip efficiency and increasing energy losses
as the battery ages (Richa et al., 2015; Ahmadi et al., 2014a,b). For reuse of BEV and high range
PHEV battery pack in EVs, the avoided CED impact of LIB production far exceeded the CED of
charge-discharge losses, replacement cells and LIB testing, resulting in a net benefit of 3,200 MJ
and 73 MJ per pack, respectively. However, no CED benefit was observed for short range PHEV
packs due to lower avoided CED value for these smaller packs, as compared to the CED impacts
of electricity use and losses. Overall, a net CED benefit of 200,000 MJ was estimated from
reusing the maximum feasible number of EV LIBs packs in automotive application (37.2% of
the 1,000 packs entering the waste stream) (Figure 4.3 (a)). Benefits increase by 33% if short
range PHEVs are excluded from the analysis. Since these benefits are primarily due to avoiding

77
new battery packs for EVs, LIB chemistries such as LFP with low CED impact for battery
production would not provide a net CED benefit through this pathway (Refer to Appendix C).
If an aggressive testing procedure was employed for refurbishing EV LIBs for
automotive reuse wherein individual LIB cells are tested for reuse capability, no CED benefit is
expected in the reuse pathway across all EV LIB types. In fact, a net CED burden of 500,000 MJ
would actually be created, due to energy efficiency losses plus energy required to test individual
cells (See Appendix, Section S5). On the other hand, if it is assumed that energy efficiency of
EV LIB does not decline with aging, the net CED benefit is expected to be as high as 2.6 million
MJ. This represents a “hypothetical best case” since in general, efficiency degradation in
remanufactured products may make them environmentally unfavorable in terms of energy
consumption when compared to a new product for the same application (Gutowski et al., 2011).
Reuse of EV LIBs in vehicles can provide an eco-toxicity benefit per pack of 430 to
3,100 CTUe for short range PHEV to BEV battery, thus providing an overall eco-toxicity benefit
of 500 thousand CTUe for the battery flows analyzed here (Fig 4.3 b). This benefit is obtained
from avoiding the production of new LIB packs as replacement EV batteries which outweighs
the potential eco-toxicity impact of electricity use even during aggressive battery testing. This
pathway has the capability of avoiding approximately 12 mT of metals-primarily aluminum,
manganese and copper (Fig 4.3 c).
The estimated economic benefit for the EV user from LIB reuse in vehicles ranges from
USD 330 to USD 3,000 per pack for short range PHEV up to BEV battery. An overall economic
gain of 500,000 USD is expected for the fraction of LIB packs reused in EVs from the analyzed
waste stream (fig 4.4). These economic gains are tripled if high values of new EV LIB cost
($440/kWh), refurbished battery buying price ($132/kWh) and used battery selling price
($100/kWh) are considered (Neubauer et al., 2012).

78
Figure 4.4 Net economic benefit or cost of EV LIB EOL waste management routes for different fractions of the
analyzed waste stream (1,000 LIB packs). A negative value denotes economic savings while a positive value
denotes economic cost. The dotted lines represent the “beginning of life” cost of the 1,000 EV LIBs in the waste
stream for both high and low battery cost scenarios.
Cascaded use in stationary applications: For a stationary energy storage system
operating for 5 years, a net CED and eco-toxicity benefit of 1,330 MJ/kWh and 626 CTUe/kWh
can be obtained through cascaded use of retired EV LIBs and by avoiding the production and use
of PbA battery systems. Translated into the overall benefit for the EV LIB waste flow functional
unit analyzed here, a net CED and eco-toxicity benefit of 9.6 million MJ and 4.5 million CTUe
can be obtained. These stationary battery systems would result in the avoidance of 130 mT of
metal inputs, primarily by avoiding primary and secondary lead production. Adopting a waste
management hierarchy wherein cascaded use is followed by recycling has the potential to recoup
a significant fraction of energy used in the manufacturing of EVs along with their LIBs. For
example, for a retired BEV battery, reuse in EV, cascaded use and finally, recycling can together
recoup as high as 50% of the energy used to produce the vehicle and the battery and 40% of this
gain is due to cascaded use (Refer to Appendix C, Section S12). Thus, the cascaded use strategy
for retired EV LIBs can be instrumental in driving the circularity of the proposed system.
About 600,000 USD cost savings for the utility sector is estimated from installing these
stationary energy storage systems with combined storage of 7,200 kWh (Figure 4.4). However,
these estimates are based on low future LIB cost (Neubauer et al., 2012) and comparisons made

79
with Valve Regulated Lead Acid battery systems. There is immense uncertainty in future LIB
prices and the type of PbA battery systems that would be replaced by these retired LIBs. When
compared to flooded PbA battery systems, these cost savings would be reduced by 67% and in
case of high future LIB cost scenario where the refurbished battery buying price could be as high
as 132$/kWh, no economic benefit is expected from cascaded use.
Recycling: Recovery of metals from the original 1,000 EV LIB waste stream as well as
any additional material input during reuse and cascaded use pathways provided CED and eco-
toxicity credits of about 3.5 million MJ and 8 million CTUe, respectively. Using
hydrometallurgical recycling provided 25% higher CED credits when compared to the
pyrometallurgical process, primarily due to four times higher energy input for the latter (Fisher et
al., 2006). For a mixed waste stream, comprising of equal fraction of LMO, NMC and LFP
batteries, the CED savings can be slightly higher at 4 million MJ owing to slightly higher energy
saving from recycling the latter two chemistries.
For the analyzed EV flows, pyrometallurgical recycling resulted in about 50 mT of
avoided metals, while the metal recovery from the hydrometallurgical process was 29% less,
leading to 40 mT of net avoided metals via both routes (Fig 4.3b). This is because the latter
yields lithium, which constitutes 1-2% of the cells, while the pyrometallurgical process yields
manganese comprising of 22-24% of the cells, with both metals exhibiting similar theoretical
recovery efficiencies of about 50%. Direct recovery of LIB cathode through chemical re-
lithiation to regain electrochemical performance at EOL has been demonstrated for LFP and
LCO LIB cathodes and can provide the maximum energy savings, across all LIB material
recovery pathways (Ganter et al., 2014; Dunn et al., 2012). However in this chapter, the more
conservative hydrometallurgical and pyrometallurgical recycling processes were employed for
the LMO chemistry as demonstrated by Fisher et al. (2006) for a European recycling facility,
considering the uncertainty in future commercial recycling procedures.
A conservative cost (USD 1,100/mT variable cost) of recycling LIB pack materials
results in overall recycling cost of 190,000 USD, for processing a total of 167 mT of materials.
About 240 thousand USD in material value can be obtained across the three recycling cycles
(~50 mT), resulting in net economic benefit of 50,000 USD (Figure 4.4). About 65% of this
material value is derived from recycling LIB cells (~150 thousand USD). However, recycling

80
costs for LIBs are very uncertain- an average (USD 2,800/mT) vs. high end (USD 4,500/mT)
cost of recycling operations (Wang et al., 2014b) change the net economic cost between 235,000
and 520,000 USD. For the conservative recycling cost scenario, a net benefit of 250,000 USD is
expected if the waste stream was comprised entirely of NMC LIB packs, owing to high
commodity value of cobalt (USGS, 2015). A mixed waste stream of LMO, NMC and LFP LIB
packs would however result in negligible (~20,000 USD) material value (Refer to Appendix C).
Landfill: For all three cycles combined together, the quantity of waste LIB materials
entering the landfill is expected to account for 70% of the total waste stream (of 1,000 EV LIB
packs and additional material input during reuse and cascaded use). This landfill stream would
constitute115 mT of non-recyclable materials such as mixed plastic, electrolyte, or graphite and
recycling residues containing unrecovered metals. The cost of disposing this fraction of the waste
LIB material was estimated at 136,000 USD (Fig 4.4). About 40 mT (35%) of this landfill stream
was comprised of metals with 5% (~2 mT) of these metals potentially leaching in the landfill
(Fig 4.5). Immense uncertainty exists over the amount of metals leaching from a landfill and
these releases depend on numerous factors such as landfill age, control mechanisms, waste
composition, water percolation, time dimension of leaching, metal degradation etc. (Olivetti et
al., 2011; Rydh & Karlström, 2002). Slack et al. (2005) estimated 0.02% metal releases in
landfill for non-battery waste, Fisher et al. assumed 5% leaching potential of heavy metals from
spent batteries, while Rydh and Karlström (2002) assumed all metals from batteries to be
released over an infinite time period, hence our results suggest a moderate leaching potential for
LIBs.

81
Figure 4.5 Landfill leaching potential of unrecovered metals for 115 mT of LIB waste in landfill
The US EPA has not set TCLP regulatory limits for these LIB metals, though the State of
California has Total Threshold Leaching Concentration (TTLC) regulatory limits for cobalt,
nickel and copper (Eurofins, 2012) which are heavy metals and are generally present in LIBs
with mixed metal chemistries like NMC (Nelson et al., 2011).
The CED and “indirect” eco-toxicity impacts of landfill operation would be about
140,000 MJ and 14,000 CTUe, respectively. These impacts are primarily (>90%) due to waste
transport to landfill, while energy and land use for landfill operation are negligible. “Direct” eco-
toxicity implications of landfill leaching of metals from the analyzed landfill waste (Fig 4.5)
would result in 12 million CTUe of eco-toxicity which far exceeds the upstream, indirect eco-
toxicity impact for the bulk of the landfill waste. Use of nickel and cobalt based LIBs could
aggravate the eco-toxicity impacts by an additional 13%, while a waste stream composed of only
LFP batteries would reduce these impacts by 47% (Refer to Appendix C). Nevertheless, despite
the widespread attention on eliminating battery landfill, these results underscore that a greater
degree of toxicity impact can be avoided by battery reuse/cascaded use and recycle than would
actually be generated if materials leach from landfills.
Consolidated Results: The consolidated results of this case study across various waste
management routes were compared to the environmental impact of production and “beginning of

82
life” cost of the 1,000 EV LIBs in the analyzed waste stream (Fig 4.3 and 4.4). The CED and
eco-toxicity values of LIB production were based on LCA study in Chapter 3, which considered
a production mix of various metals used in battery manufacturing (Richa et al., 2015). Results
suggest that the proposed waste management hierarchy would be able to recoup about 77% of
the CED and 30% of the eco-toxicity impact of production of these batteries. In terms of metal
inputs, the proposed system can avoid about 1.6 times of the metals used in LIB production,
primarily owing to the cascaded use pathway which avoids large PbA battery systems. The
proposed system can recover 12-44% of the initial cost of ownership of these batteries, however
there is immense uncertainty in this domain.
4.3.2 Policy Analysis
The results of the case study indicate that a circular economy waste management
hierarchy of reuse, cascaded use, recycling and ultimately landfill for EV LIBs would generally
be consistent with expectations of benefits – with the exception of EV reuse, which is still
technically unexplored and environmentally uncertain. However, given possibilities of economic
barriers for the cascaded use and recycling routes, effective policy mechanisms are needed to
encourage development of infrastructure to support this hierarchy, particularly when the
economics may not favor implementation. Table 4.2 analyzes current policy mechanisms at the
US and EU level that can impact EV LIB waste management in the future.

83
Life cycle stage Initiative Current policy that maybe extended for EV LIBs Future mechanisms
Battery/Vehicle production
Material selection BD: No restriction on LIB materials (i.e. considered non-hazardous) ELV: Limits use of hazardous substances in vehicles (doesn’t explicitly address EV LIBs) CA state classifies LIBs hazardous due to excessive levels of cobalt, copper and nickel
•Can possibly regulate some LIB materials such as Co, Ni and nano materials •Chemistry standardization to avoid EOL sorting
Design for EOL BD, ELV: Appliances or vehicles to be designed to facilitate battery/component removal BA: Mandates ease of battery removal (Policy does not cover LIBs)
•Design principles for ease of disassembly, repair, refurbishment and recycling of EV LIBs as part of regulations
Labeling or identification
BD: Labeling restricted to heavy material content (mercury, lead, cadmium) and landfill ban (crossed-out wheeled bin); capacity label non-mandatory ELV: material and component coding standards for identification CA,MN: Battery type (e.g. li-ion, NiCd, etc.) and note on recycling and safe disposal BA: Mandates labeling for battery type and recycling and safe disposal (but not LIBs)
•Specific labeling guidelines for LIBs: chemistry, capacity, LIB materials to facilitate sorting, remanufacturing and recycling. •Bar codes, RFID chips, specialized coloring for LIBs.
Use phase Repair or maintenance
EU Waste directive defines “waste hierarchy” wherein waste prevention through product lifespan extension precedes other EOL management routes
No current end of life battery policy mandates repair/battery maintenance to extend life
Collection Extended producer responsibility
BD: Collection financed by battery producers or third parties acting on their behalf ELV: EPR collection scheme applied to battery when collected with vehicle CA,NY, MN: retailer or battery manufacturer to provide for collection Call2Recycle: product stewardship program providing no-cost battery collection across U.S. and Canada funded by battery and product manufacturers
•Regulations to specify transfer of collection responsibility in case of reuse/cascaded use •In US states (NY, CA), collection programs are only for small, non-vehicular rechargeable batteries and may be expanded
Reuse/Cascaded use
Reuse/cascaded use provision
BD: Reuse or cascaded use not defined ELV: Reuse of vehicle component defined as use in same application; cascaded use in another application not defined; Mandates safe stripping operations, storage and testing to ensure suitability of vehicle component reuse (can include EV LIBs) CA: mentions "reuse"; not explicitly defined for LIBs
•Battery testing guidelines •Prioritize second applications based on techno-economic analysis from national labs in the U.S. •Economic incentives for reuse/cascaded use • Safety laws for large cascaded use installations
Recycling Targets and process guidelines
BD: 50% recycling efficiency and rules for calculating the efficiency ELV, BD: Very brief guidelines for dismantling, storage and handling of batteries (e.g. electrolyte removal, removal of metals and plastic, sorting etc.) •No recycling or process efficiency targets in U.S.
•Rules related to worker safety and exposure •More specific dismantling manuals for EV LIBs •Addressing cross-contamination or developing mixed stream LIB recycling techniques •Economic incentives to promote recycling •Recycling efficiency improvement
Incineration and landfill
Prohibition BD: Landfill and incineration prohibited ELV: Waste-to-energy and landfill of non-recycled vehicle components allowed CA,NY,MN: Landfill ban only (with ineffective or no penalty for non-compliance)
•Landfill ban to be extended to other US states •Awareness on landfill toxicity of LIB materials •Landfill tax, deposit-refund schemes, recycling incentives, differential taxation, etc.
Transport Shipping guidelines (listed as Class 9 Miscellaneous hazardous material)
BD: Waste batteries exported for recycling to comply with waste shipment laws •LIB transport regulated by U.S. Department of Transportation, U.S. Hazardous Materials Regulations, International Civil Aviation Organization, International Air Transport Association, International Maritime Dangerous Goods which provide packaging, labeling shipping and fire hazard prevention instructions
•National and international regulations governing LIB transportation can be extended to waste LIBs and EOL battery management laws would mandate compliance •Specific guidelines for large size EOL EV LIBs
Table 4.2 Current policies governing LIB EOL management and future policy mechanisms. BD: EU Battery Directive; ELV: EU end-of-life vehicle
directive; NYS: NY Rechargeable Battery Recycling Act (2010); CA: California’s Rechargeable Battery Recycling Act (2006); MN: Minnesota Rechargeable
Batteries and Products law (1994); BA: Federal Mercury-Containing and Rechargeable Battery Management Act of 1996

84
The EU Battery Directive (BD) which regulates the disposal of all battery types
categorizes EV batteries as “industrial batteries” (European Commission, 2006) and is expected
to include special provisions for EV LIB EOL management, unless an independent EV battery
regulation is introduced. The EU EOL vehicle (ELV) directive provides guidelines for collection
and EOL management of vehicle and their components (EU, 2000) and can be further expanded
to include specific provisions for EOL EV LIBs. At the US level, the Mercury-Containing and
Rechargeable Battery Management Act of 1996 (US GPO, 1996) (Battery Act [BA]) mandates
that all recognized batteries (mercury-based, nickel-cadmium, and PbA) are to be considered
hazardous waste and fall under the standards for Universal Waste Management. The Battery Act
mandates guidelines for disposal of PHEV batteries but since the EPA Universal Waste Rule
does not consider LIB materials to be hazardous, these batteries are excluded. However, the
regulatory system could be adapted to include LIBs anticipating the sheer volume of retired EV
LIBs. Only three US states have rechargeable battery waste management regulations that
incorporate LIBs- California’s Rechargeable Battery Recycling Act of 2006 (CA Code, 2006),
New York State Rechargeable Battery Law (2010) and Minnesota Rechargeable Battery and
Products Law of 1994 (MN PCA, 2015).
While the current policy landscape governing EOL batteries traverses through the entire
battery life cycle (Table 4.2), mechanisms specific to EV LIBs would be required to handle the
volume and complexity of this waste. Table 4.2 highlights future regulatory mechanisms that
integrate the proposed waste management hierarchy with a life cycle approach, considering that
product design and manufacturing are also integral stages in planning a circular system (Ellen
MacArthur Foundation, 2013; Allwood et al., 2012; Allwood et al., 2011; Gregson et al., 2015;
Bakker et al., 2014). Specific mechanisms are discussed across different stages of the LIB life
cycle, including battery and vehicle production, battery use, EOL collection, reuse and cascaded
use, recycling and landfill as well as transport of EOL batteries to enable their environmentally
sound management:
Battery/Vehicle production: Initiatives for environmentally safe and convenient EOL
management can be introduced at the point of LIB and vehicle production. Some examples
include use of safe LIB materials and regulation of possible hazardous substances in EV LIBs,
labeling requirements for easy identification and sorting of LIBs at their EOL as well as adopting

85
design-for-EOL (DfE) principles. DfE would enable easy removal of LIBs from EVs, facilitate
battery disassembly, refurbishment, and material recovery (Arbabzadeh et al., 2016). These
design principles can include modular battery pack design, use of compatible materials such as
consistent grades of plastics, chemistry standardization, avoiding welded or soldered connections
and minimizing the overall number of pack components (Chiodo, 2005). In this direction, The
US Advanced Battery Consortium (USABC) is working on design-for-recycling guidelines for
auto makers (USABC, 2014). The recommendations provided by USABC would require
collaboration between battery designers and vehicle manufacturers as well as feedback from
battery recyclers and vehicle dismantlers. The design elements proposed by the Consortium are
specifically aimed to guide the battery-EV system designers and engineers. Some specific
recommendations include (USABC, 2014):
1. Ease of removal: Suitable location of the battery in the vehicle with minimum number of
similar fasteners for ease of removal from the vehicle, along with a “distributed system design”
to allow easy separation from other system components such as BMS, etc.
2. Ease of disassembly of overall system: Assembly of the battery pack with minimum number
of fasteners and of the same types, minimum use of adhesives, and avoiding incompatible
adhesives and thermosets.
3. Safe removal: System design to allow for a complete and safe procedure to disconnect the
high voltage contact points of the battery pack.
4. Chemistry identification: Easy identification of battery chemistry on the system as well as on
individual modules, as per Society of Automotive Engineers (SAE) guidelines
5. Safe and easy removal of individual modules: Design of modules to enable maximum voltage
to be less than 60V DC to reduce risks during disassembly. Moreover, enable modules to be
easily disconnected without compromising on battery life

86
6. System Durability: Robust and long-lasting battery jacket (outer pack) design to enable reuse
and refurbishing
7. Fluids management: Design of the system allowing easy removal of fluids such as electrolytes
and coolants used for thermal management.
8. Ease of recycling: Battery pack using minimum number of different types of plastic materials
and including appropriate labeling to separate plastics into different recycling streams.
Additionally, allowing metals, plastics, electronics, and cells to be easily removed and sorted
into designated recycling streams
Use phase: Currently none of the battery waste policies at the US or EU level emphasize
maintenance or repair of batteries to extend their lifespan during the first use phase. Only the EU
Waste Framework Directive has outlined a waste management hierarchy wherein waste
prevention through product lifespan extension precedes reuse, recycling, energy recovery and
disposal (European Parliament, 2008). Future waste policies can include specific guidelines
towards ensuring a longer lifespan of LIBs in EV use owing to the expected lifespan mismatch
between EVs and their batteries as indicated by Richa et al. (2014). Consumer awareness and
education are likely to be incorporated into these guidelines.
Collection: At the EU level, effective extended producer responsibility (EPR)
mechanisms are in place to ensure collection of waste batteries. The EU Battery Directive
requires battery producers, or designated third parties, to finance collection, treatment and
recycling of EOL batteries (European Commission, 2006). Under the ELV directive, EPR
collection schemes apply only to vehicle components such as batteries and accumulators
collected along with scrapped vehicles (EU, 2000). In the US, EPR mechanisms for LIB
collection exist only in California, New York, and Minnesota wherein battery manufacturers or
retailers must provide consumers with a free system for returning these batteries at EOL (CA
Code, 2006; New York State Rechargeable Battery Law, 2010; MN PCA, 2015). Only
Minnesota has set collection targets (90%, non-mandatory) for EOL rechargeable batteries and
addresses EV LIBs by mandating EV and battery manufacturers to jointly manage EOL batteries

87
(MN PCA, 2015). New York and California laws and voluntary collection schemes in the US
such as Call2Recycle are restricted to batteries from consumer electronics and exclude larger
vehicle batteries (Call2Recycle, 2015). Hence US regulations need to be expanded in scope due
to the large volume of retired EV LIBs expected. New regulations would be required to specify
transfer of collection responsibility in case of reuse or cascaded use of EV LIBs.
Transport: LIBs are listed as Class 9 Miscellaneous hazardous material (Mikolajczak et
al., 2011), and there are specific shipping, packaging and labeling guidelines for these batteries
for transporting them domestically or internationally across various means of transport (Table
4.2). One major concern is the “thermal runaway” of LIB cells causing self-ignition leading to
safety hazards (Webster, 2010). It is likely that different waste regulations that would govern
EOL LIB management would mandate compliance to these guidelines and associated restrictions
while transporting these batteries. For example, the EU Battery Directive mandates that waste
batteries when exported for recycling should comply with waste shipment laws (European
Commission, 2006). Additional safety requirements are expected for transport of retired EV
LIBs owing to their large size, which may increase the cost of management of these batteries.
As per new regulations issued by the US Department of Transportation’s [USDOT],
Pipeline and Hazardous Materials Safety Administration [PHMSA], LIB packages transported
by ground are required to be marked and labelled in the same way as for air shipments in
accordance with International Civil Aviation Organization’s standards (USDOT, 2014; Legal
Information Institute, 2015). Currently, the transportation regulations provide specific guidelines
for shipping LIBs or their cells and mandate limitations over the number of cells or batteries per
package, package weight and packaging types for specific Watt-hour rating for these batteries
(Legal Information Institute, 2015). Proper labeling in terms of Watt-hour ratings as well as
lithium content and hazard communication are outlined by these regulations. There are additional
requirements for shipping damaged or defective cells or batteries pertaining to labeling and
packaging, which may apply for EOL EV LIBs as well, unless a separate regulation governs the
latter. Currently, the USDOT prohibits the shipping of damaged, defective or spent LIBs meant
for recycling by air transport. However, special permits are provided to LIB recyclers to
transport used LIBs for recycling through highway, rail or vessel transport (USDOT, 2015). Such
permits mandate United Nations (UN) specified packaging guidelines to prevent damage to cells

88
and short circuiting and require special labeling to indicate that the used batteries are meant for
recycling. Moreover, some of the testing requirements and shipping documentation needed for
transporting new LIBs are waived in special provisions of such permits. Additionally there are
weight and Watt-hour limitations in such permits, for e.g. a 2015 USDOT permit for Retriev
Technologies allows a maximum Watt-hour rating of 300 Wh per battery and limits the
maximum gross weight of packages to 30 kg for transporting used LIBs for recycling (USDOT,
2015). Such permits are specific to recycling companies and as large sized EV LIBs are
commercially recycled, new standards and guidelines may be needed to promote their safe
transport.
Reuse and cascaded use: Considering the environmental benefits and possible cost
savings for EV owners and the utility sector as demonstrated by the case study, it is prudent to
consider these batteries for reuse and cascaded use prior to sending them to the next levels of the
waste hierarchy. However, cascaded use is severely underrepresented in policies analyzed. While
the ELV directive defines “reuse” of vehicle components for use in the same application, the
more specific Battery Directive is only focused towards safe disposal and recycling of batteries
(European Commission, 2006). 50% of currently in-use PHEV batteries in California can
provide 850 MWh of energy storage capacity after retiring from vehicle application (Elkind,
2014). Waste management policies in the US do not explicitly address battery reuse or cascaded
use, and second-life EV LIBs are currently not part of incentive programs or tax credits for grid
or onsite energy storage systems in the US. To promote these reuse/cascaded use applications,
future regulations can mandate battery testing protocols for specific applications and create
economic incentives (such as tax rebates) for these pathways. Additionally, guidelines for
automotive reuse and stationary application prioritization for second use LIBs based on the
battery type (i.e. large BEV vs. small short range-PHEV battery; high energy vs. high power
LIBs) and techno-economic assessments made by national laboratories in the US (Cready et al.,
2003; Neubauer and Pesaran, 2011; Neubauer et al., 2012) can be provided. Such guidelines
would enable diversion of these batteries towards appropriate extended life applications. Apart
from regulatory deficiencies, possible regulatory barriers would govern siting of large stationary
energy storage systems due to safety and environmental health concerns of second-life batteries
(Elkind, 2014).

89
Recycling: Results suggest that recycling should be considered after exploring cascaded
use options for EV LIBs. A well-established EPR network can incentivize recycling of EV LIBs
that have undergone cascaded use, since some of the revenue from utility scale operations could
bear the burden of their EOL management. The major focus of commercialized LIB recycling
operations has been on cobalt recovery from consumer electronics batteries (Wang et al., 2014b).
As suggested here, high costs of LIB recycling may provide small to no economic incentive from
recycling non-cobalt chemistries such as LMO batteries. If the cells were composed of NMC
cathode chemistry instead of LMO, the gross estimated value obtained from recycling these
cells becomes more than two-fold (~340,000 USD) owing to high market value of cobalt and
nickel (USGS, 2015). Hence, technical advancements to improve recycling processes,
regulations to encourage EV LIB collection to promote economies of scale (Wang et al., 2014b)
and incentives and rebates are needed to encourage recycling of low material value LIBs. The
EU battery directive has recycling efficiency mandates of 50% for batteries including LIBs but
no legislation within US provides process targets. Owing to expected variability in chemistry and
composition of EV LIBs, their recycling will need to avoid cross contamination or develop
recycling procedures to process different LIB chemistries simultaneously. The Society of
Automotive Engineers in the U.S. and EUROBAT in the E.U. have established active working
groups to develop solutions for battery labeling and to prevent cross contamination in LIB
recycling streams (Gaines, 2014).
Apart from policy deficiencies, LIB recycling can face regulatory hurdles due to
workplace exposure to LIB materials during battery disassembly and shredding (Wang et al.,
2015). The ELV directive provides generic guidelines for dismantling, storing and handling
vehicle batteries but does not address issues specific to LIBs. Majority of LIB cathode and
electrolyte materials have OSHA hazards associated with them (Vimmerstedt et. al., 1995) which
may require workplace regulations for LIB recycling facilities, further raising the cost of
recycling operations.
Landfill: While the share of EV LIB waste ultimately reaching the landfill was estimated
at 70% of the entire waste stream, the cost of landfill was estimated to be less than even the most
conservative cost of recovering 30% of these materials. Preliminary TCLP analysis of bulk of
LIB metals (Table 4.1) suggests that metal concentration in LIB leachate could exceed the US

90
Primary and Secondary Drinking Water Standards (US EPA, 2009), as well as the EU Drinking
Water Directive and World Health Organization’s guideline limits (European Union, 1998;
WHO, 2008). If the landfill leachate from LIBs were to contaminate the groundwater, it could
pose a potential threat to human health and environment.
Hence, appropriate landfill tax and widespread and stringent landfill bans are required.
Based on the regional tipping fee and the expected EV LIB waste disposal for specific states,
regional variability is expected in LIB landfill disposal expenses. Differential landfill tax can be
introduced based on increasing LIB waste tonnage for a given region. Economic instruments to
encourage LIB recycling, such as deposit-refund schemes (Walls, 2006), or incentivizing
recycling can prevent non-compliance to landfill bans. Additionally, improved recycling
efficiencies of LIB metals and recycling currently non-recovered LIB components such as
electrolyte, graphite, and plastics (Richa et al., 2014) is needed.
4.4 Conclusion
A circular economy-centric waste management hierarchy can be effective in managing
the EV LIB waste stream in future, but uncertainties exist over its eco-efficiency. Both EV LIB
reuse and cascaded use have potential for providing environmental benefits. However such
benefits rely significantly on LIB size, testing procedures, and the incumbent battery systems
that used LIBs would displace. While there is potential for these extended life pathways to
provide EV owners and the utility sector with cost-effective batteries, such cost savings would
depend on future prices of new and old EV LIBs, stationary energy systems that these batteries
are replacing, and regulatory barriers due to environmental health and safety concerns. Results
indicate that a “closed” circularity of LIBs in the same EV product is less desirable than a more
“open” loop cascaded use into stationary applications, which is contrary to typical results
expected from a circular economy model. The expected benefit from cascaded use pathways of
EV LIBs calls for policies and economic incentives to preferentially promote cascaded use over
recycling across a waste management hierarchy. Additionally, environmental benefit from LIB
recycling should stimulate policies to promote profitable recycling operations and avoid battery
landfill through extensive collection programs, improved recovery efficiencies and economic
incentives. Additional policy may be needed to promote worker health and safety and ease of
recycling.

91
Considering the large fraction of EV LIB material flows into landfill, policy mechanisms
are needed to implement effective and widespread landfill bans and stringent landfill penalties to
improve the circularity of the proposed system. The proposed waste management hierarchy can
be instrumental in diminishing eco-toxicity impacts over this extended EOL phase of EV LIBs,
considering reuse and cascaded reuse of EV LIBs, followed by recycling can negate the eco-
toxicity burden of unavoidable metal flows into landfill. A comprehensive life cycle based
approach that additionally considers design for EOL, battery maintenance, collection and safe
transport of EOL EV LIBs would prove effective in developing policy instruments that promote
a circular waste management system.

92
CHAPTER 5: CONCLUSION AND MAJOR CONTRIBUTIONS
The adoption of electric vehicle has been gradually increasing with time (Inside EVs,
2015), and this trend shows promise towards reducing dependence on fossil based transportation
fuels. However, increasing adoption of EVs in future would be accompanied with large scale
production of LIBs to power these vehicles and a waste management problem when these
batteries reach their end-of-life in vehicle application. Hence, sustainable waste management
strategies and related policy framework is required to handle this battery waste stream in future.
To gain a better understanding of the scale at which EOL battery recycling infrastructure
must be developed in future, Chapter 2 demonstrated a future oriented top-down material flow
analysis (MFA) to estimate the volume of EOL EV LIBs generated in the near and long term
future. Owing to the potential “lifespan mismatch” between battery packs and the vehicles in
which they are used, both reuse and recycling potential exists for these batteries in future. In fact,
there is a possibility that 37% to 43% of LIBs will be reused in vehicle applications itself. The
commodity value of materials contained in the future EV LIB waste stream will vary with
cathode chemistry composition of the stream. Cost efficient recycling processes will be needed
for currently non-recycled materials like lithium and manganese as automotive manufacturers are
transitioning to low cost EV LIBs. In terms of recycling, the actual economic value of EV battery
recycling would depend on the LIB collection rates and recovery rates of the various materials
present in the stream. Moreover, safe disposal of low value battery materials will be required
owing to their large volumes in the waste stream. Due to the high tonnage and material
variability expected in the LIB waste stream in future, LIB recycling infrastructure must be able
to handle the scale as well as complexity of this waste stream.
Chapter 2 additionally demonstrated the uncertainties encountered in conducting dynamic
MFA of emerging technologies which is inherent in the emerging field of industrial ecology. For
the MFA model it is assumed that the material composition of the four battery technologies
remain the same over the temporal boundary of the analysis. Future work can look at how the
flows can possibly vary, as the specific energy of LIBs improves with time, thus possibly
reducing the material input per battery pack over the next decades. Additionally, inclusion of
novel battery technologies in the model, such a lithium-air and LIBs containing nano materials
can provide a more enhanced picture of the impact of technological progress on the battery

93
outflows from EOL EV LIBs. In this Chapter, a hypothetical lifespan distribution of EV LIBs
was assumed owing to lack of current data, while the lifespan of EVs was considered to be
constant. Currently both the batteries and EVs are in their early stages of adoption. As more data
becomes available in terms of aging and obsolescence of the two different components of this
dual product system, more refined estimates of future battery outflows can be obtained. While it
is acknowledged that the forecasts in Chapter 2 exhibit significant uncertainty at early stages of
technological deployment, it provides the very first estimate of waste battery outflows as well as
a robust modeling framework for extended analyses as these data uncertainties are resolved in
future. The MFA framework adopted in Chapter 2 additionally provides a model case study for
analyzing waste outflows for other dual-product systems similar to the EV-LIB system.
Chapter 3 demonstrated that cascaded use of retired EV LIBs in stationary application
exhibits environmental trade-offs due to impact of LIB refurbishment and charge-discharge
efficiency losses and the credits obtained from avoiding the manufacturing and use of incumbent
PbA batteries. The environmental feasibility of such second use systems would depend on reuse
feasibility of LIB cells and their reliability to provide competitive service life in stationary
applications. This is owing to the direct effect of these technical parameters on the refurbishment
stage. While low cell conversion for stationary application implies more LIBs would be
transported and tested for capacity and electrical performance, a small service life of refurbished
cells would require multiple battery replacements for the stationary energy storage system. In
general, results in Chapter 3 demonstrate that EV LIB reuse in stationary application has the
potential for dual benefit – both from the perspective of offsetting initial manufacturing impacts
by extending the lifespan as well as avoiding production and use of a less-efficient PbA battery.
However, these benefits can diminish when very few of the initial battery cells and modules
could be reused and where reliability is low (e.g., 1 year or less lifespan) in the secondary
application.
It is concluded that reuse decisions and diversion of EV LIBs towards suitable stationary
applications can be based on life cycle-centric studies. For example, retired EV LIBs with high
cell conversion rate but short stationary service life would still prove environmentally feasible to
employ in less intensive stationary storage or ad-hoc applications. These can include less
frequently needed (~twice per year) power back up systems such as those for telecommunication
applications (Cready et al., 2003). In such sporadic use applications, the remaining LIB cycles

94
can be spread over a larger time frame, which could raise their preference over current PbA
batteries. This preference would be additionally substantiated owing to a much higher
temperature sensitivity of PbA batteries in these applications which accelerates their aging
process and reduces their calendar life (Cready et al., 2003). Chapter 3 further suggests that
technical feasibility must be evaluated, particularly with respect to the ability to rapidly analyze
the reliability and remaining cycle life of EV LIB cells, modules, or packs for refurbishment and
reuse in secondary applications. While LIB lifespan extension through stationary reuse would
delay the entry of EOL EV LIBs into the waste stream, a sustainable market for used EV
batteries would rely on economic motivation, technical feasibility and stakeholders’
acceptability- factors which need to be further analyzed.
Apart from outlining these imminent issues, Chapter 3 strengthens the knowledge of
battery LCA since inclusion of a second use phase in LIB lifespan provides a comprehensive
assessment of their environmental implications in future in contrast to previous studies (Majeau-
Bettez et al., 2011; Notter et al., 2010; Zackrisson et al., 2010; Samaras and Meisterling, 2008;
Ishihara et al., 2002; Hawkins et al., 2013; Matheys et al., 2009, Ellingsen et al., 2013) which
were limited to the production and EV use of these batteries. A major modeling challenge
addressed was the allocation of impacts between the EV and stationary use phases of EV LIBs.
These allocation strategies can be applied to other LCA models investigating product use
cascades, which have till now received limited attention in the LCA realm. The choice of
allocation method will guide LCA outcome and can pose a major challenge towards
environmental assessment of these systems. For the EV LIB cascaded use system, the selection
of allocation method can likely depend on the battery ownership model and responsibility for
their EOL management across various stakeholders involved such as battery material producers,
battery producers, vehicle producers, vehicle dealers, vehicle treatment operators, and utility
providers.
While a cascaded used EV LIB system was compared to lead acid battery in Chapter 3,
the environmental feasibility of these systems additionally needs to be analyzed in comparison to
other prominent and upcoming battery technologies for utility applications, particularly redox
flow batteries and high temperature sodium batteries. Additional research is required to
understand how retired EV LIBs compare to new LIBs for stationary applications, in terms of
cost, performance as well as the net environmental impacts. While a generic stationary
95
application was analyzed for environmental feasibility of EV LIBs, future work can possibly
compare the environmental impacts of the cascaded use route across a wide range of grid-based
and off-grid stationary applications, including high power and high energy applications such as
power back-up, renewable firming, load leveling, transmission support etc. as elaborated in
Cready et al. (2003). Each of these applications has different depth-of-discharge of operation,
frequency of use and system lifespan and hence their comparison is a challenge, though
necessary from a feasibility perspective.
In Chapter 4, an eco-efficiency analysis was conducted to analyze the possible
environmental and economic costs and benefits of different EOL management routes for EV
LIBs, along a circular economy inspired waste management hierarchy. Results indicated that if
technology and markets support reuse of LIBs in used EVs, the net benefit would be 200,000 MJ
of recouped cumulative energy demand (CED), which is equivalent to avoiding the production of
11 new plug-in EV batteries (18 kWh capacity each). Avoiding production of replacement LIBs
for EV applications also promises benefit of reduced eco-toxicity and metal depletion. These
benefits are magnified almost ten-fold when retired EV LIBs are cascaded in a second use
application for stationary energy storage, thereby replacing the need to produce and use less
efficient lead-acid batteries. Reuse and cascaded use routes can likely provide EV owners and
the utility sector with cost savings of as high as 1.7 million and 600,000 USD, respectively for
the analyzed waste stream. Since, both reuse of EV LIBs in vehicle application and cascaded use
in stationary energy storage provide scope for environmental impact reduction and cost savings,
recycling should not be the first option for EOL management route for these batteries until their
reuse and second use potential have been explored. However, the environmental benefit from the
reuse and second use pathway are likely to depend on: (a) the refurbishment procedure-whether
the feasibility analysis of these LIBs employ testing of individual cells or testing of whole packs,
and (b) the avoided battery system that these reuse and cascaded use systems are being compared
to while calculating the environmental benefits. Similar uncertainty exists in terms of the
economic gains for these EOL routes owing to speculation of future new and used EV LIB prices
and the cost of the avoided battery system being compared (e.g. lead acid battery in the case
study in Chapter 4).
For the waste stream composed of Lithium Manganese Oxide EV LIBs analyzed in
Chapter 4, recycling pathway provided little (240,000 USD for the analyzed waste flow) to no

96
economic benefit owing to the high costs of recycling operations. However, recycling of these
batteries for metal recovery has tremendous potential for environmental savings by avoiding the
mining and production of primary metals. There is no environmental or economic benefit from
the landfill of EV LIBs, hence landfill disposal should be the last resort during their EOL
management. In fact, the landfill pathway is expected to account for 69% by mass of the EV LIB
waste flows in a given year- both due to recycling inefficiencies of metals and also due to the
large fraction of low value, non-recyclable materials in the stream as also exhibited in Chapter 2.
Owing to the expected benefits-environmental or economic or both for reuse, cascading
use and recycling of EOL EV LIBs, a waste management hierarchy needs to be adopted for
sustainable management of this waste stream in future. Such a hierarchy would enable all
possible beneficial waste management strategies to be explored before sending these materials
for waste disposal, thus attempting to close the loop for a large fraction of the waste flows.
However, the current policy landscape does not encourage reuse or cascaded use of these
batteries and have ineffective regulations for encouraging material recovery and compliance to
landfill bans. The expected benefit from reuse and cascaded use pathways of EV LIBs can
stimulate future policies aimed towards promoting battery design-for-EOL, collection for reuse
and cascaded use, reliable and cost-efficient testing procedures as well as economically and
technically favorable second use pathways. In case of environmentally favorable but
economically infeasible second use routes, economic incentives maybe introduced to
preferentially promote the second use over recycling across a waste management hierarchy.
It is expected that the large environmental benefit from LIB recycling should stimulate
policies to promote widespread EV LIB collection programs, profitable recycling operations and
technical advancements to achieve higher recycling rates and efficiencies. These policy
mechanisms would be specifically required for non-cobalt containing, low material value EV
LIBs, such as those composed of Lithium Manganese Oxide and Lithium Iron Phosphate.
Currently, in US only the states of California, New York and Minnesota have imposed landfill
bans for LIBs. However, most battery collection programs in US exclude large sized vehicle
batteries, which can lead to violation of the lenient landfill disposal bans. The high volume of EV
LIB landfill waste accompanied with eco-toxicity impacts of metals leaching in landfill would
call for policy mechanisms to implement effective and widespread landfill bans and stringent
penalties based on volume of landfill waste generated. The results of the eco-efficiency analysis

97
and the wide gaps in the current policy landscape demand a more robust EV LIB waste
management policy framework in future that can likely be based on a life cycle based model.
Moreover, these findings underscore the importance of life cycle and eco-efficiency analysis to
develop proactive policies for improving the “circularity” of the proposed system.
The circular economy inspired waste management hierarchy model presented in chapter 4
can be further expanded in future work to develop a decisions analysis tool, where the different
inputs to the model can be changed to understand the eco-efficiency of the proposed system
under a range of scenarios. Currently immense uncertainty exists about the cost of new and
refurbished EV LIBs in the future as well as pertaining to the cost of operation of future
recycling facilities. Similarly, the battery collection and landfill operation costs can vary within
different states in the US. Additionally, for an analyzed waste stream of EV LIBs, the chemistry
mix is highly uncertain. The dynamic model can be used to capture these uncertainties and
variability. Apart from CED, metal depletion and eco-toxicity a set of other environmental
metrics can be incorporated in the model, depending on what the stakeholders deem important
for their analysis and decision making.

98
APPENDIX A
S1. List of parameters
Parameter Description
t A given year. For EV battery inflow, t= 2009 to 2035; For EV battery outflows, t=2015 to 2040
l EV LIB lifespans (Scenario based): Refer to figure 2.3 in Chapter 2
Pl Percentage of EV LIBs sold in a given year to have a lifespan of l years (Scenario based):
Refer to Figure 2.3 in Chapter 2
K EV LIB inflow (i.e. LIB input into EVs)
i EV type: BEV, PHEV10, PHEV40, and HEV
S Sales of new EVs that use LIBs
W Non-EOL EVs requiring a replacement LIB
B Number of LIB packs in EV battery waste stream
PEi,t Percentage of waste LIB packs belonging to EV type i in year t: (Bi,t/Bt)
j LIB cathode chemistry: Lithium cobalt oxide (LiCoO2), lithium manganese oxide (LiMn2O4),
lithium iron phosphate (LiFePO4) and lithium nickel cobalt manganese (NCM) oxide
PCj Percentage of LIBs of cathode chemistry j in EV battery waste stream: 10% LiCoO2, 30%
LiMn2O4, 30% LiFePO4, and 30% NCM
D Number of cells per EV LIB pack
Epack EV LIB pack energy storage (Watt-hour)
R Electric range of EV (miles): 100 miles for BEV; 40 miles for PHEV40; 10 miles for PHEV10
and 4 miles for HEV
C EV energy consumption rate (Watt-hour/mile)
𝜂 Percent efficiency of EV LIB
A Percent available energy of the total EV LIB energy
Ecell Lithium ion cell energy storage (Watt-hour)
N Number of lithium ion cells in EV battery waste stream
y Materials in lithium ion cell: Aluminum, cobalt, copper, lithium, manganese, nickel, steel, iron,
graphite, carbon black, binder, plastic, electrolyte, others
m Material mass in lithium ion cell
MI Material mass of EV LIB inflows
MO Material mass of EV LIB outflows
g EOL EV battery type based on reuse potential: Type 1 and Type 2 EOL LIBs
Table S1.1 List of MFA parameters
S2. Lithium ion battery use in hybrid electric vehicles
Estimates from Jobin et al. (2009) for a Credit Suisse report were applied to the scenarios, as
their study provided both conservative as well as optimistic estimates for hybrid electric vehicle
(HEV) lithium ion battery (LIB) adoption in comparison to HEV Nickel metal hydride (NiMH)
battery usage.

99
S2.1 Credit Suisse bottom-up HEV LIB penetration estimates
Table S2.1 Market Volume by battery technology (LIB+NiMH) (Adapted from Jobin et al., 2009)
The high and baseline scenarios employed Credit Suisse bottom-up estimates which are more
optimistic towards HEV lithium ion battery adoption. These estimates were available till year
2020. Even though, these estimates suggest market share of different electric vehicle (EV)
technologies in the future, they have only been used in our study as a basis for calculating the
percentage of HEVs using lithium ion battery technology as opposed to nickel metal hydride
technology. For market share of different EV technologies, the Energy Information
Administration (EIA) Annual Energy Outlook estimates were employed. It was additionally
assumed that all HEVs would use lithium ion batteries by year 2015 and 2025 in the high and
baseline scenarios, respectively. The HEV lithium ion battery adoption rates for year 2014 for
high scenario and for years 2021-2024 for the baseline scenario were estimated by means of
linear interpolation.
S2.2 Credit Suisse top-down HEV LIB penetration estimates
% HEVs using Li-ion (vs. NiMH)
2009 1%
2015 27%
2020 62%
2025 72%
2030 82%
Table S2.2 Percent HEVs using LIBs
The Credit Suisse top-down estimate for HEV lithium ion battery adoption were used for the low
scenario, with the additional assumption of hundred percent lithium ion battery adoption by
HEVs in the year 2032. This assumption was based on the forecasted HEV adoption rate using
the forecast function in excel as the Credit Suisse top-down estimates were only available till
Year LIB HEV (LiB+NiMH HEV)
% HEVs using LIBs= LIB
HEV/(LIB+NiMH HEV)
2009 0% 100% 0%
2010 4% 98% 4%
2011 11% 95% 12%
2012 18% 93% 19%
2013 31% 91% 34%
2014 39% 89% 44%
2015 45% 86% 52%
2016 50% 83% 60%
2017 52% 80% 65%
2018 53% 76% 70%
2019 53% 72% 74%
2020 51% 68% 75%

100
2030. Moreover, as this data was available for every five year, the data gaps were estimated by
means of linear interpolation.
The percent of HEVs using lithium ion batteries for a given year was multiplied with the HEV
sales forecast for that year to yield the number of HEVs using lithium ion batteries in that year.
S3. Cell energy storage
Energy storage of 18650 (cylindrical) form factor lithium ion cells for the four battery
chemistries was obtained as the product of cell capacity and the nominal or average cell voltage.
The cell capacity (mAh) was estimated as the product of the cathode mass and the specific
capacity (mAh/g) of lithium ion cells for each of the four cell chemistries considered in the
model. The specific capacity of the lithium ion cells was obtained from Dahn and Erlich (2011).
The cathode mass of each of the cell types was estimated from their respective bill of materials.
A sample calculation for estimation of cathode mass of cylindrical LiFePO4 cells is shown.
For LiFePO4:
Li - 1 mole = 6.94g
Fe - 1 mole = 55.845g
P - 1mole = 30.974g
O - 1mole - 15.99g * 4 moles = 63.96g
Total molar mass of LiFePO4 = 157.719g
So the mass percentage of each element in the structure would be:
Li - 6.94g/157.719g = 4.4%
Fe - 55.845g/157.719g = 35.4%
P - 30.974g/157.719g = 19.6%
O - 63.96g/157.719g = 40.6%
From the bill of materials of LiFePO4 cells,
Mass of lithium in a 18650 cell = 0.51 g
Mass of iron in a 18650 cell = 4.11
Hence mass of cathode active material of LiFePO4 cell = (0.51/0.044) g or (4.11/0.354) g
= ~ 11.60 grams
In a similar way, the mass of the cathode active materials of cylindrical lithium ion cells of other
chemistries was calculated. The following table describes the calculation of cell energy from
cathode mass, specific capacity and cell voltage of lithium ion cells:

101
Cathode Chemistry Cathode
mass (g)
Specific
Capacity
(mAh/g)
Cell Capacity
(Ah)
Average/Nominal
Cell Voltage (V)
Cell
Energy,
Eci (Wh)
Lithium Cobalt Oxide
(LiCoO2)
13.25 155 2.05 3.84 (Howard &
Spotnitz, 2007)
7.89
Lithium Manganese Oxide
(LiMn2O4)
15 115 (Average) 1.72 3.86 (Howard &
Spotnitz, 2007)
6.65
Lithium Iron Phosphate
(LiFePO4)
11.60 160 1.86 3.25 (Burke &
Miller, 2009)
6.04
Lithium Nickel Cobalt
Manganese Oxide
(Li(NiMnCo)O2)
14.65 160 (Average) 2.34 3.60 (Burke &
Miller, 2009)
8.44
Table S3.1 Cell energy of 18650 form factor lithium ion cells
As a result of the assumptions and calculations documented here in Section S3 and in the
Chapter 2, the total number of cells for each scenario and each type of battery pack was
determined.
Table S3.2 Number of cells per EV lithium-ion battery pack
Scenario
Cathode
Chemistry
No. of cells per
BEV battery
pack
No. of cells per
PHEV10 battery
pack
No. of cells
per PHEV40
battery pack
No. of cells
per HEV
battery pack
Low
LiCoO2 3,700 420 1,700 450
LiMn2O4 4,400 500 2000 530
LiFePO4 4,900 550 2,200 580
Li(NiMnCo)O2 3,500 390 1,600 420
Baseline
LiCoO2 5000 560 2,300 680
LiMn2O4 5,900 670 2,700 800
LiFePO4 6,500 740 2,900 890
Li(NiMnCo)O2 4,600 530 2,100 630
High
LiCoO2 6,500 750 3,000 1,000
LiMn2O4 7,700 890 3,500 1,200
LiFePO4 8,500 980 3,900 1,400
Li(NiMnCo)O2 6,100 700 2,800 980

102
S4. Bill of materials of lithium ion cells (18650 form factor)
The bill of materials of 18650 form factor lithium ion cells was obtained from Wang et al.
(2014a) for the 4 cathode chemistries.
LiCoO2
(LCO)
LiMn2O4
(LMO)
LiFePO4
(LFP)
Li(NiMnCo)O2
(NCM)
Material, y
(grams)
Aluminum 2.40 0.50 2.76 2.22
Cobalt 7.97 0.00 0.00 4.08
Copper 3.36 0.50 3.45 3.29
Lithium 0.94 0.69 0.51 0.48
Manganese 0.00 9.11 0.00 3.81
Nickel 0.56 0.00 0.00 4.07
Steel 7.60 7.35 14.18 7.31
Iron 0.00 0.00 4.11 0.00
Graphite 10.64 15.00 5.50 7.26
Carbon
black 2.78 0.00 0.99 2.55
LiPF6 1.71 0.00 0.49 2.05
Ethylene
Carbonate
(EC) 0.43 0.15 3.42 0.51
Binders 1.11 0.00 0.39 1.02
Plastics 2.20 9.00 1.86 1.33
Other 4.33 2.38 4.65 2.22
Total 46.01 44.69 42.31 42.20
Table S4.1 Bill of materials of lithium ion cells (18650 form factor)
S5. Electric vehicle consumption rate
The energy consumption rates of electric vehicle models in the recent years (according to EPA
tests), and assumptions documented in the literature have been listed in table S5.1. Based on
these values, the consumption rate of EVs was assumed to be 250 Wh/mile, 300 Wh/mile and
350 Wh/mile for the low, baseline and high scenarios, respectively.

103
EV type Vehicle consumption rate
(Wh/mile)
Reference
2012 Chevrolet Volt PHEV 360 U.S. EPA and U.S. DOE
(2013)
PHEV20 360 Parks et al. (2007)
Industry standard of typical EV 350 Richter et al. (2008)
PHEVs 340 Denholm and Short (2006)
2011 Nissan LEAF BEV 340 U.S. EPA and U.S. DOE
(2013)
All EV types 300 Gaines and Nelson (2010)
2012 Mitsubishi i-MiEV BEV 300 U.S. EPA and U.S. DOE
(2013)
PHEVs 300 Nelson and Amine (2007)
2011 Tesla Roadster BEV 300 Van Haaren (2011)
BEV, PHEV 296 Reichmuth et al. (2012)
2012 Toyota Prius PHEV 290 U.S. EPA and U.S. DOE
(2013)
2006 electric vehicles 237 Wh/mile on test cycles
280 Wh/mile during use
Duvall & Knipping (2007)
BEV, PHEV 250-300 Chiang, Y. M. (2013)
PHEV 260 Marano & Rizzoni (2008)
PHEV40 250 Kang et al. (2011)
EVs in 2020 (default) 250 ANL BatPac Model (2012)
Compact EV 250 Denholm and Short (2006)
Table S5.1 EV energy consumption rate
S6. Electric vehicle LIB inflows and outflows
For the baseline scenario, the EV battery inflow (2009 to 2034) and EOL EV battery outflows
(2015 to 2040) for each vehicle type i (BEV, PHEV10, PHEV40, HEV) using the MFA model
was estimated.
S6.1 Annual inflow of LIB packs in EVs and annual outflow of LIB packs from EVs
The number of LIB pack input in EVs included batteries entering new EV as well as replacement
batteries for old EVs. The battery outflows were segregated into type 1 and type 2 EOL EV
batteries based on their reuse potential. As mentioned in the Chapter 2, Type 1 EOL batteries are
those that have reached their end-of-lives in EV application either before or coinciding with the
vehicles’ end of life while Type 2 EOL batteries are obtained from EVs that reach their end-of-
lives before their batteries. This modeling was conducted separately for each EV type (i) on an
annual basis as represented for the baseline scenario in the following tables.

104
BEV battery MFA: Baseline Scenario
Battery inflow Battery lifespan (years) Battery outflow
Year
Entering
new BEVs
Replacement in old BEVs
Total
input
LIBs in BEVs Year
BEV sales 6 8 10 12
EOL LIBs
from BEVs
Type 2 EOL
LIBs from BEVs
Type 1 EOL LIBs from BEVs
EOL batteries (1st battery)
EOL second
battery
10% 40% 40% 10%
2009 509 0 509 2009 509
2010 1,836 0 1,836 2010 1,836
2011 2,667 0 2,667 2011 2,667
2012 2,033 0 2,033 2012 2,033
2013 2,708 0 2,708 2013 2,708
2014 3,832 0 3,832 2014 3,832
2015 6,183 51 6,234 2015 6,183 51 51 0 51
2016 7,106 184 7,289 2016 7,106 184 184 0 184
2017 8,744 470 9,214 2017 8,744 267 204 470 0 470
2018 15,726 938 16,663 2018 15,726 203 734 938 0 938
2019 15,448 1,338 16,785 2019 15,448 271 1,067 204 51 51 204 1,847 305 1,541
2020 38,064 1,196 39,260 2020 38,064 383 813 734 184 184 734 3,033 1,102 1,931
2021 51,947 1,702 53,648 2021 51,947 618 1,083 1,067 267 267 1,067 4,369 1,600 2,768
2022 67,117 2,243 69,361 2022 67,117 711 1,533 813 203 203 813 4,276 1,220 3,057
2023 76,965 3,348 80,313 2023 76,965 874 2,473 1,083 271 271 1,083 6,056 1,625 4,431
2024 87,682 4,415 92,097 2024 87,682 1,573 2,842 1,533 383 383 1,533 8,247 2,299 5,948
2025 103,465 5,042 108,507 2025 103,465 1,545 3,498 2,473 618 618 2,473 11,225 3,710 7,516
2026 121,406 10,097 131,503 2026 121,406 3,806 6,290 2,842 711 711 2,842 17,202 4,263 12,939
2027 138,977 11,374 150,350 2027 138,977 5,195 6,179 3,498 874 874 3,498 20,118 5,246 14,871
2028 159,652 21,937 181,589 2028 159,652 6,712 15,226 6,290 1,573 1,573 6,290 37,663 9,435 28,228
2029 182,757 28,475 211,233 2029 182,757 7,697 20,779 6,179 1,545 1,545 6,179 43,923 9,269 34,654
2030 208,910 35,615 244,525 2030 208,910 8,768 26,847 15,226 3,806 3,806 15,226 73,679 22,838 50,841
2031 237,562 41,133 278,695 2031 237,562 10,346 30,786 20,779 5,195 5,195 20,779 93,079 31,168 61,911
2032 269,787 47,213 317,001 2032 269,787 12,141 35,073 26,847 6,712 6,712 26,847 114,331 40,270 74,060
2033 290,204 55,284 345,488 2033 290,204 13,898 41,386 30,786 7,697 7,697 30,786 132,249 46,179 86,070
2034 320,014 64,528 384,541 2034 320,014 15,965 48,562 35,073 8,768 8,768 35,073 152,210 52,609 99,600
2035 18,276 55,591 41,386 10,346 10,346 41,386 177,331 62,079 115,252
2036 20,891 63,861 48,562 12,141 12,141 48,562 206,158 72,844 133,314
2037 23,756 73,103 55,591 13,898 13,898 55,591 235,836 83,386 152,450
2038 26,979 83,564 63,861 15,965 15,965 63,861 270,194 95,791 174,403
2039 29,020 95,025 73,103 18,276 18,276 73,103 306,803 109,654 197,148
2040 32,001 107,915 83,564 20,891 20,891 83,564 348,826 125,346 223,480
Table S6.1 (a) LIB inflow and outflows for BEV batteries

105
PHEV10 battery MFA: Baseline Scenario
Battery inflow Battery lifespan (years) Battery outflow
Year
Entering
new
PHEV10
Replacement
in old
PHEV10
Total New
Batteries Year
PHEV10
sales 6 (10%) 8 (40%)
10
(40%)
12
(10%)
EOL LIBs
from
PHEV10
Type 2 EOL
LIBs from
PHEV10
Type 1 EOL
LIBs from
PHEV10
EOL batteries (1st battery)
EOL second
battery
2009 0 0 0 2009 0
2010 0 0 0 2010 0
2011 0 0 0 2011 0
2012 0 0 0 2012 0
2013 0 0 0 2013 0
2014 23,351 0 23,351 2014 23,351
2015 40,724 0 40,724 2015 40,724 0 0 0 0
2016 34,333 0 34,333 2016 34,333 0 0 0 0
2017 71,173 0 71,173 2017 71,173 0 0 0 0 0
2018 81,458 0 81,458 2018 81,458 0 0 0 0 0
2019 66,042 0 66,042 2019 66,042 0 0 0 0 0 0 0 0 0
2020 75,087 2,335 77,422 2020 75,087 2,335 0 0 0 0 0 2,335 0 2,335
2021 75,063 4,072 79,135 2021 75,063 4,072 0 0 0 0 0 4,072 0 4,072
2022 78,657 12,774 91,431 2022 78,657 3,433 9,341 0 0 0 0 12,774 0 12,774
2023 76,716 23,407 100,122 2023 76,716 7,117 16,290 0 0 0 0 23,407 0 23,407
2024 76,553 21,879 98,432 2024 76,553 8,146 13,733 9,341 2,335 2,335 9,341 45,230 14,011 31,220
2025 99,559 35,074 134,633 2025 99,559 6,604 28,469 16,290 4,072 4,072 16,290 75,797 24,434 51,363
2026 105,938 40,092 146,030 2026 105,938 7,509 32,583 13,733 3,433 3,433 13,733 74,425 20,600 53,825
2027 109,801 33,923 143,724 2027 109,801 7,506 26,417 28,469 7,117 7,117 28,469 105,097 42,704 62,392
2028 115,730 37,900 153,630 2028 115,730 7,866 30,035 32,583 8,146 8,146 32,583 119,359 48,875 70,484
2029 121,164 37,697 158,860 2029 121,164 7,672 30,025 26,417 6,604 6,604 26,417 103,739 39,625 64,114
2030 125,001 39,118 164,119 2030 125,001 7,655 31,463 30,035 7,509 7,509 30,035 114,205 45,052 69,153
2031 128,850 40,642 169,492 2031 128,850 9,956 30,686 30,025 7,506 7,506 30,025 115,705 45,038 70,667
2032 132,879 41,215 174,094 2032 132,879 10,594 30,621 31,463 7,866 7,866 31,463 119,872 47,194 72,678
2033 133,859 50,804 184,663 2033 133,859 10,980 39,824 30,686 7,672 7,672 30,686 127,519 46,029 81,490
2034 136,841 53,948 190,789 2034 136,841 11,573 42,375 30,621 7,655 7,655 30,621 130,501 45,932 84,569
2035 12,116 43,920 39,824 9,956 9,956 39,824 155,596 59,736 95,860
2036 12,500 46,292 42,375 10,594 10,594 42,375 164,730 63,563 101,167
2037 12,885 48,466 43,920 10,980 10,980 43,920 171,151 65,881 105,271
2038 13,288 50,000 46,292 11,573 11,573 46,292 179,018 69,438 109,580
2039 13,386 51,540 48,466 12,116 12,116 48,466 186,090 72,698 113,391
2040 13,684 53,151 50,000 12,500 12,500 50,000 191,837 75,001 116,836
Table S6.1 (b) LIB inflow and outflows for PHEV10 batteries

106
PHEV40 battery MFA: Baseline Scenario
Battery inflow Battery lifespan (years) Battery outflow
Year
Entering
new PHEV40
Replacement
in old PHEV40
Total
New Batteries Year
PHEV40 sales 6 (10%) 8 (40%) 10 (40%) 12 (10%)
EOL LIBs
from PHEV40
Type 2 EOL
LIBs from PHEV40
Type 1 EOL
LIBs from PHEV40
EOL batteries (1st battery)
EOL second
battery
2009 0 0 0 2009 0
2010 0 0 0 2010 0
2011 27,917 0 27,917 2011 27,917
2012 11,560 0 11,560 2012 11,560
2013 11,326 0 11,326 2013 11,326
2014 32,709 0 32,709 2014 32,709
2015 34,489 0 34,489 2015 34,489 0 0 0 0
2016 45,480 0 45,480 2016 45,480 0 0 0 0
2017 53,258 2,792 56,049 2017 53,258 2,792 0 2,792 0 2,792
2018 61,381 1,156 62,537 2018 61,381 1,156 0 1,156 0 1,156
2019 62,425 12,299 74,724 2019 62,425 1,133 11,167 0 0 0 0 12,299 0 12,299
2020 69,593 7,895 77,488 2020 69,593 3,271 4,624 0 0 0 0 7,895 0 7,895
2021 71,917 7,979 79,896 2021 71,917 3,449 4,531 11,167 2,792 2,792 11,167 35,896 16,750 19,146
2022 74,608 17,631 92,240 2022 74,608 4,548 13,083 4,624 1,156 1,156 4,624 29,192 6,936 22,256
2023 74,228 19,121 93,349 2023 74,228 5,326 13,795 4,531 1,133 1,133 4,531 30,448 6,796 23,652
2024 71,219 24,330 95,549 2024 71,219 6,138 18,192 13,083 3,271 3,271 13,083 57,039 19,625 37,414
2025 73,327 27,546 100,873 2025 73,327 6,242 21,303 13,795 3,449 3,449 13,795 62,034 20,693 41,341
2026 72,355 31,512 103,866 2026 72,355 6,959 24,552 18,192 4,548 4,548 18,192 76,992 27,288 49,704
2027 74,536 32,162 106,698 2027 74,536 7,192 24,970 21,303 5,326 5,326 21,303 85,419 31,955 53,465
2028 76,967 35,298 112,265 2028 76,967 7,461 27,837 24,552 6,138 6,138 24,552 96,679 36,828 59,850
2029 75,842 36,189 112,031 2029 75,842 7,423 28,767 24,970 6,242 6,242 24,970 98,614 37,455 61,159
2030 74,956 36,965 111,921 2030 74,956 7,122 29,843 27,837 6,959 6,959 27,837 106,558 41,756 64,802
2031 75,799 37,024 112,823 2031 75,799 7,333 29,691 28,767 7,192 7,192 28,767 108,940 43,150 65,791
2032 76,778 35,723 112,501 2032 76,778 7,235 28,488 29,843 7,461 7,461 29,843 110,331 44,765 65,566
2033 79,098 36,785 115,882 2033 79,098 7,454 29,331 29,691 7,423 7,423 29,691 111,012 44,537 66,476
2034 78,193 36,639 114,831 2034 78,193 7,697 28,942 28,488 7,122 7,122 28,488 107,858 42,731 65,126
2035 7,584 29,815 29,331 7,333 7,333 29,331 110,726 43,996 66,730
2036 7,496 30,787 28,942 7,235 7,235 28,942 110,637 43,413 67,224
2037 7,580 30,337 29,815 7,454 7,454 29,815 112,453 44,722 67,731
2038 7,678 29,982 30,787 7,697 7,697 30,787 114,627 46,180 68,447
2039 7,910 30,320 30,337 7,584 7,584 30,337 114,071 45,505 68,566
2040 7,819 30,711 29,982 7,496 7,496 29,982 113,486 44,973 68,513
Table S6.1 (c) LIB inflow and outflows for PHEV40 batteries

107
HEV Battery MFA: Baseline Scenario
Battery inflow Battery lifespan (years) Battery outflow
Year
Entering
new
HEV
Replacement
in old HEV
Total New
Batteries Year
HEV
sales
% HEVs
Using
LIBs
HEV sold
using
LIBs
6
(10%) 8 (40%)
10
(40%)
12
(10%)
EOL LIBs
from
HEV
Type 2
EOL LIBs
from HEV
Type 1
EOL LIBs
from HEV
EOL batteries (1st battery) EOL second battery
2009 0 0 0 2009 304,495 0% 0
2010 11,570 0 11,570 2010 283,456 4% 11,570
2011 33,046 0 33,046 2011 285,397 12% 33,046
2012 56,928 0 56,928 2012 294,128 19% 56,928
2013 113,999 0 113,999 2013 334,643 34% 113,999
2014 174,162 0 174,162 2014 397,448 44% 174,162
2015 226,495 0 226,495 2015 432,858 52% 226,495 0 0 0 0
2016 276,332 1,157 277,489 2016 460,554 60% 276,332 1,157 1,157 0 1,157
2017 318,729 3,305 322,033 2017 490,352 65% 318,729 3,305 0 3,305 0 3,305
2018 358,120 10,321 368,440 2018 511,599 70% 358,120 5,693 4,628 10,321 0 10,321
2019 391,705 24,618 416,323 2019 532,127 74% 391,705 11,400 13,218 0 0 0 0 24,618 0 24,618
2020 415,040 40,187 455,227 2020 553,387 75% 415,040 17,416 22,771 4,628 1,157 1,157 4,628 51,757 6,942 44,815
2021 465,773 68,249 534,022 2021 582,216 80% 465,773 22,650 45,600 13,218 3,305 3,305 13,218 101,295 19,828 81,468
2022 540,504 97,298 637,803 2022 635,888 85% 540,504 27,633 69,665 22,771 5,693 5,693 22,771 154,226 34,157 120,069
2023 616,741 122,471 739,212 2023 685,268 90% 616,741 31,873 90,598 45,600 11,400 11,400 45,600 236,470 68,400 168,071
2024 690,749 146,345 837,094 2024 727,105 95% 690,749 35,812 110,533 69,665 17,416 17,416 69,665 320,507 104,497 216,010
2025 749,102 166,662 915,764 2025 749,102 100% 749,102 39,170 127,491 90,598 22,650 22,650 90,598 393,157 135,897 257,260
2026 770,004 184,752 954,755 2026 770,004 100% 770,004 41,504 143,248 110,533 27,633 27,633 110,533 461,084 165,799 295,285
2027 786,097 203,259 989,356 2027 786,097 100% 786,097 46,577 156,682 127,491 31,873 31,873 127,491 521,988 191,237 330,751
2028 798,356 220,066 1,018,423 2028 798,356 100% 798,356 54,050 166,016 143,248 35,812 35,812 143,248 578,186 214,872 363,314
2029 805,968 247,983 1,053,951 2029 805,968 100% 805,968 61,674 186,309 156,682 39,170 39,170 156,682 639,688 235,023 404,665
2030 815,691 285,277 1,100,968 2030 815,691 100% 815,691 69,075 216,202 166,016 41,504 41,504 166,016 700,317 249,024 451,293
2031 823,508 321,607 1,145,115 2031 823,508 100% 823,508 74,910 246,696 186,309 46,577 46,577 186,309 787,379 279,464 507,916
2032 833,867 353,300 1,187,167 2032 833,867 100% 833,867 77,000 276,300 216,202 54,050 54,050 216,202 893,805 324,303 569,502
2033 840,145 378,250 1,218,396 2033 840,145 100% 840,145 78,610 299,641 246,696 61,674 61,674 246,696 994,991 370,045 624,947
2034 846,415 387,837 1,234,252 2034 846,415 100% 846,415 79,836 308,001 276,300 69,075 69,075 276,300 1,078,586 414,450 664,137
2035 80,597 314,439 299,641 74,910 74,910 299,641 1,144,137 449,461 694,676
2036 81,569 319,342 308,001 77,000 77,000 308,001 1,170,915 462,002 708,913
2037 82,351 322,387 314,439 78,610 78,610 314,439 1,190,835 471,658 719,177
2038 83,387 326,276 319,342 79,836 79,836 319,342 1,208,019 479,014 729,006
2039 84,015 329,403 322,387 80,597 80,597 322,387 1,219,385 483,581 735,805
2040 84,641 333,547 326,276 81,569 81,569 326,276 1,233,879 489,414 744,465
Table S6.1 (d) LIB inflow and outflows for HEV batteries

108
S6.2 Calculation of materials mass of annual EV LIB inflows and outflows
In the MFA model it was assumed that the percentage of LIBs of a given chemistry in waste
stream is same as the percentage of new LIBs of that chemistry entering EV use. Hence,
using 𝑚𝑗, the mass of a cylindrical cell of chemistry j, along with the percentage of LIBs of
cathode chemistry j in EV battery waste stream (PCj) and the number of cells per battery pack
for EV type i and cathode chemistry j (Di, j), the material mass of EV battery inflows into new
EVs (𝑀𝐼𝑠,𝑡) as well as the material mass of replacement batteries in old EVs (𝑀𝐼𝑤,𝑡) for given
year “t” was estimated as,
i j
jjijtits mDPCSMI )***( ,,,
i j
jjijtitw mDPCWMI )***( ,,,
Where,
Si,t = Sales of new EVs of type i that use lithium ion batteries in year t
Wi,t = Non-EOL EVs of type i requiring a replacement LIB in year t
The following table represents the LIB inflow into new EVs and as replacement in old EVs on an
annual basis (2009-2034) for the baseline scenario. These results are represented in a cumulative
format in the Sankey diagram (Figure 2.6 in the Chapter 2). The annual LIB inflow is calculated
from tables S6.1 (a) through S6.1 (d).

109
LIB inflow into new EVs Replacement LIBs in old EVs
Year Number of LIB packs Cell mass (metric tons) Number of LIB packs Cell mass (metric tons)
2009 509 124 0 0
2010 13,406 829 0 0
2011 63,630 4,819 0 0
2012 70,521 3,652 0 0
2013 128,034 5,678 0 0
2014 234,055 10,942 0 0
2015 307,891 13,919 51 12
2016 363,252 16,828 1,341 83
2017 451,904 20,501 6,567 531
2018 516,684 24,681 12,414 697
2019 535,619 25,414 38,255 2,495
2020 597,784 32,725 51,614 2,555
2021 664,699 38,035 82,003 3,663
2022 760,887 44,592 129,947 6,059
2023 844,650 49,413 168,347 7,618
2024 926,203 54,130 196,969 9,199
2025 1,025,453 60,765 234,323 10,742
2026 1,069,702 65,888 266,452 13,145
2027 1,109,411 71,040 280,718 13,969
2028 1,150,705 76,905 315,202 17,549
2029 1,185,730 82,801 350,345 20,155
2030 1,224,558 89,491 396,975 23,250
2031 1,265,719 96,916 440,405 25,841
2032 1,313,311 105,315 477,451 28,241
2033 1,343,307 110,770 521,122 31,410
2034 1,381,462 118,209 542,951 34,046
Cumulative (2009-2034) 18,549,085 1,224,380 4,513,453 251,261
Table S6.2 (a) Estimation of material mass of EV battery inflows (Baseline scenario)
Similarly, for any year t, the material outflows (MO) from EOL EV batteries of a given type “g”
(type 1 or type 2) was estimated using the same variables 𝑚𝑗, PCj and Di,j along with the number
of LIB packs in EV battery waste stream (𝐵𝑡) and the percentage of type 1 or type 2 EOL EV
batteries generated from EV type i in that year (𝑃𝐸𝑔,𝑖,𝑡).
i j
jjijtigttg mDPCPEBMO )***(* ,,,,
The following table represents the EOL battery outflows on an annual basis from 2015 to 2040
and classifies them into type 1 and type 2 EOL batteries based on tables S6.1 (a) through S6.1
(d). These results are represented in a cumulative format in the Sankey diagram (Figure 2.6 in
Chapter 2).

110
Type 1 EOL LIB packs Type 2 EOL LIB packs
Year Number of LIB
packs
Cell mass
(metric tons)
Number of LIB packs Cell mass
(metric tons)
2015 51 12 0 0
2016 1,341 83 0 0
2017 6,567 531 0 0
2018 12,414 697 0 0
2019 38,459 2,545 305 74
2020 56,976 2,886 8,044 498
2021 107,455 5,591 38,178 2,892
2022 158,155 7,520 42,313 2,191
2023 219,560 9,889 76,820 3,407
2024 290,591 13,576 140,433 6,565
2025 357,480 16,309 184,735 8,352
2026 411,753 19,876 217,951 10,097
2027 461,479 22,169 271,142 12,301
2028 521,876 27,422 310,010 14,808
2029 564,592 30,321 321,372 15,248
2030 636,089 36,340 358,670 19,635
2031 706,285 41,055 398,819 22,821
2032 781,806 46,078 456,532 26,755
2033 858,982 51,175 506,790 29,648
2034 913,432 55,698 555,722 32,478
2035 972,519 61,002 615,272 36,459
2036 1,010,618 66,066 641,821 39,533
2037 1,044,628 71,228 665,646 42,624
2038 1,081,436 77,090 690,423 46,143
2039 1,114,911 82,964 711,438 49,681
2040 1,153,294 89,743 734,735 53,695
Cumulative
(2015-2040)
13,482,749 837,866 7,947,172 475,902
S6.2 (b) Estimation of material mass of EV battery outflows for type 1 and type 2 EOL EV batteries (Baseline
scenario)

111
S6.3 Scenario specific annual estimates of EV LIB material outflows
EV LIB material outflows (Metric tons)
Year Low Scenario Baseline Scenario High Scenario
2015 8 12 702
2016 33 83 1,858
2017 208 531 4,195
2018 245 697 8,421
2019 1,083 2,619 13,843
2020 1,205 3,384 22,824
2021 4,005 8,482 35,847
2022 2,587 9,711 54,998
2023 3,085 13,296 70,882
2024 4,518 20,141 98,071
2025 6,309 24,661 113,346
2026 7,283 29,973 135,639
2027 8,895 34,471 149,798
2028 10,770 42,230 180,872
2029 11,495 45,570 173,598
2030 13,976 55,976 193,212
2031 15,007 63,877 205,598
2032 16,800 72,834 219,715
2033 18,563 80,824 231,105
2034 20,433 88,177 242,448
2035 23,060 97,462 261,704
2036 25,636 105,600 277,471
2037 28,692 113,854 299,258
2038 31,992 123,234 315,595
2039 35,344 132,647 336,585
2040 38,285 143,440 343,929
Table S6.3 Scenario specific annual estimates of EV LIB material outflows
S7. Uncertainty analysis of MFA parameters
Recognizing the uncertainty associated with EV lifespan, this MFA model assumed a moderate
EV lifespan of 10 years, hence, a sensitivity analysis was conducted assuming a 16 year EV
lifespan, this being the higher end lifespan assumed for conventional vehicle studies and the
current U.S. DOE estimate of the lifespan of a typical light duty vehicle in the United States
(Davis et al., 2013). Moreover, the wide disparity observed between the low and high scenario in
our analysis is indicative of the uncertainty in the EV sales, their battery lifespan as well as the
parameters determining the number of cells per EV battery pack. The impact of these
uncertainties on the MFA model is analyzed in the subsequent sections.

112
S7.1 Impact of EV sales and battery lifespan distribution on MFA results
The baseline EV sales projections were combined with the entire range of modeled battery
lifespan distributions to analyze the impact of battery lifespan on waste EV LIB outflows.
Similarly, the baseline EV LIB lifespan distribution was combined with the high and low
scenario EV sales figures. The EOL EV battery outflows in each of these scenarios were
compared with the battery outflows in the initial baseline scenario (i.e. baseline EV sales and
baseline LIB lifespan distribution). These results are shown below:
Year
EOL EV LIB pack
units (Baseline
Sales-Baseline Scenario Lifespan
Distribution)
EOL EV LIB pack
units (Baseline
Sales-Low Scenario Lifespan
Distribution)
EOL EV LIB pack
units (Baseline
Sales-High Scenario Lifespan
Distribution)
EOL EV LIB pack units (High
Sales- Baseline
Scenario Lifespan
Distribution
EOL EV LIB
pack units (Low
Sales- Baseline Scenario Lifespan
Distribution
2015 51 25 6,490 50 355
2016 1,341 670 10,404 1,337 1,692
2017 6,567 3,309 28,869 6,565 7,237
2018 12,414 6,878 45,192 20,298 11,167
2019 38,764 22,818 83,032 52,755 32,233
2020 65,020 42,739 130,106 126,874 43,824
2021 145,633 111,033 225,484 246,630 92,728
2022 200,468 147,197 285,559 448,144 96,205
2023 296,381 227,602 390,018 670,450 126,455
2024 431,024 350,702 535,612 983,810 177,476
2025 542,214 447,648 648,356 1,262,360 238,619
2026 629,704 522,312 748,959 1,398,700 278,716
2027 732,622 619,044 868,586 1,541,070 347,008
2028 831,886 704,174 984,839 1,701,250 405,137
2029 885,964 744,027 1,055,384 1,683,420 436,642
2030 994,759 834,316 1,172,180 1,798,170 498,093
2031 1,105,104 927,134 1,293,845 1,876,030 531,040
2032 1,238,339 1,045,923 1,430,506 1,990,030 582,229
2033 1,365,772 1,156,484 1,558,466 2,084,930 631,460
2034 1,469,154 1,251,164 1,667,943 2,161,360 676,447
2035 1,587,790 1,362,092 1,792,375 2,271,950 732,520
2036 1,652,439 1,418,606 1,863,891 2,351,960 776,866
2037 1,710,275 1,469,129 1,927,747 2,440,890 829,062
2038 1,771,859 1,522,510 1,996,792 2,488,430 878,135
2039 1,826,349 1,569,325 2,054,594 2,557,040 942,932
2040 1,888,028 1,621,959 2,125,742 2,554,530 985,513
Cumulative
(2015 -2040) 21,429,921 18,128,819 24,930,969 34,719,032 10,359,792
Table S7.1 Impact of EV sales and LIB lifespan distribution on EV battery MFA results

113
S7.2 Impact of battery pack energy storage on MFA results
Sensitivity analysis was conducted wherein the EOL EV battery pack numbers for the baseline
scenario were used along with the EV battery pack energy storage (determining the number of
cells per battery pack) for the low as well as the high scenario to determine the material mass of
the EV LIB waste stream. These material masses were then compared with material outflows in
the initial baseline scenario as shown below:
Year
EV LIB material outflows (Metric Tonnes): Baseline scenario cells
per battery pack assumption
EV LIB material outflows (Metric Tonnes): Low scenario cells per battery
pack assumption
EV LIB material outflows (Metric Tonnes): High scenario cells per
battery pack assumption
2015 12 9 16
2016 83 58 118
2017 531 385 726
2018 697 489 995
2019 2,619 1,874 3,641
2020 3,384 2,368 4,848
2021 8,482 6,008 11,954
2022 9,711 6,774 13,967
2023 13,296 9,205 19,306
2024 20,141 14,046 28,974
2025 24,661 17,198 35,478
2026 29,973 20,953 42,988
2027 34,471 24,120 49,377
2028 42,230 29,734 60,011
2029 45,570 32,046 64,862
2030 55,976 39,623 78,997
2031 63,877 45,260 90,038
2032 72,834 51,628 102,612
2033 80,824 57,290 113,877
2034 88,177 62,532 124,166
2035 97,462 69,259 136,866
2036 105,600 75,248 147,755
2037 113,854 81,342 158,744
2038 123,234 88,284 171,193
2039 132,647 95,268 183,635
2040 143,440 103,273 197,913
Cumulative
(2015-2040) 1,313,787 934,277 1,843,057
Table S7.2 Mass of lithium ion cells in EV battery waste stream under baseline scenario EOL battery pack numbers
and different assumptions of cells per battery pack.

114
S7.3 Impact of extended EV lifespan on MFA results
When the baseline scenario was remodeled with an extended EV lifespan of 16 years, only a
small difference was observed in the number of EOL EV LIBs entering the waste streams when
compared with the initial baseline scenario results that assumed a 10 year EV lifespan. While in
case of 10 year EV lifespan, Type 2 EOL batteries would start entering the waste stream a few
years early (i.e. year 2019) owing to shorter EV lifespan, they would enter the waste stream as
late as year 2025 when the EV lifespan is extended to 16 years. In the initial baseline scenario
with the 10 year EV lifespan, there was scope for only a single battery replacement during the
EV lifetime. However, when the EV lifespan was extended, a third LIB pack was needed by few
vehicles which were 12 years or older. Acknowledging that this may not be feasible from a cost
perspective, a variant to the 16 year EV lifespan-baseline scenario MFA modeling was
introduced, wherein the number of replacement LIB pack was restricted to one during the
lifetime of the EV (assuming that the vehicle would become obsolete before 16 years, if its
second battery reached EOL). Apart from annual differences in EV LIB outflows, there was not
much difference observed in the cumulative (2015 to 2040) outflows of these batteries into the
waste stream among these different scenarios of EV lifespan as indicated in table S7.3.1.

115
Year
EOL EV LIB pack units
(10 year EV lifespan)
EOL EV LIB pack units
(16 year EV lifespan
EOL EV LIB pack units (16
year EV lifespan with
restriction of one replacement
battery)
2015 51 51 51
2016 1,341 1,341 1,341
2017 6,567 6,567 6,567
2018 12,414 12,414 12,414
2019 38,764 38,459 38,459
2020 65,020 56,976 56,976
2021 145,633 107,511 107,511
2022 200,468 159,630 159,630
2023 296,381 226,600 226,600
2024 431,024 299,421 299,421
2025 542,214 377,163 377,117
2026 629,704 456,546 455,340
2027 732,622 569,220 563,493
2028 831,886 651,079 644,732
2029 885,964 766,967 755,444
2030 994,759 956,039 934,974
2031 1,105,104 1,109,246 1,081,536
2032 1,238,339 1,252,149 1,219,457
2033 1,365,772 1,426,853 1,386,181
2034 1,469,154 1,561,637 1,515,135
2035 1,587,790 1,654,225 1,606,020
2036 1,652,439 1,771,156 1,717,355
2037 1,710,275 1,889,699 1,829,876
2038 1,771,859 2,034,087 1,965,607
2039 1,826,349 2,163,632 2,087,613
2040 1,888,028 2,291,650 2,208,292
Cumulative EOL EV
LIB outflows (2015
to 2040) 21,429,921 21,840,317 21,257,142
Table S7.3.1 EOL lithium ion battery outflows under different EV lifespan scenarios

116
Figure S7.3.1 EOL lithium ion battery outflows under different EV lifespan scenarios
As a result, the baseline scenario material outflow of lithium ion cells in the EV battery waste
stream was nearly 1.3 million metric tons in all the three EV lifespan variants on a cumulative
basis between 2015 and 2040. Although, differences were observed in the waste EV LIB
material outflows in individual years during the timeline of this analysis due to extended EV
lifespan assumption or assuming single battery replacement over the extended EV lifespan as
shown in figure S7.3.2.
Figure S7.3.2 Mass of Li-Ion cells in EV battery waste stream under different EV lifespan scenarios

117
In terms of type 2 EOL EV batteries, a reduction was observed in the percentage of these type of
batteries accrued in the waste stream between 2015 and 2040 due to extended EV lifespan.
EV lifespan in baseline
scenario
Percentage of Type
1 EOL batteries
Percentage of
Type 2 EOL
batteries
10 years 63% 37%
16 years 77% 23%
16 years (with restriction
of 1 replacement battery) 80% 20%
Table S7.3.2. Percentage of type 1 and type 2 EOL EV batteries accrued in the waste stream between 2015 and 2040
under different EV lifespan scenarios
S8. Prismatic lithium ion cells
S8.1 Bill of materials of prismatic cells
The material composition of prismatic lithium ion cells was estimated using the Argonne
National Laboratory BatPac simulation model (ANL, 2012). For any given cathode chemistry,
the BatPac model provides cell design estimates for 7 cells based on their capacity and size. An
intermediate size (i.e. battery 4) cell design was used for our model. The estimation of the bill of
materials of a LiFePO4 prismatic cell is explained as follows:
Data obtained from ANL BatPaC model:
Prismatic Cell (LiFePO4)
Mass
(g)
Active materials (Positive electrode) 214.22
Active materials (Negative electrode) 119.57
Carbon 14.44
Binder 18.33
Al (Positive foil) 43.40
Cu (Negative foil) 92.56
Separator (PP, EP/PP) 14.88
Electrolyte 155.74
Positive terminal assembly
(Aluminum) 7.52
Negative terminal assembly (nickel
plated copper sheet) 24.84
Cell container (PET-AL-PP) 33.91
Total (per cell) 739.39
Table S8. 1.1 Mass of prismatic li-ion cell (LiFePO4) components obtained from ANL BatPac
model (2012)

118
The BatPac model gives only the integrated mass of cathode and anode active materials and does
not categorize them into the constituent materials. The anode is typically all graphitic so all the
active negative electrode should be graphite. To calculate the mass percent of each element in
the cathode, the molar masses of each element (found in periodic table) was used. For instance,
if the cathode chemistry is LiFePO4, it implies that for one mole of Li, Fe, and P, it contains 4
moles of oxygen. Therefore,
Li - 1 mole = 6.94g
Fe - 1 mole = 55.845g
P - 1mole = 30.974g
O - 1mole - 15.99g * 4 moles = 63.96g
Total molar mass = 157.719g
So the mass percentage of each element in the cathode structure would be:
Li - 6.94g/157.719g = 0.044 or 4.4%
Fe - 55.845g/157.719g = 0.354 or 35.4%
P - 30.974g/157.719g = 0.196 or 19.6%
O - 63.96g/157.719g = 0.406 or 40.6%
Therefore for a prismatic cell which has 214.22 g of active material (LiFePO4) the elemental
masses would be:
Li = 0.044 * 214.22g = 9.43g
Fe = 0.354 * 214.22g = 75.85g
P = 0.196 * 214.22g = 42.07g
O = 0.406*214.22g = 86.87g
Total aluminum present in the prismatic cell was calculated as the sum of aluminum present in
positive foil, positive terminal assembly and the cell container. Aluminum present in the
LiFePO4 cell container was estimated as a product of cell width, cell length, thickness of cell
container aluminum layer, and density of aluminum from the following data from BatPac model:
Width of cell (mm) = 117 (ANL, 2012)
Length of cell (mm) = 375 (ANL, 2012)
Thickness of cell container aluminum layer (µm) = 100 (ANL, 2012)
Density of aluminum (g/cm3) = 2.7
Hence, aluminum in cell container (g) = 11.87
Plastic in cell container (g) = 33.91-11.87 = 22.04
Plastic material present in the prismatic cell was estimated as the amount of plastics present in
separator and the cell container. In a similar way, the bill of materials of prismatic cells of
LiMn2O4 and NCM chemistry was estimated as shown in table S8.1.2. For the NCM chemistry,

119
LIB type NCM441 (Li1.05(Ni4/9Mn4/9Co1/9)0.95O2-Graphite) was used in our model. NCM-
441 is less expensive than the NCM-333 (Li1.05(Ni1/3Mn1/3Co1/3)0.95O2-Graphite) due to
significantly less amount of cobalt present (ANL, 2012) and hence, would be likely to be used in
EV application in the future.
Cathode Chemistry LiMn2O4 LiFePO4 NCM
Material, y (grams)
Aluminum
50.00 62.78
45.08
Cobalt 0 0 10.72
Copper
94.40 117.40 86.62
Lithium
10.20 9.43 12.56
Manganese
161.54 0 39.97
Nickel 0 0 42.70
Steel 0 0 0
Iron 0 75.85 0.00
Graphite
99.17 119.57 109.90
Carbon
17.92 14.44 10.86
Binder
20.15 18.33 14.83
Plastic
29.74 36.92
25.88
Electrolyte (LiPF6 in
EC)
97.29 155.74 78.33
Other
94.03 128.94 55.11
Total
674.45 739.39
532.56
Table S8.1.2 Bill of materials of lithium ion cells (prismatic form factor) as estimated from ANL BatPac model
(2012)
S8.2 Number of prismatic cells per EV battery pack
The number of cells per LIB pack for a given EV type and a given battery chemistry (Di,j) was
estimated as follows:
, ( ( ) / ( ))i j i jD Epack Wh Ecell Wh
The cell energy of prismatic cells was estimated as the product of cell capacity and average
voltage as obtained from the BatPac model.
Cathode chemistry Cell Capacity (Ah) Average voltage (V) Cell Energy (Wh)
LMO 26.58 3.95 105.09
LFP 32.13 3.28 105.46
NCM 28.19 3.75 105.70
Table 8.2.1 Cell energy estimation of prismatic lithium ion cells

120
Baseline scenario parameters were used to estimate the LIB battery energy storage for BEV (39
kWh), PHEV10 (4.4 kWh), PHEV40 (18 kWh) and HEV (5.3 kWh), as indicated in table 2.1 of
Chapter 2. Based on the cell and battery pack energy storage, the number of prismatic lithium ion
cells per EV battery pack was estimated as follows:
Cathode
chemistry
No. of cells per BEV
battery pack
No. of cells per
PHEV10 battery
pack
No. of cells per
PHEV40 battery
pack
No. of cells per
HEV battery
pack
LMO 373 42 169 51
LFP 372 42 169 51
NCM 371 42 168 50
Table S8.2.2 Number of cells per battery pack (prismatic LIBs)
S8.3 Composition of EV battery waste stream in prismatic cells scenario
The composition of EV battery waste stream when all LIB packs consisted of cylindrical cells
(Base Case) and 90% of the battery packs consisted of prismatic cells is shown in table S8.3. The
chemistry mix of EV battery waste stream was assumed to be same in both scenarios (10% LCO,
30% each of LMO, LFP and NCM cells based LIBs). In the 90% prismatic scenario only the
LCO cells were of 18650 form factor (consistent with adoption by some auto makers, like Tesla)
while the remaining 90% of the LIBs in the EV battery waste stream consisted of prismatic cells.
Base Case Scenario 90% Prismatic Scenario
Aluminum 4.34% 7.83%
Cobalt 3.97% 2.15%
Copper 5.71% 14.56%
Lithium 1.38% 1.69%
Manganese 8.81% 9.38%
Nickel 2.44% 2.09%
Steel 22.45% 1.57%
Iron 3.29% 3.52%
Carbon 24.47% 20.06%
Binder, plastic 10.37% 7.46%
Electrolyte materials
(lithium salt in
organic carbonate)
5.15% 15.84%
Others 7.62% 13.82%
Total 100.00% 100.00%
Table S8.3 Composition of EV battery waste stream
S9. Commodity values
Prices of LIB materials were obtained from United States Geological Survey data (USGS, 2012),
London Metal Exchange (2012) and Shanghai Metals Market (2012).

121
Lithium ion battery
material
Material price
$/g
Cobalt 0.03648
Manganese 0.00357
Copper 0.00956
Aluminum 0.00264
Steel 0.00064
Iron 0.00064
Nickel 0.02423
Lithium 0.06220
Table S9.1 Commodity values of LIB material
S10. Recycling efficiency of LIB materials
Metal in LIB Recycling Efficiency (%) Literature source
Cobalt 89 Li et al. (2009)
Nickel 62 Graedel et al. (2011)
Iron/Steel 52 Fenton (2003)
Aluminum 42 Plunkert (2005)
Copper 90 Ruhrberg (2006)
Table S10.1 Recycling efficiency of LIB materials
S11. USGS definitions (USGS, 2012)
Reserves: That part of the reserve base which could be economically extracted or produced at the
time of determination. The term reserves need not signify that extraction facilities are in place
and operative. Reserves include only recoverable materials; thus, terms such as “extractable
reserves” and “recoverable reserves” are redundant and are not a part of this classification
system.
Reserve Base: That part of an identified resource that meets specified minimum physical and
chemical criteria related to current mining and production practices, including those for grade,
quality, thickness, and depth. The reserve base is the in‐place demonstrated (measured plus
indicated) resource from which reserves are estimated. It may encompass those parts of the
resources that have a reasonable potential for becoming economically available within planning
horizons beyond those that assume proven technology and current economics. The reserve base
includes those resources that are currently economic (reserves), marginally economic (marginal
reserves), and some of those that are currently sub‐economic (sub‐economic resources).

122
APPENDIX B
S.1. EV lithium-ion battery production
For both battery systems (lithium-ion and lead-acid) material production, processing and use
phase stages were modeled in SimaPro LCA software using the ecoinvent database version 2.2
(ecoinvent Centre, 2010). U.S. based electricity grid mix was used for electricity input data. For
metal inputs, instead of assuming 100% primary metal usage a production mix of the metals was
considered. Steel components were modeled to be composed of low alloyed steel which has
about 37% recycled material content (ecoinvent Centre, 2010). Aluminum components were
assumed to be composed of a production mix of 68% primary and 32% secondary aluminum
(ecoinvent Centre, 2010). Copper components were modeled as comprising of 85% primary and
15% secondary copper based on average copper consumption mix (International Institute for
Sustainable Development, 2010).
The lithium-ion battery (LIB) production stage includes the manufacture of various battery parts
such as the lithium manganese oxide (LiMn2O4) cathode, graphite anode, separator composed of
plastic material, electrolyte salt (Lithium hexafluorophosphate [LiPF6]), electrolyte solvent
(Ethylene Carbonate), battery pack components as well as cell assembly and battery pack
assembly.
The EV LIB pack data has been obtained from the Argonne National Laboratory BatPac Model
(ANL, 2011) by running the model for a 24 kWh BEV battery consisting of 48 modules, with 4
cells per module (2 in parallel and 2 in series). The battery pack comprised of 192 prismatic
cells. The BatPac model provided a reasonable estimation of material inputs for LIB cells,
modules and pack. Remaining data on battery management system (BMS) as well as LIB
manufacturing processes for various components has been collected from literature sources and
past LCA studies, stoichiometry, material properties and ecoinvent database.
S.1.1. Lithium-ion cell
Bill of materials for lithium manganese oxide cell was calculated from the outputs of Argonne
National Laboratory BatPac model (ANL, 2011). Table 1 shows the composition of a single LIB
cell as obtained from the model for a LIB pack parameterized based on specific inputs (pack
energy, cells per pack, etc.)
Li-ion (LiMn2O4) cell component Weight (g)
Cathode 402.14
Anode 213.26
Positive terminal assembly 7.31
Negative terminal assembly 24.14
Separator 13.9
Electrolyte 117.52
Cell container 41.6
Total cell mass 819.85
Table 1. LIB cell composition
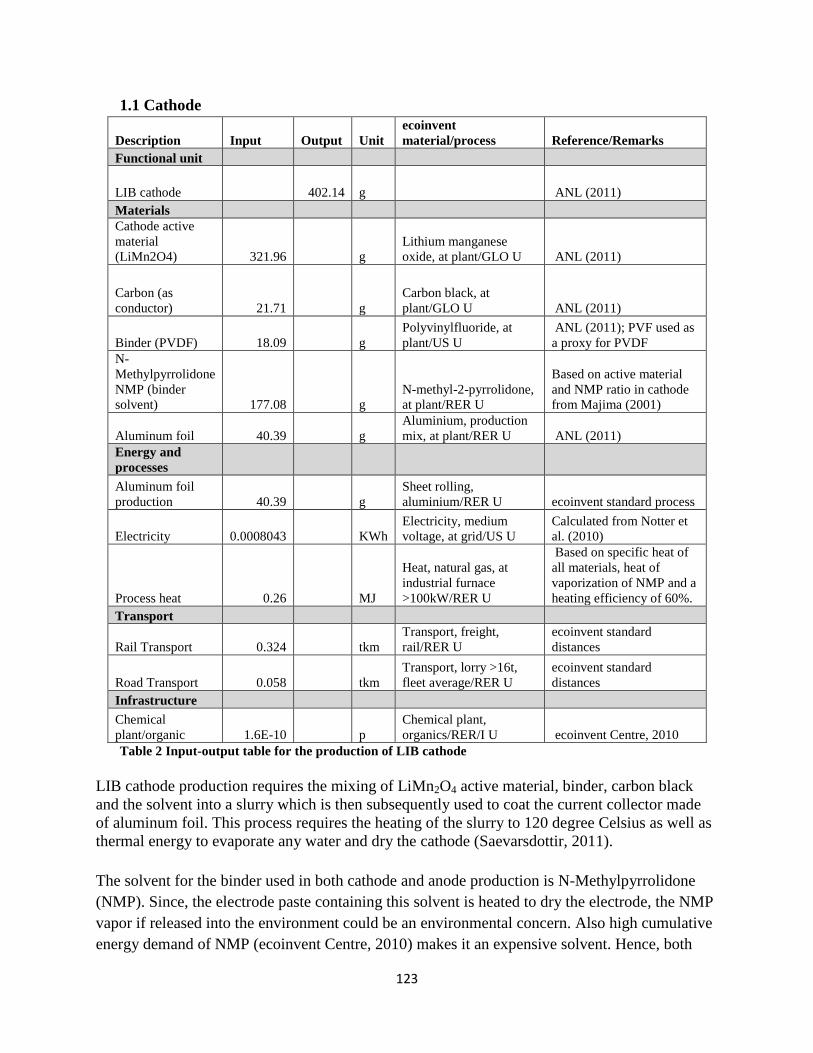
123
1.1 Cathode
Description Input Output Unit
ecoinvent
material/process Reference/Remarks
Functional unit
LIB cathode 402.14 g ANL (2011)
Materials
Cathode active
material
(LiMn2O4) 321.96 g
Lithium manganese
oxide, at plant/GLO U ANL (2011)
Carbon (as
conductor) 21.71 g
Carbon black, at
plant/GLO U ANL (2011)
Binder (PVDF) 18.09 g
Polyvinylfluoride, at
plant/US U
ANL (2011); PVF used as
a proxy for PVDF
N-
Methylpyrrolidone
NMP (binder
solvent) 177.08 g
N-methyl-2-pyrrolidone,
at plant/RER U
Based on active material
and NMP ratio in cathode
from Majima (2001)
Aluminum foil 40.39 g
Aluminium, production
mix, at plant/RER U ANL (2011)
Energy and
processes
Aluminum foil
production 40.39 g
Sheet rolling,
aluminium/RER U ecoinvent standard process
Electricity 0.0008043 KWh
Electricity, medium
voltage, at grid/US U
Calculated from Notter et
al. (2010)
Process heat 0.26 MJ
Heat, natural gas, at
industrial furnace
>100kW/RER U
Based on specific heat of
all materials, heat of
vaporization of NMP and a
heating efficiency of 60%.
Transport
Rail Transport 0.324 tkm
Transport, freight,
rail/RER U
ecoinvent standard
distances
Road Transport 0.058 tkm
Transport, lorry >16t,
fleet average/RER U
ecoinvent standard
distances
Infrastructure
Chemical
plant/organic 1.6E-10 p
Chemical plant,
organics/RER/I U ecoinvent Centre, 2010
Table 2 Input-output table for the production of LIB cathode
LIB cathode production requires the mixing of LiMn2O4 active material, binder, carbon black
and the solvent into a slurry which is then subsequently used to coat the current collector made
of aluminum foil. This process requires the heating of the slurry to 120 degree Celsius as well as
thermal energy to evaporate any water and dry the cathode (Saevarsdottir, 2011).
The solvent for the binder used in both cathode and anode production is N-Methylpyrrolidone
(NMP). Since, the electrode paste containing this solvent is heated to dry the electrode, the NMP
vapor if released into the environment could be an environmental concern. Also high cumulative
energy demand of NMP (ecoinvent Centre, 2010) makes it an expensive solvent. Hence, both

124
from environmental and economic point of view, battery manufacturers aim to recover NMP. A
98% recovery rate of NMP has been assumed based on U.S. Department of Energy [U.S.DOE]
(2010). LCI data for NMP recovery was based on generic inventory data for solvent recovery
from Geisler et al. (2004).
NMP Recovery
Description Input Output Unit ecoinvent material/process Reference/Remarks
Avoided
product
NMP
recovered 173.535 g
N-methyl-2-pyrrolidone, at
plant/RER U
98% recovery based
on LG Chem Ltd. and
Compact Power, Inc.
(U.S. DOE, 2010)
Others
Water for NMP
recovery 14166 g
Water, decarbonised, at
plant, RER U Geisler et al., 2004
Nitrogen for
NMP recovery 2.5 g
Nitrogen, via cryogenic air
separation, production mix,
at plant, gaseous EU-27 S Geisler et al., 2004
Steam for
NMP recovery 260.00 g
Steam, for chemical
processes, at plant/RER U Geisler et al., 2004
Energy and
processes
Electricity for
NMP recovery 0.0087 KWh
Electricity, medium voltage,
at grid/US U Geisler et al., 2004
Table 3 Input-output table for NMP recovery post-cathode production

125
1.2 Anode
Description Input Output Unit ecoinvent material/process Reference/Remarks
Functional unit
LIB cathode 213.26 g ANL (2011)
Materials
Anode active
material
(graphite) 119.47 g
Graphite, battery grade, at
plant/CN U ANL (2011)
Binder (PVDF) 6.29 g
Polyvinylfluoride, at
plant/US U ANL (2011)
NMP (binder
solvent) 119.47 g
N-methyl-2-pyrrolidone, at
plant/RER U
Based on active
material and NMP ratio
from Majima (2001)
Copper foil 87.51 g
85% Copper, primary, at
refinery/RER U; 15%
Copper, primary, at
refinery/RER U ANL (2011)
Energy and
processes
Copper foil
production 87.51 g Sheet rolling, copper/RER U
ecoinvent standard
process
Electricity 0.00043 KWh
Electricity, medium voltage,
at grid/US U Notter et al. (2010)
Process heat 0.16 MJ
Heat, natural gas, at
industrial furnace
>100kW/RER U
Based on specific heat
of materials, heat of
vaporization of NMP
and a heating efficiency
of 60%
Transport
Rail Transport 0.162 tkm
Transport, freight, rail/RER
U
ecoinvent standard
distances
Road Transport 0.033 tkm
Transport, lorry >16t, fleet
average/RER U
ecoinvent standard
distances
Infrastructure
Chemical
plant/organic 8.5E-10 p
Chemical plant,
organics/RER/I U ecoinvent Centre, 2010
Table 4 Input-output table for the production of LIB anode
LIB anode production requires the mixing of graphite, binder, and the solvent into a slurry which
is then subsequently used to coat the current collector made of copper foil. This process requires
heating of the slurry to 120 degree Celsius as well as thermal energy to evaporate any water and
dry the anode (Saevarsdottir, 2011; Notter et al., 2010).

126
NMP Recovery
Description Input Output Unit ecoinvent material/process Reference/Remarks
Avoided product
NMP recovered 117.078 g
N-methyl-2-pyrrolidone, at
plant/RER U
98% recovery based
on LG Chem Ltd.
and Compact Power,
Inc (U.S. DOE,
2010)
Others
Water for NMP
recovery 9557 g
Water, decarbonised, at plant,
RER U Geisler et al., 2004
Nitrogen for NMP
recovery 2 g
Nitrogen, via cryogenic air
separation, production mix, at
plant, gaseous EU-27 S Geisler et al., 2004
Steam for NMP
recovery 176 g
Steam, for chemical processes,
at plant/RER U Geisler et al., 2004
Energy and
processes
Electricity for
NMP recovery 0.006 KWh
Electricity, medium voltage, at
grid/US U Geisler et al., 2004
Table 5. Input-output table for NMP recovery post-anode production
1.3 Electrolyte
Description Input Output Unit ecoinvent material/process
Reference/Remark
s
Functional unit
Electrolyte 117.52 g
ANL, 2011 (Also
volume=0.10 liter)
Materials
Lithium
hexafluorophosph
ate 17.85 g
Lithium
hexafluorophosphate, at
plant/CN U
1.20 mol per
liter(Nelson et al.,
2011)
Ethylene
carbonate 99.67 g
Ethylene carbonate, at
plant/CN U
Calculated as
remaining mass of
electrolyte
Transport
Rail Transport 0.0705 tkm
Transport, freight, rail/RER
U
ecoinvent standard
distances
Road Transport
0.0117
5 tkm
Transport, lorry >16t, fleet
average/RER U
ecoinvent standard
distances
Table 6. Input-output table for the production of electrolyte
LIB electrolyte is composed of lithium hexafluorophosphate (electrolyte salt) and ethylene
carbonate (electrolyte solvent). The mass and volume of electrolyte per cell was obtained from
the BatPac model, based on the defined cell parameters. Concentration of the electrolyte salt was

127
obtained from Nelson et al. (2011) and subsequently, the individual masses of the salt and
solvent were calculated.
1.4. Separator
Description Input Output Unit ecoinvent material/process Reference/Remarks
Functional
unit
Separator 13.9 g ANL (2011)
Materials
Polypropylene
(PP) 11.12 g
Polypropylene, granulate, at
plant/RER U
4:1 ratio of PP and PE
based on Nelson et al.
(2011)
Polyethylene
(PE) 2.78 g
Polyethylene, LDPE,
granulate, at plant/RER U
4:1 ratio of PP and PE
based on Nelson et al.
(2011)
Energy and
processes
Separator
production 13.9 g Injection moulding/RER U ecoinvent Centre (2010)
Transport
Rail Transport 2.8E-3 tkm Transport, freight, rail/RER U
ecoinvent standard
distances
Road
Transport 1.4E-3 tkm
Transport, lorry >16t, fleet
average/RER U
ecoinvent standard
distances
Infrastructure
Facility 1.03E-10 p
Plastics processing
factory/RER/I U ecoinvent standard dataset
Table 7. Input-output table for the production of LIB separator
The composition of LIB separator was obtained from ANL BatPaC model (ANL, 2011). The
separator in this model is a 20 micron thick, trilayer PP/PE/PP microporous membrane, which is
produced by a “dry” process (Arora and Zhang, 2004). The plastic injection moulding process is
used as proxy for separator production (Ellingsen et al., 2013).

128
1.5. Cell Assembly
Description Input Output Unit ecoinvent material/process Reference/Remarks
Functional unit
LIB single cell 819.85 g ANL (2011)
Materials
LIB cathode 402.14 g ANL (2011)
LIB anode 213.26 g ANL (2011)
Electrolyte 117.52 g ANL (2011)
Separator 13.9 g ANL (2011)
Positive terminal assembly (Aluminum tab) 7.31 g Aluminium, production mix, at plant/RER U ANL (2011)
Negative terminal Assembly
(Copper tab) 24.14 g
85% Copper, primary, at refinery/RER U;
15% Copper, primary, at refinery/RER U ANL (2011)
Aluminum in cell container 34.01 g Aluminium, production mix, at plant/RER U Estimated from Al layer thickness and density
PET in cell container 5.29 g
Polyethylene terephthalate, granulate,
amorphous, at plant/RER U
Estimated from PET
layer thickness and
density from ANL (2011)
Polypropylene in cell
container 2.27 g
Polypropylene granulate (PP), production
mix, at plant RER
Estimated from PP layer
thickness and density
from ANL (2011)
Energy and processes
Aluminum tab production 7.31 g Sheet rolling, aluminium/RER U ecoinvent Centre (2010)
Copper tab production 24.14 Sheet rolling, copper/RER U ecoinvent Centre (2010)
Calendering cathode,
separator and anode 0.0016 KWh Electricity, medium voltage, at grid/US U
Based on Notter et al.
(2010)
Process heat 0.086 MJ Heat, natural gas, at industrial furnace >100kW/RER U
Heating of cathode,
separator and anode.
Based on specific heat of materials
Electricity for dry room 0.2 kWh Electricity, medium voltage, at grid/US U Dunn et al. (2012)
Natural gas for dry room 1.35 MJ Natural gas, burned in industrial furnace >100kW/RER U Dunn et al. (2012)
Aluminum foil production
for cell container 34.01 g Sheet rolling, aluminium/RER U ecoinvent Centre (2010)
Plastic production for cell container 7.56 g Injection moulding/RER U ecoinvent Centre (2010)
Single cell charge, 70% 0.087
kWh Electricity, medium voltage, at grid/US U ecoinvent Centre (2010)
Transport
Rail Transport 1.46E-2 tkm Transport, freight, rail/RER U
ecoinvent standard
distances
Road Transport 7.31E-3 tkm Transport, lorry >16t, fleet average/RER U ecoinvent standard distances
Infrastructure
Facility 3.3E-10 p Chemical plant, organics/RER/I U
ecoinvent standard
dataset
Table 8. Input-output table for LIB cell assembly
Prior to cell assembly, the cathode, separator and anode are heated at 130 degree C to remove
any additional moisture (Notter et al., 2010). During cell assembly, cathode, separator and anode
are calendared and slit to size-a process requiring electricity (Notter et al., 2010).

129
The cell housing material is a tri-layer consisting of an outer layer of 0.03 mm polyethylene
terephthalate (PET), a middle layer of 0.1 mm aluminum and a 0.20 mm inner layer of
polypropylene (PP) (ANL, 2011). The mass of each of these materials in the cell container is
estimated from their respective thickness and material densities. The cell assembly takes place in
a dry room, energy consumption for which is estimated from Dunn et al. (2012).
S.1.2. LIB Pack
Each LIB pack was modeled to consist of 192 cells, weighing approximately 157 kg based on the
contribution of cell weight to the total battery weight as estimated from the BatPac model (ANL,
2011). The remaining weight of the battery pack assembly was composed of the pack and
module components, such as module casing, connectors and wiring, battery management system
(BMS), battery jacket, and coolant material.
Battery pack
assembly component
Weight
(kg) Comments
Battery pack
components 28.63
Includes battery jacket, module
compression plates and steel
straps and module interconnects
(Cu)
Module components 27.49
Includes module casing, module
terminals (Cu), cell group
interconnects (Cu) and conductor
plates (Al)
Battery Management
System (BMS) 4.77
Includes the weight of Pack
Integration Unit and Module
State-of-Charge Regulator
Assembly
Battery coolant 4.80
50% Ethylene Glycol and 50%
Water (Nelson et al., 2011)
LIB cells 157.41 192 LIB cells
Total Battery weight 223.17 Single EV LIB pack
Table 9. EV LIB pack assembly components

130
EV LIB pack components
Description Input Output Unit ecoinvent material/process Reference/Remarks
Functional unit
Battery pack components 28.63 kg ANL (2011)
Materials
Battery jacket aluminum layers 10.72 kg
Aluminium, production mix, at
plant/RER U
Estimated from the thickness
and density of Aluminum
layer of battery jacket based on ANL (2011) and Nelson et
al. (2011)
Battery jacket insulation layer 11.32 kg Glass fibre, at plant/RER U
Estimated from data from ANL (2011) and Nelson et al.
(2011)
Module compression plates and
steel straps (steel) 4.20 kg
Steel, low-alloyed, at
plant/RER U ANL (2011)
Module interconnects (Cu) 2.40 kg
85% Copper, primary, at refinery/RER U; 15% Copper,
primary, at refinery/RER U
ANL (2011); Material choice
based on Nelson et al. (2011)
Energy and processes
Aluminum jacket production 10.72 kg
Sheet rolling, aluminium/RER
U ecoinvent Centre (2010)
Insulation manufacturing 11.32 kg Injection moulding/RER U
Proxy for insulation
production
Compression plates and straps
production 4.20 kg
Steel product manufacturing,
average metal working/RER U ecoinvent Centre (2010)
Copper connector production 2.40 kg
Copper product manufacturing,
average metal working/RER U ecoinvent Centre (2010)
Transport
Rail Transport 5.726 tkm Transport, freight, rail/RER U ecoinvent standard distances
Road Transport 2.863 tkm
Transport, lorry >16t, fleet
average/RER U ecoinvent standard distances
Infrastructure
Facility for metal components
production 7.93E-9 p
Metal working factory/RER/I
U ecoinvent standard dataset
Facility for insulation
production 8.38E-9 p
Plastics processing
factory/RER/I U ecoinvent standard dataset
Table 10. Input-output table for the production of EV LIB pack components
The EV battery pack components consist of battery jacket, module compression plates and steel
straps and module interconnects. The battery jacket is comprised of two layers of aluminum with
insulation material (fiber glass) sandwiched in between (Nelson, 2011). While the jacket mass
was obtained from the BatPac model, the mass of aluminum in the jacket was calculated from
the dimensions of the pack and thickness and density of the aluminum layer. The insulation mass
was simply estimated by subtracting the weight of the Al layer from the overall jacket mass.

131
EV LIB Module Components
Description Input Output Unit
ecoinvent
material/process Reference/Remarks
Functional unit
Module components 27.49 kg ANL (2011)
Materials
Module casing 9.8208 kg
Aluminium, production
mix, at plant/RER U ANL (2011)
Module terminals 1.8768 kg
85% Copper, primary, at
refinery/RER U; 15%
Copper, primary, at
refinery/RER U ANL (2011)
Cell group interconnects 0.9984 kg
85% Copper, primary, at
refinery/RER U; 15%
Copper, primary, at
refinery/RER U ANL (2011)
Conductor plates 14.784 kg
Aluminium, production
mix, at plant/RER U
ANL(2012); Material
choice based on Nelson
et al. (2011)
Energy and processes
Module casing manufacture 9.8208 kg
Sheet rolling,
aluminium/RER U ecoinvent Centre (2010)
Module terminals
manufacture 1.8768 kg
Copper product
manufacturing, average
metal working/RER U ecoinvent Centre (2010)
Cell group interconnects
manufacture 0.9984 kg
Copper product
manufacturing, average
metal working/RER U ecoinvent Centre (2010)
Conductor plates
manufacture 14.784 kg
Sheet rolling,
aluminium/RER U ecoinvent Centre (2010)
Transport
Rail Transport 5.498 tkm
Transport, freight, rail/RER
U
ecoinvent standard
distances
Road Transport 2.749 tkm
Transport, lorry >16t, fleet
average/RER U
ecoinvent standard
distances
Infrastructure
Facility for metal
components production 1.26E-8 p
Metal working
factory/RER/I U
ecoinvent standard
dataset
Table 11. Input-output table for the production of EV LIB pack components
Table 11 represents the overall materials used in the 48 modules within the EV LIB pack
comprising 27.49 kg. This includes the aluminum cooling plates (conductor plates) that are
provided for thermal management to avoid overheating of LIB cells (Nelson et al., 2011). Due to
safety concerns, the coolant liquid (ethylene glycol and water) cannot be in direct contact with
the LIB cells, and therefore these plates are provided between the cells, which are directly cooled
by this mixture.

132
EV LIB pack assembly
Description Input Output Unit
ecoinvent
material/process Reference/Remarks
Functional unit
EV LIB pack 223.17 kg
Materials
Battery pack
components 28.63 kg
Table 10
Module
components 27.49 kg Table 11
Battery
Management
System (BMS) 4.77 kg
Modeled in ecoinvent
based on input-output data
from Ellingsen et al.
(2014)
Calculated from
BMS composition in
Supporting
Information of
Ellingsen et al.
(2014), section 2.4
Ethylene glycol in
coolant 2.4 kg
Ethylene glycol, at
plant/RNA
50% by weight in
coolant (Nelson et
al., 2011)
Water in coolant 2.4 kg
Water, deionised, at
plant/CH U
50% by weight in
coolant (Nelson et
al., 2011)
LIB cells 157.41 kg
Table 8
Energy and
processes
Welding 0.089 kWh
Electricity, medium
voltage, at grid/US U
Supporting
information for
Ellingsen et al.
(2014) table S2
Testing/activating 16.8 kWh
Electricity, medium
voltage, at grid/US U
Assumption of 70%
battery charging
Transport
Rail Transport
(coolant) 2.922 tkm
Transport, freight,
rail/RER U
ecoinvent standard
distance for organic
chemicals
Road Transport
(coolant) 0.487 tkm
Transport, lorry >16t, fleet
average/RER U
ecoinvent standard
distance for organic
chemicals
Infrastructure
Facility
1.02E-
7 p
Metal working
factory/RER/I U
ecoinvent standard
dataset
Table 12. Input-output table for EV LIB pack assembly
The various pack components and cells along with their modules are assembled together to
constitute a single EV LIB pack. A BMS is provided for monitoring battery state of charge and
thermal performance as well as for cell balancing (Nelson et al., 2011). BMS modeling was
based on data from a recent LCA study by Ellingsen et al. (2014). A 50/50 ethylene glycol and
deionized water mixture (by weight) was assumed for battery coolant material owing to its low

133
cost and common usage (ANL, 2011; Nelson et al., 2011). This mixture is added for thermal
management to ensure cooling between LIB cells by providing a medium to reject heat from the
cells. This is achieved by cooling the module conductor plates (aluminum) which are in direct
contact with the cells (described in the previous section). Electricity usage for welding during
LIB pack assembly process was calculated using data from Ellingsen et al. (2014). Additionally,
electricity input was included to account for testing and activating the EV LIB pack (Notter et
al., 2010).
S.2. EV battery use The lifespan of the lithium-ion battery in the EV is assumed to be 8 years which is consistent
with many vehicle manufacturers’ warranty terms such as Honda and Nissan. The EV use phase
of the LIB was modeled as the electricity lost due to battery efficiency over the lifetime of the
EV and the additional energy needed to carry the weight of the battery. This approach to model
the use phase of EV battery has been used in previous LCA studies (Van den Bossche et al.,
2006; Zackrisson et al., 2010).
Charge-discharge energy efficiency loss: Battery efficiency determines the amount of energy
taken out during discharge after the battery was initially charged. According to Rydh and Sandén
(2005), the efficiency of lithium-ion batteries can lie anywhere between 85% and 95%. A
constant battery efficiency is generally assumed over the entire EV use phase of the battery (Van
den Bossche et al., 2006; Zackrisson et al., 2010). However, the decay in capacity of EV battery
is accompanied with increased efficiency loss over its lifetime (Andersson et al., 2002). While
capacity fade of LIBs with cycling has been vastly investigated (Arora et al., 1998; Spotniz,
2003), not much has been published about the corresponding phenomenon of energy efficiency
fade. In this study, it is assumed that efficiency fade of LIB during EV use phase exhibits direct
correlation with capacity fade. Moreover, a linear trend in efficiency fade of LIB has been
considered on a daily basis over a period of 8 years (i.e. 2,920 days), assuming that the battery is
cycled daily. Similar assumption of linear decrease in EV LIB efficiency with cycling has been
assumed in previous studies (Ahmadi et al., 2014a, 2014b). At the beginning of life of EV LIB, a
roundtrip efficiency of 95% has been assumed based on advanced vehicle tests for Nissan Leaf
battery (Garetson, 2013). At EV end-of-life, when the residual capacity is 80%, the battery
efficiency is also considered to be 80% (Ahmadi et al., 2014b). The efficiency has been modeled
to decrease linearly with a constant decline of 5.13E-5.
A constant distance travelled by the EV every day (55 km) and a fixed rate of daily decline in
battery efficiency is considered over the LIB lifespan in EV. The charge-discharge electricity
loss due to battery efficiency (Eloss) was calculated from the distance travelled by the BEV over
its lifetime ( EVD ), LIB service life in EV ( EVl ), number of days of EV use per year ( EVd ), LIB
efficiency at day t of its use ( t ), and energy consumption rate of EV ( EVR ):
t
dl
t
EVtEVEVEVloss
EVEV
RdlDE /)*)1(*))*/((()*(
(1)
Values of these parameters are listed in Table 13:

134
Parameter Value Reference/Comments
EV battery weight (Wb) 223 kg ANL (2011)
Curb weight of EV ( EVW ) 1,456 kg Includes weight of BEV and LIB. Typical
BEV weight without battery (1,233 kg) was
estimated from average of Nissan Leaf curb
weight (1,508 kg)1 by subtracting the weight
of a 275 kg LEAF battery (Nissan North
America, Inc., 2013) from it.
Percent of electricity consumed
by the EV due to curb weight of
the vehicle ( EVPE )
30% Zackrisson (2010)
Energy consumption rate of EV
( EVR )
0.16 kWh/km ANL (2011) [Based on BatPac model
parameter]
Distance travelled by the BEV
over its lifetime ( EVD )
160,934.4 km (i.e.
100,000 miles)
Functional unit of Case 1 of LCA model–
Based on Nissan Leaf battery warranty terms
(Nissan North America, Inc., 2014)
LIB service life in EV ( EVl ) 8 years Based on Nissan Leaf battery warranty terms
(Nissan North America, Inc., 2014)
Number of days of EV use per
year ( EVd )
365 Assumed daily use
LIB efficiency in day t ( t ) 95% to 80% for t
= 1 to 2,920
Garetson (2013); Ahmadi et al. (2014a,b)
Charging efficiency ( c ) 90% Rydh and Sanden (2005)
Table 13 Parameters used to calculate EV LIB use phase electricity consumption and losses
Energy to carry EV LIB weight: The additional electricity required to carry the weight of the
223 kg battery (Eb) over the lifetime of the EV was calculated from the ratio of battery weight
(Wb) and curb weight of EV ( EVW ), percent of electricity consumed due to curb weight of the EV
( EVPE ), distance travelled by the BEV over its lifetime ( EVD ), charging efficiency ( c ), and
energy consumption rate of EV ( EVR ):
bE )/(***)/( cEVEVEVEVb RDPEWW (2)
Values of these parameters are listed in Table 13. The ratio )/( cEVR represents the plug-to-
wheel consumption rate of the vehicle.
In addition to electricity consumption, the transport of the battery from the battery manufacturer
to the car assembly site has been included in the use phase. ecoinvent transport dataset based on
Borken-Kleefeld and Weidema (2013) for shipping “other” electronic and electrical equipment
has been used as proxy, and included road and transoceanic freight. The LCA inputs for the use
phase of a 223 kg EV battery are shown in Table 14
1 http://www.nissanusa.com. Accessed 15 May 2013

135
Inputs Value Reference/Comments
Electricity used 1,314.41 kWh Electricity needed to carry battery weight. Based on equation 2
Electricity losses 3,750 kWh Charge-discharge losses based on battery efficiency. Based on
equation 1
Transport, road 71.4 tkm Borken-Kleefeld and Weidema (2013)
Transport, transoceanic
freight ship
248.2 tkm Borken-Kleefeld and Weidema (2013)
Table 14. Inputs for modeling the use phase of EV LIB
S.3. EV LIB refurbishment
To be refurbished, EV batteries will have to be collected from vehicle dealerships or service
centers, inspected and tested to determine their working condition and electrical performance,
and reconfigured into battery packs suitable for stationary applications (Cready et al., 2003). The
following assumptions have been made for the battery refurbishment stage:
1) EOL EV batteries will be transported to a refurbishment facility. There is immense
uncertainty regarding the distance travelled by EOL EV batteries to the refurbishment
facility, as currently there are no such facilities under operation. To a large extent it
would depend on the total number of such facilities operating in a specific state as
illustrated in Cready et al. (2003). In a recent study, Neubauer et al. (2012) have assumed
a distance of 30,000 miles (i.e.48,280 km) for transport of 115,920 kWh of used EV LIBs
to a refurbishing facility. Considering battery energy density of 108 Wh/kg for the
modeled EV battery from the BatPac model, 1 metric tonne of used EV batteries would
be transported over a distance of 45 km. Table 15 show the resultant transport burdens for
shipping EV LIBs needed to build a single stationary battery system (100% cell
conversion, not considering subsequent replacements)
Description Input Output Unit ecoinvent process Reference/Remarks
Battery transport to
refurbishment facility 5230.55 kg
Transport of 23.44 EV
LIB packs to build a
single stationary battery
pack storing 450 kWh
energy
Road Transport 235.35 tkm
Transport, lorry >16t,
fleet average/RER U Neubauer et al. (2012)
Table 15. Transport input for shipping 23.44 EV LIB packs to build a single stationary battery pack storing
450 kWh energy
2) The LIB cells would be tested for their remaining capacity in the refurbishment facility.
Preliminary bench scale test results were used to estimate electricity required for testing
the LIB cells using a Maccor battery test bed. The cells tests consisted of 4
charge/discharge cycles: Charging according to manufacturer profile while discharging at
C/3 to 100% rated capacity (Cready et al., 2003). Table 16 shows the electricity used in
testing 4,500 cells that was estimated from bench scale tests (to build a single stationary
battery pack with 100% cell conversion and no battery replacement).

136
Description Input Output Unit ecoinvent process Reference/Remarks
LIB cell
testing 3689.3 kg
4,500 EV LIB cells
comprising a 450
kWh stationary
battery pack
Electricity
usage 4811.957
kWh
Electricity, medium
voltage, at grid/US
U
Estimated from
bench scale testing
of LIB cells
Table 16. Electricity inputs for testing 4,500 cells from EV LIB packs to build a single stationary battery pack
storing 450 kWh energy (100% cell conversion, considering no subsequent replacements)
3) After the lithium-ion cells are tested, based on the cell conversion rate some of them
would be considered unfit for secondary application and would be shipped to a recycling
facility. The feasible cells would be repackaged into modules. It is assumed that the
battery pack components such as the battery jacket and BMS would be separated and sent
for waste management. However, most of the module components would be reused in
building the stationary energy pack. For module assembly, copper connectors and
electricity inputs for welding will be required, as shown in Table 17.
Table 17. Module assembly for refurbished LIB based stationary energy storage system
4) Additional components would be added such as battery cabinet and BMS. These are
likely to be set up at the site of installation of the stationary energy storage system. A
simplifying assumption made here is that the environmental impacts (hence, mass) of the
BMS per unit cell for the stationary energy storage system would be half of the mass of
BMS per unit cell for the EV battery pack. This assumption is based on the fact that the
Description Input Output Unit ecoinvent materials/process Reference/Remarks
Module assembly 4,333.55 4,389.80 kg
Input includes EV LIB cells and module
components. Output includes mass of EV LIB cells, EV LIB modules and
interconnects in a 450 kWh stationary
battery pack
Materials
Module
interconnects 56.25 kg
85% Copper, primary, at
refinery/RER U; 15% Copper, primary, at
refinery/RER U
Estimated from module interconnects
used in EV LIB pack (ANL, 2011)
Energy and
processes
Module
interconnects production 56.25 kg
Copper product
manufacturing, average metal working/RER U ecoinvent Centre (2010)
Welding 1.756 kWh
Electricity, medium voltage,
at grid/US U
Supporting information for Ellingsen et
al. (2014) table S2
Transport
Rail Transport 11.25 tkm Transport, freight, rail/RER U
Transport associated with module
interconnects production. ecoinvent standard distances
Road Transport 5.625 tkm Transport, lorry >16t, fleet average/RER U
Transport associated with module
interconnects production. ecoinvent standard distances
Infrastructure
Refurbishment
facility 2E-06 p
Metal working factory/RER/I
U ecoinvent standard dataset

137
BMS for a BEV battery pack will be more robust with advanced circuitry as compared to
the BMS for the less demanding stationary battery. The BMS is modeled based on
composition data from Ellingsen et al. (2014). For a typical stationary battery comprising
of 4,500 EV LIB cells, the BMS would weigh about 56 kg. It has been assumed that
during the 20 year lifespan of the stationary battery system, there will be a single
replacement of the BMS. The battery cabinet is assumed to be constructed of mild steel
sheet (European Telecommunications Standards Institute [ETSI], 2012) with dimensions
114 cm*180 cm* 170 cm and thickness of 0.2 cm. This volume has been estimated from
dimensions of a single module obtained from BatPac model. The actual cabinet
dimensions would depend upon how the modules are assembled in the stationary battery.
The weight of the cabinet was estimated at 221 kg based on density of mild steel (7.85
g/cm3). The cabinet is assumed to have a 20 year lifespan.
Description Input Output Unit ecoinvent material/process Reference/Remarks
Functional unit
Steel cabinet 1.00 kg
Materials
Mild steel 1.00 kg
Steel, low-alloyed, at
plant/RER U
Material selection
based on ETSI
(2012). [Proxy for
galvanized steel]
Energy and processes
Cabinet production 1.00 kg Sheet rolling, steel/RER U
ecoinvent Centre
(2010)
Transport
Rail Transport 0.2 tkm Transport, freight, rail/RER U
ecoinvent standard
distances
Road Transport 0.1 tkm
Transport, lorry >16t, fleet
average/RER U
ecoinvent standard
distances
Infrastructure
Cabinet production
facility 4.6E-10 p
Metal working factory/RER/I
U
ecoinvent standard
dataset
Table 18 Steel cabinet manufacturing for stationary LIB
S.4. Stationary battery use
For the stationary energy storage case (Case 2), the basic assumption is that both Li-ion and PbA
batteries have energy storage of 450 kWh (hence, the product, Voltage * Capacity is equal for
them). Both batteries deliver 150 kWh everyday-this was calculated for each cycle by adjusting
the depth of discharge (DoD) (which is in the range of 33-42%) as the batteries aged. Currently,
there is immense uncertainty in sizing an old LIB relative to an existing PbA battery. Owing to
performance uncertainties of the former, this sizing approach is considered to be a reasonable
extreme sizing scenario for an energy storage system based on second use EV LIBs. A single EV
battery (new) modeled in BatPac is assumed to have a peak power of 80 kW which is similar to a
Nissan LEAF battery (Garetson, 2013). At end of its service life in EV, the nominal as well as
peak power capability of EV LIB is expected to decrease by at least 25% from its initial value
due to increased resistance with aging (Burke, 2009). The PbA battery in Rydh (1999) upon
which the modeled PbA battery in this study is primarily based has a nominal power rating of 50
kW, which is suitable for the energy storage application selected for this study (Refer to Chapter

138
3). Hence, the stationary energy storage system based on second use LIBs is more than likely to
meet this power requirement.
S.4.1. Refurbished EV LIB based energy storage system (use phase)
The secondary use phase of EV LIBs will include the transport of the refurbished battery to its
usage site and also the electricity losses due to the charge-discharge efficiency of the battery
system. The total energy used to charge the battery and electricity transmissions losses are
outside the system boundary of this study and are considered to be part of the larger grid system.
The transport distance of the refurbished LIB modules for installation in the stationary energy
storage system is highly uncertain, and would depend on the locations of these systems as well as
the refurbishment facility (Cready et al., 2003). Since, currently these systems don’t exist, the
default average shipping distance for miscellaneous manufactured goods from Borken-Kleefeld
and Weidema (2013) was used for this purpose (0.22 tonne-km/kg). Also, BMS and the cabinet
would be shipped and installed at the site. Road based transport has been assumed for modeling
the transport of these stationary battery components. The assumptions and proxies used for
modeling these transport impacts are provided in Table 19:
Transport
description
Weight
transported
(kg)
Transport input
(tonne-km)
ecoinvent process Assumption
Transport of
LIB cell,
modules and
connectors
4389.8 970.15 Transport, lorry >16t,
fleet average/RER U
Default data for transportation of
miscellaneous manufactured products
(Borken-Kleefeld and Weidema, 2013)
BMS 56 26.38 Transport, lorry >16t,
fleet average/RER U
Default data for transportation of
electronic components and board
(Borken-Kleefeld and Weidema, 2013)
Steel cabinet 221 80.30 Transport, lorry >16t,
fleet average/RER U
Default data for transport of articles of
base metals (Borken-Kleefeld and
Weidema, 2013)
Table 19 Input data for modeling transport of LIB modules and ancillary components to
the stationary energy storage system site.
The charge-discharge electricity losses from operation of the stationary battery is estimated from
the energy storage capacity of the battery at the start of stationary use (Cs ), percent residual
capacity of the stationary battery at beginning of a given cycle k ( kPS ),charge-discharge energy
efficiency of the battery at cycle k ( k ), depth-of-discharge of stationary battery during that
cycle ( kDoD ) and cycle life of retired EV cells in stationary energy storage system ( cl ) :
kk
l
k
kkssloss DoDPSCEc
/)*)1(**(, (3)
The round trip energy efficiency of the refurbished LIB based energy storage system is assumed
to be 80% at beginning of its service life in stationary application, and declines linearly, reaching
65% (w.r.t initial EV LIB) at stationary battery end-of-life. This is based on a similar assumption
by Ahmadi et al. (2014a,b). Only the internal energy efficiency of the battery has been

139
considered to calculate the use phase losses of the battery. Other losses owing to electricity
transmission efficiency and efficiencies of charger and inverter have not been included.
The battery capacity has been modeled to reduce linearly by a constant ranging from 0.23 to
0.023 with stationary LIB lifespan in the range of 1 to 10 years (365 to 3,650 cycles)
respectively. The depth of discharge of the battery lies in the range of 33% to 42%.
The initial energy storage capacity ( sC ) of a stationary battery resulting from a single EV LIB
pack is estimated from the initial energy storage capacity (CEV ) of the EV battery (i.e. 24 kWh),
percent residual capacity of the LIB at EV end-of-life ( EVPC ) and the cell conversion rate (F):
sC = FPCC EVEV ** (4)
The cell conversion rate (F) is defined as the percentage of EV LIB cells technically feasible for
stationary energy storage use. This calculation is made under the assumption that the EV LIB
cells at their end of life would retain 80% of their initial capacity ( EVPC ) while the cell
conversion rate (F) is scenario dependent as explained in Chapter 3. For the extended life cycle
case (Case 1) of EV LIB, this stationary battery represents only a part of the stationary energy
storage system corresponding to the functional unit for the first objective of this LCA study (i.e.
one 24 kWh EV LIB). Depending on the stationary application and the size of the stationary
battery several retired EV battery packs maybe required to build a single stationary battery pack
(Cready et al., 2003).
S.4.2. Stationary lead-acid battery use phase
The stationary use phase of the PbA battery includes its transport to the usage site and also the
electricity losses due to charge discharge efficiency of the battery system.
Transport: For transport of PbA batteries to the site of usage, the default average shipping
distance for miscellaneous manufactured goods was used (0.22 tonne-km/kg) from Borken-
Kleefeld and Weidema (2013). Steel cabinet (Refer to section S6) transport was based on the
default shipping distance for articles of base metals (Borken-Kleefeld and Weidema, 2013).
Road based transport has been assumed (similar to Table 19 for stationary LIB).
Electricity losses: The charge-discharge electricity losses are calculated in the same way as that
for a Li-ion battery based system using equation (3). The efficiency of PbA battery generally lies
between 70% and 85% (Rydh and Sanden, 2005; Matheys et al., 2009; Matheys and Autenboer,
2005; Albright et al., 2012; Parker, 2001; Celik et al., 2008; Rydh, 1999). Based on this range,
three scenarios were considered for PbA battery efficiency at its beginning of life as explained in
Chapter 3. The depth-of-discharge of PbA battery system also lies between 33% and 42% and
hence, a corresponding lifespan of 5 years (or 1825 cycles) has been assumed for this battery
system (Rydh and Sanden, 2005; Bindner et al., 2005).
Unlike LIBs, PbA batteries do no start with their peak capacity, but rather at a lower capacity at
the beginning of life. However, with aging, their capacity increases and for more than half of

140
their cycle life, they are at a capacity higher than 100% of their nominal capacity and thereafter it
declines rapidly until it reaches 80% of its nominal capacity at battery end of life (McDowall,
2000; IEEE, 2011; Bindner et al., 2005). The PbA battery capacity has been modeled to reduce
linearly by a constant of approximately 0.05 over its 5 year lifespan. Battery aging is
accompanied with increase in resistance and corresponding increase in efficiency losses. A direct
correlation between increase in battery internal resistance and increase in efficiency losses is
considered. PbA battery resistance generally increases by 25%-50% of its initial value at battery
EOL (Albercorp, n.d; Davis et al., 2002). For estimating electricity losses due to PbA battery
efficiency over its lifespan, an assumption of 25% increase in resistance and hence a 25%
increase in efficiency loss at battery end of life is made. PbA batteries usually fail the standard
capacity test when internal resistance rises beyond this (Alber, n.d.). Moreover, this assumption
represents the worst case for LIBs when compared with lead-acid batteries. The increase in
battery resistance with cycling is more of a linear step function, with a slow increase in the initial
cycles and rapid increase in later cycles as illustrated for about 100 cycles by Pavlov and Petkova
(2002). A constant linear increase in resistance and hence, linear increase in efficiency loss with
cycling is a reasonable assumption for this study, considering the lack of data for as high as
1,825 cycles.
S.5. LIB EOL management
The recycling of cells within an EV battery pack would be occurring at two stages-after being
rejected for stationary use and at the end of life of the cells in the secondary energy storage
system. Currently both pyrometallurgical and hydrometallurgical processes are being used for
recycling spent lithium-ion batteries (Dunn et al., 2012; Fisher et al., 2006). It is assumed that
50% of the EOL LIB cells would be recycled by the pyrometallurgical process (Table 20) while
the remaining 50% would be recycled by the hydrometallurgical process (Table 21) based on a
recent European Commission study where an equal split between the two recycling routes was
considered (Mudgal et al., 2011). The material inputs, transportation distance (tonne km) and
energy inputs for these two processes have been obtained from the ecoinvent database (Hischier
et al., 2007) which is based on European LIB recycling data from Fisher et al. (2006). The
material outputs have been obtained from the bill of materials of the EV battery. It is assumed
that only metals would be recovered during the recycling process depending upon their
respective recycling efficiencies, while the remaining materials in the LIB cells such as mixed
plastics, graphite, electrolyte, binders etc. would be sent to the landfill (Table 20 and Table 21).

141
Description Input Output Unit ecoinvent material/process Reference/Remarks
Waste specification
name
End-of-life LIB cells 1 kg
Avoided materials
Manganese oxide 0.35 kg Manganese oxide (Mn2O3), at plant/CN U
Recovered in the form of MnO2 (Fisher et al., 2006). Mn recovery estimated from
cell BOM and 92% manganese yield (mid
value from Wang et al., 2014a). Also, Mn content of MnO2 is 63% (stoichiometric
calculation). Mn2O3 used as proxy for
MnO2 since it is the actual input in battery production (Dunn et al., 2012).
Primary aluminum 0.037 kg Aluminium, primary, at plant/RER U
Estimated from cell BOM, 68% virgin
inputs and 55% aluminum yield (mid value from Wang et al., 2014a).
Primary copper 0.012 kg Copper, primary, at refinery/GLO U
Estimated from cell BOM, 85% virgin
inputs and 10% copper yield (mid value from Wang et al., 2014a).
Material inputs
Water 0.001 m3
Water, unspecified natural
origin, US
Hischier et al. (2007), based on Fisher et
al. (2006)
Sodium hydroxide 0.35 kg
Sodium hydroxide, 50% in
H2O, production mix, at
plant/RER U
Hischier et al. (2007), based on Fisher et
al. (2006)
Energy and processes
Electricity 0.8 kWh
Electricity, medium voltage,
at grid/US U
Hischier et al. (2007), based on Fisher et
al. (2006)
Transport
Road transport 0.5 tkm Transport, lorry >16t, fleet average/RER U Hischier et al. (2007)
Infrastructure
Recycling facility 5E-10 p
Facilities blister-copper
conversion, secondary copper/SE/I U Hischier et al. (2007)
Waste treatment
Plastic disposal 0.056 kg
Disposal, plastics, mixture, 15.3% water, to sanitary
landfill/CH U
Calculated from cell BOM and includes binder and plastic in cell container and
separator
Metal slag 0.2 kg
Disposal, nickel smelter slag,
0% water, to residual material landfill/CH U
Calculated from cell BOM (Al, Cu, Li and Mn). Recovered metal was subtracted
Process residues and
other non-recycled materials 0.677 kg
Process-specific burdens, sanitary landfill/CH U
Includes carbon and electrolyte from cell
BOM and process inputs to obtain a mass
balance of inputs and outputs (water input not included)
Table 20 Pyrometallurgical recycling process for LIB cells

142
Description Input Output Unit ecoinvent material/process Reference/Remarks
Waste specification
name
End-of-life LIB cells 1 kg
Avoided materials
Lithium carbonate 0.044 kg Lithium carbonate, at plant/GLO U
Lithium recovery estimated from cell BOM and 55% lithium yield (mid value from
Wang et al., 2014a). Also, Li content of
Li2CO3 is 19% (stoichiometric calculation).
Primary aluminum 0.037 kg Aluminium, primary, at plant/RER U
Estimated from cell BOM, 68% virgin inputs and 55% aluminum yield (mid value
from Wang et al., 2014a).
Primary copper 0.012 kg Copper, primary, at refinery/GLO U
Estimated from cell BOM, 85% virgin
inputs and 10% copper yield (mid value
from Wang et al., 2014a).
Material inputs
Water 0.001 m3
Water, unspecified natural origin,
US
Hischier et al. (2007), based on Fisher et al.
(2006)
Reagent 0.025 kg
Chemicals inorganic, at plant/GLO
U
Hischier et al. (2007), based on Fisher et al.
(2006)
Sulphuric acid 0.23 kg Sulphuric acid, liquid, at plant/RER U
Hischier et al. (2007), based on Fisher et al. (2006)
Lime 0.116 kg Lime, hydrated, packed, at plant/CH U
Hischier et al. (2007), based on Fisher et al. (2006)
Energy and processes
Electricity 0.14 kWh Electricity, medium voltage, at grid/US U
Hischier et al. (2007), based on Fisher et al. (2006)
Transport
Road transport 0.5 tkm
Transport, lorry >16t, fleet
average/RER U Hischier et al. (2007)
Infrastructure
Recycling facility 4E-10 p Chemical plant, organics/RER/I U Hischier et al. (2007)
Waste treatment
Plastic disposal 0.056 kg Disposal, plastics, mixture, 15.3% water, to sanitary landfill/CH U
Calculated from cell BOM and includes
binder and plastic in cell container and separator
Gypsum (as CaSO4,
H2O) 0.339 kg
Disposal, gypsum, 19.4% water, to
sanitary landfill/CH U
Hischier et al. (2007), based on Fisher et al.
(2006)
Process residues and
other non-recycled
materials 0.864 kg
Process-specific burdens, sanitary
landfill/CH U
Calculated from mass balance of inputs and
outputs (water input not included)
Table 21 Hydrometallurgical recycling process for LIB cells
Apart from LIB cell recycling, EOL management of LIB pack and module components was also
modeled. In addition, components added to the stationary battery during refurbishment (e.g.
BMS, copper connectors) were assumed to be recycled as well at their EOL. The recycling
processes for metals in these components were modeled using data for secondary metal
production from the ecoinvent database and recycling credit was provided for avoiding the
production of primary metal wherever used. Transport of EOL components to a recycling facility

143
was based on data from Hischier et al. (2007) for waste LIB transport (i.e. 0.5 tonne km of road
transport per kg of waste).
Description Input Output Unit ecoinvent material/process Reference/Remarks
Waste specification
name
EV LIB pack
components EOL
management 33.4 kg
Includes battery jacket, module compression plates and steel straps,
module interconnects (Cu) and coolant
for a single EV LIB pack
Avoided materials
Primary steel 2.166 kg Steel, converter, low-alloyed, at plant/RER U
Credit is provided for avoiding 63% primary steel in the initial inputs
Primary aluminum 7.084 kg
Aluminium, primary, at
plant/RER U
Credit is provided for avoiding 68%
virgin aluminum inputs
Primary copper 1.556 kg
Copper, primary, at
refinery/GLO U
Credit is provided for avoiding 85%
virgin aluminum inputs
Processes
Steel recycling 3.8 kg
Steel, electric, un- and low-
alloyed, at plant/RER U
Proxy for steel recycling.Material
recovery estimated from EV LIB pack BOM and 90% recycling efficiency of
steel (based on ecoinvent Centre, 2010)
Aluminum recycling 10.41 kg
Aluminium, secondary, from
old scrap, at plant/RER U
Proxy for aluminum recycling. Material
recovery estimated from EV LIB pack BOM and 97% yield of secondary
aluminum in ecoinvnet database
(ecoinvent Centre, 2010)
Copper recycling 1.83 kg
Copper, secondary, at
refinery/RER U
Proxy for copper recycling. Material
recovery estimated from EV LIB pack
BOM and 76% yield for secondary copper in ecoivent database (ecoinvent
Centre, 2010)
Transport
Road transport 16.7 tkm
Transport, lorry >16t, fleet
average/RER U
Same as transport data for waste LIBs
from Hischier et al. (2007)
Waste treatment
Disposal of coolant 4.8 kg
Disposal, antifreezer liquid,
51.8% water, to hazardous waste incineration/CH U LIB pack BOM from ANL (2011)
Disposal of fiber glass insulation in
battery jacket 11.32 kg
Disposal, inert waste, 5% water, to inert material
landfill/CH U LIB pack BOM from ANL (2011)
Table 22. EOL management of EV LIB pack components
Table 22 represents the EOL management of EV LIB pack components. In a similar way, EOL
management of module components was modeled. The EOL management of BMS was modeled
as shown in Table 23.

144
Description Input Output Unit ecoinvent material/process Reference/Remarks
Waste
specification
name
EV LIB BMS recycling 4.77 kg ANL (2011)
Avoided
materials
Primary steel 1.012 kg
Steel, converter, low-
alloyed, at plant/RER U
Credit is provided for avoiding 63%
primary steel in the initial inputs
Primary
aluminum 0.049 kg
Aluminium, primary, at
plant/RER U
Credit is provided for avoiding 68%
virgin aluminum inputs
Primary copper 0.158 kg
Copper, primary, at
refinery/GLO U
Credit is provided for avoiding 85%
virgin copper inputs
Processes
Steel recycling 1.775 kg
Steel, electric, un- and low-
alloyed, at plant/RER U
Proxy for steel recycling. Material
recovery estimated from BMS BOM
(based on Ellingsen et al., 2014) and 90% recycling efficiency of steel
(based on ecoinvent Centre, 2010)
Aluminum recycling 0.072 kg
Aluminium, secondary,
from old scrap, at plant/RER U
Proxy for aluminum recycling.
Material recovery estimated from BMS BOM (based on Ellingsen et al.,
2014) and 97% yield of secondary
aluminum in ecoinvnet database (ecoinvent Centre, 2010)
Copper recycling 0.186 kg
Copper, secondary, at refinery/RER U
Proxy for copper recycling. Material
recovery estimated from BMS BOM (based on Ellingsen et al., 2014) and
76% yield for secondary copper in
ecoivent database (ecoinvent Centre, 2010)
Transport
Road transport 2.385 tkm Transport, lorry >16t, fleet average/RER U
Same as transport data for waste LIBs from Hischier et al. (2007)
Waste
treatment
Disposal of printed wiring
board 2.088 kg
Disposal, treatment of printed wiring boards/GLO
U
Includes printed wiring board, IC
circuit, passive electronic components
and trace amounts of metals like brass and tin. Based on BMS composition
data from Ellingsen et al. (2014).
Disposal of
plastic parts in BMS 0.4 kg
Disposal, plastics, mixture,
15.3% water, to sanitary landfill/CH U
Based on BMS composition data from Ellingsen et al. (2014).
Table 23. EOL management of BMS from a single EV battery pack.
Similar process modeling was used for EOL BMS for the stationary battery pack but was
adjusted for the reduced BMS size. Recycling of copper connectors used in stationary LIB pack
was modeled using secondary copper production data from ecoinvent database (ecoinvent
Centre, 2010) similar to the processes described in tables above (76% recycling yield, and credit
provided for avoiding 85% primary copper). Similarly, recycling process of battery cabinet
employed recycling efficiency of 90% and credits were provided for avoiding 63% primary steel
inputs (ecoinvent Centre, 2010). Secondary steel production process in ecoinvent database was

145
used as a proxy for the cabinet recycling process [Steel, electric, un- and low-alloyed, at
plant/RER U].
S.6. Lead-acid battery life cycle (production and recycling)
The life cycle of the lead-acid battery system includes the production of the lead-acid battery, its
stationary use and its recycling.
The system boundary for Case 1 of this LCA study has been extended to include the life cycle of
a PbA battery system used for stationary energy storage which is basically being avoided due to
use of retired EV batteries for that purpose (Figure 2.1 in the Chapter 3). A PbA battery storing
and delivering energy equivalent to a refurbished EV LIB based stationary system has been
assumed. Again, in actuality this system will represent only part of a PbA battery, whose size is
determined by the LIB which replaces it (based on cell conversion rate, F of EV LIBs).
For the stationary energy storage case (Case 2), a 450 kWh PbA battery has been considered
which provides daily functionality equivalent to a refurbished LIB based system.
S.6.1 Lead-acid Battery production The material composition of the lead-acid battery was estimated from Rydh (1999), Rantik
(1999) and Sullivan and Gaines (2012). Based on an average energy density of 34.5 Wh/kg
(Rydh, 1999; Rydh and Sanden, 2005), the mass of the PbA battery system storing 450 kWh of
energy was estimated at 13,043.48 kg.
Material Battery component Weight percent Kg/battery Reference
Lead Active material,
grids and poles 61.20% 7983
Rydh, 1999; Rantik,1999
Water Electrolyte (dilution
to 1.295s.g.) 13.30% 1735
Rydh, 1999
Sulfuric acid Electrolyte 9.60% 1252 Rydh, 1999
Polypropylene Cases and cover 10.00% 1304 Sullivan and Gaines, 2012
Antimony (Sb) Grid alloys 1.00% 130 Sullivan and Gaines, 2012
Glass Glass mat separator 2.00% 261 Sullivan and Gaines, 2012
Copper Connector 0.30% 39 Rydh, 1999
Oxygen In PbO2 (lead oxide) 2.26% 295 Rantik, 1999
Expander In PbO2(lead oxide) 0.34% 44 Estimated from remaining mass percent
Table 24. Composition of lead-acid battery
A 47/53 mix of recycled and virgin lead is assumed for the PbA battery (Hittman Associates,
1980; Sullivan and Gaines, 2012). In addition to these components, a battery cabinet composed
of mild steel is provided for the lead-acid battery system. The amount of steel used in the cabinet
was estimated to be 380.44 kg based on lead-acid battery cabinet mass for a solar power system
(European Telecommunications Standards Institute [ETSI], 2012), and scaling it on the basis of
battery mass for the system defined here. Similar to the stationary LIB system, the cabinet is
assumed to have a 20 year lifespan. The production of the battery cabinet has been modeled
similar to the cabinet for the PbA system (Table 18). For plastic cases, 70% recycled plastic is
assumed, based on the average recycled content for PbA batteries (Battery Council International,
2012). Unlike LIBs, it is not essential to have a BMS for PbA battery systems (Matheys and
Autenboer, 2005) and hence it has not been included. The energy use for battery manufacturing

146
was obtained from Hittman Associates (1980) and included electricity and heat used in the lead
oxide paste production, grid manufacturing, plate manufacturing and battery assembly and
formation. Table 25 represents the input-output for producing a single PbA battery with a 5 year
service life in stationary application [Does not include cabinet manufacturing].
Description Input Output Unit ecoinvent material/process Reference/Remarks
Functional unit
Lead-acid battery system 13043.48 kg Weight of a PbA battery system
Materials
Lead 7982.61 kg
53% Lead, primary, at
plant/GLO U; 47% Lead,
secondary, at plant/RER U
47/53 mix of recycled and virgin lead based on Hittman Associates (1980).
Percentage of lead by weight based on
Rydh (1999) and Rantik (1999)
Water 1734.78 kg Water, deionised, at plant/CH U % by weight based on Rydh (1999)
Sulphuric Acid 1252.17 kg
Sulphuric acid, liquid,at
plant/RER U % by weight based on Rydh (1999)
Polypropylene (Cases
and cover) 1304.35 kg
30% Polypropylene, granulate,
at plant/RER U; 70% Recycled postconsumer HDPE
pellet/RNA
70 percent recycled plastic in the
battery based on average percentage
from Battery Council International (2012). Postconsumer HDPE used as
proxy for recycled polypropylene.
Antimony 130.43 kg Antimony, at refinery/CN U Percentage by weight based on Sullivan and Gaines (2012)
Glass 260.87 kg Glass fibre, at plant/RER U Percentage by weight based on Sullivan and Gaines (2012)
Copper connectors 39.13 kg
85% Copper, primary, at
refinery/RER U; 15% Copper, primary, at refinery/RER U
Percentage by weight based on Rydh (1999)
Oxygen 294.78 kg Oxygen, liquid, at plant/RER U
Percentage by weight based on Rantik
(1999)
Barium sulphate 41.02 kg Chemicals inorganic,at plant/GLO U
92.5% of barium sulphate in expander based on Boden (1998)
Carbon black 3.33 kg Carbon black, at plant/GLO U
Average percentage (7.5%) of carbon in
expander based on Boden (1998)
Energy and processes
Plastic cases and cover
production 1304.35 kg Injection moulding/RER U ecoinvent Centre (2010)
Copper connectors
production 39.13 kg Wire drawing, copper/RER U ecoinvent Centre (2010)
Electricity 4043.48 kWh Electricity, medium voltage, at grid/US U
Combined consumption for paste
manufacture, grid manufacture, plate
manufacture and assembly and formation. Hittman Associates (1980)
Process heat, Natural gas 35608.7 MJ Natural gas, burned in industrial furnace >100kW/RER U
Combined consumption for paste
manufacture, grid manufacture and
plate manufacture. Hittman Associates (1980)
Process heat, Heavy fuel oil 3260.87 MJ
Heat, heavy fuel oil, at industrial furnace 1MW/RER U
Combined consumption for grid
manufacture and plate manufacture. Hittman Associates (1980)
Transport
Rail Transport 3202.17 tkm Transport, freight, rail/RER U ecoinvent standard distances
Road Transport 1289.6 tkm Transport, lorry >16t, fleet average/RER U ecoinvent standard distances
Infrastructure
Facility for battery
assembly 5.22E-6 p
Chemical plant, organics/RER/I
U ecoinvent standard dataset
Facility for active
material, grids and poles
manufacturing 3.66E-6 p Metal working factory/RER/I U ecoinvent standard dataset
Table 25 Input-output table for lead-acid battery production

147
S.6.2. Lead-acid battery recycling
For the recycling of PbA battery, the energy and material inputs were estimated from lead-acid
battery recycling data from Fisher et al. (2006) as well as the ecoinvent data for secondary lead
production (ecoinvent Centre, 2010 based on Fisher et al. 2006) which is assumed to have 100%
material recovery efficiency. Recycling credits are provided for avoiding the production of 53%
primary lead (Table 26).
Description Input Output Unit
ecoinvent
material/process Reference/Remarks
Waste specification name
Lead-acid battery
recycling 1 kg
Avoided materials
Primary lead 0.324 kg
Lead, primary, at
plant/GLO U
Credit is provided for avoiding 53%
primary lead in the battery
Processes
Lead-acid battery
recycling process 0.612 kg
Lead, secondary, at
plant/RER U
Proxy for lead-acid battery recycling
process. 100% recycling efficiency (Fisher
et al., 2006) and 61.2% lead content in the
battery is assumed (Rydh, 1999)
Transport
Road transport 0.5 tkm
Transport, lorry >16t,
fleet average/RER U
Same as transport data for waste LIBs from
Hischier et al. (2007)
Table 26 Lead-acid battery recycling
Apart from PbA battery recycling, the cabinet was also recycled and appropriate credits provided
for avoiding primary steel production. It was modeled similar to recycling of stationary LIB
cabinet- recycling efficiency of 90% and credits provided for avoiding 63% primary steel inputs
(ecoinvent Centre, 2010). Secondary steel production process in ecoinvent database was used as
a proxy for the cabinet recycling process.
S.7. Additional results-Global Warming Potential (GWP)
(A) Extended life cycle (Case 1)
Figure S1: Sensitivity Analysis: Global Warming Potential of EV Lithium-ion battery with extended life
under different scenarios of cell conversion rate and refurbished EV LIB lifespan

148
(C) Stationary energy storage case (Case 2)
Figure S2: Global Warming Potential of stationary energy storage system (Base case scenario)
Figure S3: Impact of cell conversion rate and refurbished battery lifespan on environmental
feasibility of EV LIB reuse in terms of Global warming potential (cut-off allocation scenario).

149
Figure S4: Impact of cell conversion rate and refurbished battery lifespan on environmental feasibility of EV
LIB reuse in terms of Global warming potential (50/50 allocation method)
Figure S5: GWP of refurbished EV LIB based energy storage system under different allocation approaches
(Considering 5 year battery lifespan in stationary application in all cases)
0
100
200
300
400
500
600
700
Cutoff Market price based Energy storage based
50/50
Glo
bal W
arm
ing
Pote
ntia
l 1,0
00 k
g CO
2 eq
.
100% conversion 75% cell conversion
50% cell conversion 25% cell conversion
PbA battery (Baseline efficiency) Pba battery (High efficiency)
Pba battery (Low efficiency)

150
APPENDIX C
S1. Electric vehicle lithium-ion battery waste flows
Based on a conservative baseline of electric vehicle (EV) adoption, Material Flow Analysis
(MFA) results for year 2030 indicated a waste stream of 294,440 lithium-ion battery (LIB) packs
(Richa et al., 2014). This forecasted stream consisted of 25% BEV [Battery electric vehicle],
36% long range PHEV [Plug-in hybrid electric vehicle] and 39% short range PHEV LIB packs.
EV-type BEV PHEV-50 PHEV-12
Battery units with remaining useful life
in EV application
22,838 41,756 45,052
Battery units reaching EOL in EV use 50,841 64,802 69,153
Table S1 (a). EOL LIBs from battery and plug-in electric vehicles-Year 2030. The no. of packs are obtained
from the baseline EOL EV battery outflows from Richa et al. (2014).
These forecasted waste flows were normalized to 1,000 LIB packs to indicate a functional unit
representing future annual EV LIB waste stream for a given year “n”. The mass of the waste
stream was calculated from battery packs modeled Argonne National Laboratory BatPac tool
(Nelson et al., 2011) resulting in an estimated waste stream of 160 MT for the chosen functional
unit.
EV-type BEV PHEV-50 PHEV-12 Total
Battery units with remaining useful life
in EV application
78 142 153 372
Metric tons 26 23 7.6 56
Battery units reaching EOL in EV use 173 220 235 628
Metric tons 57 35 11.6 104
Table S1 (b). EOL LIBs from battery and plug-in electric vehicles normalized to 1,000 pack units. The mass
of the waste stream was calculated from battery packs modeled in Argonne National Lab BatPac model
(Nelson et al., 2011).

151
S2. Battery bill of materials
Individual LIB packs and corresponding cells for BEV and PHEV batteries for the case study
were modeled in Argonne National Laboratory BatPac model as indicated in Table S2.
Amount per cell
(g)
BEV
pack
Low range PHEV
pack
High range PHEV
pack
Aluminum
79.84 87.01 74.23
Copper
109.18 125.88 101.79
Lithium
12.05 10.83 11.12
Manganese
190.76 171.44 176.07
Graphite
116.49 104.74 107.61
Carbon
21.16 19.02 19.53
Binder
23.76 21.36 21.94
Plastic
20.95 23.63 19.41
Electrolyte
114.58 109.09 105.82
Other
111.04 99.80 102.49
Total cell
799.81 772.79 740.01
Table S2 (a) Bill of materials of individual Lithium Manganese Oxide cells in BEV and PHEV battery packs
(Based on Nelson et al., 2011).

152
Table S2 (b). Bill of materials of BEV and PHEV battery packs comprising of Lithium Manganese Oxide cells
(Based on Nelson et al., 2011)
The printed circuit board (PCB) is considered to be composed of 35% metal with,
18.67% copper, 0.036% gold, 0.01% palladium and 4.13% aluminum, which are the
priority four metals from an environmental and economic standpoint for PCB recycling
(Wang and Gaustad, 2012)
The percentage of hexafluorophosphate (LiPF6) salt in the electrolyte is 15% by mass
(Nelson et al., 2011). The remaining electrolyte is composed of ethylene carbonate
solvent.
S3. Additional material input during reuse in EV
EV LIB type BEV PHEV-12 PHEV-50
No. of packs
reused in EVs 78 153 142
No. of cells/pack
replaced (10%) 32 4 16
Table S3 (a). No. of cells replaced per pack for each EV LIB type
Amount per battery pack (kg)
Material BEV (39
kWh)
Low range
PHEV (4.4
kWh)
High range
PHEV (18
kWh)
Aluminum 65.69 9.61 33.26
Copper 37.28 7.96 18.32
Lithium 3.86 0.43 1.78
Manganese 61.04 6.86 28.17
Steel 7.71 4.37 4.48
Graphite 37.28 4.19 17.22
Carbon 6.77 0.76 3.12
Binder 7.60 0.85 3.51
Plastic 7.14 1.29 3.49
PCB* 2.31 1.82 2.03
Fiber glass 14.98 1.76 8.04
Coolant
(Water+ethylene
glycol)
6.64 1.19 3.34
Electrolyte 36.67 4.36 16.93
Other 35.53 3.99 16.40
Total 330.50 49.45 160.10

153
78 BEV packs
(kg)
153 PHEV-12
packs (kg)
142 PHEV-50
packs (kg) All packs (kg)
Aluminum
198.16 53.25 168.44
419.84
Copper
270.99 77.05 230.96
578.99
Lithium
29.91 6.63 25.23
61.77
Manganese
473.48 104.93 399.51
977.92
Graphite
289.14 64.10 244.17
597.41
Carbon
52.52 11.64 44.31
108.47
Binder
58.98 13.07 49.78
121.83
Plastic
51.99 14.47 44.04
110.50
Electrolyte
284.41 66.76 240.10
591.27
Other
275.62 61.08 232.56
569.26
Total
1,985.20 472.97 1,679.10
4,137.27
Table S3 (b). Additional material input for LIB reuse in EVs for the case study
S4. EV battery charge-discharge efficiency losses
The charge-discharge electricity loss due to EV battery efficiency (Eloss) was calculated from the
total distance travelled by the two EVs using the LIB ( EVD ), design lifespan of LIB in EV use (
dl ), number of cycles of EV use per year ( EVd ), LIB efficiency at cycle t of its use ( t ), energy
consumption rate of EV in kWh/mile ( EVR ), and percent of miles powered by electricity (Pe):
e
EVddl
tEVtEVdEVloss PRdlDE *)*)1(*))*/(((
)*(
The above equation is adapted from Zackrisson et al. (2010). A direct correlation between
capacity decay and battery charge-discharge efficiency has been assumed and after reuse in EVs,
the capacity as well as efficiency of LIBs are reduced to 80% (Ahmadi et al., 2014a,b; Richa et
al., 2015). It is assumed that the efficiency decay is linear.
Based on warranty terms for Nissan LEAF battery (Nissan North America, Inc., 2014), it was
assumed that typically EVs would provide 100,000 miles operation during the design lifespan of
LIB ( EVD ). For a BEV, 100% of the travel miles are powered by electricity. For the 12 mile and
50 mile electric range PHEVs, this percentage was estimated to be 23% and 61%, respectively

154
by curve-fitting to prior data corresponding to fraction of total vehicle distance and the PHEV
range provided by Samaras and Meisterling (2008).
Fig. S4 Fraction of total vehicle distance powered by electricity and the PHEV range
Parameter Value Reference/Comments
Energy consumption rate of EV (EVR ) 0.16 kWh/km Nelson et al. (2011) [Based on BatPac model
parameter]
Distance travelled by the BEV over its
lifetime (EVD )
160,934.4 km (i.e.
100,000 miles)
Nissan LEAF battery warranty terms (Nissan
North America, Inc., 2014)
Design lifespan of EVLIB ( dl ) 9 years Richa et al. (2014)
Number of days of EV use per year (EVd ) 365 Assumed daily use
LIB efficiency in day t (t ) 95% to 80% for t
= 1 to 3,285
Garetson (2013); Ahmadi et al. (2014a,b)
Percent of miles powered by electricity (Pe) 12 mile PHEV: 23%; 50 mile PHEV: 61%
Table S4. Parameters used to calculate charge-discharge electricity loss due to battery efficiency (Eloss) during
EV use
S5. Battery testing for refurbishment for reuse in EVs
Conservative EV LIB testing scenario: One charge at 70% of total battery capacity
Electricity usage (kWh) = Battery capacity*0.70/battery efficiency
Aggressive battery testing scenario: Testing individual cells
Electricity used for testing 1 kWh cell = 10.69 kWh (Richa et al., 2015)
Electricity usage (kWh) =Battery capacity*10.69
23%
47%
61% 68%
76%
y = 0.2681ln(x) - 0.4355
0%
10%
20%
30%
40%
50%
60%
70%
80%
90%
0 10 20 30 40 50 60 70 80 90 100
Pe
rce
nt
mile
s p
ow
ere
d b
y e
lect
rici
ty
PHEV range

155
The aggressive battery testing scenario is based on bench scale cell testing and includes energy
efficiency losses and 4 charge-discharge cycle on a Maccor Test Bed, testing equipment and
computer operation over the duration of the test (Richa et al., 2015).
S6. Future new, used and refurbished battery prices
High ($/kWh) Low ($/kWh) Data source
Future New EV
battery cost
440 125 Neubauer et al. (2012)
Used battery selling
price
100 20 Neubauer et al. (2012)
Refurbished battery
buying price
132 38 Neubauer et al. (2012)
Lead acid battery
cost
120 65 Albright et al., 2012
Table S6. Future new, used and refurbished battery prices
S7. Environmental Impact of LIB Recycling
LIB cell recycling was modeled from LCI data obtained from the ecoinvent database (Hischier et
al., 2007) and Fisher et al. (2006). Through the pyrometallurgical route, manganese is recovered
as manganese oxide, while the hyrometallurgical recycling pathway yields lithium carbonate
(Fisher et al., 2006). The recycling processes for metals in LIB pack components were modeled
using data for secondary metal production from the ecoinvent database.
Data for estimating the environmental impact of LIB recycling is provided in the following table:
MJ/kg CTUe/kg Data source
LIB Cell recycling-hydrometallurgy 5.7 0.8
LCI from Richa et al. (2015), based
on Hischier et al., 2007; ecoinvent
Centre, 2010; Fisher et al., 2006
LIB Cell recycling-pyrometallurgy 19.6 1.3
LCI from Richa et al.; (2015), based
on Hischier et al., 2007; ecoinvent
Centre, 2010; Fisher et al., 2007
Steel-secondary 8.9 27.8 ecoinvent Centre, 2010
Aluminum-secondary 23.8 4.47 ecoinvent Centre, 2010
Copper-secondary 28.1 20.9 ecoinvent Centre, 2010
Gold-secondary 7450 223 ecoinvent Centre, 2010
Palladium-secondary 3900 117 ecoinvent Centre, 2010
Table S7 (a). Data for estimating the environmental impact of LIB recycling

156
Data for estimating the avoided impact from LIB recycling is provided in the following table:
MJ/kg CTUe/kg Data source
Lithium carbonate 42.5 7.5 ecoinvent Centre, 2010
Manganese oxide 37.9 2.3 ecoinvent Centre, 2010
Steel-primary 30.9 8.02 ecoinvent Centre, 2010
Aluminum-primary 194 39.2 ecoinvent Centre, 2010
Iron-primary 25 1.01 ecoinvent Centre, 2010
Copper-primary 60.5 607 ecoinvent Centre, 2010
Nickel-primary 121 17.3 ecoinvent Centre, 2010
Cobalt-primary 128 9.2 ecoinvent Centre, 2010
Gold-primary 313000 981000 ecoinvent Centre, 2010
Palladium-primary 177000 24800 ecoinvent Centre, 2010
Table S7 (a). Data for estimating the avoided impact from LIB recycling
S8. LIB Recycling Cost
Recycling of EOL EV LIBs generated in a given year along with the additional material input for
the reuse and cascaded use stages is likely to occur in three cycles C1, C2 and C3 separated by
time lags (Figure 4.2 in Chapter 4). Cycle 1 (C1) recycling (year n) would include EV LIBs not
tested feasible for reuse or cascaded use in that year, 10% reject cells from EV LIB packs during
refurbishment for reuse application in EVs, and rejected pack components during refurbishment
and assembly for C1 cascaded use stationary LIB systems. Cycle 2 (C2) recycling would follow
4.5-5 years later and would include EV LIB packs not tested feasible for cascaded use after reuse
in EVs, rejected pack components during refurbishment and assembly of C2 cascaded use
stationary LIB systems, and C1 cascaded use stationary LIB systems reaching EOL. Cycle 3
(C3) recycling would follow after another 5 years (i.e. year n+9.5) and would include C2
cascaded use stationary LIB systems reaching EOL.
The total cost (TCrec,m)of operating LIB recycling facility was calculated using fixed cost of
1,000,000 $/year for a maximum recycling capacity of 34,000 metric tons of LIB waste per year
(Wang et al., 2014b). A conservative variable cost of 1,100 $/metric ton of LIB waste was
employed (Wang et al., 2014b).
TCrec,m = 1,000,000 + (1,100*(34,000))
The cost of recycling LIBs for each recycling cycle (TCrec,c) was calculated from the weight of
LIB waste considered for recycling in each cycle (Wc) for the analyzed waste stream, the
maximum recycling capacity (Wm) and the cost of operating the recycling facility (TCrec,m):
TCrec,c= (Wc /Wm)* (TCrec,m)
Total cost of recycling operations (TCrec) for the analyzed waste stream was estimated as the sum
of TCrec,c for the three recycling cycles.

157
S9. LIB metal recycling efficiency and commodity value
Recycled
metal
Recycling efficiency
[RE] (%)
RE Source Material price
$/kg
Price Source
Aluminum 60 Graedel et al. (2011) 2.08 USGS, 2015
Copper 53 Graedel et al. (2011) 7.33 USGS, 2015
Lithium 55 Mantuano et al. (2006) 6.80 (Lithium
Carbonate)
USGS, 2015
Manganese 53 Sibley (2011) 2.22 www.infomine.com
Iron and Steel 52 Graedel et al. (2011) 0.67 USGS, 2015
Nickel 68 Graedel et al. (2011) 15.02 USGS, 2015
Cobalt 57 Graedel et al. (2011) 28.42 USGS, 2015
Gold 96 Graedel et al. (2011) 46,000 USGS, 2015
Palladium 79 Graedel et al. (2011) 23,500 USGS, 2015
Table S9 (a). Metal recycling efficiencies and metal prices
Varying the composition of the analyzed waste stream based on specific chemistry or an equal
mix of LMO, NCM and LFP chemistry, resulted in the following estimates for the recycling
stream (Considering conservative variable cost of recycling at1,100 $/metric ton):
LMO NCM LFP Equal mix
Amount of waste sent for
recycling (mT)
167 147 189 168
Total cost of recycling (USD) 188,424 166,333 214,130 118,495
Total material value (USD) 237,381 418,323 237,406 226,569
Net economic benefit (USD) (48,957) (251,990) (23,276) (108,074)
CED (MJ) (3,521,975.71) (4,077,610.31) (4,113,719.73) (3,904,435.25)
Table S9 (b). Sensitivity analysis of recycling pathway under different LIB chemistry scenario

158
The material value from the recycling stream was calculated for LFP and NCM chemistry as
follows:
1. LFP
Cells recycling
Recycled metal
Amount in
waste stream
(kg)
%
recovery
Actual
Recovery
(kg)
Material
price $/kg
Total
recovered
value ($)
Aluminum
16,112.46 0.6
9,667.48 2.08
20,076.99
Copper
22,341.34 0.53
11,840.91 7.33
86,746.10
Lithium
1,705.53 0.55
4,937.06 6.80
33,571.99
Iron
13,726.31 0.52
7,137.68 0.67
4,782.25
Total 145,177.34
Table S9 (c ) Material value from LFP cells
Pack material recycling
Recycled metal
Amount in waste
stream (kg)
%
recovery
Actual
Recovery
(kg)
Material
price $/kg
Total
recovered
value ($)
Steel
7,436.52 0.52
3,866.99 0.67
2,596.04
Aluminum
24,984.74 0.6
14,990.84 2.08
31,132.33
Copper
4,234.67 0.53
2,244.37 7.33
16,442.21
Gold
0.87 0.96
0.83 45645.16
38,079.11
Palladium
0.24 0.7
0.17 23548.39
3,979.03
Total 92,228.71
Table S9 (d ) Material value from LFP battery pack materials

159
2. NMC
Cells Recycling
Recycled
metal
Amount in
waste stream
(kg)
%
recovery
Actual
Recovery
(kg)
Material
price $/kg
Total
recovered
value ($)
Aluminum
11,101.63 0.6
6,660.98 2.08
13,833.23
Copper
15,445.75 0.53
8,186.25 7.33
59,972.17
Lithium
2,743.96 0.55
7,943.03 6.80
54,012.61
Manganese
6,550.94 0.53
5,511.11 2.22
12,234.66
Cobalt
7,026.96 0.68
4,778.33 28.42
135,788.70
Nickel
6,998.34 0.57
3,989.05 15.02
59,907.19
Total
335,748.56
Table S9 (e ) Material value from NMC battery cells
Pack material recycling
Recycled
metal
Amount in
waste stream
(kg)
%
recovery
Actual
Recovery
(kg)
Material
price $/kg
Total recovered
value ($)
Steel
6,305.80 0.52
3,279.02 0.67
2,201.31
Aluminum
18,347.70 0.6
11,008.62 2.08
22,862.22
Copper
3,979.93 0.53
2,109.36 7.33
15,453.14
Gold
0.87 0.96
0.83 45645.16
38,079.11
Palladium
0.24 0.7
0.17 23548.39
3,979.03
Total
82,574.81
Table S9 (f ) Material value from NMC battery pack materials

160
S10. Additional material input for cascaded use
The additional material input for assembly of a single refurbished EV LIB based stationary
energy storage system (450 kWh) was obtained from Richa et al. (2015):
Additional input per stationary
energy storage system
Mass
(kg)
Copper connector 56.24
Battery management system (BMS) 56.02
Battery cabinet (steel) 55.25
Table S10 (a). Additional material input for assembly of a single stationary energy system
Mass composition of BMS (Richa et al., 2015):
BMS metal or
component
Mass
composition
Steel 41%
Aluminum 2%
Copper 5%
PWB 44%
Plastic 8%
Table S10 (b). Mass composition of BMS
S11. Cascaded Use Life Cycle Assessment
For the lead acid (PbA) battery system, the life cycle stages considered were battery production
and operational charge-discharge energy efficiency losses (Rydh and Sanden 2005; Richa et al.,
2015). For the refurbished EV LIB based stationary energy storage system, the life cycle stages
that were included were battery refurbishment (transport of retired EV LIBs to refurbishment
facility, cell testing and input of additional materials) and charge-discharge losses. LCI data for
modeling these life cycle stages was obtained from life cycle assessment (LCA) study by Richa
et al. (2015).
Based on the LCA data, the following results were obtained:
Stationary Energy Storage System MJ/kWh CTUe/kWh
Refurbished EV LIB 3321 211
Lead Acid Battery 4651 838
Table S11. Environmental impact of stationary energy storage system
S12. Comparison with BEV vehicle and battery production
The CED impact for producing a single vehicle was considered to be 88,400 MJ (Notter et al.,
2010). The CED of LIB production was considered to be 949 MJ/kWh based on LCA data from
Richa et al. (2015)2. Hence, for a 39 kWh BEV battery, the impact was 37,000 MJ/pack. The
2 The eco-toxicity impact for LIB production was 222.85 CTUe/kWh (based on Richa et al., 2015).

161
total impact of manufacturing vehicle and battery was, thus 125,400 MJ. The avoided benefit per
BEV pack from the case study was estimated to be 3,227 and 51,870 MJ for the reuse (in EV)
and cascaded use application (stationary), respectively. The overall CED benefit/kg for the
recycling pathway was estimated to be 24 MJ/kg. Considering the weight of a BEV battery
(Nelson et al., 2011) as 330.5 kg, the benefit from recycling was estimated at 7,900 MJ/pack.
S13. Landfill Leaching Analysis
Sample Preparation
LIBs vary in composition, but are typically distinguished by cathode chemistry. The cathode
chemistry selected for Toxicity Characteristic Leaching Procedure (TCLP) was LiAlNiCoMnO2
and Panasonic LIB cells were used. The average composition of these cells adjusted for 50 g is
shown below:
Table S13 (a). Average composition of LiAlNiCoMnO2 cells, adjusted for 50 g of cell mass
The batteries were treated by electrically discharging the cells and submerging them in liquid
nitrogen for 5 minutes. Reduction in battery particle size was accomplished by shredding the
batteries in an EconoGrind ESL180/180 Granulator for approximately five minutes. The battery
material was then transferred to a fume hood to evaporate residual electrolyte and prepare them
for additional physical processing. Four sieves of decreasing screen size (6 mm, 2.5 mm, 1.5
mm, 0.5 mm) were used to sort the battery material into manageable fractions and ensure that
particle size <9.5 cm, per TCLP requirements.
Material Mass (g) Mass fraction
Al 11.36 0.2272
Co 4.22 0.0845
Cu 8.30 0.1660
Fe 4.39 0.0879
Li 0.64 0.0128
Mn 2.93 0.0586
Ni 7.42 0.1484
Plastic 1.65 0.0329
Si 0.01 0.0002
P 1.02 0.0204
Zr 0.03 0.0006
O 2.26 0.0452
Binder 0.69 0.0139
C black 1.73 0.0347
S 0.01 0.0003
F 2.50 0.0499
Organic
Solvent 0.83 0.0166
Total 50 1

162
Extraction fluid for the TCLP tests were selected by weighing out 5 g of battery material and
combining it with 96.5 mL of distilled water in a 500 mL beaker. The beaker was covered with
watch glass and stirred vigorously for 5 minutes. After the time had elapsed, the pH was
measured to be >5. Using a pipette, 3.5 mL of 1 N HCl was added, slurried briefly and heated the
solution to 50°C for 10 minutes. The solution was cooled to room temperature and the pH was
measured to be >5, so Extraction Fluid 2 was selected.
TCLP Experiment
On an analytical balance, 100 g of battery material was weighed out and placed in a plastic bottle
extractor. Two liters of Extraction Fluid 2 were prepared and added to the plastic bottle extractor
by adding 5.7 mL of glacial acetic acid to a 1 L volumetric flask that was diluted to the 1 L mark
with distilled water. The bottle extractor containing extraction fluid and battery material was
placed on an 8-vessel rotary agitation apparatus (Analytical Testing Corporation) and agitated at
30 ± 2 RPM for 18 ± 2 hours. Once the time had elapsed, the solution was filtered using a
pressure vessel and filter holder-containing a borosilicate glass fiber filter. The filtered solution
was preserved by decreasing the pH to <2 with nitric acid and refrigerated until it could be
analyzed. The experiment was completed in triplicate for each cell sample. The leachates were
analyzed for potentially recyclable metals in LIBs (Al, Co, Cu, Fe, Li, Mn, Ni) using a Perkin
Elmer Optima 8000 Inductively Coupled Plasma Optical Emission Spectrometer (ICP-OES).
Metal leachate (mg/l) Weight in 50 g sample (gm) % leached (gm/gm)
Al 130.56 11.36 1.15%
Co 152.47 4.22 3.61%
Cu 1.61 8.30 0.02%
Fe 13.74 4.39 0.31%
Li 272.73 0.64 42.50%
Mn 335.27 2.93 11.45%
Ni 159.42 7.42 2.15%
Table S13 (b) Average Leaching results for LiAlCoMnNiO2 Panasonic cells
S14.Environmental impact of landfill pathway
Upstream Impacts: These impacts are considered to be from waste transport to landfill and
landfill operation. For LIB waste from transport, an assumption of 0.5 tonne km/kg has been
made based on Hischier et al. (2007). The CED and eco-toxicity impact data was obtained from
SimaPro LCA software using ecoinvent database (ecoinvent Centre, 2010)
MJ/kg CTUe/kg
LIB waste transport to landfill 1.18 0.123
Landfill operation. 0.046 0.00108
Table S14 (a) Upstream CED and eco-toxicity impact data per kg of LIB landfill waste
Direct Toxicity Impacts: Eco-toxicity implications of landfill leaching of metals from the
analyzed landfill was also estimated. Currently the eco-toxicity impacts of copper, manganese,
iron, cobalt and nickel are characterized by USEtox LCA method.

163
Table S14 (b) USEtox Freshwater Ecotoxicity Characterization Factors for LIB metals
The landfill leaching potential of the EV LIB waste stream, under different scenarios of battery
chemistry is presented below:
LMO NCM LFP Equal Mix
Iron leaching (kg)
9.77
9.47
31.78 17
Copper leaching (kg)
1.92
1.77
2.42 2
Manganese leaching (kg)
1,567.59
352.41 640
Cobalt leaching (kg)
81.19 27
Nickel leaching (kg)
64.66 22
Eco-toxicity impact of
landfill leaching (CTUe)
12,281,585.68
13,937,965.19
6,456,008.36 10,891,853
Table S14 (c) Landfill leaching potential of the EV LIB waste stream, under different scenarios of battery
chemistry
S15. Bill of materials of Lithium nickel manganese cobalt oxide (NMC) cells and pack
Bill of materials of single cell (g)
Materials BEV LIB cell PHEV-12 LIB cell PHEV-50 LIB cell
Aluminum 62.53 150.38 58.20
Cobalt 46.14 40.17 42.58
Copper 82.59 246.16 77.12
Lithium 18.02 15.69 16.63
Manganese 43.01 37.45 39.70
Nickel 45.95 40.01 42.41
Graphite 134.91 117.11 124.63
Carbon 15.65 13.63 14.45
Binder 20.14 17.52 18.60
Plastic 15.83 44.67 14.68
Electrolyte 96.93 123.88 89.52
Other 79.07 68.84 72.98
No. of cells per pack 320 40 160
Table S15 (a)Bill of materials of Lithium nickel manganese cobalt oxide (NMC) cells (Based on Nelson et al.,
2011)
LIB metal USEtox Freshwater Ecotoxicity
Characterization Factor (CTUe/kg)
Copper 2.62*10^6
Manganese 4.61*10^3
Iron 3.69*10^3
Cobalt 3.26*10^4
Nickel 7.73*10^4

164
Table S15 (b). Bill of materials of Lithium nickel manganese cobalt oxide (NMC) EV packs (Based on Nelson
et al., 2011)
Amount of materials in NMC cells (For single pack, in kg)
Materials BEV PHEV-12 PHEV-50
Aluminum
20.01
6.02 9.31
Cobalt
14.76
1.61 6.81
Copper
26.43
9.85 12.34
Lithium
5.77
0.63 2.66
Manganese
13.76
1.50 6.35
Nickel
14.70
1.60 6.79
Graphite
43.17
4.68 19.94
Carbon
5.01
0.55 2.31
Binder
6.45
0.70 2.98
Plastic
5.07
1.79 2.35
Electrolyte
31.02
4.96 14.32
Other
25.30
2.75 11.68
Remaining NMC pack materials (For single pack, in kg)
Materials BEV PHEV-12 PHEV-50
Steel 6.86 4.76 4.10
Aluminium 35.02 6.91 18.70
Copper 2.27 3.16 2.17
PWB 2.31 1.82 2.03
Plastic 0.44 0.35 0.39
Fiber glass 13.61 1.93 7.34
Coolant (Water+EC) 6.06 1.30 3.39
Total pack weight (kg)
278.02
56.86 135.97

165
S16. Bill of materials of Lithium Ferrous Phosphate (LFP) cells and pack
Bill of materials of single LFP cell (g)
BEV PHEV-12 PHEV-50
Aluminum 100.18 137.87 93.08
Copper 136.60 209.81 127.23
Lithium 11.17 9.96 10.31
Iron 89.93 80.18 83.00
Graphite 141.06 125.73 130.29
Carbon 17.12 15.26 15.80
Binder 21.69 19.34 20.02
Plastic 26.62 39.31 24.65
Electrolyte 184.29 184.24 170.15
Other 152.84 136.28 141.07
Total per cell (g) 881.49 957.98 815.61
Table S16 (a). Bill of materials of LFP cells (Based on Nelson et al., 2011)
For modeling the EV reuse scenario for a waste stream comprised entirely of LFP cathode based
EV LIB packs: The environmental impact for LIB pack manufacturing (for estimating avoided
impact of producing new replacement batteries for EV application) and cell manufacturing (for
estimating the refurbishment impact for replacing 10% cells in an old LIB) was calculated from
LCI data collected from battery bill of materials, Richa et al. (2015), Majeau-Bettez et al. (2011),
and Notter et al. (2010). The battery pack was modeled in Simapro LCA software. The following
results were obtained for a 369 kg BEV pack, storing 39KWh energy with a specific energy of
106 Wh/kg:
MJ/kg CTUe/kg
LFP cells 91.6 24.4
Pack components
and pack
assembly 41.4 12.2
LFP pack 79.7 21.5
Table S16 (b). LCA data for LFP battery pack

166
Amount of materials in LFP cells (For single pack, in kg)
Materials BEV PHEV-12 PHEV-50
Aluminum 32.06 5.51 14.89
Copper 43.71 8.39 20.36
Lithium 3.58 0.40 1.65
Iron 28.78 3.21 13.28
Graphite 45.14 5.03 20.85
Carbon 5.48 0.61 2.53
Binder 6.94 0.77 3.20
Plastic 8.52 1.57 3.94
Electrolyte 58.97 7.37 27.22
Other 48.91 5.45 22.57
Remaining LFP pack materials (For single pack, in kg)
Materials BEV PHEV-12 PHEV-50
Steel 9.07 5.30 5.11
Aluminium 48.24 9.00 25.65
Copper 2.65 3.41 2.35
PWB 2.31 1.82 2.03
Plastic 0.44 0.35 0.39
Fiber glass 17.04 3.21 9.11
Coolant (Water+EC) 7.50 1.45 3.77
Total per pack (kg) 369.33 62.87 178.90
Table S16(c). Bill of materials of LFP EV packs (Based on Nelson et al., 2011)
S17. Contributions to net results (environmental impacts)
1. Reuse in EVs
Fig S17 (a).Contributors to net CED for EV reuse (Net avoided CED=200,000 MJ)
-313
41 6
-287
534
-20
-400
-300
-200
-100
0
100
200
300
400
500
600
Avoidedproduction of
LIB
BatteryRefurbishment
Battery Testing Avoided use ofnew LIB
Charge-discargelosses from use
of old LIB
Net cost orbenefit
CED
, 1
0,0
00
MJ

167
Fig S17 (b).Contributors to net eco-toxicity for EV reuse (Net avoided eco-toxicity=500,000 CTUe)
Fig S17(c).Contributors to net metal input for EV reuse (Net avoided metal input=12 mT)
2. Cascaded Use
Fig S17 (d).Contributors to net CED for cascaded use (Net avoided CED=9.6 million MJ)
-74
8 0.33
-16
30
-51
-80
-70
-60
-50
-40
-30
-20
-10
0
10
20
30
40
Avoidedproduction of
LIB
BatteryRefurbishment
Battery Testing Avoided use ofnew LIB
Charge-discargelosses from use
of old LIB
Net cost orbenefit
Eco
-to
xici
ty,
10
,00
0 C
TUe
-15
3
-12
-20
-15
-10
-5
0
5
Avoided production of LIB Battery Refurbishment Net cost of benefit
Me
tal I
np
ut
(me
tric
to
nn
e)
230
2,200
-640
-2700
-960
-3,000
-2,500
-2,000
-1,500
-1,000
-500
0
500
1,000
1,500
2,000
2,500
LIB refurbishment Stationary batteryuse
Avoided PbAbattery
production
Avoided PbAbattery use
Net Benefit
CED
, 10
,00
0 M
J
Cycle 1 (C1) Cycle 2 (C2)

168
Fig S17 (e).Contributors to net eco-toxicity for cascaded use (Net avoided eco-toxicity=4.5 million CTUe)
Fig S17 (f).Contributors to net metal input for cascaded use (Net avoided metal input=130 mT)
3. Recycling
Fig S17 (f).Contributors to net CED for recycling (Net avoided CED=3.5 million MJ)
33
120
-450
-150
-450 -500
-450
-400
-350
-300
-250
-200
-150
-100
-50
0
50
100
150
LIB refurbishmentStationary batteryuse
Avoided PbAbattery
production
Avoided PbAbattery use
Net Benefit
Eco
-to
xici
ty, 1
0,0
00
CTU
e
Cycle 2 (C2)
Cycle 1 (C1)
2
-131 -129 -140
-120
-100
-80
-60
-40
-20
0
20
LIB refurbishment Avoided PbA batteryproduction
Net Benefit
Me
tal I
np
ut,
Me
tric
To
nn
e
Cycle 2 (C2)
Cycle 1 (C1)
54
-250 -200
140
-290
-150
-400
-300
-200
-100
0
100
200
Burden of recyclingprocess
Avoided impact frommetal recovery
Net Benefit
CED
10
,00
0 M
J
hydrometallurgical
pyrometallurgical

169
Fig S17 (g).Contributors to net eco-toxicity for recycling (Net avoided eco-toxicity=8 million CTUe)
Fig S17 (h).Contributors to net avoided metal input from recycling (Net avoided metal input = 43 mT)
S18. Drinking water standards
Metal Average leachate
concentration
(mg/L)
US Primary
standard
(mg/L)
US Secondary
Standard
(mg/L)
EU directive
(mg/L)
World Health
Organization
(mg/L)
Aluminum 130.5 0.05-0.2 0.2 0.1-0.2
Copper 1.61 1.3 1 2 2
Iron 13.74 0.3 0.2
Manganese 335.27 0.05 0.05 0.4
Nickel 159.42 0.02 0.07
Table S18. National and international drinking water regulations for LIB metals, in mg/L.
Data Source: US EPA (2009), European Union (1998), and World Health Organization (2008)
14
-420 -400
18
-425 -400
-450
-400
-350
-300
-250
-200
-150
-100
-50
0
50
Burden of recyclingprocess
Avoided impact frommetal recovery
Net Benefit
Eco
-to
xici
ty 1
0,0
00
CTU
e
hydrometallurgicalpyrometallurgical
-18
-25 -30
-25
-20
-15
-10
-5
0
Me
tal i
np
ut,
Me
tric
To
nn
e
hydrometallurgicalpyrometallurgical

170
REFERENCES
1. Ahmadi, L., Fowler, M., Young, S. B., Fraser, R. A., Gaffney, B., & Walker, S. B. (2014b).
Energy efficiency of Li-ion battery packs re-used in stationary power
applications. Sustainable Energy Technologies and Assessments, 8, 9-17.
2. Ahmadi, L., Yip, A., Fowler, M., Young, S. B., & Fraser, R. A. (2014a). Environmental
feasibility of re-use of electric vehicle batteries. Sustainable Energy Technologies and
Assessments, 6, 64-74.
3. Alber, G. (n.d.) Predicting battery performance using internal cell resistance.
http://www.alber.com/docs/predictbatt.pdf. Accessed 13 November 2014
4. Albercorp. (n.d.) Internal resistance and the cellcorder. http://alber.com/Docs/CC1Ban.pdf.
Accessed 13 November 2014
5. Albright, G., Edie, J., & Al-Hallaj, S. (2012). A Comparison of Lead-acid to Lithium-ion in
Stationary Storage Applications. AllCell Technologies LLC.
http://www.batterypoweronline.com/main/wp-content/uploads/2012/07/Lead-acid-white-
paper.pdf. Accessed 20 October 2014
6. Allwood, J. M., Ashby, M. F., Gutowski, T. G., & Worrell, E. (2011). Material efficiency: A
white paper. Resources, Conservation and Recycling, 55(3), 362-381.
7. Allwood, J.M., Cullen, J.M., Carruth, M.A., Cooper, D.R., McBrien, M., Milford, R.L.,
Moynihan, M.C. and Patel, A.C. (2012). Sustainable materials: with both eyes open (p. 64).
Cambridge: UIT Cambridge.
8. Alonso, E., Sherman, A. M., Wallington, T. J., Everson, M. P., Field, F. R., Roth, R., &
Kirchain, R. E. (2012). Evaluating rare earth element availability: a case with revolutionary
demand from clean technologies. Environmental science & technology, 46(6), 3406-3414.
9. Amarakoon, S., Smith, J., & Segal, B. (2013). Application of life-cycle assessment to
nanoscale technology: Lithium-ion batteries for electric vehicles (No. EPA 744-R-12-001).
10. Anderman, M. (2007). The 2007 Advanced Automotive Battery and Ultracapacitor Industry
Report. Advanced Automotive Batteries.
11. Andersson, A. M., Abraham, D. P., Haasch, R., MacLaren, S., Liu, J., & Amine, K. (2002).
Surface characterization of electrodes from high power lithium-ion batteries. Journal of The
Electrochemical Society, 149(10), A1358-A1369.
12. Arbabzadeh, M., Johnson, J. X., Keoleian, G. A., Rasmussen, P. G., & Thompson, L. T.
(2015). Twelve Principles for Green Energy Storage in Grid Applications. Environmental
science & technology, 50(2), 1046-1055.
13. Archuleta, M. M. (1995). Toxicity of materials used in the manufacture of lithium
batteries. Journal of power sources, 54(1), 138-142.
14. Argonne National Laboratory [ANL]. (2011). BatPac (Battery Performance and Cost Model)
Version 2.0. http://www.cse.anl.gov/batpac/. Accessed 21 December 2013
15. Argonne National Laboratory. (2012). BatPaC Model. Retrieved from
http://www.cse.anl.gov/batpac/
16. Arora, P., White, R. E., & Doyle, M. (1998). Capacity fade mechanisms and side reactions in
lithium‐ion batteries. Journal of the Electrochemical Society, 145(10), 3647-3667.
17. Arora, P., & Zhang, Z. (2004). Battery separators. Chemical reviews, 104(10), 4419-4462.
18. Asari, M., & Sakai, S. I. (2013). Li-ion battery recycling and cobalt flow analysis in
Japan. Resources, Conservation and Recycling, 81, 52-59.

171
19. Axsen, J., Kurani, K. S., & Burke, A. (2010). Are batteries ready for plug-in hybrid buyers?
Transport Policy, 17(3), 173-182.
20. Axsen, J., Burke, A. F., & Kurani, K. S. (2008). Batteries for plug-in hybrid electric Vehicles
(PHEVs): goals and the state of technology circa 2008. Institute of Transportation Studies,
University of California, Davis.
21. Azapagic, A., & Clift, R. (1999). Allocation of environmental burdens in multiple-function
systems. Journal of Cleaner Production, 7(2), 101-119.
22. Babbitt, C. W., Williams, E., & Kahhat, R. (2011). Institutional disposition and management
of end-of-life electronics. Environmental science & technology, 45(12), 5366-5372.
23. Bakker, C., Wang, F., Huisman, J., & den Hollander, M. (2014). Products that go round:
exploring product life extension through design. Journal of Cleaner Production, 69, 10-16.
24. Batayneh, M., Marie, I., & Asi, I. (2007). Use of selected waste materials in concrete
mixes. Waste management, 27(12), 1870-1876.
25. Battery Council International. (2012). Battery Recycling. Battery Council International.
http://batterycouncil.org/?page=battery_recycling. Accessed 21 December 2013
26. Beer, S., Gómez, T., Dallinger, D., Momber, I., Marnay, C., Stadler, M., & Lai, J. (2012). An
economic analysis of used electric vehicle batteries integrated into commercial building
microgrids. IEEE Transactions on Smart Grid, 3(1), 517-525.
27. Berdichevsky, G., Kelty, K., Straubel, J. B., & Toomre, E. (August, 2006). The Tesla
Roadster battery system. Tesla Motors. Retrieved from
http://webarchive.teslamotors.com/display_data/TeslaRoadsterBatterySystem.pdf
28. Bindner, H., Cronin, T., Lundsager, P., Manwell, J. F., Abdulwahid, U., & Baring-Gould, I.
(2005). Lifetime modelling of lead acid batteries. Risø National Laboratory Roskilde,
Denmark. http://orbit.dtu.dk/fedora/objects/orbit:88309/datastreams/file_7710966/content.
Accessed 20 October 2014
29. Blanco, S. (May, 2010). Details on Nissan Leaf battery pack, including how recharging speed affects
battery life. AutoblogGreen, AOL Inc. http://green.autoblog.com/2010/05/27/details-on-nissan-leaf-battery-
pack-including-how-recharging-sp/. Accessed 20 November 2014
30. Boden, D. P. (1998). Selection of pre-blended expanders for optimum lead/acid battery
performance. Journal of power sources, 73(1), 89-92.
31. Boguski, T. K., Hunt, R. G., & Franklin, W. E. (1994). General mathematical models for LCI
recycling. Resources, Conservation and Recycling, 12(3), 147-163.
32. Bond, V. (2013). 2nd lives for EV batteries could cut prices. Automotive News.
http://www.autonews.com/article/20130506/OEM05/305069985/2nd-lives-for-ev-batteries-
could-cut-prices. Accessed 19 January 2015
33. Borg, M., Paulsen, J., & Trinius, W. (2001). Proposal of a method for allocation in building-
related environmental LCA based on economic parameters. The international journal of life
cycle assessment, 6(4), 219-230.
34. Borken-Kleefeld, J., & Weidema, B. P. (2013). Global default data for freight transport per
product group. Manuscript for special ecoinvent 3.0 issue of the International Journal of Life
Cycle Assessment.
35. Brandstotter, M., Knoth, R., Kopacek, B., & Kopacek, P. (2004). Case study of a printed-
wire-board concerning (re-) design for environment. IEEE transactions on electronics
packaging manufacturing, 27(1), 26-32.

172
36. Brunner, P. H., & Rechberger, H. (2004). Practical handbook of material flow analysis. New
York: Lewis, 317.
37. Burke, A. (2009). Performance, charging, and second-use considerations for lithium
batteries for plug-in electric vehicles. Institute of Transportation Studies, University of
California-Davis. Retrieved from http://escholarship.org/uc/item/2xf263qp#page-1
38. Burke, A. F., & Miller, M. (2009). Performance characteristics of lithium-ion batteries of
various chemistries for plug-in hybrid vehicles. Institute of Transportation Studies,
University of California, Davis, Research Report UCD-ITS-RR-09-08. Retrieved from
http://publications.its.ucdavis.edu/publication_detail.php?id=1292
39. California Code [CA Code]. (2006). Rechargeable Battery Recycling Act of 2006 (42451.e
42456.) (Chapter 8.4)
40. Call2Recycle. (2015). What can I recycle? www.call2recycle.org/what-can-i-recycle/.
Accessed January 2015.
41. Campanari, S., Manzolini, G., & Garcia de la Iglesia, F. (2009). Energy analysis of electric
vehicles using batteries or fuel cells through well-to-wheel driving cycle simulations. Journal
of Power Sources, 186(2), 464-477.
42. Celik, A. N., Muneer, T., & Clarke, P. (2008). Optimal sizing and life cycle assessment of
residential photovoltaic energy systems with battery storage. Progress in Photovoltaics:
Research and Applications, 16(1), 69-85.
43. Chalk, S. G., & Miller, J. F. (2006). Key challenges and recent progress in batteries, fuel
cells, and hydrogen storage for clean energy systems. Journal of Power Sources, 159(1), 73-
80
44. Chang, T., You, S. , Yu, B. , & Yao, K. (2009). A material flow of lithium batteries in
Taiwan. Journal of Hazardous Materials, 163(2-3), 910-915
45. Chen, L.; Tang, X.; Zhang, Y.; Li, L.; Zeng, Z.; Zhang, Y. (2011). Process for the recovery
of cobalt oxalate from spent lithium-ion batteries. Hydrometallurgy, 108 (1-2), 80-86.
46. Chiang, Y. M. (April 11, 2013). Advances in lithium ion technology and applications.
National Transportation Safety Board, Li-ion Battery Forum, April 2013, Washington D.C.
Retrieved from
http://www.ntsb.gov/news/events/2013/batteryforum/presentations/Chiang%20Presentation%
20-%20Battery%20Forum.pdf
47. Chiodo, J. (2005). Design for disassembly guidelines. Active Disassembly Research, 2(1),
29-37.
48. Choi, D., Wang, W., Viswanathan, V. V., & Yang, G. Z. (2010). Low Cost, Long Cycle Life,
Li-ion Batteries for Stationary Applications. DOE EERE Energy Storage Program Annual
Update 2010, Washington DC
49. Cicconi, P., Landi, D., Morbidoni, A., & Germani, M. (2012, September). Feasibility
analysis of second life applications for Li-ion cells used in electric powertrain using
environmental indicators. In Energy Conference and Exhibition (ENERGYCON), 2012 IEEE
International (pp. 985-990). IEEE.
50. Cleary, J. (2009). Life cycle assessments of municipal solid waste management systems: a
comparative analysis of selected peer-reviewed literature. Environment International, 35(8),
1256-1266.
51. Cready, E., Lippert, J., Pihl, J., Weinstock, I., Symons, P., Jungst, R. G. (2003). Technical
and Economic Feasibility of Applying Used EV Batteries in Stationary Applications.
SAND2002-4084; Sandia National Laboratories: Albuquerque, NM.

173
52. Dahn, J., & Erlich, G. M. (2011). Lithium-ion Batteries. Linden’s Handbook of Batteries, 4th
edition, TB Reddy, Ed, 26.
53. Davis E., Funk, D., & Johnson, W. (2002). Internal Ohmic Measurements and Their
Relationship to Battery Capacity–EPRI’s Ongoing Technology Evaluation. In Proceedings
of the 2002 BATTCON Conference, Ft. Lauderdale, FL
54. Davis, S. C., Diegel, S. W., & Boundy, R. G. (2013). Transportation energy data book:
Edition 32 (No. ORNL 6989). United States. Department of Energy. Retrieved from
http://cta.ornl.gov/data/tedb32/Edition32_Full_Doc.pdf
55. Denholm, P. & Short, W. (2006). An evaluation of utility system impacts and benefits of
optimally dispatched plug-in hybrid electric vehicles. Technical Report NREL/TP-620-
40293, National Renewable Energy Laboratory, Golden, Colorado.
56. Dewulf, J., Van der Vorst, G., Denturck, K., Van Langenhove, H., Ghyoot, W., Tytgat, J., &
Vandeputte, K. (2010). Recycling rechargeable lithium ion batteries: critical analysis of
natural resource savings. Resources, Conservation and Recycling, 54(4), 229-234.
57. Dinger, A., Martin, R., Mosquet, X., Rabl, M., Rizoulis, D., Russo, M., & Sticher, G. (2010).
Batteries for Electric Cars: Challenges, Opportunities, and the Outlook to 2020. The Boston
Consulting Group, Technical Report. Retrieved from
http://www.bcg.com/documents/file36615.pdf
58. Doggett, S. (2011). GM and ABB give Chevy Volt Battery second life. Edmunds Auto
Observer. http://www.edmunds.com/autoobserver-archive/2011/07/gm-and-abb-give-chevy-
volt-battery-second-life.html. Accessed 12 April 2013
59. Dorella, G.; Mansur, M. B. (2007). A study of the separation of cobalt from spent Li-ion
battery residues. Journal of Power Sources, 170 (1), 210-215.
60. Doughty, D. H., Butler, P. C., Akhil, A. A., Clark, N. H., & Boyes, J. D. (2010). Batteries for
large-scale stationary electrical energy storage. The Electrochemical Society Interface, 19(3),
49-53.
61. Dunn, B., Kamath, H., & Tarascon, J. M. (2011). Electrical energy storage for the grid: a
battery of choices. Science, 334(6058), 928-935.
62. Dunn, J. B., Gaines, L., Barnes, M., Sullivan, J., & Wang, M. Q. (2012). Material and energy
flows in materials production, assembly, and end-of-life stages of the life cycle of lithium-ion
batteries; ANL/ESD/12-3; Argonne National Laboratory.
63. Dunn, J. B., Gaines, L., Kelly, J. C., James, C., & Gallagher, K. G. (2015). The significance
of Li-ion batteries in electric vehicle life-cycle energy and emissions and recycling's role in
its reduction. Energy & Environmental Science, 8(1), 158-168.
64. Duvall, M. & Knipping, E. (2007). Environmental Assessment of Plug-In Hybrid Electric
Vehicles, Volume 1: Nationwide Greenhouse Gas Emissions. EPRI, Palo Alto, CA. Report
#1015325. Retrieved from http://et.epri.com/publicdocuments.html.
65. Eberhard, M., & Tarpenning, M. (October, 2006). The 21st Century Electric Car. Tesla
Motors Inc. Retrieved from
http://www.stanford.edu/group/greendorm/participate/cee124/TeslaReading.pdf
66. ecoinvent Centre. (2007). ecoinvent data v2.0. ecoinvent reports No.1-25, Swiss Centre for
Life Cycle Inventories, Dübendorf, 2007.
67. ecoinvent Centre. (2010). ecoinvent data and reports v.2.2. Dübendorf, Switzerland: Swiss
Center for Life Cycle Inventories
68. EIA. (2012). Annual Energy Outlook 2012. Light-duty vehicle sales by technology - United
States. http://www.eia.gov/forecasts/archive/aeo12/

174
69. Ekvall, T., & Tillman, A. M. (1997). Open-loop recycling: criteria for allocation
procedures. The international journal of life cycle assessment, 2(3), 155-162.
70. Elkind, E.N. (2014). Reuse and Repower-How to save money and clean the grid with
second-life electric vehicle batteries.
www.law.berkeley.edu/files/ccelp/Reuse_and_Repower_--_Web_Copy.pdf. Accessed 21
January 2015
71. Ellen MacArthur Foundation. (2013). Towards the circular economy. Ellen MacArthur
Foundation. Retrieved from http://mvonederland.nl/system/files/media/towards-the-circular-
economy.pdf
72. Ellingsen, L. A. W., Majeau‐Bettez, G., Singh, B., Srivastava, A. K., Valøen, L. O., &
Strømman, A. H. (2014). Life cycle assessment of a lithium‐ion battery vehicle pack. Journal
of Industrial Ecology, 18(1), 113-124.
73. EPA . (n.d.). Hydrogen fluoride study. Final report to Congress: Section 112(n) (6) Clean Air
Act as amended. Retrieved from http://www.epa.gov/osweroe1/docs/chem/hydro.pdf
74. Espinosa, D. C. R., Bernardes, A. M., & Tenório, J. A. S. (2004). An overview on the current
processes for the recycling of batteries. Journal of Power Sources, 135(1), 311-319.
75. Espinoza, V. S., Erbis, S., Pourzahedi, L., Eckelman, M. J., & Isaacs, J. A. (2014). Material
flow analysis of carbon nanotube lithium-ion batteries used in portable computers. ACS
Sustainable Chemistry & Engineering, 2(7), 1642-1648.
76. EU. (2000). Directive 2000/53EC of the European Parliament and of the Council (2000.9.18)
77. Eurofins. (2012). Federal and State Hazardous Waste Criteria.
http://www.eurofinsus.com/media/161417/hazardous_waste_regulatory_limits.pdf
78. European Parliament. (2008). European Parliament Council directive on waste and repealing
certain directives. 2008/98/EC. Official Journal L 312 (2008), pp. 3–30.
79. European Commission. (2014). Development of Guidance on Extended Producer
Responsibility (EPR). Final Report.
http://ec.europa.eu/environment/waste/pdf/target_review/Guidance%20on%20EPR%20-
%20Final%20Report.pdf. Accessed 27 January 2015
80. European Commission. (2006). Directive 2006/66/EC of the European Parliament and the
Council of 6 September 2006 on batteries and accumulators and waste batteries and
accumulators and repealing Directive 91/157/EEC. Official Journal of the European
Communities 1e14: 2006a.
81. European Telecommunications Standards Institute [ETSI]. (2012). Environmental
Engineering (EE); The use of alternative energy solutions in telecommunication installations.
Technical Report. ETSI TR 102 532 V1.2.1 (2012-11).
http://www.etsi.org/deliver/etsi_tr/102500_102599/102532/01.02.01_60/tr_102532v010201p
.pdf. Accessed 25 December 2013
82. European Union. (1998). Council Directive 98/83/EC of 3 November 1998 on the quality of
water intended for human consumption. http://eur-lex.europa.eu/legal-
content/EN/TXT/PDF/?uri=CELEX:31998L0083&from=EN. Accessed December 2015.
83. Fenton, M. D. (2003). Iron and steel recycling in the United States in 1998. US Department
of the Interior, U.S. Geological Survey.
84. Ferreira, D. A., Prados, L. M. Z., Majuste, D., & Mansur, M. B. (2009). Hydrometallurgical
separation of aluminium, cobalt, copper and lithium from spent Li-ion batteries. Journal of
Power Sources, 187 (1), 238-246.

175
85. Fisher, K., Wallén, E., Laenen, P. P., & Collins, M. (2006). Battery waste management life
cycle assessment. UK Department for Environment Food and Rural Affairs (Defra), UK.
86. Frampton, J. (1998). Comparison of California’s Waste Extraction Test (WET) and the U.S.
EPA’s Toxicity Characteristic Procedure (TCLP). California Department of Toxic
Substances Control.
87. Frost & Sullivan. (2010). Global Electric Vehicles Lithium-ion Battery Second Life and
Recycling Market Analysis, M5B6-18, November 2010.
88. Frost & Sullivan. (2009). World Hybrid Electric Vehicle/Plug-in Hybrid Electric Vehicle
Battery Market, N627- 27, September 2009.
89. Frost & Sullivan. (2014). 2020 Vision: Global Lithium-Ion Battery Market. Frost & Sullivan,
San Antonio.
90. Fu, H. (2009). Implementations of electric vehicle system based on solar energy in Singapore
assessment of lithium-ion batteries for automobiles (Doctoral dissertation, Massachusetts
Institute of Technology). Retrieved from http://dspace.mit.edu/handle/1721.1/54200
91. Gaines, L. (2014). The future of automotive lithium-ion battery recycling: Charting a
sustainable course. Sustainable Materials and Technologies, 1, 2-7.
92. Gaines, L., & Nelson, P. (2010). Lithium-ion batteries: examining material demand and
recycling issues. Argonne, IL: Argonne National Laboratory.
93. Gaines, L., & Cuenca, R. (2000). Costs of Lithium-Ion Batteries for Vehicles. Argonne
National Laboratories. Retrieved from
http://ntl.bts.gov/lib/14000/14700/14729/DE00761281.pdf
94. Ganter, M. J., Landi, B. J., Babbitt, C. W., Anctil, A., & Gaustad, G. (2014). Cathode
refunctionalization as a lithium ion battery recycling alternative. Journal of Power
Sources, 256, 274-280.
95. Garetson, T. (2013). Advanced Vehicle Testing and Evaluation. Final Report. US
Department of Energy Vehicle Technologies Office. Retrieved from
http://www.osti.gov/scitech/servlets/purl/1097102. Accessed 19 December 2014
96. Geiser, K. (2001). Materials matter: Toward a sustainable materials policy: MIT Press.
97. Geisler, G., Hofstetter, T. B., & Hungerbühler, K. (2004). Production of fine and speciality
chemicals: procedure for the estimation of LCIs. The International Journal of Life Cycle
Assessment, 9(2), 101-113.
98. Genikomsakis, K. N., Ioakimidis, C. S., Murillo, A., Trifonova, A., & Simic, D. (2013,
November). A Life Cycle Assessment of a Li-ion urban electric vehicle battery. In Electric
Vehicle Symposium and Exhibition (EVS27), 2013 World(pp. 1-11). IEEE.
99. Georgi-Maschler, T., Friedrich, B., Weyhe, R., Heegn, H., & Rutz, M. (2012). Development
of a recycling process for Li-ion batteries. Journal of power sources, 207, 173-182.
100. Ghisellini, P., Cialani, C., & Ulgiati, S. (2016). A review on circular economy: The
expected transition to a balanced interplay of environmental and economic systems. Journal
of Cleaner Production, 114, 11-32.
101. Giffi, C., Gardner, M., Hill, R., & Hasegawa, M. (January, 2010). Gaining Traction- A
Customer View of Electric Vehicle Mass Adoption in the US Automotive Market. Deloitte
Development LLC. Retrieved from
http://www.deloitte.com.br/publicacoes/2007/MFG.Gaining_Traction_customer_view_of_el
ectric_vehicle_mass_adoption.pdf
102. Glew, D., Stringer, L. C., & McQueen-Mason, S. (2013). Achieving sustainable
biomaterials by maximising waste recovery. Waste management, 33(6), 1499-1508.

176
103. Gondelach, S. (2010, November). Current and future developments of batteries for electric
cars-an analysis. Retrieved from http://igitur-archive.library.uu.nl/student-theses/2010-1126-
200244/UUindex.html
104. Gordon-Bloomfield, N. (2015). BMW, Bosch, Vattenfall Launch Second Life Batteries
Alliance to Give Electric Car Batteries A Retirement Plan. Transport Evolved.
https://transportevolved.com/2015/01/27/bmw-bosh-vattenfall-launch-second-life-batteries-
alliance-give-electric-car-batteries-retirement-plan/. Accessed 28 January 2015
105. Graedel, T. E., & Allenby, B. R. (2010). Industrial ecology and sustainable engineering.
Upper Saddle River, NJ, USA: Prentice Hall.
106. Graedel, T. E., Allwood, J., Birat, J. P., Buchert, M., Hagelüken, C., Reck, B. K., &
Sonnemann, G. (2011). Recycling rates of metals: A status report. United Nations
Environment Programme.
107. Greene, D. L., & DeCicco, J. (2000). Engineering-Economic Analyses of Automotive fuel
Economy Potential in the United States 1. Annual Review of Energy and the
Environment, 25(1), 477-535.
108. Greene, D. L., Patterson, P. D., Singh, M., & Li, J. (2005). Feebates, rebates and gas-
guzzler taxes: a study of incentives for increased fuel economy. Energy Policy, 33(6), 757-
775
109. Gregson, N., Crang, M., Fuller, S., & Holmes, H. (2015). Interrogating the circular
economy: the moral economy of resource recovery in the EU. Economy and Society, 44(2),
218-243.
110. Grosjean, C., Miranda, P. H., Perrin, M., & Poggi, P. (2012). Assessment of world lithium
resources and consequences of their geographic distribution on the expected development of
the electric vehicle industry. Renewable and Sustainable Energy Reviews, 16(3), 1735-1744.
111. Gruber, P.W., Medina, P.A., Keoleian, G.A., Kesler, S.E., Everson, M.P., & Wallington,
T.J. (2011). Global lithium availability a constraint for electric vehicles? Journal of
Industrial Ecology, 15(5), 760-775
112. Guinée, J. B., Heijungs, R., & Huppes, G. (2004). Economic allocation: examples and
derived decision tree. The international journal of life cycle assessment, 9(1), 23-33.
113. Gutowski, T. G., Sahni, S., Boustani, A., & Graves, S. C. (2011). Remanufacturing and
energy savings. Environmental science & technology,45(10), 4540-4547.
114. Han, X., Ouyang, M., Lu, L., & Li, J. (2014). A comparative study of commercial lithium
ion battery cycle life in electric vehicle: Capacity loss estimation. Journal of Power
Sources, 268, 658-669.
115. Harper, E. M., Kavlak, G., & Graedel, T. E. (2011). Tracking the Metal of the Goblins:
Cobalt’s Cycle of Use. Environmental Science & Technology, 46(2), 1079-1086.
116. Hawkins, T. R., Singh, B., Majeau‐Bettez, G., & Strømman, A. H. (2013). Comparative
environmental life cycle assessment of conventional and electric vehicles. Journal of
Industrial Ecology, 17(1), 53-64.
117. Hein, R., Kleindorfer, P. R., & Spinler, S. (2012). Valuation of electric vehicle batteries in
vehicle-to-grid and battery-to-grid systems. Technological Forecasting and Social
Change, 79(9), 1654-1671.
118. Hendrickson, T. P., Kavvada, O., Shah, N., Sathre, R., & Scown, C. D. (2015). Life-cycle
implications and supply chain logistics of electric vehicle battery recycling in
California. Environmental Research Letters, 10(1), 014011.

177
119. Heymans, C., Walker, S. B., Young, S. B., & Fowler, M. (2014). Economic analysis of
second use electric vehicle batteries for residential energy storage and load-levelling. Energy
Policy, 71, 22-30.
120. Hill, K., & Cregger, J. (2011). Deployment Rollout Estimate of Electric Vehicles, 2011 -
2015. Center for Automotive Research. January 2011. Retrieved from
http://www.cargroup.org/assets/files/deployment.pdf
121. Hischier, R., Classen, M., Lehmann, M., & Scharnhorst, W. (2007). Life cycle inventories
of electric and electronic equipment: production, use and disposal. Final report ecoinvent
Data v2. 0, 18.
122. Hittman Associates. (1980). Life cycle energy analysis of electric vehicle storage batteries,
H-1008/001-80-964, submitted to the US Department of Energy, contract number DE-AC02-
79ET25420.A000
123. Hoffart, F. (2008). Proper care extends Li-ion battery life. Power Electronics Technology
Magazine. http://powerelectronics.com/. Accessed 26 November 2014
124. Howard, W., & Spotnitz, R. (2007). Theoretical evaluation of high-energy lithium metal
phosphate cathode materials in li-ion batteries. Journal of Power Sources, 165(2), 887-891.
125. Howell, D. (2012). Overview of Battery R&D Activities. Washington DC: U.S. Department
of Energy Vehicle Technologies Program. Retrieved from
http://energy.gov/sites/prod/files/2014/03/f9/vtpn07_es_howell_2012_o.pdf. Accessed
January 2016.
126. Hoyer, C., Kieckhäfer, K., & Spengler, T. S. (2011). A strategic framework for the design
of recycling networks for lithium-ion batteries from electric vehicles. In Glocalized Solutions
for Sustainability in Manufacturing (pp. 79-84). Springer Berlin Heidelberg.
127. Huang, S., Hodge, B. M. S., Taheripour, F., Pekny, J. F., Reklaitis, G. V., & Tyner, W. E.
(2011). The effects of electricity pricing on PHEV competitiveness. Energy Policy, 39(3),
1552-1561.
128. Humphrey, J., Sargent, D., Schuster, J., Marshall, M., Omotoso, M., & Dunne, T. (2010).
Drive Green 2020: More hope than reality. J.D. Power and Associates. Retrieved from
http://www.altomelbilen.dk/presentationer/DriveGreen2020.pdf
129. Iakovou, E., Moussiopoulos, N., Xanthopoulos, A., Achillas, C., Michailidis, N.,
Chatzipanagioti, M., & Kikis, V. (2009). A methodological framework for end-of-life
management of electronic products. Resources, Conservation and Recycling, 53(6), 329-339.
130. Idjis, H., Attias, D., Bocquet, J. C., & Richet, S. (2013, September). Designing a sustainable
recycling network for batteries from electric vehicles. Development and optimization of
scenarios. In Working Conference on Virtual Enterprises (pp. 609-618). Springer Berlin
Heidelberg.
131. IEEE. (2011). IEEE Recommended Practice for Sizing Lead-Acid Batteries for Stationary
Applications. IEEE Power & Energy Society and Stationary Batteries Committee.
http://ieeexplore.ieee.org/xpl/mostRecentIssue.jsp?punumber=5751582. Accessed 15
November 2014
132. Infomine. (2015). Manganese Prices and Manganese Price Charts Retrieved from
www.infomine.com/investment/metal-prices/manganese/. Accessed 15 July 2015
133. Inside EVs. (2015). Monthly Plug-In Sales Scorecard. http://insideevs.com/monthly-plug-
in-sales-scorecard/. Accessed 20 April 2015

178
134. International Energy Agency. (2011). Technology Roadmap. Electric and plug-in hybrid
electric vehicles. Retrieved from
http://www.iea.org/publications/freepublications/publication/EV_PHEV_Roadmap.pdf
135. International Institute for Sustainable Development IISD. (2010). Sustainable development
and the global copper supply chain: International research team report. Toronto, Canada:
Five Winds International.
136. International Organization for Standardization [ISO]. (2006). Environmental management –
life cycle assessment – principles and framework (ISO 14044: 2006). Geneva, Switzerland
137. Ishihara, K., Kihira, N., Terada, N., & Iwahori, T. (2002). Environmental burdens of large
lithium-ion batteries developed in a Japanese national project. Central Research Institute of
Electric Power Industry, Japan.
138. Jobin, P., Yamaguchi, J., Balter, G., Ceraso, C.J., Chan, A., Eggers, D., Ellinghorst, A.,
Flannery, M., McNutley, J.P., Pearson, S. and Pitzer, J.W. (2009). Electric Vehicles. Credit
Suisse, Global Equity Research, Energy Technology /Auto Parts & Equipment.
139. Kalhammer, F. R., Kamath, H., Duvall, M., Alexander, M., & Jungers, B. (2009, May).
Plug-in hybrid electric vehicles: promise, issues and prospects. In EVS24 International
Battery, Hybrid and Fuel Cell Electric Vehicle Symposium. Stavanger, Norway (pp. 1-11).
140. Kang, D. H. P., Chen, M., & Ogunseitan, O. A. (2013). Potential environmental and human
health impacts of rechargeable lithium batteries in electronic waste. Environmental science &
technology, 47(10), 5495-5503.
141. Kang, H. Y., & Schoenung, J. M. (2006). Estimation of future outflows and infrastructure
needed to recycle personal computer systems in California. Journal of hazardous
materials, 137(2), 1165-1174.
142. Kang, S. H., Lu, W., Gallagher, K. G., Park, S. H., & Pol, V. G. (2011). Study of Li1+ x
(Mn4/9Co1/9Ni4/9) 1-xO2 Cathode Materials for Vehicle Battery Applications. Journal of
the Electrochemical Society, 158(8), A936-A941.
143. Karden, E., Ploumen, S., Fricke, B., Miller, T., & Snyder, K. (2007). Energy storage
devices for future hybrid electric vehicles. Journal of Power Sources, 168(1), 2-11.
144. Karlsson, R. (1994, February). LCA as a guide for the improvement of recycling.
In Proceedings of the European Workshop on Allocation in LCA (pp. 18-28).
145. Kim, S., Hwang, T., & Lee, K. M. (1997). Allocation for cascade recycling system. The
International Journal of Life Cycle Assessment, 2(4), 217-222.
146. Kiritsis, D., Bufardi, A., & Xirouchakis, P. (2003, May). Multi-criteria decision aid for
product end of life options selection. In Electronics and the Environment, 2003. IEEE
International Symposium on (pp. 48-53). IEEE
147. Klöpffer, W. (1996). Allocation rule for open-loop recycling in life cycle assessment. The
International Journal of Life Cycle Assessment, 1(1), 27-31.
148. Knoepfel, I. (1994, February). Allocation of environmental burdens in life-cycle analysis
according to a two-stage procedure. In Proceedings of the European Workshop on Allocation
in LCA, CML, Leiden, Februray (pp. 24-25).
149. Köhler, A. R., Som, C., Helland, A., & Gottschalk, F. (2008). Studying the potential release
of carbon nanotubes throughout the application life cycle. Journal of Cleaner
Production, 16(8), 927-937

179
150. Krieger, E. M., Cannarella, J., & Arnold, C. B. (2013). A comparison of lead-acid and
lithium-based battery behavior and capacity fade in off-grid renewable charging
applications. Energy, 60, 492-500.
151. Kumar, V., & Sutherland, J. W. (2008). Sustainability of the automotive recycling
infrastructure: review of current research and identification of future
challenges. International Journal of Sustainable Manufacturing, 1(1), 145-167.
152. Kuo, I. (2011). Tesla to Recycle Electric Car Batteries in Belgium. The New York Times.
Retrieved from
http://www.batteryrecycling.umicore.com/UBR/media/pressCoverage/2011/show_20110127
_NYTimes_BR.pdf. Accessed 21 January 2015
153. Kushnir, D., & Sandén, B. A. (2012). The time dimension and lithium resource constraints
for electric vehicles. Resources Policy, 37(1), 93-103.
154. Legal Information Institute. (2015). 49 CFR 173.185 - Lithium cells and batteries.
Retrieved from https://www.law.cornell.edu/cfr/text/49/173.185
155. Lemp, J. D., & Kockelman, K. M. (2008). Quantifying the external costs of vehicle use:
Evidence from America’s top-selling light-duty models. Transportation research part D:
transport and environment, 13(8), 491-504.
156. Li, J., Shi, P., Wang, Z., Chen, Y., & Chang, C. C. (2009). A combined recovery process of
metals in spent lithium-ion batteries. Chemosphere, 77(8), 1132-1136.
157. Li, L., Dunn, J. B., Zhang, X. X., Gaines, L., Chen, R. J., Wu, F., & Amine, K. (2013).
Recovery of metals from spent lithium-ion batteries with organic acids as leaching reagents
and environmental assessment. Journal of Power Sources, 233, 180-189.
158. Li, L., Ge, J., Wu, F., Chen, R., Chen, S., Wu, B. (2010). Recovery of cobalt and lithium
from spent lithium ion batteries using organic citric acid as leachant. Journal of Hazardous
Materials, 176 (1-3), 288-293.
159. Linden, D., & Reddy, T. B. (Eds.). (2003). Handbook of batteries. McGraw-Hill
160. London Metal Exchange [LME]. (2012). Pricing and data. Accessed July 2012 from
http://www.lme.com/
161. Lowe, M., Tokuoka, S., Trigg, T., & Gereffi, G. (2010). Lithium-ion Batteries for Electric
Vehicles: The US Value Chain. Center on Globalization Governance and Competitiveness,
Duke University.
162. Lu, L., Han, X., Li, J., Hua, J., & Ouyang, M. (2013). A review on the key issues for
lithium-ion battery management in electric vehicles. Journal of power sources, 226, 272-288.
163. Madani, A. (2009). HEV, P-HEV& EV Market Trends 2008-2020: Battery is the Key!
Presentation by Avicenne Développment for BATTERIES 2009: The International power
supply conference and exhibition, Cannes, France. Retrieved from
http://www.cars21.com/web/assets/link/Ali%20Madani%20presentation.pdf
164. Majeau-Bettez, G., Hawkins, T. R., & Strømman, A. H. (2011). Life cycle environmental
assessment of lithium-ion and nickel metal hydride batteries for plug-in hybrid and battery
electric vehicles. Environmental science & technology, 45(10), 4548-4554.
165. Majima, M., Ujiie, S., Yagasaki, E., Koyama, K., & Inazawa, S. (2001). Development of
long life lithium ion battery for power storage. Journal of Power Sources, 101(1), 53-59.
166. Mantuano, D. P., Dorella, G., Elias, R. C. A., & Mansur, M. B. (2006). Analysis of a
hydrometallurgical route to recover base metals from spent rechargeable batteries by liquid–
liquid extraction with Cyanex 272. Journal of Power Sources, 159(2), 1510-1518.

180
167. Marano, V., & Rizzoni, G. (2008, September). Energy and economic evaluation of PHEVs
and their interaction with renewable energy sources and the power grid. Proceedings of the
2008 IEEE International Conference on Vehicular Electronics and Safety. Columbus, OH,
USA. September 22-24, 2008, pp. 84-89.
168. Marano, V. , Onori, S. , Guezennec, Y. , Rizzoni, G. , & Madella, N. (2009). Lithium-ion
batteries life estimation for plug-in hybrid electric vehicles. 2009 IEEE Vehicle Power and
Propulsion Conference, Vols 1-3, 1, 476-483.
169. Matheys, J., & Van Autenboer, W. (2005). SUBAT: sustainable batteries work package 5:
overall assessment final public report. Vrije Universiteit Brussel, Brussels.
170. Matheys, J., Timmermans, J. M., Van Mierlo, J., Meyer, S., & Van den Bossche, P. (2009).
Comparison of the environmental impact of five electric vehicle battery technologies using
LCA. International Journal of sustainable manufacturing, 1(3), 318-329.
171. Matheys, J., Van Mierlo, J., Timmermans, J. M., & Van den Bossche, P. (2008). Life-cycle
assessment of batteries in the context of the EU Directive on end-of-life
vehicles. International Journal of Vehicle Design, 46(2), 189-203.
172. McDowall, J. (2000). Aging factors in battery sizing - Prudent engineering or waste of
effort ? Battcon Proceedings, 2000. Retrieved from
http://www.battcon.com/PapersScanned2000/McDowallPaper2000.pdf. Accessed 13
November 2014
173. McKinsey & Company. (2014). Moving Toward a Circular Economy. Retrieved from
www.mckinsey.com/business-functions/sustainability-and-resource-productivity/our-
insights/moving-toward-a-circular-economy. Accessed 4 October 2015.
174. Michaelis, P., & Jackson, T. (2000). Material and energy flow through the UK iron and
steel sector: Part 2: 1994–2019. Resources, Conservation and recycling, 29(3), 209-230.
175. Mikolajczak, C., Kahn, M., White, K., & Long, R. T. (2011). Summary of Applicable
Codes and Standards. In Lithium-Ion Batteries Hazard and Use Assessment (pp. 31-42).
Springer US.
176. Minnesota Pollution Control Agency [MN PCA]. (2015). Product stewardship for
rechargeable batteries. St. Paul, MN: Minnesota Pollution Control Agency.
177. Mudgal, S., Le Guern, Y., Tinetti, B., Chanoine, A., Pahal, S., & Witte, F. (2011).
Comparative Life-Cycle Assessment of nickel-cadmium (NiCd) batteries used in Cordless
Power Tools (CPTs) vs. their alternatives nickel-metal hydride (NiMH) and lithium-ion (Li-
ion) batteries. Final Report of European Commission. Paris: Bio Intelligence Service.
178. Nagpure, S. C., Downing, R. G., Bhushan, B., Babu, S. S., & Cao, L. (2011). Neutron depth
profiling technique for studying aging in Li-ion batteries. Electrochimica Acta, 56(13), 4735-
4743.
179. Nan, J., Han, D., & Zuo, X. (2005). Recovery of metal values from spent lithium-ion
batteries with chemical deposition and solvent extraction. Journal of Power Sources, 152,
278-284.
180. Narula, C. K., Martinez, R., Onar, O., Starke, M., & Andrews, G. (2011). Final report
economic analysis of deploying used batteries in power systems. Oak Ridge National
Laboratory, Oak Ridge, TN.
181. National Institute for Occupational Safety [NIOSH]. (2007). NIOSH pocket guide to
chemical hazards. Retrieved from http://www.cdc.gov/niosh/docs/2005-149/pdfs/2005-
149.pdf

181
182. Nelson, P. A., Bloom, K. G., & I Dees, D. W. (2011). Modeling the performance and cost
of lithium-ion batteries for electric-drive vehicles (No. ANL-11/32). Argonne National
Laboratory (ANL), Argonne, IL (United States).
183. Nelson, P., & Amine, K. (2007). Advanced Lithium-Ion batteries for plug-in hybrid-electric
vehicles. Lithium batteries: Research, technology and applications, 203. Retrieved from
http://bib.convdocs.org/docs/25/24104/conv_1/file1.pdf#page=216
184. Nemry, F., Leduc, G., & Munoz, A. (2009) Plug-in hybrid and battery-electric vehicles:
State of the Research and Development and Comparative Analysis of Energy and Cost
Efficiency, Technical Note., Institute for Prospective Technological Studies, Joint Research
Centre, European Union. Retrieved from ftp://ftp.jrc.es/pub/EURdoc/JRC54699_TN.pdf
185. Nenadic, N. G., Bussey, H. E., Ardis, P. A., & Thurston, M. G. (2014). Estimation of state-
of-charge and capacity of used lithium-ion cells. International Journal of Prognostics and
Health Management, 5, 12.
186. Neubauer, J., & Pesaran, A. (2011). The ability of battery second use strategies to impact
plug-in electric vehicle prices and serve utility energy storage applications, Journal of Power
Sources, 196(23), 10351-10358.
187. Neubauer, J., Pesaran, A., Williams, B., Ferry, M., & Eyer, J. (2012). A techno-economic
analysis of PEV battery second use: repurposed-battery selling price and commercial and
industrial end-user value. SAE Technical Paper (No. 2012-01-0349)
188. New York State Rechargeable Battery Law. (2010). New York Environmental
Conservation Law. In: Title 18. Rechargeable Battery Recycling (27-1081 e 27-1811)
189. Newell, S. A., & Field, F. R. (1998). Explicit accounting methods for recycling in
LCI. Resources, Conservation and Recycling, 22(1), 31-45.
190. Nicholson, A. L., Olivetti, E. A., Gregory, J. R., Field, F. R., & Kirchain, R. E. (2009,
May). End-of-life LCA allocation methods: open loop recycling impacts on robustness of
material selection decisions. In 2009 IEEE International Symposium on Sustainable Systems
and Technology (pp. 1-6). IEEE.
191. Nishi, Y. (2001). Lithium-ion secondary batteries; past 10 years and the future. Journal of
Power Sources, 100(1), 101-106.
192. Nissan North America, Inc. (2014). http://www.nissanusa.com/electric-cars/leaf/charging-
range/battery/. Accessed 19 January 2015
193. Notter, D. A., Gauch, M., Widmer, R., Wager, P., Stamp, A., Zah, R., & Althaus, H. J.
(2010). Contribution of Li-ion batteries to the environmental impact of electric
vehicles. Environmental science & technology, 44(17), 6550-6556.
194. Oguchi, M., Kameya, T., Yagi, S., & Urano, K. (2008). Product flow analysis of various
consumer durables in Japan. Resources, Conservation and Recycling, 52(3), 463-480.
195. Olivetti, E., Gregory, J., & Kirchain, R. (2011). Life Cycle Impacts of Alkaline Batteries
With a Focus on End‐Of‐Life. Study conducted for the National Electric Manufacturers
Association.
196. Papargyropoulou, E., Lozano, R., Steinberger, J. K., Wright, N., & bin Ujang, Z. (2014).
The food waste hierarchy as a framework for the management of food surplus and food
waste. Journal of Cleaner Production, 76, 106-115.
197. Park, J., Hong, S. J., Kim, I., Lee, J. Y., & Hur, T. (2011). Dynamic material flow analysis
of steel resources in Korea. Resources, Conservation and Recycling, 55(4), 456-462.
198. Parker, C. D. (2001). Lead–acid battery energy-storage systems for electricity supply
networks. Journal of Power Sources, 100(1), 18-28.

182
199. Parks, K., Denholm, P., & Markel, T. (2007). Costs and emissions associated with plug- in
hybrid electric vehicle charging in the Xcel Energy Colorado service territory. Technical
Report NREL/TP-640-41410, National Renewable Energy Laboratory, Golden, Colorado.
200. Paulino, J. F., Busnardo, N. G., & Afonso, J. C. (2008). Recovery of valuable elements
from spent Li-batteries. Journal of Hazardous Materials, 150(3), 843-849.
201. Pauliuk, S., Wang, T., & Muller, D. B. (2011). Moving toward the circular economy: The
role of stocks in the Chinese steel cycle. Environmental science & technology, 46(1), 148-
154.
202. Pavlov, D., & Petkova, G. (2002). Phenomena That Limit the Capacity of the Positive Lead
Acid Battery Plates II. Electrochemical Impedance Spectroscopy and Mechanism of
Discharge of the Plate. Journal of the Electrochemical Society, 149(5), A654-A661.
203. Peterson, S. B., Apt, J., & Whitacre, J. F. (2010). Lithium-ion battery cell degradation
resulting from realistic vehicle and vehicle-to-grid utilization. Journal of Power
Sources, 195(8), 2385-2392.
204. Pistoia, G., Wiaux, J. P., & Wolsky, S. P. (2001). Used battery collection and
recycling (Vol. 10). Elsevier, London.
205. Plunkert, P. A. (2005). Aluminum recycling in the United States in 2000. U.S. Geological
Survey.
206. Ramoni, M. O., & Zhang, H. C. (2013). End-of-life (EOL) issues and options for electric
vehicle batteries. Clean Technologies and Environmental Policy, 15(6), 881-891.
207. Rantik, M. (1999). Life cycle assessment of five batteries for electric vehicles under
different charging regimes. KFB-Meddelande, vol 28. Chalmers Univ. of Technology,
Göteborg, Sweden
208. Reichmuth, D. S., Lutz, A. E., Manley, D. K., & Keller, J. O. (2012). Comparison of the
technical potential for hydrogen, battery electric, and conventional light-duty vehicles to
reduce greenhouse gas emissions and petroleum consumption in the United
States. International Journal of Hydrogen Energy, 38(2), 1200-1208.
209. Richa, K., Babbitt, C. W., Gaustad, G., & Wang, X. (2014). A future perspective on
lithium-ion battery waste flows from electric vehicles. Resources, Conservation and
Recycling, 83, 63-76.
210. Richa, K., Babbitt, C. W., Nenadic, N. G., & Gaustad, G. (2015). Environmental trade-offs
across cascading lithium-ion battery life cycles. The International Journal of Life Cycle
Assessment, 20, 1-16.
211. Richter, B., Goldston, D., Crabtree, G., Glicksman, L., Goldstein, D., Greene, D., Kammen,
D., Levine, M., Lubell, M., Savitz, M., & Sperling, D. (2008). Energy future: Think
efficiency. American Physical Society: College Park, MD. Retrieved from
http://www.aps.org/energyefficiencyreport/report/aps-energyreport.pdf
212. Ritchie, A., & Howard, W. (2006). Recent developments and likely advances in lithium-ion
batteries. Journal of Power Sources, 162(2), 809-812.
213. Robinson, B. H. (2009). E-waste: an assessment of global production and environmental
impacts. Science of the total environment, 408(2), 183-191.
214. Rosenbaum, R.K., Bachmann, T.M., Gold, L.S., Huijbregts, M.A., Jolliet, O., Juraske, R.,
Koehler, A., Larsen, H.F., MacLeod, M., Margni, M. and McKone, T.E. (2008). USEtox—
the UNEP-SETAC toxicity model: recommended characterisation factors for human toxicity
and freshwater ecotoxicity in life cycle impact assessment. The International Journal of Life
Cycle Assessment, 13(7), 532-546.

183
215. Rossi, V., Cleeve-Edwards, N., Lundquist, L., Schenker, U., Dubois, C., Humbert, S., &
Jolliet, O. (2015). Life cycle assessment of end-of-life options for two biodegradable
packaging materials: sound application of the European waste hierarchy. Journal of Cleaner
Production, 86, 132-145.
216. Ruhrberg, M. (2006). Assessing the recycling efficiency of copper from end-of-life
products in Western Europe. Resources, Conservation and Recycling, 48(2), 141-165.
217. Rydberg, T. (1995). Cascade accounting in life cycle assessment applied to polymer
recycling. Polymer Recycling(UK), 1(4), 233-241.
218. Rydh, C. J. (1999). Environmental assessment of vanadium redox and lead-acid batteries
for stationary energy storage. Journal of power sources, 80(1), 21-29.
219. Rydh, C. J., & Sandén, B. A. (2005). Energy analysis of batteries in photovoltaic systems.
Part I: Performance and energy requirements. Energy conversion and management, 46(11),
1957-1979.
220. Rydh, C. J., & Karlström, M. (2002). Life cycle inventory of recycling portable nickel–
cadmium batteries. Resources, Conservation and Recycling, 34(4), 289-309.
221. Saevarsdottir, G., Tao, P. C., Stefansson, H., & Harvey, W. (2014). Potential use of
geothermal energy sources for the production of lithium-ion batteries. Renewable Energy, 61,
17-22.
222. Samaras, C., & Meisterling, K. (2008). Life cycle assessment of greenhouse gas emissions
from plug-in hybrid vehicles: implications for policy. Environmental science &
technology, 42(9), 3170-3176.
223. Sathre, R., Scown, C. D., Kavvada, O., & Hendrickson, T. P. (2015). Energy and climate
effects of second-life use of electric vehicle batteries in California through 2050. Journal of
Power Sources, 288, 82-91.
224. Saxena, S., Le Floch, C., MacDonald, J., & Moura, S. (2015). Quantifying EV battery end-
of-life through analysis of travel needs with vehicle powertrain models. Journal of Power
Sources, 282, 265-276.
225. Shanghai Metals Market. (2012). Minor metals prices. Accessed July 2012 from
http://www.metal.com/metals/minor-metals/prices
226. Shiau, C. S. N., Samaras, C., Hauffe, R., & Michalek, J. J. (2009). Impact of battery weight
and charging patterns on the economic and environmental benefits of plug-in hybrid
vehicles. Energy Policy, 37(7), 2653-2663.
227. Shin, S. M., Kim, N. H., Sohn, J. S., Yang, D. H., & Kim, Y. H. (2005). Development of a
metal recovery process from Li-ion battery wastes. Hydrometallurgy, 79(3), 172-181.
228. Shrestha, S., Martin, S., & Zhang, J. (2010). Industry Note. Alternative Energy and
Infrastructure. Lazard Capital Markets (March, 2010). Retrieved from
http://www.eosenergystorage.com/articles/LazardMarketReport%202010-03.pdf
229. Sibley, S. F. (2011). Overview of Flow Studies for Recycling Metal Commodities in the
United States. U.S. Geological Survey. Retrieved from http://pubs.usgs.gov/circ/circ1196-
AA/
230. Slack, R. J., Gronow, J. R., & Voulvoulis, N. (2005). Household hazardous waste in
municipal landfills: contaminants in leachate. Science of the total environment, 337(1), 119-
137.
231. Soloveichik, G. L. (2011). Battery technologies for large-scale stationary energy
storage. Annual review of chemical and biomolecular engineering, 2, 503-527.

184
232. Spotnitz, R. (2003). Simulation of capacity fade in lithium-ion batteries. Journal of Power
Sources, 113(1), 72-80.
233. Srinivasan, V. (2008). Batteries for Vehicular Applications. AIP conference proceedings,
1044p. 283. Retrieved from http://bestar.lbl.gov/venkat/files/batteries-for-vehicles.pdf
234. Srinivasan, V., & Lipp, L. (2003). Report on the Electrolytic Industries for the Year
2002. Journal of the Electrochemical Society, 150(12), K15-K38.
235. Standridge, C. & Corneal, L. (2014).Remanufacturing, Repurposing, and Recycling of Post-
Vehicle-Application Lithium-Ion Batteries. Report 12-20. San Jose, CA: Mineta National
Transit Research Consortium, June 2014. Retrieved from
http://transweb.sjsu.edu/PDFs/research/1137-post-vehicle-Li-Ion-recycling.pdf
236. Steinmetz, J., & Shankar, R. (March, 2008). Autos & Auto Related: Plug in Hybrids: The
Next Automotive Revolution. New York: Morgan Stanley Research, North America, p. 13.
237. Steubing, B., Böni, H., Schluep, M., Silva, U., & Ludwig, C. (2010). Assessing computer
waste generation in Chile using material flow analysis. Waste management, 30(3), 473-482.
238. Streicher-Porte, M., Marthaler, C., Böni, H., Schluep, M., Camacho, A., & Hilty, L. M.
(2009). One laptop per child, local refurbishment or overseas donations? Sustainability
assessment of computer supply scenarios for schools in Colombia. Journal of Environmental
Management, 90(11), 3498-3511.
239. Streicher-Porte, M., Widmer, R., Jain, A., Bader, H. P., Scheidegger, R., & Kytzia, S.
(2005). Key drivers of the e-waste recycling system: Assessing and modelling e-waste
processing in the informal sector in Delhi. Environmental Impact Assessment Review, 25(5),
472-491.
240. Sullivan, J. L., & Gaines, L. (2012). Status of life cycle inventories for batteries. Energy
Conversion and Management, 58, 134-148.
241. Sullivan, J. L., Gaines, L., & Burnham, A. (2011). Role of recycling in the life cycle of
batteries. In TMS 2011 140th annual meeting and exhibition, materials processing and
energy materials.
242. Sumitomo Corp. (2011). Aiming to initiate second-life business for electric car batteries.
http://www.sumitomocorp.co.jp/english/business/article/id=263. Accessed 25 January 2015
243. Sustainable Energy Ireland [SEI]. (2007). Hybrid electric and battery electric vehicles-
technology, costs and benefits. ILTP Consulting. Retrieved from
http://www.seai.ie/News_Events/Press_Releases/Costs_and_benefits.pdf. Accessed 5 April
2014
244. Swain, B., Jeong, J., Lee, J. C., Lee, G. H., & Sohn, J. S. (2007). Hydrometallurgical
process for recovery of cobalt from waste cathodic active material generated during
manufacturing of lithium ion batteries. Journal of Power Sources, 167(2), 536-544.
245. Tanaka, T., Ohta, K., & Arai, N. (2001). Year 2000 R&D status of large-scale lithium-ion
secondary batteries in the national project of Japan. Journal of power sources, 97, 2-6.
246. U.S Environmental Protection Agency and U.S. Department of Energy. (2013).
www.fueleconomy.gov- The official US government source for fuel economy information.
Retrieved from http://www.fueleconomy.gov/
247. U.S. Department of Energy. (2010). Final Environmental Assessment for Compact Power,
Inc. Electric Drive Vehicle Battery and Component Manufacturing Initiative Application,
Holland, Michigan. U.S. Department of Energy, National Energy Technology Laboratory.
Retrieved from http://energy.gov/sites/prod/files/nepapub/nepa_documents/RedDont/EA-
1709-FEA-2010.pdf. Accessed 20 October 2014

185
248. U.S. DOE. (July, 2010). The recovery Act: Transforming America's transportation sector.
Batteries and electric vehicles. Retrieved from
http://www.whitehouse.gov/files/documents/Battery-and-Electric-Vehicle-Report-
FINAL.pdf
249. U.S. EPA. (2012). Lithium-Ion Batteries and Nanotechnology for Electric Vehicles: A Life
Cycle Assessment. EPA 744-R-12-001. U.S. EPA, Washington DC
250. US Department of Transportation (USDOT). (2014). U.S. Department of Transportation
Issues New Standards to Improve Safety of Lithium Battery Transportation. Retrieved from
https://www.transportation.gov/briefing-room/us-department-transportation-issues-new-
standards-improve-safety-lithium-battery
251. US Department of Transportation (USDOT). (December, 2015). DOT-Special Permit
16474, Pipeline and Hazardous Materials Safety Administration. Retrieved from
http://www.phmsa.dot.gov/staticfiles/PHMSA/SPA_App/OfferDocuments/SP16474_201505
0361.pdf
252. US EPA. (2009). National Primary Drinking Water Regulations. Retrieved from
http://water.epa.gov/drink/contaminants/upload/mcl-2.pdf
253. US EPA. (2015a). Advancing Sustainable Materials Management: Facts and Figures.
Retrieved from
www.epa.gov/solidwaste/nonhaz/municipal/pubs/2013_advncng_smm_rpt.pdf. Accessed
December 2015.
254. US EPA. (2015b). Sustainable Materials Management: Non-Hazardous Materials and
Waste Management Hierarchy. Retrieved from www.epa.gov/smm/sustainable-materials-
management-non-hazardous-materials-and-waste-management-hierarchy. Accessed January
2016.
255. US EPA. (2016). Food Recovery Hierarchy. Retrieved from www.epa.gov/sustainable-
management-food/food-recovery-hierarchy. Accessed January 2016.
256. US GPO. (1996). Public Law 104–142-Mercury Containing and Rechargeable Battery
Management Act. Retrieved from http://www.gpo.gov/fdsys/pkg/PLAW-
104publ142/content-detail.html
257. USABC. (2014). 2014 Recommended Practice for Recycling of xEV Electrochemical
Energy Storage Systems. United States Advanced Battery Consortium Report. Retrieved
from http://uscar.org/guest/teams/68/USABC-Battery-Recycling-Group
258. USGS. (2009). Lithium, U.S. Geological Survey, Mineral Commodity Summaries 2009.
Retrieved from http://minerals.usgs.gov/minerals/pubs/commodity/lithium/mcs-2009-
lithi.pdf
259. USGS. (2012). Mineral Commodity Summaries 2012. U.S. Geological Survey 2012.
260. USGS. (2015). Mineral Commodity Summaries 2015. U.S. Geological Survey 2015.
261. Van den Bossche, P., Vergels, F., Van Mierlo, J., Matheys, J., & Van Autenboer, W.
(2006). SUBAT: An assessment of sustainable battery technology. Journal of power
sources, 162(2), 913-919.
262. Van Haaren, R. (2011). Assessment of Electric Cars’ Range Requirements and Usage
Patterns based on Driving Behavior recorded in the National Household Travel Survey of
2009. Earth and Environmental Engineering Department, Columbia University, Fu
Foundation School of Engineering and Applied Science, New York
263. Vimmerstedt, L. J., Ring, S., & Hammel, C. J. (1995). Current status of environmental,
health, and safety issues of lithium-ion electric vehicle batteries (No. NREL/TP--463-7673).

186
National Renewable Energy Lab., Golden, CO (United States). Retrieved from
http://www.osti.gov/energycitations/product.biblio.jsp?osti_id=135056
264. Viswanathan, V. V., & Kintner-Meyer, M. (2011). Second use of transportation batteries:
Maximizing the value of batteries for transportation and grid services. IEEE Transactions on
vehicular technology, 60(7), 2963-2970.
265. Walls, M. (2006). Extended producer responsibility and product design: economic theory
and selected case studies. Paris: OECD.
266. Wang, X., Gaustad, G., Babbitt, C. W., Bailey, C., Ganter, M. J., & Landi, B. J. (2014a).
Economic and environmental characterization of an evolving Li-ion battery waste
stream. Journal of environmental management, 135, 126-134.
267. Wang, X., & Gaustad, G. (2012). Prioritizing material recovery for end-of-life printed
circuit boards. Waste Management, 32(10), 1903-1913.
268. Wang, X., Gaustad, G., & Babbitt, C. W. (2015). Targeting high value metals in lithium-ion
battery recycling via shredding and size-based separation. Waste Management.
269. Wang, X., Gaustad, G., Babbitt, C. W., & Richa, K. (2014b). Economies of scale for future
lithium-ion battery recycling infrastructure. Resources, Conservation and Recycling, 83, 53-
62.
270. Watabe, T., & Mori, M. (2011). LIB materials industry. Automotive LIB materials get set
for growth phase in 2011. Global Markets Research. Deutsche Bank Group. Retrieved from
http://www.fullermoney.com/content/2012-02-02/LiB12611.pdf
271. Webster, H. (2010). Fire protection for shipment of lithium batteries in aircraft cargo
compartments. U.S. Department of Transportation.
272. Wellbeloved, D. B., Craven, P. M., & Waudby, J. W. (1990). Manganese and manganese
alloys. Ullmann's Encyclopedia of Industrial Chemistry.
273. Werner, F., Althaus, H. J., Richter, K., & Scholz, R. W. (2007). Post-consumer waste wood
in attributive product LCA. The International Journal of Life Cycle Assessment, 12(3), 160-
172.
274. Widmer, R., Oswald-Krapf, H., Sinha-Khetriwal, D., Schnellmann, M., & Böni, H. (2005).
Global perspectives on e-waste. Environmental Impact Assessment Review, 25(5), 436-458.
275. Williams, B. (2011). Plug-In-Vehicle Battery Second Life: the Effect of Post-Vehicle,
Distributed-Grid Energy Storage Value on Battery-Lease Payments. Transportation
Sustainability Research Center, University of California, Berkeley, CA
276. Williams, B. D., & Lipman, T. E. (2010). Strategy for Overcoming Cost Hurdles of Plug-
In-Hybrid Battery in California. Transportation Research Record: Journal of the
Transportation Research Board, 2191(1), 59-66.
277. Williams, E., Kahhat, R., Allenby, B., Kavazanjian, E., Kim, J., & Xu, M. (2008).
Environmental, social, and economic implications of global reuse and recycling of personal
computers. Environmental Science & Technology, 42(17), 6446-6454.
278. World Health Organization [WHO]. (2008). Guidelines for drinking-water quality - Volume
1: Recommendations. Retrieved from
www.who.int/water_sanitation_health/dwq/gdwq3rev/en/. Accessed 15 January 2016
279. Xu, T., Wang, W., Gordin, M. L., Wang, D., & Choi, D. (2010). Lithium-ion batteries for
stationary energy storage. The Journal of the Minerals, Metals & Materials Society, 62(9),
24-30.

187
280. Xu, J., Thomas, H. R., Francis, R. W., Lum, K. R., Wang, J., & Liang, B. (2008). A review
of processes and technologies for the recycling of lithium-ion secondary batteries. Journal of
Power Sources, 177(2), 512-527.
281. Yaksic, A., & Tilton, J. E. (2009). Using the cumulative availability curve to assess the
threat of mineral depletion: The case of lithium. Resources Policy, 34(4), 185-194.
282. Yang, Z., Mei, Z., Xu, F., Yao, Y., Zhang, W., Qi, W., & Zhao, T. (2013). Different types
of MnO2 recovered from spent LiMn2O4 batteries and their application in electrochemical
capacitors. Journal of Materials Science, 48(6), 2512-2519.
283. Yoshida, A., Tasaki, T., & Terazono, A. (2009). Material flow analysis of used personal
computers in Japan. Waste management, 29(5), 1602-1614.
284. Yoshio, M., & Noguchi, H. (2009). A review of positive electrode materials for lithium-ion
batteries. In Lithium-Ion Batteries (pp. 9-48). Springer New York.
285. Zackrisson, M., Avellán, L., & Orlenius, J. (2010). Life cycle assessment of lithium-ion
batteries for plug-in hybrid electric vehicles–Critical issues.Journal of Cleaner
Production, 18(15), 1519-1529.
286. Zhang, Y., Wang, C. Y., & Tang, X. (2011). Cycling degradation of an automotive
LiFePO4 lithium-ion battery. Journal of Power Sources, 196(3), 1513-1520.
287. Zou, H., Gratz, E., Apelian, D., & Wang, Y. (2013). A novel method to recycle mixed
cathode materials for lithium-ion batteries. Green Chemistry, 15(5), 1183-1191.