Embed Size (px)
Citation preview
© 2014 WIPRO LTD | WWW.WIPRO.COM | CONFIDENTIAL 1
Sustainable Logistics
Air Cargo Opportunities
Dr Emre Serpen
Head of Global Airport Practice

© 2014 WIPRO LTD | WWW.WIPRO.COM | CONFIDENTIAL 2
Intra-regional trade between Asia and Europe represents
largest and rapidly growing trade lanes
2 Source: WTO, RBerger
$ USD Billion, %
Airports serving growing global trade lanes are well positioned to
take advantage of this growth

© 2014 WIPRO LTD | WWW.WIPRO.COM | CONFIDENTIAL 3 Source: OAG
This is driven by connectivities across world’s economic regions with
shifting emphasis towards Asia
Opportunity to replicate the success of
passenger business
Forecasted GDP growth in Asia Pacific,
Middle East and Africa are also above
global averages.
GDP Growth Forecast (2013-2023)
© 2014 WIPRO LTD | WWW.WIPRO.COM | CONFIDENTIAL 4
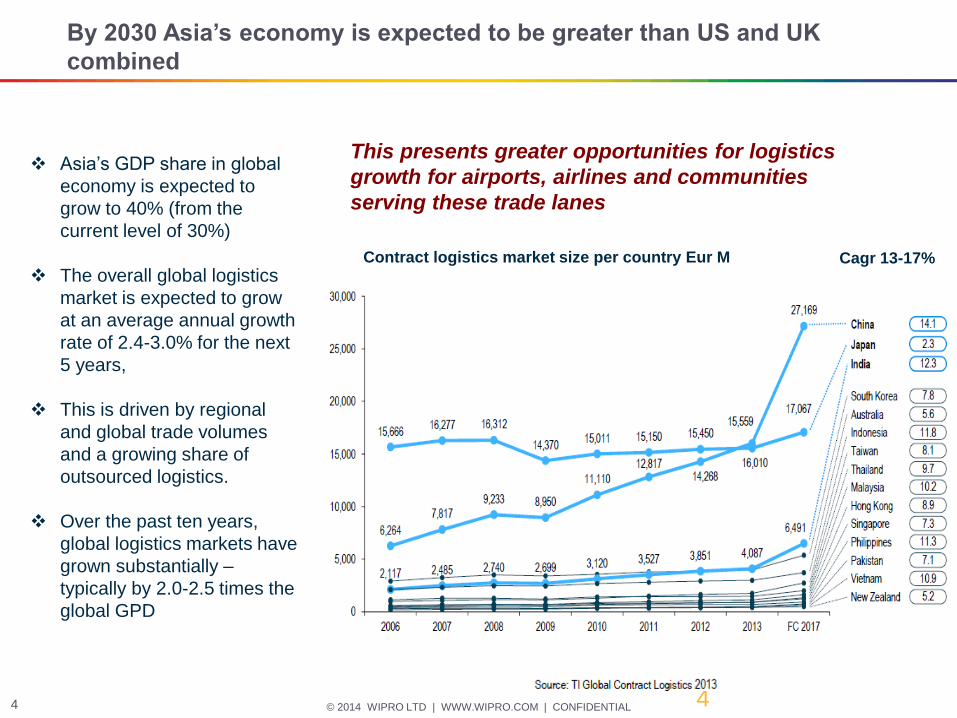
By 2030 Asia’s economy is expected to be greater than US and UK
combined
4
Contract logistics market size per country Eur M Cagr 13-17%
Asia’s GDP share in global
economy is expected to
grow to 40% (from the
current level of 30%)
The overall global logistics
market is expected to grow
at an average annual growth
rate of 2.4-3.0% for the next
5 years,
This is driven by regional
and global trade volumes
and a growing share of
outsourced logistics.
Over the past ten years,
global logistics markets have
grown substantially –
typically by 2.0-2.5 times the
global GPD
This presents greater opportunities for logistics
growth for airports, airlines and communities
serving these trade lanes

© 2014 WIPRO LTD | WWW.WIPRO.COM | CONFIDENTIAL 5
This in turn will drive significant shift in established global
trade-lanes, where China is expected to lead
5
2030 current
China –US 600
China – Japan 340
China Korea 140
China - India - 290
China Germany 200
Main focus US- Europe- China Growth of Asia, in particular
China
China – Japan 210
Japan – US 150
China Korea 140
Germany – US 120
$ B $ B
And trade developing
between emerging economies

© 2014 WIPRO LTD | WWW.WIPRO.COM | CONFIDENTIAL 6
Air cargo trade lanes generally reflect global trade lane patterns
6 Re LogCap Strat
© 2014 WIPRO LTD | WWW.WIPRO.COM | CONFIDENTIAL 7
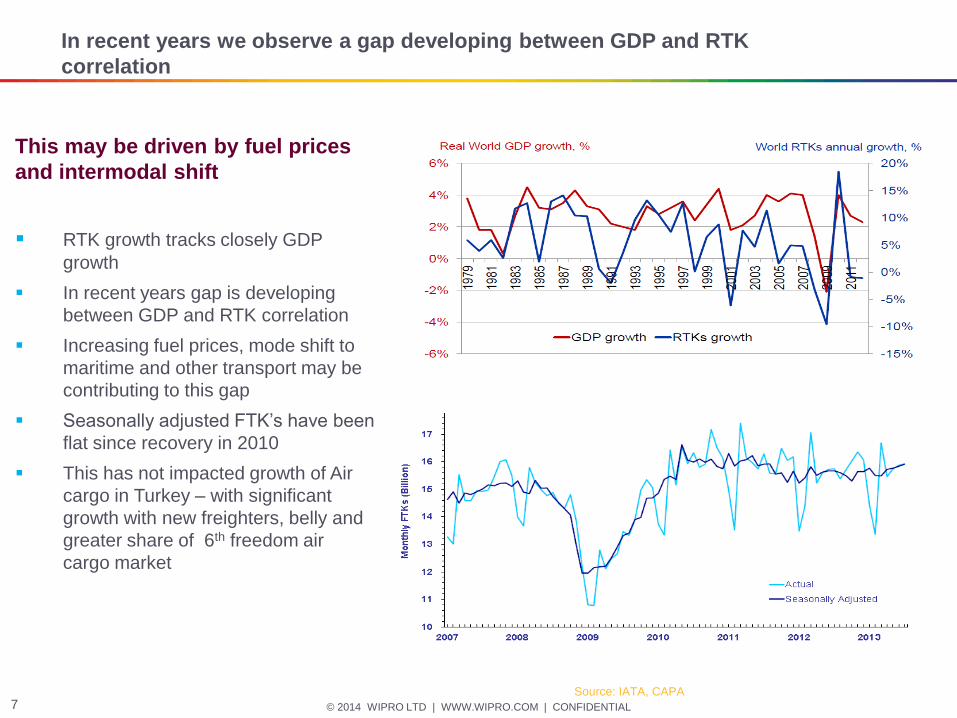
In recent years we observe a gap developing between GDP and RTK
correlation
This may be driven by fuel prices
and intermodal shift
RTK growth tracks closely GDP
growth
In recent years gap is developing
between GDP and RTK correlation
Increasing fuel prices, mode shift to
maritime and other transport may be
contributing to this gap
Seasonally adjusted FTK’s have been
flat since recovery in 2010
This has not impacted growth of Air
cargo in Turkey – with significant
growth with new freighters, belly and
greater share of 6th freedom air
cargo market
Source: IATA, CAPA

© 2014 WIPRO LTD | WWW.WIPRO.COM | CONFIDENTIAL 8
Istanbul is now leading hub in passenger traffic
World air cargo traffic has grown 5.4 %
since 1982 from 50 to 200 billion RTK
Next 30 years world economy is expected to
grow by 3.2%, cargo traffic is expected to
grow to 600 billion RTK, 5%
2023 goal for Turkey is $500 M, this could
represent growth of air cargo from 2.5
million to 6 Million Tonnes
Industry is poised for change to replicate
the success we have seen in passenger air
transport in both destination and
transhipment market
Source: Boeing, Airbus
© 2014 WIPRO LTD | WWW.WIPRO.COM | CONFIDENTIAL 9 9
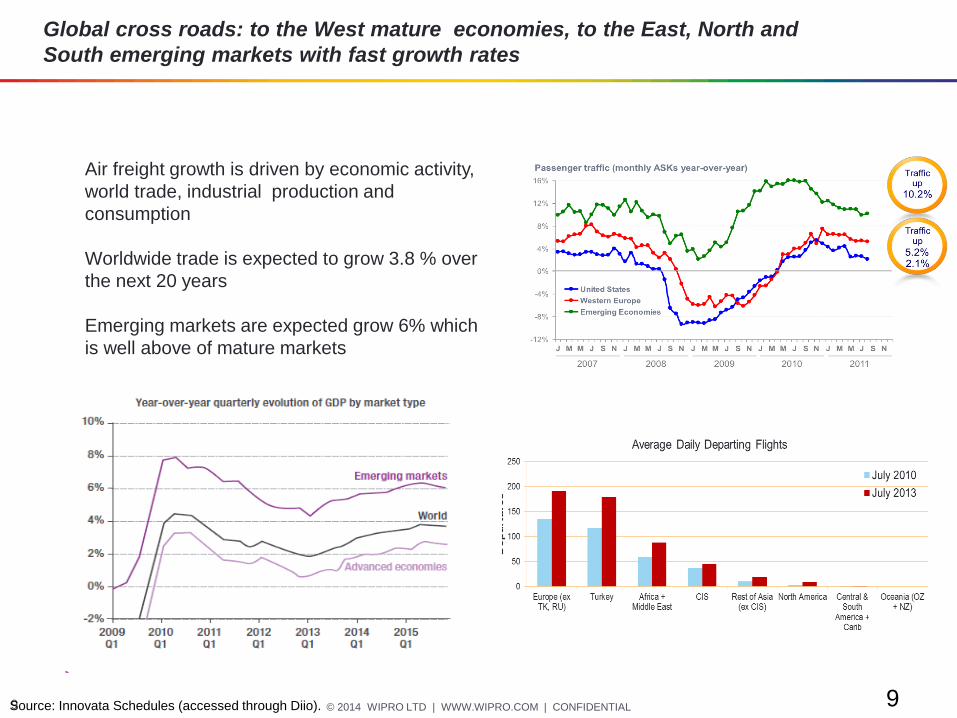
Global cross roads: to the West mature economies, to the East, North and
South emerging markets with fast growth rates
Source: Innovata Schedules (accessed through Diio).
Air freight growth is driven by economic activity,
world trade, industrial production and
consumption
Worldwide trade is expected to grow 3.8 % over
the next 20 years
Emerging markets are expected grow 6% which
is well above of mature markets

© 2014 WIPRO LTD | WWW.WIPRO.COM | CONFIDENTIAL 10 10 Source: TroyAvi Analysis, ADI Data
The regions for which capacity grew the fastest in 2012 were between Europe and Latin America, Asia, and Africa/Middle East.
This is underpinned by capacity and market share growth at Istanbul
Airport across all major routes
Market sizes which grew the fastest in 2012 market share to from Africa/Middle East, Europe and Asia, within Europe and between North America and Europe.
© 2014 WIPRO LTD | WWW.WIPRO.COM | CONFIDENTIAL 11
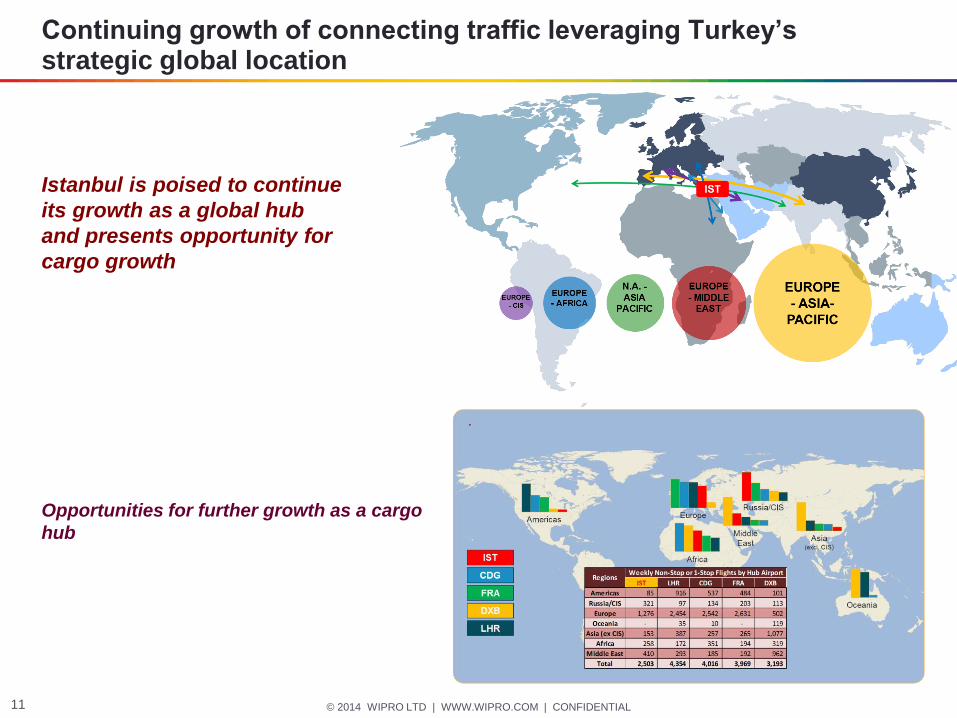
Continuing growth of connecting traffic leveraging Turkey’s strategic global location
Istanbul is poised to continue
its growth as a global hub
and presents opportunity for
cargo growth
Opportunities for further growth as a cargo
hub
© 2014 WIPRO LTD | WWW.WIPRO.COM | CONFIDENTIAL 12
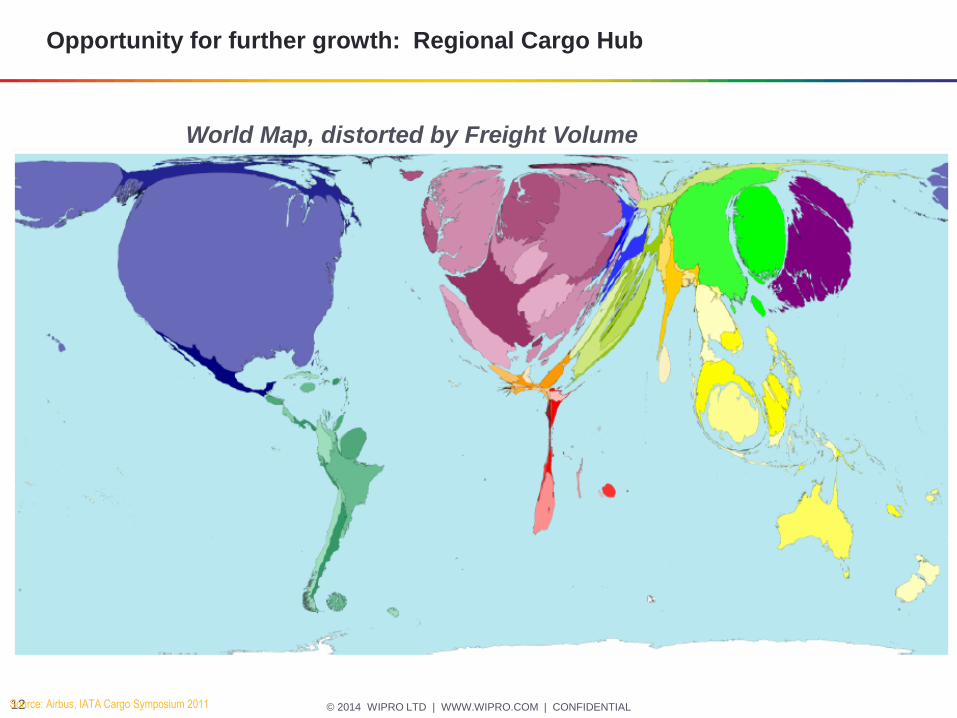
World Map, distorted by Freight Volume
Source: Airbus, IATA Cargo Symposium 2011
Opportunity for further growth: Regional Cargo Hub
© 2014 WIPRO LTD | WWW.WIPRO.COM | CONFIDENTIAL 13
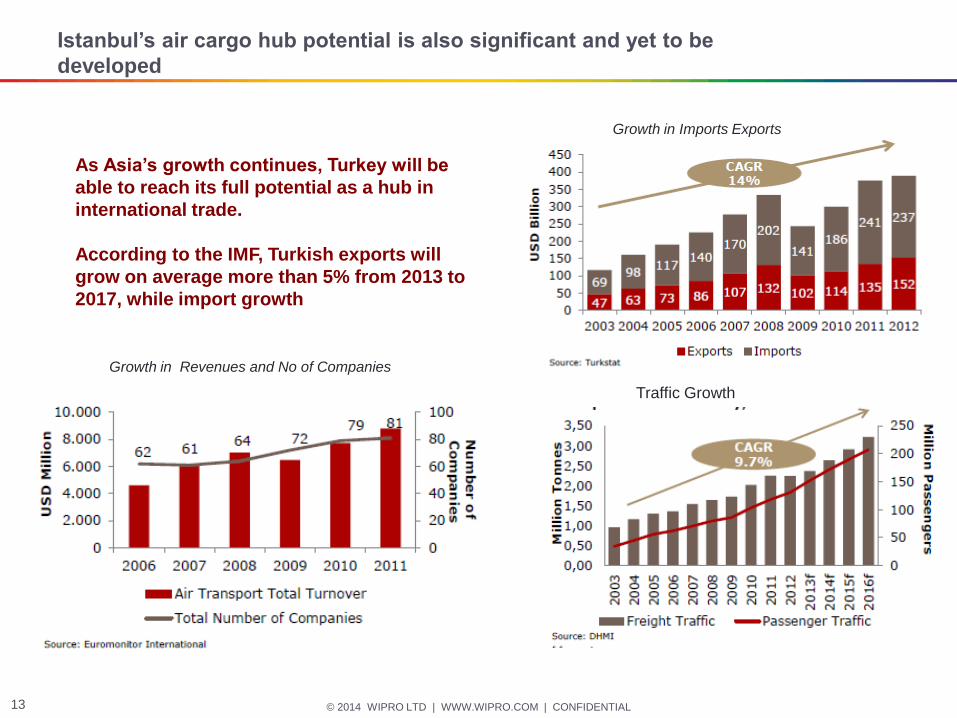
Istanbul’s air cargo hub potential is also significant and yet to be
developed
As Asia’s growth continues, Turkey will be
able to reach its full potential as a hub in
international trade.
According to the IMF, Turkish exports will
grow on average more than 5% from 2013 to
2017, while import growth
Growth in Imports Exports
Traffic Growth
Growth in Revenues and No of Companies
© 2014 WIPRO LTD | WWW.WIPRO.COM | CONFIDENTIAL 14
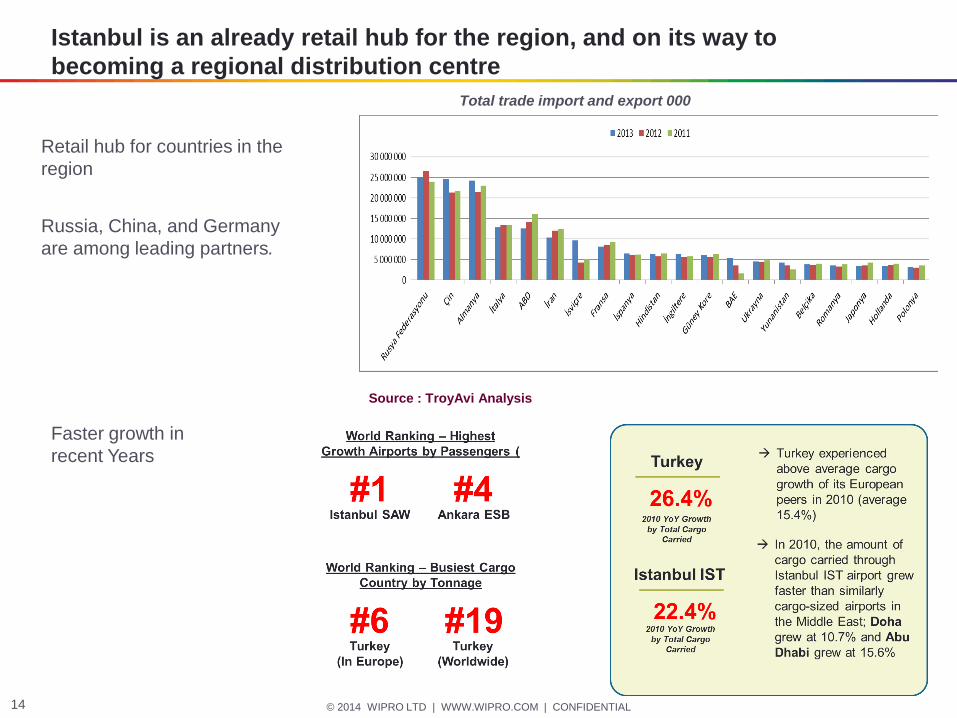
Total trade import and export 000
Istanbul is an already retail hub for the region, and on its way to
becoming a regional distribution centre
Russia, China, and Germany
are among leading partners.
Retail hub for countries in the
region
Source : TroyAvi Analysis
Faster growth in
recent Years
© 2014 WIPRO LTD | WWW.WIPRO.COM | CONFIDENTIAL 15
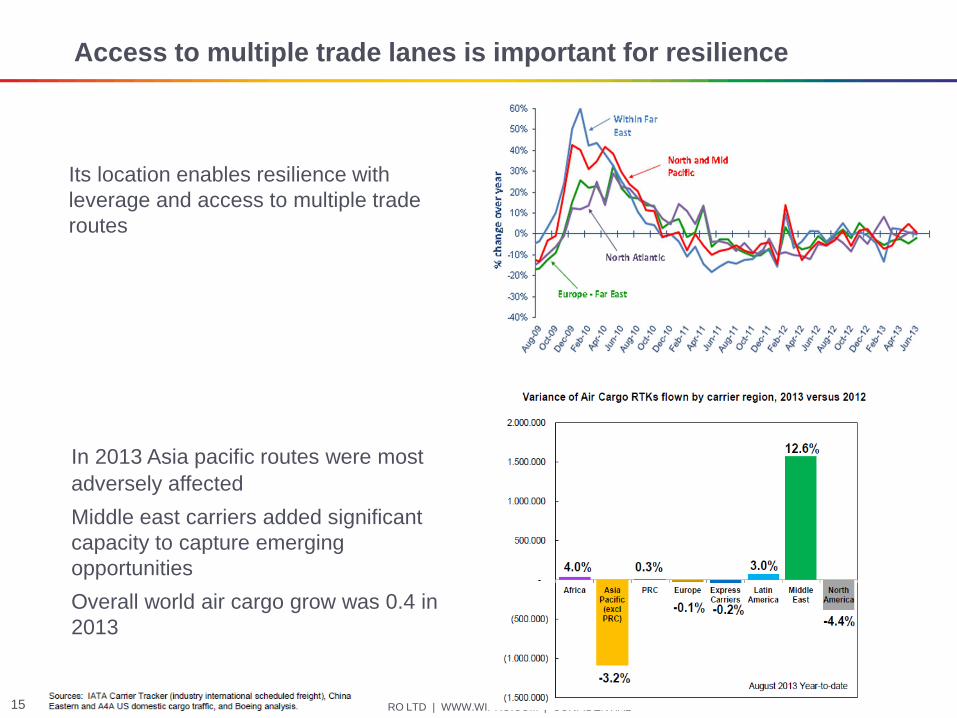
Access to multiple trade lanes is important for resilience
In 2013 Asia pacific routes were most
adversely affected
Middle east carriers added significant
capacity to capture emerging
opportunities
Overall world air cargo grow was 0.4 in
2013
Its location enables resilience with
leverage and access to multiple trade
routes
© 2014 WIPRO LTD | WWW.WIPRO.COM | CONFIDENTIAL 16
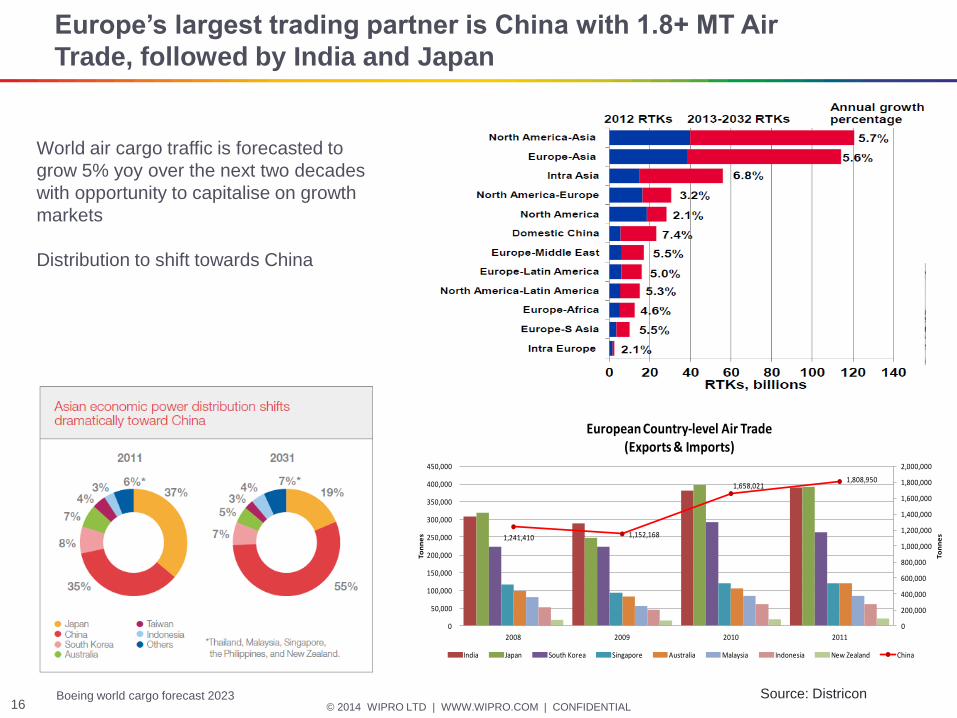
Europe’s largest trading partner is China with 1.8+ MT Air
Trade, followed by India and Japan
1,241,410 1,152,168
1,658,0211,808,950
0
200,000
400,000
600,000
800,000
1,000,000
1,200,000
1,400,000
1,600,000
1,800,000
2,000,000
0
50,000
100,000
150,000
200,000
250,000
300,000
350,000
400,000
450,000
2008 2009 2010 2011
To
nn
es
To
nn
es
European Country-level Air Trade(Exports & Imports)
India Japan South Korea Singapore Australia Malaysia Indonesia New Zealand China
Source: Districon
World air cargo traffic is forecasted to
grow 5% yoy over the next two decades
with opportunity to capitalise on growth
markets
Distribution to shift towards China
Boeing world cargo forecast 2023
© 2014 WIPRO LTD | WWW.WIPRO.COM | CONFIDENTIAL 17
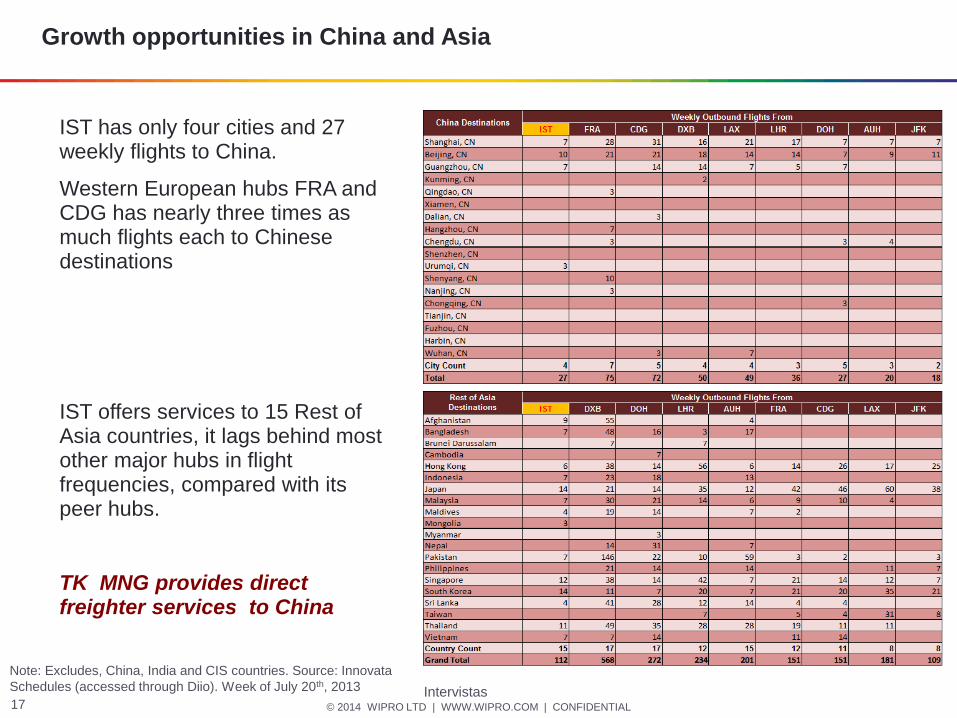
Growth opportunities in China and Asia
Note: Excludes, China, India and CIS countries. Source: Innovata
Schedules (accessed through Diio). Week of July 20th, 2013
IST has only four cities and 27 weekly flights to China.
Western European hubs FRA and CDG has nearly three times as much flights each to Chinese destinations
IST offers services to 15 Rest of Asia countries, it lags behind most other major hubs in flight frequencies, compared with its peer hubs.
TK MNG provides direct freighter services to China
Intervistas

© 2014 WIPRO LTD | WWW.WIPRO.COM | CONFIDENTIAL 18
Air freight in Turkey doubled between 2004 and 2013
TR:Turkey, KR: Korea CNN: China North IN: Indonesia USNC:US North Central
CNS: China South, IL: Israel TW: Taiwan ONRE: Near East USSW: US south West
HKUS NE : US North East CNE: China East JP: Japan USSE: US South East CA: Canada
ONAF: North Africa SG: Singapore AU: Australia AE: UAE OME: Middle East
Non Directional
Source: LogCapStrat database
© 2014 WIPRO LTD | WWW.WIPRO.COM | CONFIDENTIAL 19
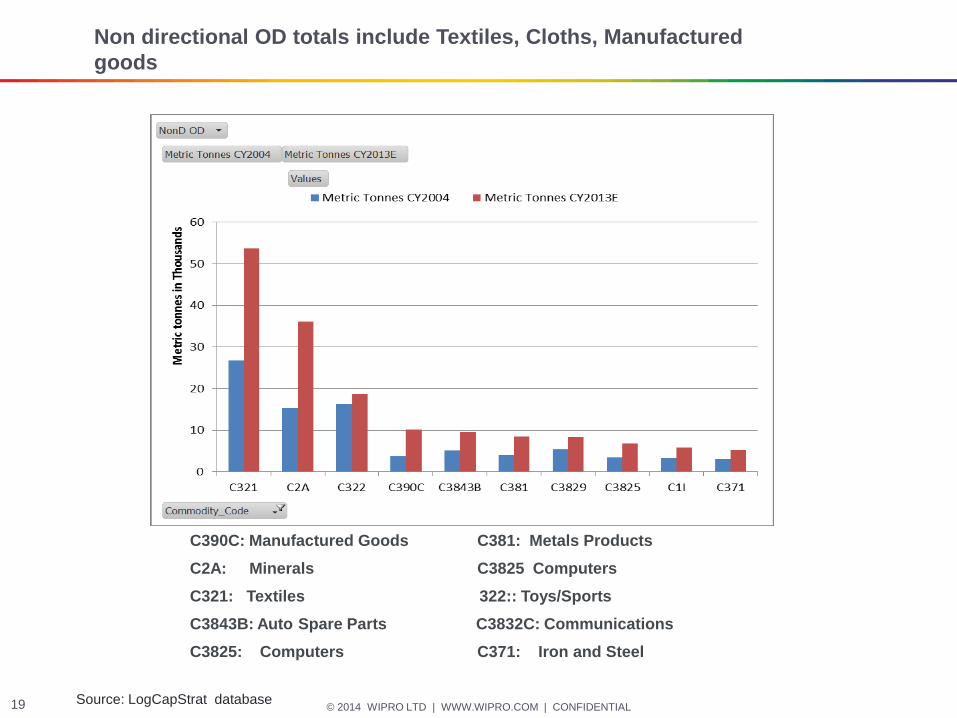
Non directional OD totals include Textiles, Cloths, Manufactured
goods
C390C: Manufactured Goods C381: Metals Products
C2A: Minerals C3825 Computers
C321: Textiles 322:: Toys/Sports
C3843B: Auto Spare Parts C3832C: Communications
C3825: Computers C371: Iron and Steel
Source: LogCapStrat database
© 2014 WIPRO LTD | WWW.WIPRO.COM | CONFIDENTIAL 20
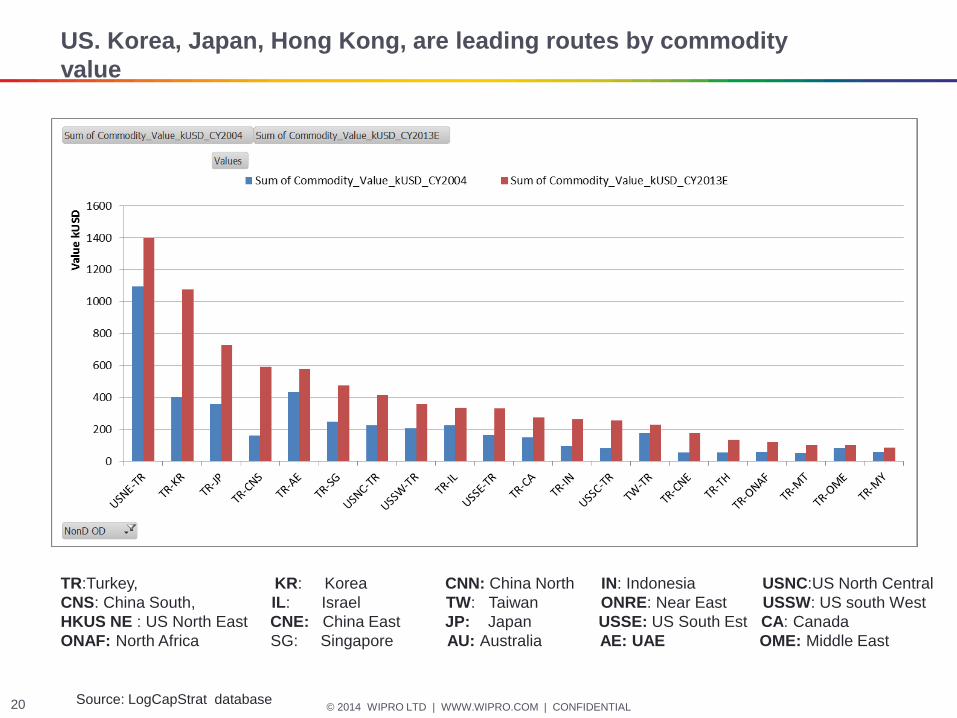
US. Korea, Japan, Hong Kong, are leading routes by commodity
value
TR:Turkey, KR: Korea CNN: China North IN: Indonesia USNC:US North Central
CNS: China South, IL: Israel TW: Taiwan ONRE: Near East USSW: US south West
HKUS NE : US North East CNE: China East JP: Japan USSE: US South Est CA: Canada
ONAF: North Africa SG: Singapore AU: Australia AE: UAE OME: Middle East
Source: LogCapStrat database

© 2014 WIPRO LTD | WWW.WIPRO.COM | CONFIDENTIAL 21
In US NE route Jewellery, Clothing, Aircraft Parts, Medical and
Computers lead the mix
C390B: Jewellery C851: Professional/Office
C322: Wearing/Clothes C825: Computers
C3845: Aircraft/parts C3821 Electrical/Machinery
C3832B: Semi Conductors C321: Textiles
C3522: Drugs/Medical C832C Iron Communications
C3829: Machinery
Source: LogCapStrat database
Opportunities to
distribute to ME, Africa,
Balkans/Europe
© 2014 WIPRO LTD | WWW.WIPRO.COM | CONFIDENTIAL 22
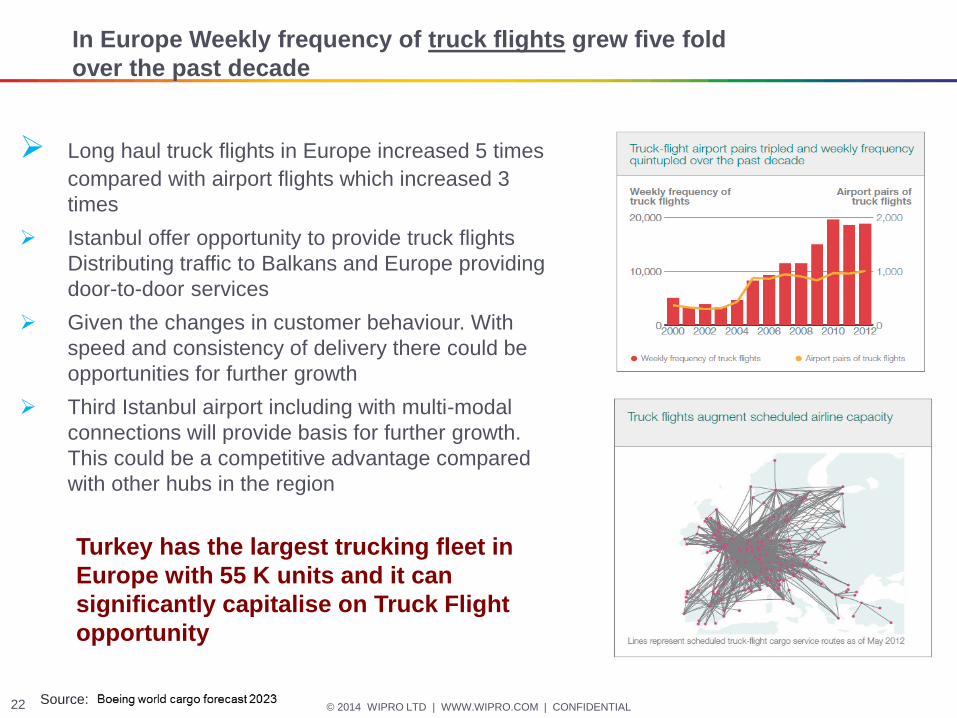
In Europe Weekly frequency of truck flights grew five fold
over the past decade
Long haul truck flights in Europe increased 5 times
compared with airport flights which increased 3
times
Istanbul offer opportunity to provide truck flights
Distributing traffic to Balkans and Europe providing
door-to-door services
Given the changes in customer behaviour. With
speed and consistency of delivery there could be
opportunities for further growth
Third Istanbul airport including with multi-modal
connections will provide basis for further growth.
This could be a competitive advantage compared
with other hubs in the region
Turkey has the largest trucking fleet in
Europe with 55 K units and it can
significantly capitalise on Truck Flight
opportunity
Source:
© 2014 WIPRO LTD | WWW.WIPRO.COM | CONFIDENTIAL 23
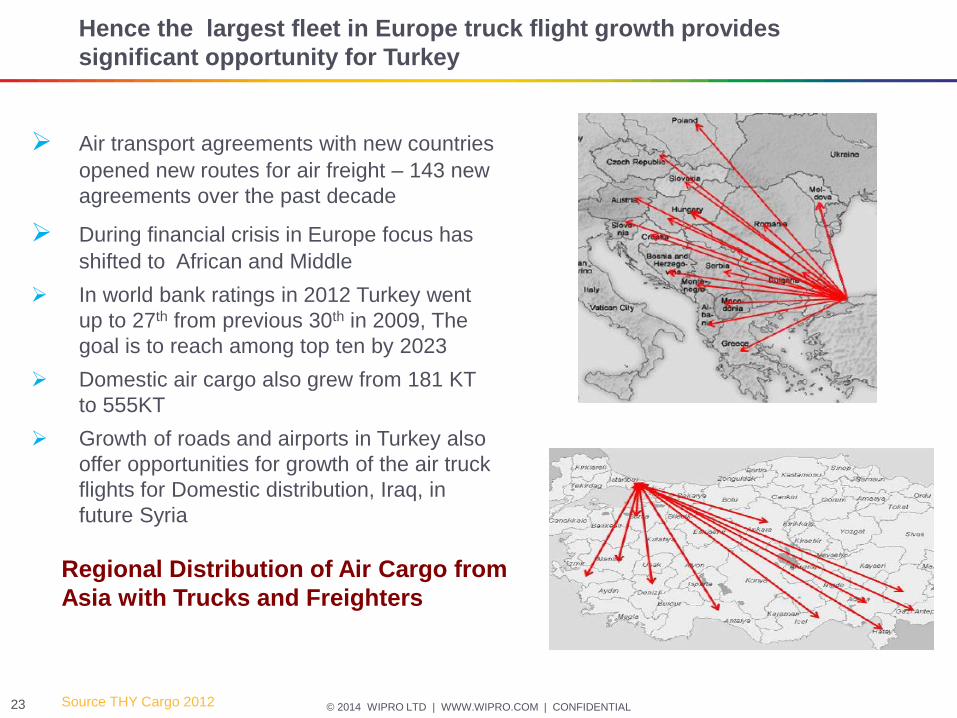
Hence the largest fleet in Europe truck flight growth provides
significant opportunity for Turkey
Air transport agreements with new countries
opened new routes for air freight – 143 new
agreements over the past decade
During financial crisis in Europe focus has
shifted to African and Middle
In world bank ratings in 2012 Turkey went
up to 27th from previous 30th in 2009, The
goal is to reach among top ten by 2023
Domestic air cargo also grew from 181 KT
to 555KT
Growth of roads and airports in Turkey also
offer opportunities for growth of the air truck
flights for Domestic distribution, Iraq, in
future Syria
Regional Distribution of Air Cargo from
Asia with Trucks and Freighters
Source THY Cargo 2012
© 2014 WIPRO LTD | WWW.WIPRO.COM | CONFIDENTIAL 24
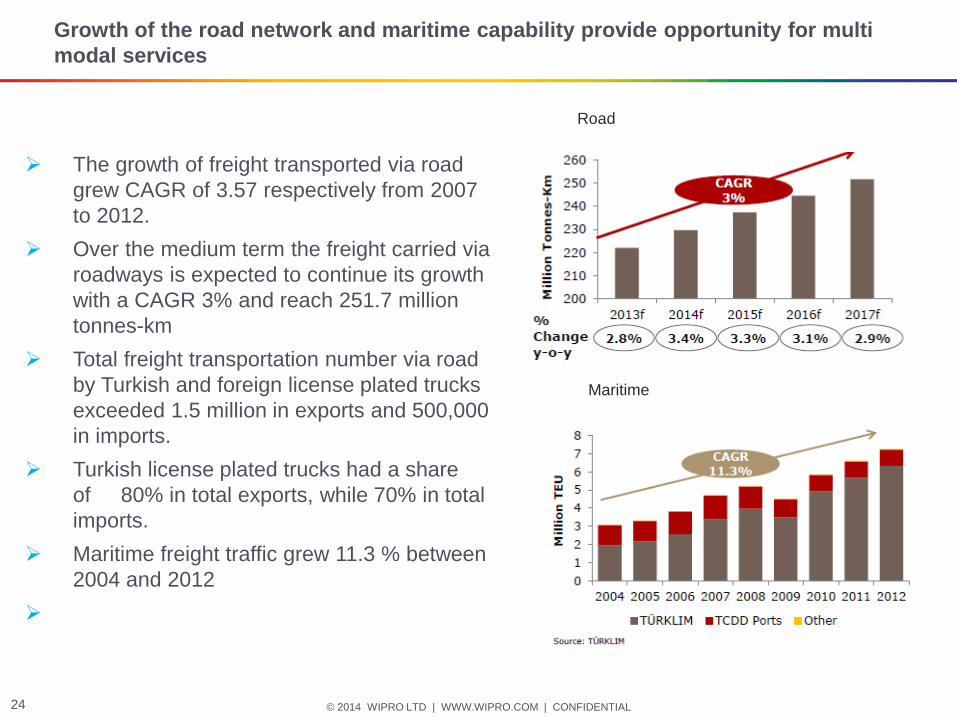
Growth of the road network and maritime capability provide opportunity for multi
modal services
The growth of freight transported via road
grew CAGR of 3.57 respectively from 2007
to 2012.
Over the medium term the freight carried via
roadways is expected to continue its growth
with a CAGR 3% and reach 251.7 million
tonnes-km
Total freight transportation number via road
by Turkish and foreign license plated trucks
exceeded 1.5 million in exports and 500,000
in imports.
Turkish license plated trucks had a share
of 80% in total exports, while 70% in total
imports.
Maritime freight traffic grew 11.3 % between
2004 and 2012
Maritime
Road
© 2014 WIPRO LTD | WWW.WIPRO.COM | CONFIDENTIAL 25
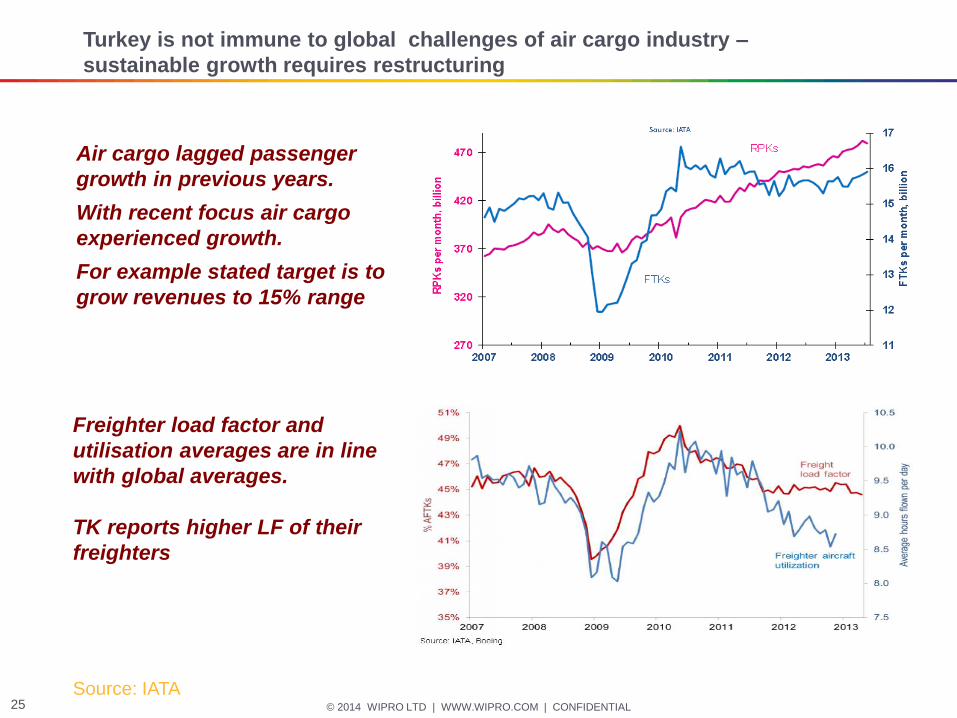
Turkey is not immune to global challenges of air cargo industry –
sustainable growth requires restructuring
Air cargo lagged passenger
growth in previous years.
With recent focus air cargo
experienced growth.
For example stated target is to
grow revenues to 15% range
Source: IATA
Freighter load factor and
utilisation averages are in line
with global averages.
TK reports higher LF of their
freighters

© 2014 WIPRO LTD | WWW.WIPRO.COM | CONFIDENTIAL 26
Growth of WB fleet also present challenges for other Turkish Air Cargo
companies
Growth of WB fleet also present
challenges for other Turkish Air
Cargo companies
This overcapacity in the air freight
business has also contributed to
weak cargo yield trends.
World cargo yield collapsed in 2009,
falling 15%, then rebounding strongly
in 2010, since when it has
underperformed passenger yield
growth (it fell by 6% in 2012
according to IATA).
Source: IATA Ascend
Global Air freight rates have remained weak in 2013

© 2014 WIPRO LTD | WWW.WIPRO.COM | CONFIDENTIAL 27
Logistics performance index indicate there is room for improvement
sustainable logistics growth in Turkey
The Logistics Performance Index (LPI)
measures the logistic "friendliness" of 155
countries. A country’s score
is measured in six key areas:
1.The efficiency of the clearance process with
border control agencies and customs;
2.The quality of infrastructure related to trade
and transport;
3.The level of arrangement of competitively
priced shipments;
4.The quality and expertise of logistics
services;
5.How well the consignments are tracked and
traced;
6.The rate at which shipments reach their
destination within the scheduled and/or
expected delivery time.
•
Turkey moved up from 39th place in 2010 to 27th in
2012, out of the 155 countries in the index
© 2014 WIPRO LTD | WWW.WIPRO.COM | CONFIDENTIAL 28
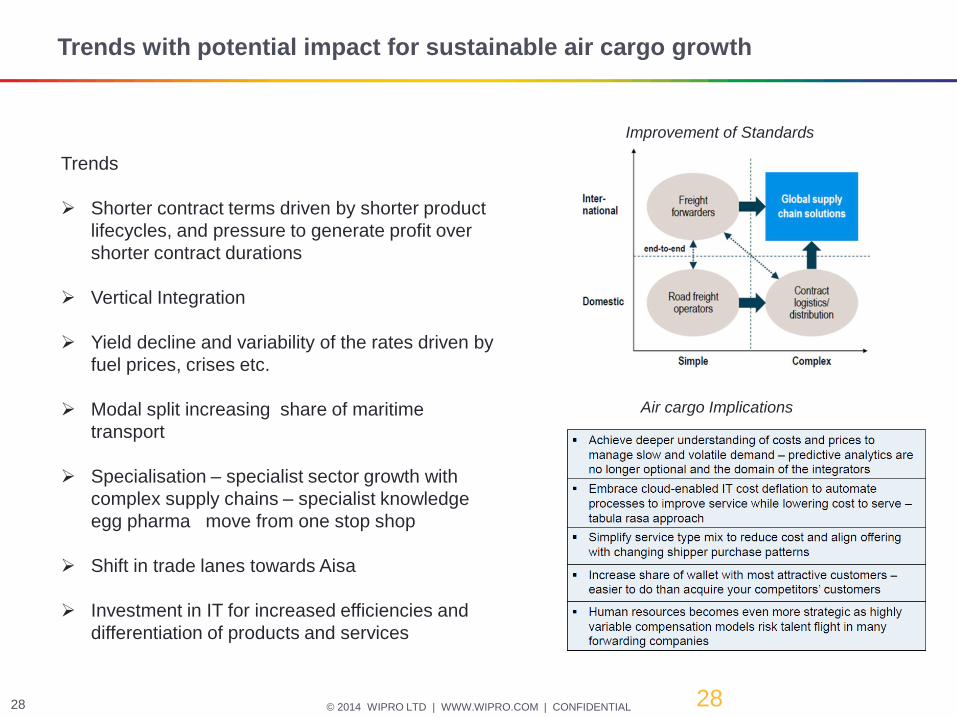
Trends with potential impact for sustainable air cargo growth
28
Trends
Shorter contract terms driven by shorter product
lifecycles, and pressure to generate profit over
shorter contract durations
Vertical Integration
Yield decline and variability of the rates driven by
fuel prices, crises etc.
Modal split increasing share of maritime
transport
Specialisation – specialist sector growth with
complex supply chains – specialist knowledge
egg pharma move from one stop shop
Shift in trade lanes towards Aisa
Investment in IT for increased efficiencies and
differentiation of products and services
Air cargo Implications
Improvement of Standards

© 2014 WIPRO LTD | WWW.WIPRO.COM | CONFIDENTIAL 29
Improvement of policies, infrastructure and education is critical for
improved sustainability of air cargo logistics
29
1. Transport policies
Ineffective policies could lead to supply chain
fragmentation, reduced quality of service by
imposing barriers to entry, national monopolies (e.g.
postal service) and a lack of competition in the
provision of key infrastructure services. Policies
could improve supply chain efficiencies.
2 Transport infrastructure
Development of logistics clusters enabling
concentration of logistics service providers and
business logistics functions of shippers. Such
clusters are supported by infrastructure
investments in ports, airports, rail and multimodal
highway and port connections
. 3 Research, education and awareness
Development of IT solutions for tracing and tracking
functions allowing visibility of the supply chain to
simplified border management and regulatory
processes,
Other measures
Enhanced logistics connectivity
Investment to resolve shortage of skilled
labour
Optimisation of the use infrastructure,
through IT and standard processes
Supply chain optimisation (empty trucks,
waiting times)
Removal regulatory bottlenecks,
Intermodal transport solutions and
optimum use of all transport modes and
capacities at all places and at all times.
Increased use of realistic PPP projects

© 2014 WIPRO LTD | WWW.WIPRO.COM | CONFIDENTIAL 30
Thank you
Dr Emre Serpen
Head of Global Airport Practice