Embed Size (px)
Citation preview
Georgia State University Georgia State University
ScholarWorks @ Georgia State University ScholarWorks @ Georgia State University
USI Publications Urban Studies Institute
2017
Sustainable for Whom? Green Urban Development, Environmental Sustainable for Whom? Green Urban Development, Environmental
Gentrification, and the Atlanta Beltline Gentrification, and the Atlanta Beltline
Daniel Immergluck Georgia State University, [email protected]
Tharunaya Balan
Follow this and additional works at: https://scholarworks.gsu.edu/urban_studies_institute
Part of the Urban Studies and Planning Commons
Recommended Citation Recommended Citation Immergluck, Daniel and Balan, Tharunaya, "Sustainable for Whom? Green Urban Development, Environmental Gentrification, and the Atlanta Beltline" (2017). USI Publications. 14. https://scholarworks.gsu.edu/urban_studies_institute/14
This Article is brought to you for free and open access by the Urban Studies Institute at ScholarWorks @ Georgia State University. It has been accepted for inclusion in USI Publications by an authorized administrator of ScholarWorks @ Georgia State University. For more information, please contact [email protected].
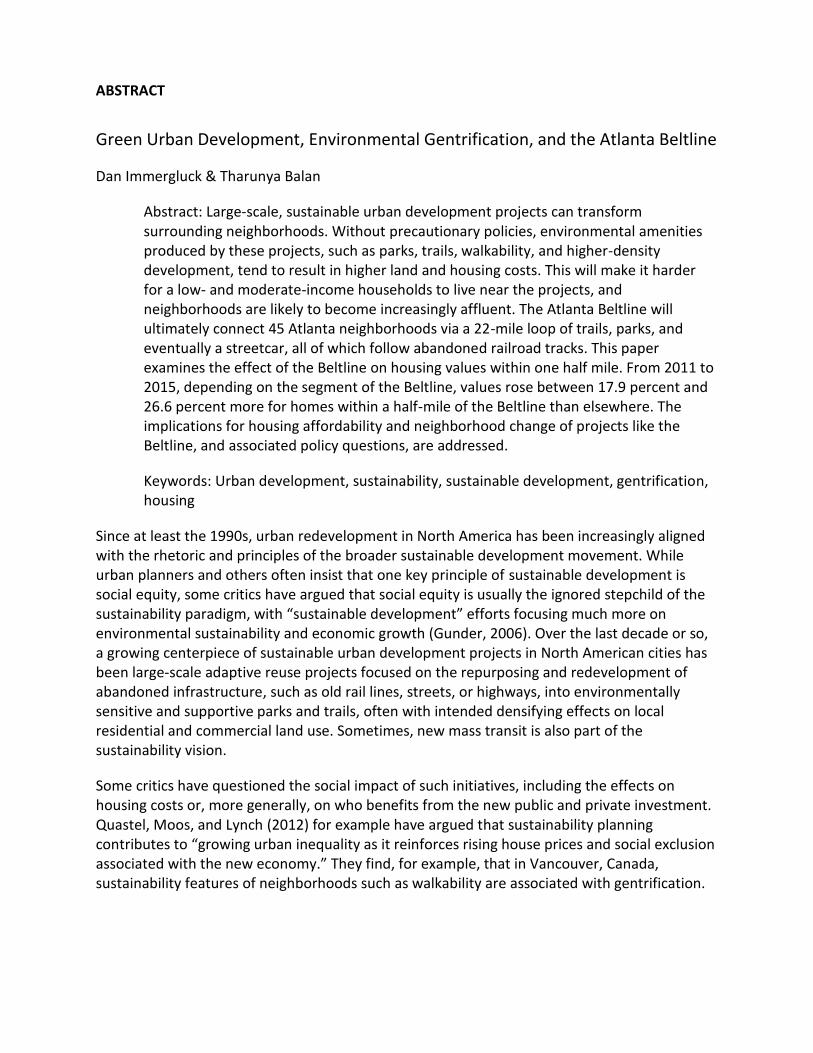
ABSTRACT
Green Urban Development, Environmental Gentrification, and the Atlanta Beltline
Dan Immergluck & Tharunya Balan
Abstract: Large-scale, sustainable urban development projects can transform surrounding neighborhoods. Without precautionary policies, environmental amenities produced by these projects, such as parks, trails, walkability, and higher-density development, tend to result in higher land and housing costs. This will make it harder for a low- and moderate-income households to live near the projects, and neighborhoods are likely to become increasingly affluent. The Atlanta Beltline will ultimately connect 45 Atlanta neighborhoods via a 22-mile loop of trails, parks, and eventually a streetcar, all of which follow abandoned railroad tracks. This paper examines the effect of the Beltline on housing values within one half mile. From 2011 to 2015, depending on the segment of the Beltline, values rose between 17.9 percent and 26.6 percent more for homes within a half-mile of the Beltline than elsewhere. The implications for housing affordability and neighborhood change of projects like the Beltline, and associated policy questions, are addressed.
Keywords: Urban development, sustainability, sustainable development, gentrification, housing
Since at least the 1990s, urban redevelopment in North America has been increasingly aligned with the rhetoric and principles of the broader sustainable development movement. While urban planners and others often insist that one key principle of sustainable development is social equity, some critics have argued that social equity is usually the ignored stepchild of the sustainability paradigm, with “sustainable development” efforts focusing much more on environmental sustainability and economic growth (Gunder, 2006). Over the last decade or so, a growing centerpiece of sustainable urban development projects in North American cities has been large-scale adaptive reuse projects focused on the repurposing and redevelopment of abandoned infrastructure, such as old rail lines, streets, or highways, into environmentally sensitive and supportive parks and trails, often with intended densifying effects on local residential and commercial land use. Sometimes, new mass transit is also part of the sustainability vision.
Some critics have questioned the social impact of such initiatives, including the effects on housing costs or, more generally, on who benefits from the new public and private investment. Quastel, Moos, and Lynch (2012) for example have argued that sustainability planning contributes to “growing urban inequality as it reinforces rising house prices and social exclusion associated with the new economy.” They find, for example, that in Vancouver, Canada, sustainability features of neighborhoods such as walkability are associated with gentrification.

In this paper, the effects of one of the largest sustainable redevelopment projects in recent decades, the Atlanta Beltline, are quantified in terms of housing prices in and near the redevelopment area, with an eye towards impacts on housing affordability and gentrification.
The Atlanta Beltline is a large-scale sustainable urban redevelopment project that will ultimately connect 45 intown Atlanta neighborhoods via a 22-mile loop of trails, parks, and eventually a planned streetcar, all of which will follow abandoned railroad tracks that encircle Atlanta. (See Figure 1.) According to Atlanta Beltline, Inc.(ABI), the quasigovernmental agency that is building and administering the Beltline, as of 2016 the project consists of “four open trails; two trails under construction; seven parks; intensive planning for modern streetcar expansion; more than $3 billion in private economic redevelopment; hundreds of affordable workforce homes; free fitness classes; a linear arboretum; and urban farm; and the largest temporary public art exhibition in the south” (Atlanta Beltline Inc.).
Figure 1. The Atlanta beltline.

At the heart of the Beltline, as its principal funding mechanism, lies a tax increment financing district, called a tax allocation district (TAD) in Georgia, that redirects increases in property tax revenues (referred to as the “increment”) that arise after the establishment of the TAD towards project-related expenses rather than to the regular general revenue budgets of the city, the county, and the school district. These funds can be used as they accrue for ongoing development activities in the TAD, or they can be used to pay off bonds that are used to front-fund major capital investments – including the construction of parks, trails, real estate developments, and other projects in the TAD. The duration of the TAD in this case is 25 years, which spans from 2005 when it was adopted to 2030 when the project is expected to be fully built out.
A leading advocate of “walkable urbanism,” Christopher Leinberger, has called the Beltline “the most important rail-transit project that’s been proposed in the country, possibly in the world,” (Fausset, 2016). It represents a growing trend of large-scale, adaptive reuse projects aimed at utilizing derelict urban infrastructure as a tool to revitalize public and surrounding private spaces in a fundamentally transformative way. The project, which broke ground in the middle of 2011, and continues to be built out, has had a transformative impact on the city. Real estate agents push neighborhoods and properties that are close to the Beltline (Pendergast, 2017). Some real estate brokers specialize in these neighborhoods, renaming their firms such things as the “the Beltline Team,” or “the B-line Broker” (e.g., Beltline Team, 2017)
Within a few years after ground-breaking, the Beltline had become the focal point of real estate conversations in the city. In the summer of 2015, the Beltline frenzy culminated in a large, glossy special edition of “Intown Atlanta,” a magazine occasionally published by the major daily, the Atlanta Journal-Constitution (Atlanta Journal-Constitution, 2015). The entire issue focused on the Beltline. One major article was titled, “The draw of the Beltline: The Atlanta Beltline has an allure for homebuyers, but getting in isn’t always easy” (Green, 2015). The Atlanta multiple listing service, which real estate agents and others use for searching for homes even added a search feature allowing users to select properties “near the Beltline.” By the end of 2016, ABI had identified the following development outcomes as associated with the Beltline: over 15,000 housing units (fewer than 1,000 of these were considered “affordable” by ABI, itself), over $3 billion in total development either constructed or underway, and 2 million square feet of new commercial space (Atlanta Beltline Inc. (2016).
This paper examines the effect of the Atlanta Beltline on housing values within one-half mile of the Beltline TAD during the 2011 to 2015 period, which spans the major buildout of the initial phases of the project. The results show that proximity to the Beltline has a major effect on home prices, especially after 2012, when broader national and regional housing markets began recovering. Depending on which portion of the Beltline a property is near, from 2011 to 2015, values rose between 17.9 percent and 26.6 percent more for homes within a half-mile of the Beltline than for properties located elsewhere in the city. These findings control for a wide variety of physical and locational characteristics, including age and size of house, school attendance zone, distance to major job centers, proximity to transit stations, etc. This paper

addresses implications for housing affordability and neighborhood change of projects like the Beltline, and associated policy questions.
Sustainable development, adaptive reuse of infrastructure, and environmental gentrification
The sustainable urban development paradigm has persisted and evolved in North American urban planning and governance since at least the late 1990s (Campbell, 1996; Gunder, 2006; Wheeler, 2000). Its proponents claim that sustainable urban development furthers not just environmental sustainability but also “social sustainability,” generally read as social equity. Some, however, have continually questioned the notion of sustainable or sustainable urban development in the North American urban context as window dressing for traditional growth-machine-backed urban public-private redevelopment projects that seek, as a key end, an increase in economic activity and property values – a revalorization of “underutilized” urban space that brings both wealth and fiscal health to central urban places (Dale & Newman, 2009; Gunder, 2006; Luke, 2005). Gunder (2006) argues that the mantra of sustainable urban development “obscures and subsumes the dominant economic objectives under the overtly stated imperative to sustain the environment, against which few would wish to argue.” He also maintains that the discourse of sustainable development has been “deployed selectively by planners or politicians as a materialization of dominant institutional ideologies supportive of growth and capital accumulation that maintains the status quo of class inequalities” (Gunder, 2006). Checker (2011) has argued that scholars of sustainability have too often “shied away from examining how that movement’s agenda might be inadvertently co-opted to facilitate gentrification.”
More specifically, critical voices have been raised about “green,” or environmentally oriented, place-based redevelopment projects in central cities aimed at increasing park space and green infrastructure. While not dismissive of the potential health or social benefits of providing additional greenspace, trails, or parks in urban environments, some critics have wondered about the social consequences of such approaches if such amenities drive up real estate values and draw in those with greater means (Wolch, Byrne, & Newell, 2014). Quastel (2009) describes an “eco-gentrification” where there is an “environmental concern directed to be consistent with increasingly competitive neoliberal real estate markets.” Meanwhile, Dooling (2009) brands a similar phenomenon “ecological gentrification,” while Checker (2011) talks about state-sponsored sustainable urban development in North American cities as “environmental gentrification.” Dale and Newman (2009) argue that the “greening of neighborhoods can increase desirability and thus spur gentrification.”
Pearsall (2012) examines instances of environmental gentrification in New York City in the case of efforts to redevelop former industrial urban waterfronts for residential and retail use. Quastel (2009) employs a case study of Vancouver, British Columbia to illustrate how agents of gentrification use the language of sustainability and urban greening to create a more palatable vehicle for their development. Gibbs and Krueger (2007) have pointed out how U.S. cities with the sorts of “new economies” – or knowledge economies – that have tended to exhibit strong gentrification pressures have also been among those that have adopted some of the highest-
profile sustainability programs. They argue that sustainable urban development may be a key component of capitalist accumulation efforts.
Whatever the precise label, one form of environmental gentrification that has grown more popular and operates on a scale sufficient to have a major effect on the future of North American cities is the adaptive reuse and conversion of large-scale, underutilized or fallow infrastructure – be it rail lines, bridges, riverfronts, or roads – into large-scale parks or trail systems (Bliss, 2017; Hagerman; Kear, 2007; Shevory, 2011). Some of these are known as “rails-to-parks” initiatives, in part spurred by the well-known High Line in New York City, but this phenomenon often involves much more than simple park or trail development. It also entails the encouragement of real estate development – both residential and retail – near the parks and trails to increase “active living” and “walkable,” dense, urban neighborhoods surrounding the new green infrastructure. The new amenities – both public and private – are likely to draw higher-income households, and higher housing prices, with the potential to displace and/or exclude lower-income families from the surrounding neighborhoods over time.
Some scholars have taken a critical look at the High Line, in particular. Loughren’s (2014) detailed case study of the High Line portrays it as the epitome of “spatial privilege,” the claim on public space by “intersecting hierarchies of gender, race, class, sexuality, and national origin” that “reproduces social advantages … that open up multiple arenas for the expansion of other forms of capital.” Loughren describes the spatial spillover impact of the High Line on nearby high-end residential buildings and other luxuriating effects.
Reichl (2016) provides quantitative evidence of the gentrifying effects of a major adaptive reuse sustainable development project. He demonstrates that the High Line is a public space dominated by Whites to a level that is greater than Whites’ share of population in the city, the borough, or the surrounding neighborhood.
The High Line is only the best-known of the new large-scale sustainable, adaptive reuse projects. Other such projects, some of which involve repurposing infrastructure other than rail lines, include the 606 Trail in Chicago, the Midtown Greenway in Minneapolis, the 11th Street Bridge Park in Washington, DC, and Dallas’ Highway Cap Park. In fact, the group, Friends of the High Line, have begun convening leaders from 17 adaptive reuse projects from cities across North America, and one issue that they have begun discussing recently is housing affordability (Bliss, 2017).
Little scholarly attention has, as of this writing, focused on the Beltline, although a good deal of architectural and urban design trade press has followed the project (e.g., Mortice, 2016). Immergluck (2009) examined property value trajectories in and around the Beltline during the period when planning and advocacy around the project had started, but before any actual ground-breaking had begun. He found large impacts on home values (and therefore eventually on property taxes and rents) in the years running up to the adoption of the Beltline TAD in late 2005. These increases corresponded closely to the amount of news coverage of the proposal in the local daily newspaper. Suiter (2016) narrates the story of the Beltline and describes how in 2013, the mayor of Atlanta and its chief of police introduced a “Path Force Unit” aimed at
policing the Beltline, including for “quality of life” crimes. In the first month of the patrol, the unit cited or arrested 60 people (Suiter, 2016).
The beltline and affordable housing policy
Planners and affordable housing advocates did not ignore the issue of housing affordability when creating the Beltline. As a part of the enabling ordinance that established the Beltline TAD, the Atlanta City Council required that 15 percent of all Beltline TAD bond proceeds be directed to a Beltline Affordable Housing Trust Fund and that these funds be dedicated to fund affordable housing development or financing within the TAD (Atlanta Beltline Inc., 2017b). This modest amount, itself, may have signaled some weakness in the overall commitment of the effort towards housing affordability.1 It is important to note that the City of Atlanta has no rent control or strong measures to maintain rents or property taxes at affordable levels for lower-income residents. In fact, rent control is specifically prohibited under state law in Georgia.
Together with the Trust Fund, a Beltline Affordable Housing Advisory Board was established to advise ABI on the use of monies in the Trust Fund. Affordability was defined as rents not exceeding 30 percent of the tenant’s or buyer’s income and incomes of no more than 60 percent of the metropolitan median income for rental properties and 100 to 115 percent of the metropolitan median for owner-occupied properties. Unfortunately, due to the declining real estate values beginning in 2007, the ability to raise money through the bond market evaporated rather quickly, and with it the 15 percent of those proceeds that were slated to go towards affordable housing. Meanwhile, the initial activity of the Beltline in terms of trail and park development, which began on the east/northeast side of the Beltline was enough to spur the interest of real estate investors and speculators in development around not just that area but around all parts of the Beltline as the success and popularity of the eastern segment of the Beltline grew.
While the Trust Fund – limited as it was by the real estate crash – was intended to provide new affordable housing units as development on the Beltline progressed, there were no provisions developed to help keep housing costs affordable for occupants of existing housing units. No initiatives were planned for limiting the impact of potential property tax increases on lower-income homeowners, and none were planned for limiting possible rent increases for renters along the Beltline. Later, well after the Beltline was established, ABI established a homeowner loan program for existing residents who wanted to fix up their homes, as well as folks buying homes near the Beltline.
It is important to note that programs funded with TAD funds were restricted to uses within the TAD itself, and not to the many neighborhoods surrounding the TAD, which, as described below, were heavily impacted by the Beltline. Moreover, the proceeds from TAD bonds were the sole funding source identified to fund affordable housing. This is despite the fact that the project was a “public-private partnership,” and another entity, the Atlanta Beltline Partnership, was established early and successfully fundraised for the overall Beltline project from philanthropic and corporate sources.
Unfortunately for the Beltline and its planners, the TAD was adopted close to the peak of the property market, in late 2005, not too long before property values began declining in 2007. In the first few years of the TAD, there was a positive increment because assessed values in the city lag trends in actual values by several years. The aggregate assessed values in the TAD actually increased from 2006 to 2008 before declining and then stagnating in later years (Plan Consultants, Group, Ventures, & Economics, 2015). So there was some early increment to support the TAD initially. But by 2007 it became evident that property values were dropping and issuing bonds was not feasible.
Funding from the TAD was also slowed by two major events. The first was a legal challenge questioning the ability to include school taxes as part of a TAD increment, which was finally resolved via an amendment to the state constitution that allowed school funds to be included as a part of TAD funds (Wheatley, 2013). The second was a dispute between the Atlanta Public Schools, on the one hand, and ABI and the City of Atlanta, on the other, over an initial 2005 agreement to make fixed payments to the schools as compensation for any lost revenues due to the TAD (Bloom, 2016). ABI had agreed to provide a series of payments in lieu of taxes to the schools amounting to $162 million over the life of the TAD in exchange for the school system forgoing its share of the increment over this period. When the increment failed to materialize as projected, however, ABI reneged on its agreement. After years of back-and-forth, the school system ultimately conceded to accepting less than half of the agreed-upon sum of payments.
From 2006 through 2014, the Beltline, through the Beltline Affordable Housing Trust Fund, directly subsidized only 256 units in the Beltline TAD. ABI claimed another 729 subsidized affordable units that were financed by the City of Atlanta’s development authority, Invest Atlanta (Plan Consultants et al., 2015). Some of these latter units were located in the larger “Beltline Planning Area,” which includes areas within one-half mile of the Beltline trail path. So, optimistically, ABI produced fewer than 1,000 affordable housing units (with some of these units affordable only to households with incomes as high as 115 percent of the metropolitan median income). Given a goal of 5,600 units to be developed within the TAD itself over 25 years, a prorated goal for 2014 would be 36 percent of the 5,600 units, or 2,016 units. So even when counting units produced by Invest Atlanta (and not just ABI) outside of the TAD itself, the Beltline was on track to produce less than half of its goal of affordable units. Moreover, the 25-year goal of 5,600 affordable housing units was not a particularly large one, especially when compared to the losses in low-cost rental housing that have occurred in the city of Atlanta in recent years. Immergluck, Carpenter, and Lueders (2016) show that the number of “low-cost” rental units (those with gross rents under $750 per month) in the city declined by more than 5,300 units from 2010 to 2014.
The growing acuteness and awareness of the affordable problem in the city, together with a growing recognition that ABI had not been producing much affordable housing, mounted as the housing market began recovering after 2011. While the city lost thousands of low-cost rental units, the construction of new, luxury apartment buildings mushroomed, both near the Beltline and in other desirable parts of the city, with estimates of luxury units constructed in the city from 2012 to 2014 exceeding 20,000 (Immergluck et al., 2016). Pressure mounted on the

Beltline to increase its affordable housing activity, with calls for more production coming from housing advocates and others. Then, in September 2016, two key members resigned from the board of the Beltline Partnership, the fundraising and booster affiliate of ABI (Mortice, 2016). One of the resigning board members was Nathaniel Smith, the director of the nonprofit Partnership for Southern Equity and a former staff member of a citywide affordable housing group, the Atlanta Neighborhood Development Partnership. Smith had become viewed as a leading voice for social justice in the city and region. The other member of the Beltline Partnership board who resigned was Ryan Gravel, the urban designer known as the father of the Beltline who led the advocacy campaign to get the City to initiate the project and create the TAD. The fact that the person perceived as conceiving of the Beltline, its original architect, was resigning from the Partnership board over the issue of housing affordability was a powerful statement. Shortly after these resignations and the media coverage that followed them, ABI announced increased funding goals for affordable housing (ABI, 2017c).
Examining beltline-induced changes in housing prices
Urban scholars have increasingly turned a critical eye on large-scale environmental gentrification projects, including the High Line. Some of this literature has sought to identify such projects as instrumental causes of gentrification. The analysis that follows does this by showing that property values near it increased at much greater rates than other properties in Atlanta farther from the Beltline from 2011 – the bottom of the post-crisis housing market – to 2015.
The first phase of construction of the Beltline – the Eastside Trail – began in October of 2010, but was not complete until the latter part of 2011 (Pendergast, 2017). Moreover, the luxury housing construction boom in the city, much of it if concentrated around the Beltline, did not begin until 2012. However, the construction of the early phases of the Beltline confirmed that the project was gaining momentum and moving forward, spurring speculation and higher home prices in property in other parts of the Beltline.
To estimate the effects of the Beltline on home values systematically, a hedonic model of home values is used to isolate the impacts of proximity (being within one-half mile) to the Beltline on the prices of single-family homes. This model is specified as follows:
(1)
where P is the sale price of a home and H is a vector of housing unit characteristics, including size, lot size, number of bathrooms, exterior construction, etc.; N is a set of neighborhood (census tract) characteristics (race, ethnicity, income, owner-occupancy rate, etc.) calculated from the American Community Survey and also crime rates; L is a set of locational characteristics including distance from three key job centers, whether the property is within one-quarter mile of a transit stop, and the school attendance zone in which the property lies; Q is a set of dummies to indicator seasonality (quarters); and T is a set of dummies to indicate year of sale. Also included is a set of dummies, B, which indicate whether a property is located within one-half mile of each of four Beltline segments (northeast, northwest, southeast, or

southwest).2 An alternative specification, which included an additional buffer (and time-interaction variables) from one-half-mile to one-mile was also estimated, but is not shown here. The results did not indicate significant price effects in the more distant buffer.
Finally, these dummies are interacted with the year-of-sale dummy (T) to identify the trajectories of home prices over time in each of the half-mile buffers surrounding the four Beltline segments.
Data
Data on sales that occurred in the City of Atlanta (excluding a very small portion of the City located in DeKalb County) from 2011 through 2015 were obtained from the Fulton County Tax Assessor’s office. Data on building attributes (age, number of bathrooms, exterior construction type, etc.) were also obtained from the County. The data was cleaned to address minor issues of duplicate records.
Data on neighborhood conditions were obtained primarily from the 2010 five-year estimates American Community Survey at the level of the census tract. Some neighborhood data were obtained from Neighborhood Nexus, a web-based data warehouse of neighborhood statistics administered by the Atlanta Regional Commission. Variables include poverty rate, race and ethnicity, median family income, owner-occupancy rate, violent and nonviolent crime rates, and the percent of properties in poor or worse condition. The high school attendance area for each sale was also identified. Finally, various proximity variables were created, including distance from the property to downtown Atlanta, distance to the airport, and distance to Perimeter Mall. These are three well-known job centers in or near the City. A dummy variable indicating that a property was located within one quarter of a mile from a transit station was also calculated. Finally, time variables to indicate the quarter and the year of the sale were created.
Change in median sale prices by proximity to the beltline
Because different portions of the Beltline are being built out at different times, and because the effects of the Beltline might be stronger in some parts of the city than others, it is important not to treat the Beltline as a monolithic geography, but to partition it into sections. For computational reasons, we limit the sections to four segments, each divided by major expressways, as shown in Figure 2. The Northeast Segment runs north-northeast of I-75 and east of the connector down to I-20. The Southeast Segment is south of I-20 and east of I-75/I-85. The Southwest Segment is west of I-75/I-85 and south of I-20. The Northwest Segment is north of I-20 and west if I-75.
Figure 2. Segments of the Atlanta beltline tax allocation district.
Large letters indicate Atlanta’s “neighborhood planning units”

Figure 3 shows the cumulative changes in median sale price from 2011 to 2015 for sales within one-half mile of each of the four Beltline segments. Also shown (gray line) is the cumulative change in median sale price for all homes in the City farther than a half mile from the Beltline. The figure shows that over the 2011-2015 period, the median sale price increased near each of the four segments of the Beltline at a substantially faster pace than did those of properties not near the Beltline. The increase in median sale price was the highest near the Southwest Segment, with a cumulative increase over the four years of 68 percent. The other three segments saw median prices rise by 40 to 51 percent. Meanwhile, the median sales price of homes more than a half-mile from the Beltline increased at a substantially lower rate, just 17.7 percent over the four-year period. Again, these are simple changes in median sales prices, and do not control for differences in the types, ages, or other locational differences of the homes sold in 2015 versus those sold in 2011.

Figure 3. Cumulative change in median sale price since 2011; 2012 to 2015.
Hedonic modeling results
Because the properties sold in 2011 and those sold in later years may have significantly different structural and locational characteristics, it is important to use a multivariate approach to control for the physical, temporal, and locational attributes of the property being sold to identify any effects of proximity to a Beltline segment on housing values. (There was an insufficient number of properties that sold two or more times during the study period to attempt a repeat-sales model estimation.) The extensive data set that we assembled allows us to do this.
The full regression results for the hedonic analysis are presented in the Table 1. The model achieved a very good fit, with an R-square of 0.834. Because many of the independent variables are neighborhood-level variables, standard errors were clustered at the level of the census tract to provide for robust inferential results.
Table 1. Results of home price model.
The coefficient estimates and their statistical significances are largely consistent with expectations. Most of the housing characteristics, neighborhood attributes, and locational variables are statistically significant with the expected signs. While the coefficients for the stand-alone Beltline segment dummy variables are not statistically significant, many of the interactions of these variables with the year dummies are significant, indicating that the 2011-to-2015 trajectories of home values near the Beltline were significantly different from those farther from the Beltline.

The focus here is on the results of interacting the year variables with the variables indicating that the home is within one-half mile of a Beltline segment. These results indicate how much cumulative appreciation over time is due to a home being within a half of a mile of a particular Beltline segment compared to being more than a half-mile from any of the four segments.
Figure 4 illustrates the higher cumulative appreciation rates for properties within one-half mile of the four Beltline segments, compared to being more than one-half-mile from any of the segments, controlling for a wide variety of structural and locational characteristics of the homes. The vertical double arrows indicate the differences that are statistically significant at p = 0.10 or below.
Figure 4. The effect of being within a half-mile of a beltline segment on cumulative home value appreciation, 2011 to 2015*.
*Note: Vertical arrows indicate statistically significant differences in cumulative appreciation
By 2015, a home within a half-mile of the Northwest Segment is expected to have appreciated 21.5 (53.7 percent – 32.2 percent) percentage points more than an otherwise similar home not near the Beltline. The corresponding premium in appreciation for homes near the Northeast Segment is 17.9 percent, 19.2 percent near the Southeast Segment, and 26.6 percent near the Southwest Segment. These are substantial differentials in cumulative appreciation rates due solely to the homes’ locations near the different Beltline segments.
Impacts of rising home values on property tax burdens
Rising home values can bring benefits to some homeowners near the Beltline. If homeowners are interested in moving, they can sell their homes and realize sizeable capital gains. Rising values can also increase the overall tax base of the City. At the same time, many affected homeowners, including some with limited incomes, may prefer to remain in their homes and in

their neighborhoods. Likewise, many renters may prefer to stay in their homes, but will likely see rents increase as gentrification pressures rise and as building owners are forced to pass on their rising tax bills to their tenants.
Low-income homeowners are expected to experience a greater shock in their housing costs than are higher-income homeowners due to the structure of property taxes for owner-occupied homes in Atlanta, which are eligible for homestead exemptions. The typical homeowner receives a $30,000 homestead exemption. This means that the millage rate is not applied to the first $30,000 of assessed valuation. If a homeowner owns a home worth $100,000, for example, the assessed valuation is 40 percent of the value, or $40,000. However, the taxable value is then further reduced by the $30,000 exemption, resulting in only $10,000 of taxable value. Table 2 shows what is likely to happen to a homeowners’ tax bill when the value of her home increases from $100,000 to $150,000, or 50 percent. In this example, while the home has appreciated only 50 percent over the four-year period, property taxes would have tripled. The percent increase for properties that begin the period at higher prices will be somewhat lower. The shock of the property tax increase will fall heaviest on those with lower-valued homes.
Table 2. Expected impact of $100,000 home appreciating by 50 percent on property tax.
While the magnifying effect of homestead exemptions affect owner-occupied properties, large increases in property values will be passed onto to renters, making housing costs rise for many lower-income renters. Most lower-income residents near the Beltline are likely to be renters, and rising housing costs will have a large impact on the housing cost-burden (the percentage of income that goes toward housing costs) of lower-income renters. Moreover, renters are less likely to have access to savings or credit that can help them absorb a sudden increase in rent, so are more likely to be displaced by rising housing costs.
Conclusion
The Atlanta Beltline is likely to be judged successful as a tool to increase the City’s overall property tax base and to help bring more people into the City to recreate. At the same time, its net consequences for housing and economic opportunity among lower-income Atlantans who live near the project are concerning. Just as concentrated affluence in exclusionary suburbs and economic segregation have been detrimental to the economic prospects of lower-income families, rapid gentrification and a scenario in which exclusionary areas are simply shifted from one part of the metropolitan area to another is unlikely to improve these prospects. Moreover, the Beltline represents a massive investment by the City of Atlanta and, arguably, should be beneficial and available to all sorts of Atlantans. As the remainder of the project is built out, stronger efforts are needed to provide for housing options that are accessible to lower-income households and to help existing residents remain in these neighborhoods if they want to.
More generally, large-scale adaptive reuse projects that repurpose fallow or abandoned infrastructure are often on a scale at which they can transform their surrounding neighborhoods. In many cases, these projects are located in or near lower-income areas. The

environmental amenities that are produced by these projects, such as parks, trails, improved walkability, and higher-density development will tend to result in higher land values and, without ample precautionary policies in place, substantially higher housing costs. Besides the effects on the property taxes and rents paid by existing residents, these amenities will make it harder for a diverse mix of renters or homeowners to move into communities near the projects, so that the key driver of neighborhood change – in-movers – will become increasingly affluent and less diverse, resulting in the environmental gentrification of the surrounding areas.
Communities considering large-scale adaptive reuse projects that generate environmental amenities should begin by recognizing that the benefits of these projects to surrounding neighborhoods are rapidly capitalized into housing values, and thus will spur higher housing costs very quickly. Planners who seek to avoid large-scale gentrification, or at least seek to further “development without displacement” and to maintain some minimum level of economic diversity in the nearby areas, must recognize that addressing housing affordability should be an early-stage, central component of planning for such projects. It is not enough to plan for trickle-down affordable housing development down the road after the project gets up a head of steam. By then, land values will have increased substantially, making the preservation and creation of affordable housing very expensive, and possibly cost-prohibitive. Rather, planners should adapt a mantra of “affordability first” when planning such large-scale interventions. This means doing at least two things. First, policies that will buffer the impact of rising land values on existing, lower-income residents – both homeowners and renters – must be put in place. These may include income-based property-tax “circuit breakers,” which limit the growth in property taxes owned by lower-income homeowners. Alternative, localities may employ property tax deferment programs, which effectively loan low-income homeowners funds to pay large increases in their property taxes, with the balance accruing as a lien against the home which is payable upon sale of the property.
On the rental side, owners of rental property can be offered low-cost financing or property tax reductions in exchange for committing to long-term affordable rents for lower-income tenants. Second, mandatory inclusionary housing policies should be in place that require developers to set aside a significant percentage of new housing units at affordable rents for lower-income tenants. Without such measures, large-scale sustainable urban development projects like the Beltline are likely to spur exclusionary housing patterns near the projects, resulting in providing the new, typically subsidized new amenities to economically advantaged households while lower-income households will find themselves in less attractive neighborhoods.
Disclosure statement
No potential conflict of interest was reported by the authors.
Notes

1. It is important to note that the City of Atlanta has no rent control or strong measures to maintain rents or property taxes at affordable levels for lower-income residents. In fact, rent control is specifically prohibited under state law in Georgia.
2. An alternative specification, which included an additional buffer (and time-interaction variables) from one-half-mile to one-mile was also estimated, but is not shown here. The results did not indicate significant price effects in the more distant buffer.
References
1. Atlanta Beltline Inc. (2016, December 6). The Atlanta Beltline quarterly briefing. Retrieved from http://beltline.org/wp-content/uploads/2016/11/12-06-2016-Quarterly-Briefing-Combined-Presentations-1.pdf
2. Atlanta Beltline Inc. (2017a). Atlanta Beltline overview. Retrieved from http://beltline.org/about/the-atlanta-beltline-project/atlanta-beltline-overview/
3. Atlanta Beltline Inc. (2017b). Affordable housing. Retrieved from http://beltline.org/progress/affordable-housing/#policies-programs
4. Atlanta Beltline Inc. (2017c). Atlanta Beltline closes $155 million 2016 bond issue to advance affordable housing, capital construction, and economic development. Retrieved from http://beltline.org/2017/01/22/atlanta-beltline-closes-155-million-2016-bond-issue-to-advance-affordable-housing-capital-construction-and-economic-development/
5. Atlanta Journal Constitution. (2015, August 30). Living Intown: The Atlanta Beltline. Retrieved from http://specials.myajc.com/living-intown-atlanta-beltline/
6. Beltline Team. (2017). The Beltline Team of Area West Realty. Retrieved from http://www.thebeltlineteam.com/the-45-neighborhoods.asp
7. Bliss, Laura (2017, February 7). The High Line’s next balancing act. Citylab. Retrieved from http://www.citylab.com/cityfixer/2017/02/the-high-lines-next-balancing-act-fair-and-affordable-development/515391/
8. Bloom, Molly. (2016, January 29). After years of conflict, Mayor Kasim Reed and APS reach Beltline deal. Atlanta Journal-Constitution. Retrieved from http://www.myajc.com/news/local-govt–politics/after-years-conflict-mayor-kasim-reed-and-aps-reach-beltline-deal/Wm6CxnlSwUmsVu78pcNsaK/
9. Campbell, Scott. (1996). Green cities, growing cities, just cities?: Urban planning and the contradictions of sustainable development. Journal of the American Planning Association, 62(3), 296–312.
10. Checker, Melissa. (2011). Wiped out by the “greenwave”: Environment gentrification and the paradoxical politics of urban sustainability. City and Society, 23(2), 210–229.
11. Dale, Ann, & Newman, Lenore. (2009). Sustainable development for some: Green urban development and affordability. Local Environment, 14(7), 669–681.
12. Dooling, Sarah. (2009). Ecological gentrification: A research agenda exploring justice in the city. International Journal of Urban and Regional Research, 33(3), 621–639.

13. Fausset, Richard (2016, September 11). A glorified sidewalk, and the path to transform Atlanta. New York Times. Retrieved from https://www.nytimes.com/2016/09/12/us/atlanta-beltline.html?_r=0
14. Gibbs, David, & Krueger, Robert. (2007). Containing the contradictions of rapid development? New economic spaces and sustainable urban development. In Robert Krueger & David Gibbs (Eds.), The sustainable development paradox: Urban political economy in the United States and Europe (pp. 95–122). London: Guilford Press.
15. Green, Josh (2015, August 30) The draw of the BeltLine: The Atlanta BeltLine has an allure for homebuyers, but getting in isn’t always easy. Living Intown: The Atlanta Beltline. Retrieved from http://specialprojects.myajc.com/draw-of-the-beltline/
16. Gunder, Michael. (2006). Sustainability: Planning’s saving grade or road to perdition? Journal of Planning Education and Research, 26(2), 208–221.
17. Hagerman, Chris. (2007). Shaping neighborhoods and nature: Urban political ecologies of urban waterfront transformations in Portland, Oregon. Cities, 24(4), 285–297.
18. Immergluck, Dan. (2009). Large redevelopment initiatives, housing values and gentrification: The case of the Atlanta Beltline. Urban Geography, 46(8), 1725–1747.
19. Immergluck, Dan, Carpenter, Ann, & Lueders, Abrams. (2016, May). Declines in rented housing units in eight large southeastern cities. Federal Reserve Bank of Atlanta. Retrieved from https://www.frbatlanta.org/-/media/documents/community-development/publications/discussion-papers/2016/03-housing-declines-in-low-cost-rented-housing-units-in-eight-large-southeastern-cities-2016-05-10.pdf
20. Kear, Mark. (2007). Spaces of transition, spaces of tomorrow: Making a sustainable future in Southeast False Creek, Vancouver. Cities, 24(4), 324–334.
21. Loughren, Kevin. (2014). Parks for profit: The High Line, growth machines, and the uneven development of urban public spaces. City and Community, 13(1), 49–68.
22. Luke, Timothy. (2005). Neither sustainable nor development: Reconsidering sustainability in development. Sustainable Development, 13(4), 228–238.
23. Mortice, Zach (2016, October 10) A Beltline champion walks away. Landscape Architecture. Retrieved from https://landscapearchitecturemagazine.org/2016/10/10/when-to-walk-away/
24. Plan Consultants, Noell Consulting Group, Columbia Ventures, & Mass Economics. (2015, December). Integrated action plan for economic development, housing, and real estate. Atlanta Beltline, Inc. Retrieved from http://beltlineorg.wpengine.netdna-cdn.com/wp-content/uploads/2016/03/IAP-Report-Final.pdf
25. Pearsall, Hamil. (2012). Moving out or moving in? Resilience to environmental gentrification in New York City. Local Environment, 17(9), 1013–1026.
26. Pendergast, Mark. (2017). City on the Verge. New York, NY: Basic Books. 27. Quastel, Noah. (2009). Political ecologies of gentrification. Urban Geography, 30(7), 694–725. 28. Quastel, Noah, Moos, Markus, & Lynch, Nicholas. (2012). Sustainability-as-density and the
return of the social: The case of Vancouver, British Columbia. Urban Geography, 33(7), 1055–1084.
29. Reichl, Alexander. (2016). The high line and the ideal of democratic public space. Urban Geography, 37(6), 904–925.

30. Shevory, Kristina (2011, August 2). Cities see the other side of the tracks. New York Times. Retrieved from http://www.nytimes.com/2011/08/03/realestate/commercial/cities-see-another-side-to-old-tracks.html?_r=2&pagewanted=all&
31. Suiter, Aaron (2016). Second wave rail-to-trail initiatives and ecological gentrification: Lessons from New York City’s High Line and Atlanta’s Beltline. Undergraduate Journal of Humanistic Studies, 2, 1–16. Winter.
32. Wheatley, Thomas (2013, June 3) Supreme Court sides with Beltline, city in constitutional challenge. Creative Loafing. Retrieved from http://www.clatl.com/news/article/13073965/supreme-court-sides-with-beltline-city-in-constitutional-challenge.
33. Wheeler, Stephen. (2000). Planning for metropolitan sustainability. Journal of Planning Education and Research, 20(2), 133–145.
34. Wolch, Jennifer, Byrne, Jason, & Newell, Joshua. (2014). Urban green space, public health, and environmental justice: The challenge of making cities “just green enough”. Landscape and Urban Planning, 125, 234–244.