Embed Size (px)
Citation preview
SUSTAINABLE ENERGY FOR FOOD Massive Open Online Course – Reader
© IDE Nepal

SUSTAINABLE ENERGY FOR FOOD – Massive Open Online Course – Reader
TABLE OF CONTENTS 2
TABLE OF CONTENTS
Abbreviations . . . . . . . . . . . . . . . . . . . . . . . . . . . . . . . . . . . . . . . . . . . . . . . . . . . . . . . . . . . . . . . . . . . . . . . . . . . . . . . . . . . . . . . .5
CHAPTER A
A1 THE ENERGY-AGRICULTURE CHALLENGE . . . . . . . . . . . . . . . . . . . . . . . . . . . . . . . . . . . . . . . . . . . . . . . . . . . . . . . .7A1 .1 The Water-Energy-Food Nexus . . . . . . . . . . . . . . . . . . . . . . . . . . . . . . . . . . . . . . . . . . . . . . . . . . . . . . . . . . . . . . . . .7A1 .2 Population Growth and Food Production . . . . . . . . . . . . . . . . . . . . . . . . . . . . . . . . . . . . . . . . . . . . . . . . . . . . . . . . .8A1 .3 Agricultural Production and Value Chains . . . . . . . . . . . . . . . . . . . . . . . . . . . . . . . . . . . . . . . . . . . . . . . . . . . . . . . .9
A2 CLIMATE CHANGE . . . . . . . . . . . . . . . . . . . . . . . . . . . . . . . . . . . . . . . . . . . . . . . . . . . . . . . . . . . . . . . . . . . . . . . . . .11A2 .1 Climate Change and Primary Agricultural Production . . . . . . . . . . . . . . . . . . . . . . . . . . . . . . . . . . . . . . . . . . . . .11A2 .2 Adaptation to Climate Change . . . . . . . . . . . . . . . . . . . . . . . . . . . . . . . . . . . . . . . . . . . . . . . . . . . . . . . . . . . . . . . .11A2 .3 Climate Neutral Productivity Growth . . . . . . . . . . . . . . . . . . . . . . . . . . . . . . . . . . . . . . . . . . . . . . . . . . . . . . . . . . .12
A3 ENERGY INPUT IN AGRICULTURAL VALUE CHAINS . . . . . . . . . . . . . . . . . . . . . . . . . . . . . . . . . . . . . . . . . . . . . . .13A3 .1 Energy Input in Agricultural Production . . . . . . . . . . . . . . . . . . . . . . . . . . . . . . . . . . . . . . . . . . . . . . . . . . . . . . . . .13A3 .2 Energy Input in the Downstream Sector . . . . . . . . . . . . . . . . . . . . . . . . . . . . . . . . . . . . . . . . . . . . . . . . . . . . . . . .14A3 .3 Financing Alternative Energy Solutions . . . . . . . . . . . . . . . . . . . . . . . . . . . . . . . . . . . . . . . . . . . . . . . . . . . . . . . . .15 Summary & Unit Wrap-Up . . . . . . . . . . . . . . . . . . . . . . . . . . . . . . . . . . . . . . . . . . . . . . . . . . . . . . . . . . . . . . . . . . . .16
CHAPTER B
B1 RENEWABLE ENERGY RESOURCES AND TECHNOLOGY . . . . . . . . . . . . . . . . . . . . . . . . . . . . . . . . . . . . . . . . . . .19B1 .1 Renewable Energy and Agricultural Value Chains . . . . . . . . . . . . . . . . . . . . . . . . . . . . . . . . . . . . . . . . . . . . . . . . .20B1.1.1 Example: Milk Value Chain . . . . . . . . . . . . . . . . . . . . . . . . . . . . . . . . . . . . . . . . . . . . . . . . . . . . . . . . . . . . . . . . . . . . . 21B1.1.2 Renewable Energy Resources . . . . . . . . . . . . . . . . . . . . . . . . . . . . . . . . . . . . . . . . . . . . . . . . . . . . . . . . . . . . . . . . . . 23B1 .2 Introduction to Energy Resources and Technologies . . . . . . . . . . . . . . . . . . . . . . . . . . . . . . . . . . . . . . . . . . . . . .26B1.2.1 Hydropower . . . . . . . . . . . . . . . . . . . . . . . . . . . . . . . . . . . . . . . . . . . . . . . . . . . . . . . . . . . . . . . . . . . . . . . . . . . . . . . . . 27B1.2.2 Wind Energy . . . . . . . . . . . . . . . . . . . . . . . . . . . . . . . . . . . . . . . . . . . . . . . . . . . . . . . . . . . . . . . . . . . . . . . . . . . . . . . . . 28B1.2.3 Bioenergy . . . . . . . . . . . . . . . . . . . . . . . . . . . . . . . . . . . . . . . . . . . . . . . . . . . . . . . . . . . . . . . . . . . . . . . . . . . . . . . . . . . 31B1.2.4 Solar Thermal . . . . . . . . . . . . . . . . . . . . . . . . . . . . . . . . . . . . . . . . . . . . . . . . . . . . . . . . . . . . . . . . . . . . . . . . . . . . . . . 33B1.2.5 Solar Photovoltaics (PV) . . . . . . . . . . . . . . . . . . . . . . . . . . . . . . . . . . . . . . . . . . . . . . . . . . . . . . . . . . . . . . . . . . . . . . 34B1 .3 Solar Energy in Agriculture . . . . . . . . . . . . . . . . . . . . . . . . . . . . . . . . . . . . . . . . . . . . . . . . . . . . . . . . . . . . . . . . . . . .36B1.3.1 Solar Powered Irrigation . . . . . . . . . . . . . . . . . . . . . . . . . . . . . . . . . . . . . . . . . . . . . . . . . . . . . . . . . . . . . . . . . . . . . . . 36B1.3.2 Solar Drying . . . . . . . . . . . . . . . . . . . . . . . . . . . . . . . . . . . . . . . . . . . . . . . . . . . . . . . . . . . . . . . . . . . . . . . . . . . . . . . . . 40B1.3.3 Solar Box Dryer . . . . . . . . . . . . . . . . . . . . . . . . . . . . . . . . . . . . . . . . . . . . . . . . . . . . . . . . . . . . . . . . . . . . . . . . . . . . . . 41B1.3.4 Solar Cabinet Dryer . . . . . . . . . . . . . . . . . . . . . . . . . . . . . . . . . . . . . . . . . . . . . . . . . . . . . . . . . . . . . . . . . . . . . . . . . . . 41B1.3.5 Solar Tunnel Dryer . . . . . . . . . . . . . . . . . . . . . . . . . . . . . . . . . . . . . . . . . . . . . . . . . . . . . . . . . . . . . . . . . . . . . . . . . . . . 42B1.3.6 Solar-Biomass Hybrid Cabinet Dryer . . . . . . . . . . . . . . . . . . . . . . . . . . . . . . . . . . . . . . . . . . . . . . . . . . . . . . . . . . . . . 43 Summary & Unit Wrap-Up . . . . . . . . . . . . . . . . . . . . . . . . . . . . . . . . . . . . . . . . . . . . . . . . . . . . . . . . . . . . . . . . . . . .44

SUSTAINABLE ENERGY FOR FOOD – Massive Open Online Course – Reader
TABLE OF CONTENTS 3
B2 BIOENERGY . . . . . . . . . . . . . . . . . . . . . . . . . . . . . . . . . . . . . . . . . . . . . . . . . . . . . . . . . . . . . . . . . . . . . . . . . . . . . . . .46B2 .1 Bioenergy Resources and Technologies . . . . . . . . . . . . . . . . . . . . . . . . . . . . . . . . . . . . . . . . . . . . . . . . . . . . . . . .46B2.1.1 Bioenergy Resources . . . . . . . . . . . . . . . . . . . . . . . . . . . . . . . . . . . . . . . . . . . . . . . . . . . . . . . . . . . . . . . . . . . . . . . . . 46B2.1.2 Bioenergy Technologies . . . . . . . . . . . . . . . . . . . . . . . . . . . . . . . . . . . . . . . . . . . . . . . . . . . . . . . . . . . . . . . . . . . . . . 48B2.1.3 Thermochemical Processes . . . . . . . . . . . . . . . . . . . . . . . . . . . . . . . . . . . . . . . . . . . . . . . . . . . . . . . . . . . . . . . . . . . 49B2.1.4 Biochemical Processes . . . . . . . . . . . . . . . . . . . . . . . . . . . . . . . . . . . . . . . . . . . . . . . . . . . . . . . . . . . . . . . . . . . . . . . 49B2.1.5 Other Processes . . . . . . . . . . . . . . . . . . . . . . . . . . . . . . . . . . . . . . . . . . . . . . . . . . . . . . . . . . . . . . . . . . . . . . . . . . . . . 50B2 .2 Introduction to Biogas . . . . . . . . . . . . . . . . . . . . . . . . . . . . . . . . . . . . . . . . . . . . . . . . . . . . . . . . . . . . . . . . . . . . . . .50B.2.2.1 Methane . . . . . . . . . . . . . . . . . . . . . . . . . . . . . . . . . . . . . . . . . . . . . . . . . . . . . . . . . . . . . . . . . . . . . . . . . . . . . . . . . . . . 52B2.2.2 Carbon Dioxide . . . . . . . . . . . . . . . . . . . . . . . . . . . . . . . . . . . . . . . . . . . . . . . . . . . . . . . . . . . . . . . . . . . . . . . . . . . . . . 53B2 .3 Use of Biogas Technologies in Agricultural Value Chains . . . . . . . . . . . . . . . . . . . . . . . . . . . . . . . . . . . . . . . . . .54B2.3.1 Anaerobic Digestion Technologies . . . . . . . . . . . . . . . . . . . . . . . . . . . . . . . . . . . . . . . . . . . . . . . . . . . . . . . . . . . . . . 55B2.3.2 Large and Medium Scale Technologies . . . . . . . . . . . . . . . . . . . . . . . . . . . . . . . . . . . . . . . . . . . . . . . . . . . . . . . . . . 56B2.3.3 Small-scale Technologies. . . . . . . . . . . . . . . . . . . . . . . . . . . . . . . . . . . . . . . . . . . . . . . . . . . . . . . . . . . . . . . . . . . . . . 58B2 .4 Biogas Utilization Options . . . . . . . . . . . . . . . . . . . . . . . . . . . . . . . . . . . . . . . . . . . . . . . . . . . . . . . . . . . . . . . . . . . .61B2.4.1 Cogeneration . . . . . . . . . . . . . . . . . . . . . . . . . . . . . . . . . . . . . . . . . . . . . . . . . . . . . . . . . . . . . . . . . . . . . . . . . . . . . . . . 61B2.4.2 Lighting and Cooking with Small Biogas Plants . . . . . . . . . . . . . . . . . . . . . . . . . . . . . . . . . . . . . . . . . . . . . . . . . . . 62B2.4.3 Vehicle Fuel . . . . . . . . . . . . . . . . . . . . . . . . . . . . . . . . . . . . . . . . . . . . . . . . . . . . . . . . . . . . . . . . . . . . . . . . . . . . . . . . . 62 Summary & Unit Wrap-Up . . . . . . . . . . . . . . . . . . . . . . . . . . . . . . . . . . . . . . . . . . . . . . . . . . . . . . . . . . . . . . . . . . . .63
B3 ENERGY EFFICIENCY IN THE ENERGY AGRICULTURE NEXUS . . . . . . . . . . . . . . . . . . . . . . . . . . . . . . . . . . .65B3 .1 Energy Efficiency . . . . . . . . . . . . . . . . . . . . . . . . . . . . . . . . . . . . . . . . . . . . . . . . . . . . . . . . . . . . . . . . . . . . . . . . . . . .65B3.1.1 Efficiency . . . . . . . . . . . . . . . . . . . . . . . . . . . . . . . . . . . . . . . . . . . . . . . . . . . . . . . . . . . . . . . . . . . . . . . . . . . . . . . . . . . 65B3.1.2 Energy Efficiency in the Energy System . . . . . . . . . . . . . . . . . . . . . . . . . . . . . . . . . . . . . . . . . . . . . . . . . . . . . . . . . . 66B3.1.3 Energy Efficiency – Global Dimension and Co-Benefits . . . . . . . . . . . . . . . . . . . . . . . . . . . . . . . . . . . . . . . . . . . . . 69B3 .2 Energy Auditing . . . . . . . . . . . . . . . . . . . . . . . . . . . . . . . . . . . . . . . . . . . . . . . . . . . . . . . . . . . . . . . . . . . . . . . . . . . . .71B3.2.1 Review of Energy Use . . . . . . . . . . . . . . . . . . . . . . . . . . . . . . . . . . . . . . . . . . . . . . . . . . . . . . . . . . . . . . . . . . . . . . . . . 71B3.2.2 Site Assessment . . . . . . . . . . . . . . . . . . . . . . . . . . . . . . . . . . . . . . . . . . . . . . . . . . . . . . . . . . . . . . . . . . . . . . . . . . . . . 72B3.2.3 Data Analysis . . . . . . . . . . . . . . . . . . . . . . . . . . . . . . . . . . . . . . . . . . . . . . . . . . . . . . . . . . . . . . . . . . . . . . . . . . . . . . . . 72B3.2.4 Audit Report . . . . . . . . . . . . . . . . . . . . . . . . . . . . . . . . . . . . . . . . . . . . . . . . . . . . . . . . . . . . . . . . . . . . . . . . . . . . . . . . . 72B3 .3 Energy Efficiency in Agricultural Value Chains . . . . . . . . . . . . . . . . . . . . . . . . . . . . . . . . . . . . . . . . . . . . . . . . . . .73B3.3.1 Energy Demand Assessment . . . . . . . . . . . . . . . . . . . . . . . . . . . . . . . . . . . . . . . . . . . . . . . . . . . . . . . . . . . . . . . . . . . 73B3.3.2 Recommendations for Energy Efficiency Measures . . . . . . . . . . . . . . . . . . . . . . . . . . . . . . . . . . . . . . . . . . . . . . . . 73B3 .4 Environmental Life Cycle Assessment and Sustainability . . . . . . . . . . . . . . . . . . . . . . . . . . . . . . . . . . . . . . . . . .74B3.4.1 The Environmental LCA . . . . . . . . . . . . . . . . . . . . . . . . . . . . . . . . . . . . . . . . . . . . . . . . . . . . . . . . . . . . . . . . . . . . . . . 75B3.4.2 Life Cycle Costing . . . . . . . . . . . . . . . . . . . . . . . . . . . . . . . . . . . . . . . . . . . . . . . . . . . . . . . . . . . . . . . . . . . . . . . . . . . . 75B3.4.3 Social Life Cycle Assessment . . . . . . . . . . . . . . . . . . . . . . . . . . . . . . . . . . . . . . . . . . . . . . . . . . . . . . . . . . . . . . . . . . 76 Summary & Unit Wrap-Up . . . . . . . . . . . . . . . . . . . . . . . . . . . . . . . . . . . . . . . . . . . . . . . . . . . . . . . . . . . . . . . . . . . .77

SUSTAINABLE ENERGY FOR FOOD – Massive Open Online Course – Reader
TABLE OF CONTENTS 4
CHAPTER C
C1 POLICIES AND REGULATIONS FOR THE ENERGY AGRICULTURE NEXUS . . . . . . . . . . . . . . . . . . . . . . . . . .79C1 .1 Policies and Politics of Renewable Energy . . . . . . . . . . . . . . . . . . . . . . . . . . . . . . . . . . . . . . . . . . . . . . . . . . . . . .81C1 .2 Circular Economy and Scarcity of Resources . . . . . . . . . . . . . . . . . . . . . . . . . . . . . . . . . . . . . . . . . . . . . . . . . . . .86C1 .3 Regulation of Energy Use . . . . . . . . . . . . . . . . . . . . . . . . . . . . . . . . . . . . . . . . . . . . . . . . . . . . . . . . . . . . . . . . . . . . .89C1 .4 Economic and Social Impacts of Energy Production and Use . . . . . . . . . . . . . . . . . . . . . . . . . . . . . . . . . . . . . .91C1 .5 Markets for Projects at the Interface of Agriculture and Energy . . . . . . . . . . . . . . . . . . . . . . . . . . . . . . . . . . . . .93C1 .6 Financing for Renewable Energy and Energy Efficiency Solutions in the Agricultural Sector . . . . . . . . . . . . .94C1 .7 Definitions and Key Concepts . . . . . . . . . . . . . . . . . . . . . . . . . . . . . . . . . . . . . . . . . . . . . . . . . . . . . . . . . . . . . . . . .96
C2 ENERGY AND AGRICULTURE ON A MICRO LEVEL . . . . . . . . . . . . . . . . . . . . . . . . . . . . . . . . . . . . . . . . . . . . . .97C2 .1 Scales of Agri-Food Enterprises . . . . . . . . . . . . . . . . . . . . . . . . . . . . . . . . . . . . . . . . . . . . . . . . . . . . . . . . . . . . . .100C2 .2 Techno-Economic Analysis of Energy Projects in Agricultural Value Chains . . . . . . . . . . . . . . . . . . . . . . . . .103C2.2.1 Micro-level Investment Planning . . . . . . . . . . . . . . . . . . . . . . . . . . . . . . . . . . . . . . . . . . . . . . . . . . . . . . . . . . . . . .103C2.2.2 Financial Cost-Benefit Analysis . . . . . . . . . . . . . . . . . . . . . . . . . . . . . . . . . . . . . . . . . . . . . . . . . . . . . . . . . . . . . . . .108C2.2.3 NPV equation . . . . . . . . . . . . . . . . . . . . . . . . . . . . . . . . . . . . . . . . . . . . . . . . . . . . . . . . . . . . . . . . . . . . . . . . . . . . . . .109C2.2.4 Economic Analysis . . . . . . . . . . . . . . . . . . . . . . . . . . . . . . . . . . . . . . . . . . . . . . . . . . . . . . . . . . . . . . . . . . . . . . . . . .111C2.2.5 Cost-Benefit Analysis Tools . . . . . . . . . . . . . . . . . . . . . . . . . . . . . . . . . . . . . . . . . . . . . . . . . . . . . . . . . . . . . . . . . . .112 Summary & Unit Wrap-Up . . . . . . . . . . . . . . . . . . . . . . . . . . . . . . . . . . . . . . . . . . . . . . . . . . . . . . . . . . . . . . . . . . .114
C3 BUSINESS MODELS FOR PROJECTS IN THE ENERGY AGRICULTURE NEXUS . . . . . . . . . . . . . . . . . . . . .115C3 .1 Business Models . . . . . . . . . . . . . . . . . . . . . . . . . . . . . . . . . . . . . . . . . . . . . . . . . . . . . . . . . . . . . . . . . . . . . . . . . .115C3.1.1 Introduction to Business Models . . . . . . . . . . . . . . . . . . . . . . . . . . . . . . . . . . . . . . . . . . . . . . . . . . . . . . . . . . . . . . .115C3.1.2 Definition of Financial Terms . . . . . . . . . . . . . . . . . . . . . . . . . . . . . . . . . . . . . . . . . . . . . . . . . . . . . . . . . . . . . . . . . .117C3.1.3 Financial Profitability . . . . . . . . . . . . . . . . . . . . . . . . . . . . . . . . . . . . . . . . . . . . . . . . . . . . . . . . . . . . . . . . . . . . . . . .118C3.1.4 Common Methods of Capital Budgeting . . . . . . . . . . . . . . . . . . . . . . . . . . . . . . . . . . . . . . . . . . . . . . . . . . . . . . . .120C3.1.5 Project Financing: Example of Microfinance . . . . . . . . . . . . . . . . . . . . . . . . . . . . . . . . . . . . . . . . . . . . . . . . . . . . .124C3 .2 Clean Energy Projects in the Agricultural Sector . . . . . . . . . . . . . . . . . . . . . . . . . . . . . . . . . . . . . . . . . . . . . . . . .125C3.2.1 Grid vs. Off-Grid Energy Projects in Agricultural Value Chains . . . . . . . . . . . . . . . . . . . . . . . . . . . . . . . . . . . . . .126C3.2.2 Grid-Connected Energy Projects in Agricultural Value Chains . . . . . . . . . . . . . . . . . . . . . . . . . . . . . . . . . . . . . . .126C3.2.3 Off-Grid Energy Projects in Agricultural Value Chains . . . . . . . . . . . . . . . . . . . . . . . . . . . . . . . . . . . . . . . . . . . . .127 Summary & Unit Wrap-Up . . . . . . . . . . . . . . . . . . . . . . . . . . . . . . . . . . . . . . . . . . . . . . . . . . . . . . . . . . . . . . . . . . .133
ANNEX I–IIII . . . . . . . . . . . . . . . . . . . . . . . . . . . . . . . . . . . . . . . . . . . . . . . . . . . . . . . . . . . . . . . . . . . . . . . . . . 134

SUSTAINABLE ENERGY FOR FOOD – Massive Open Online Course – Reader
ABBREVIATIONS 5
ABBREVIATIONSCBA Cost-BenefitAnalysisCAPEX Capital ExpendituresCDM Clean Development MechanismCHP Combined Heat and Power CDM Clean Development MechanismCNG Compressed Natural GasEA Energy AuditingEE EnergyEfficiencyFEA Financial and Economic AnalysisEMS Energy Management SystemsFA Financial AnalysisFAO Food and Agriculture Organization of the United NationsFEA Financial and Economic AnalysisFNPV Financial Net Present ValueGHG Greenhouse GasesGI Galvanized IronIFI International Financing InstitutionsIPEEC InternationalPartnershipforEnergyEfficiencyCooperationIRENA International Renewable Energy AgencyIRR Internal Rate of ReturnISO International Standardization OrganizationLCA Life Cycle Assessment LCC Life Cycle CostingLCSA Life Cycle Sustainability AssessmentLCOE Levelized Cost of EnergyMFI Micro Finance InstituteMOOC Massive Open Online CourseNPV Net Present ValueOPEX Operating ExpensesPBT Payback TimePV PhotovoltaicsRE Renewable EnergyREN21 Renewable Energy Policy Network RESCO Renewable Energy Service Companies SDG Sustainable Development GoalsSE4All Sustainable Energy for AllSPIS Solar Powered Irrigation Systems TWh Terrawatt hoursUASB Upstream Anaerobic Sludge BlanketUN United NationsUNEP United Nation Environment Program WEF Water-Energy-Food

SUSTAINABLE ENERGY FOR FOOD – Massive Open Online Course – Reader
CHAPTER A 6
CHAPTER AA1 THE ENERGY-AGRICULTURE CHALLENGE . . . . . . . . . . . . . . . . . . . . . . . . . . . . . . . . . . . . . . . . . . . . . . . . . . . . . . . .7A1 .1 The Water-Energy-Food Nexus . . . . . . . . . . . . . . . . . . . . . . . . . . . . . . . . . . . . . . . . . . . . . . . . . . . . . . . . . . . . . . . . .7A1 .2 Population Growth and Food Production . . . . . . . . . . . . . . . . . . . . . . . . . . . . . . . . . . . . . . . . . . . . . . . . . . . . . . . . .8A1 .3 Agricultural Production and Value Chains . . . . . . . . . . . . . . . . . . . . . . . . . . . . . . . . . . . . . . . . . . . . . . . . . . . . . . . .9
A2 CLIMATE CHANGE . . . . . . . . . . . . . . . . . . . . . . . . . . . . . . . . . . . . . . . . . . . . . . . . . . . . . . . . . . . . . . . . . . . . . . . . . .11A2 .1 Climate Change and Primary Agricultural Production . . . . . . . . . . . . . . . . . . . . . . . . . . . . . . . . . . . . . . . . . . . . .11A2 .2 Adaptation to Climate Change . . . . . . . . . . . . . . . . . . . . . . . . . . . . . . . . . . . . . . . . . . . . . . . . . . . . . . . . . . . . . . . .11A2 .3 Climate Neutral Productivity Growth . . . . . . . . . . . . . . . . . . . . . . . . . . . . . . . . . . . . . . . . . . . . . . . . . . . . . . . . . . .12
A3 ENERGY INPUT IN AGRICULTURAL VALUE CHAINS . . . . . . . . . . . . . . . . . . . . . . . . . . . . . . . . . . . . . . . . . . . . . . .13A3 .1 Energy Input in Agricultural Production . . . . . . . . . . . . . . . . . . . . . . . . . . . . . . . . . . . . . . . . . . . . . . . . . . . . . . . . .13A3 .2 Energy Input in the Downstream Sector . . . . . . . . . . . . . . . . . . . . . . . . . . . . . . . . . . . . . . . . . . . . . . . . . . . . . . . .14A3 .3 Financing Alternative Energy Solutions . . . . . . . . . . . . . . . . . . . . . . . . . . . . . . . . . . . . . . . . . . . . . . . . . . . . . . . . .15 Summary & Unit Wrap-Up . . . . . . . . . . . . . . . . . . . . . . . . . . . . . . . . . . . . . . . . . . . . . . . . . . . . . . . . . . . . . . . . . . . .16
© GIZ

SUSTAINABLE ENERGY FOR FOOD – Massive Open Online Course – Reader
CHAPTER A | UNIT A1 | THE ENERGY-AGRICULTURE CHALLENGE 7
INTRODUCTIONThe United Nations projects a world population of 9 .7 billion by 2050 . As a result, the world will have to feed 2 .5 billion more people than today . The United Nations Food and Agriculture Organization estimates that by 2050 current food production needs to rise by 70 percent to satisfy the expanding demand (FAO, 2011) . Given the planetary boundaries, especially limited energy and water resources, meeting this target is one of the century’s big-gest challenges . At the same time, increased demand for processed food, meat,dairy,andfishaddsfurtherpressuretothefoodsupplysystem,andgrowing impacts of climate change pose a further constraint . The question to be answered is: ‘How can we feed more people, in a better way, with improved access to modern energy, yet without consuming more water and soil, or generating more greenhouse gas emissions?’ (Altenburg, 2014) .
UNIT A1 THE ENERGY-AGRICULTURE CHALLENGE
Unit A1.1 | The Water-Energy-Food NexusThe above question highlights the rapidly growing demand in a world with limited resources, which cannot be replenished, but rather are diminishing everyday.Specifically,theinterdependencyofwater,energyandfoodisofconcern . Food production requires water and energy throughout the agri-food sector . Energy production requires water and a substantial amount of biomass which must be produced using soils, water and nutrients . About 30 percent of global energy usage can be traced back to the food sector (FAO, 2011) . This includes supply industry, agricultural production, process-ing, transport, merchandising and consumption . Agriculture is currently the number one consumer of water resources, accounting for 70 percent of all freshwater use . On the one hand, water is required for food production, pro-cessing, transport and preparation – and for producing energy: water with-drawals for energy production in 2010 were about 15 percent of the world’s total water withdrawals (IEA, 2012) . On the other hand, energy is an essential requirement for the withdrawal (pumping), distribution and treatment of water . The nexus approach considers all three sectors – Water-Energy-Food (WEF) – while taking into account that approaches adopted in only one sec-tor might affect the other sectors negatively . The interdependency between the WEF sectors has become more and more evident, as the international
LINK FAO Water-Energy-Food (WEF) Nexus Rapid Appraisal www .fao .org/energy/water-food- energy-nexus/water-energy-food- nexus-ra/en/
AUTHORS Project “Powering Agriculture – Sus-tainable Energy for Food”, Deutsche Gesellschaft für InternationaleZusammenarbeit (GIZ) GmbH . Sup-port Program to the German Contri-bution to “Powering Agriculture:An Energy Grand Challenge for Devel-opment” .
MATERIALS Please find below links to our materials and references
Videowww .giz .de/gc21/pa_video_lectures
Additional Materialwww .giz .de/gc21/pa_additional_material
Referenceswww .giz .de/gc21/pa_references
SUSTAINABLE ENERGY FOR FOOD – Massive Open Online Course – Reader
CHAPTER A | UNIT A1 | THE ENERGY-AGRICULTURE CHALLENGE 8
debate progresses since the Bonn 2011 nexus conference (FAO, 2014) . The WEF nexus displays a high degree of complexity and is a topic too vast to be covered in the course of this MOOC . To reduce complexity and create space for learning and interaction, the following sessions will concentrate on the two-dimensional nexus of energy and food .
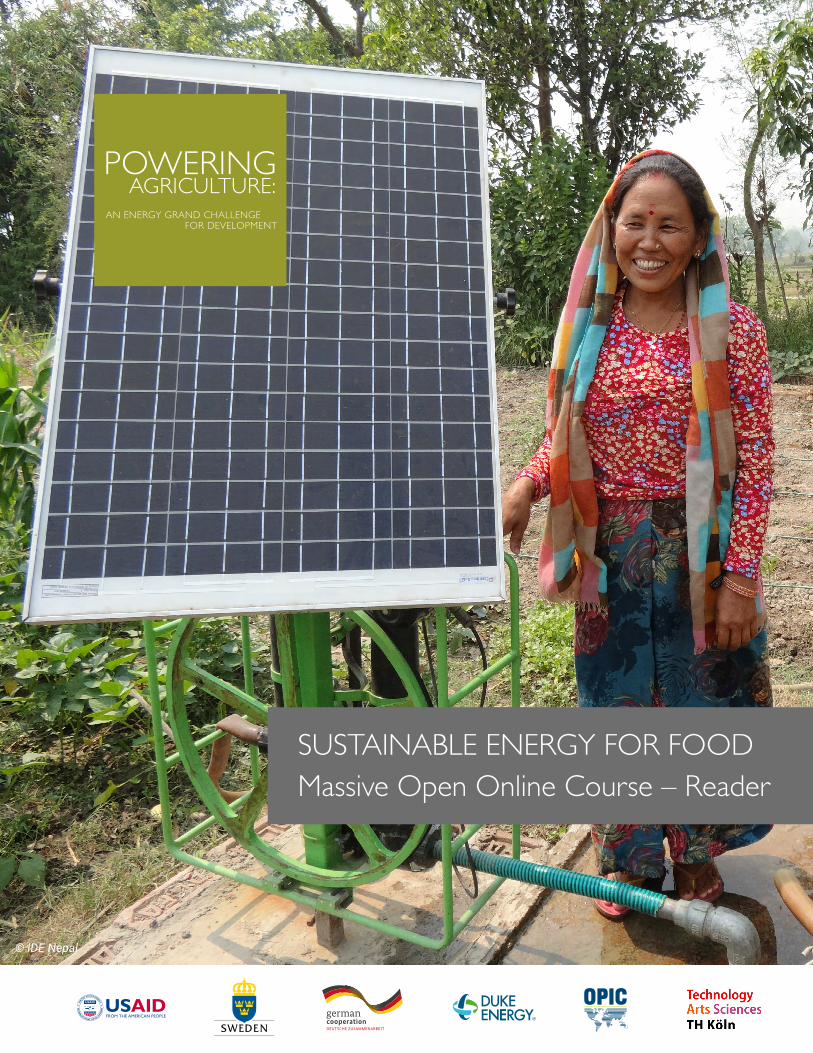
Unit A1.2 | Population Growth and Food ProductionIn the 1960’s, the ‘green revolution’ offset the looming food disaster . Its suc-cesswasbasedonimprovedplantbreeding,intensificationduetoirrigation,increasing usage of inorganic fertilizer and energy inputs along the food chain . From farm mechanization, chemical fertilizers and pesticides to processing, coolingandpackaging,fossilfuelsmadeasignificantcontributiontothissuc-cess . Such resources will not be available at cheap prices forever . Dependency onfossilfuelscreatesahighriskoffluctuatingfoodprices,whichmightthenbecome unaffordable for the economically weak . In addition, fossil fuels cause greenhouse gas emissions . Not to forget population growth . (Figure A1)
However, simply repeating the green revolution is highly unlikely . The supply offertilearablelandisfiniteandthereforeincreaseddemandforfoodalsoputs pressure on the planet’s limited resource base . For example, irrigated land produces double or triple the outcome compared to rain-fed systems and accounts for 40 percent of the global cereal supply . The answer could merely be to call for more irrigated land, but it may not be as simple as that . Forinstance,approximately40percentofthegloballandmassisclassifiedas agricultural land with only very limited opportunities for expansion (FAO, 2011) . The FAO estimates that globally every year 25,000 million tons of top-soil are washed away by water erosion . Not only is the area available for food production limited but its suitability for production is continuously being eroded . Solutions are urgently needed . To identify effective changes, stakeholders will have to look at different aspects and segments along the agri-foodvaluechains.Cultivationmethodsthatmakeefficientuseofresources are a major step forward .
CLOSE-UP The World’s Soil Resources
“In the central United States, long considered to be the “bread basket” of the nation, soil is currently eroding at a rate at least 10 times greater than the natural background rate of soil production . The loss of soil to erosion also involves the loss of key nutrients for plant growth, leading to the need for commercial fertilizers .” Donald L. Sparks, University of Dela-ware, one of US-America´s leading soil scientists (Chajes, 2015)
CLOSE-UP The Future of Food and Farming
“If food security is to be provided for a predicted nine billion people sub-stantial changes will be required throughout the different elements of the food syste m and beyond . Action has to occur simultaneously on all of the following four fronts:• Morefoodmustbeproducedsus-
tainably through the spread and implementation of existing knowl-edge, technology and best practice, and by investment in new innova-tion and the social infrastructure that enables food producers to benefitfromallofthese.
• Demandforthemostresource-in-tensive types of food must be con-tained .
• Wasteinallareasofthefoodsys-tem must be minimized .
• Thepoliticalandeconomicgover-nance of the food system must be improved to increase food system productivity and sustainability .”
(Foresight, 2011)
Figure A1 | Global Food Demand by 2050 (CCFAS, 2015)
SUSTAINABLE ENERGY FOR FOOD – Massive Open Online Course – Reader
CHAPTER A | UNIT A1 | THE ENERGY-AGRICULTURE CHALLENGE 9
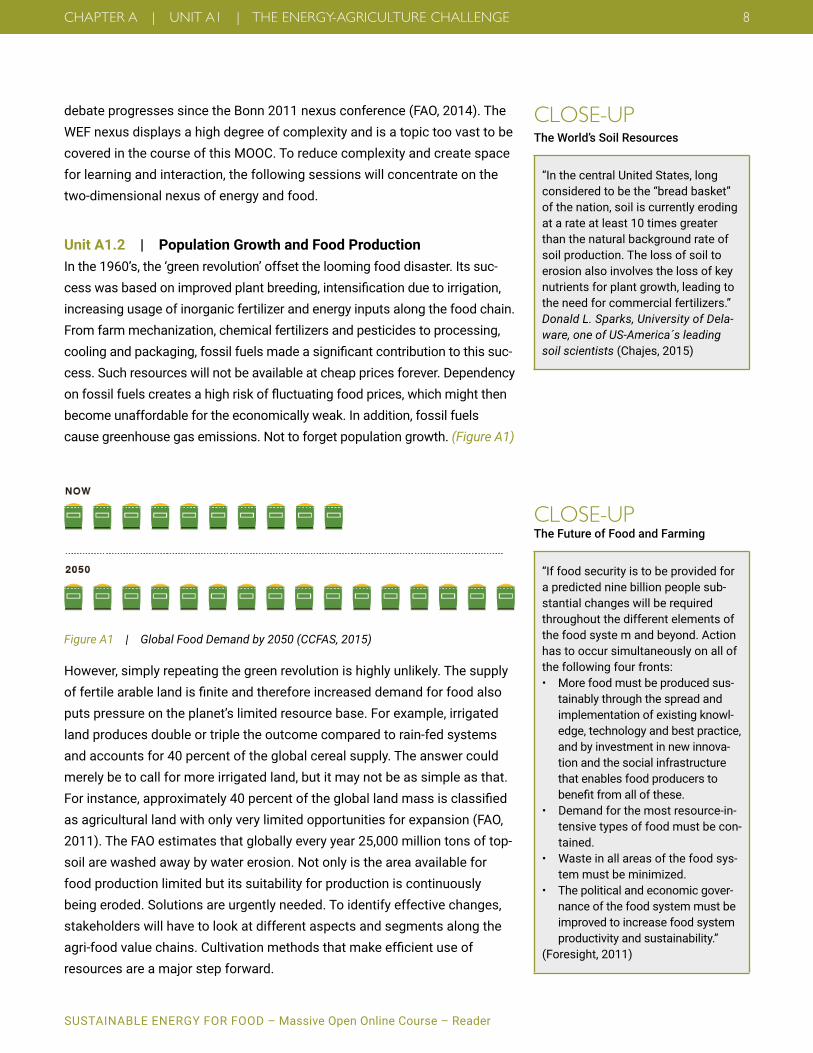
Unit A1.3 | Agricultural Production and Value ChainsOne conclusion to draw from the above analysis is that the agri-food sector mustbecomemoreefficient.Thiscanbeachievedeitherthroughenergy efficiency [» Unit B3] measures or through the application of renewable energy [» Unit B1] . In any case, changes need to include the entire agricul-tural value chain as shown in Figure A2 . This includes: input providers, farm-ers, processors, packagers, distributors and retailers .
Efficiencygainscanbemadeinagriculturalprocessingbydecreasingenergy input and use, as well as by reducing food losses before, during and after processing . In sub-Saharan Africa alone, 20 percent of harvests are lost, which amounts to an annual cost of US $4bn (FAO, 2011) . Losses often occur due to non-existent, inadequate and/or interrupted energy input during storage or transportation and at markets .
Figure A3 shows the losses in agricultural value chains by comparing value chain segments between developing countries and developed countries . The majority of food loss in developed countries occurs in consumption and retail, whereas in developing countries food losses occur mainly at the pre-harvest/harvest, processing and retail stages . These are the processes with opportunities for improvement .
However, reducing waste is not only a matter of energy: reducing waste is firstandforemostaboutbehavior.Byjoiningforces,civilsociety,privatesec-tor and government in high-GDP countries can reduce waste in the retail and consumption sector .
CLOSE-UP What is a Value Chain?
A value chain is the sequence of pro-ductive processes from the provision ofspecificinputsforaparticularproduct to primary production, trans-formation,marketing,anduptofinalconsumption (the functional view on a value chain) . As these functions are carried out by chain operators, a value chain is also an institutional arrangement linking and coordinating producers, processors, traders and distributors of a particular product . (GIZ, 2008)
Figure A2 | Agricultural Value Chains (Sims et al., 2015)

SUSTAINABLE ENERGY FOR FOOD – Massive Open Online Course – Reader
CHAPTER A | UNIT A1 | THE ENERGY-AGRICULTURE CHALLENGE 10
RECAP• Thepopulationoftheworldwillreach9billionby2050–demandforfood
will grow .• Rapidlygrowingdemandforresourcesconflictswithplanetaryboundaries.• Theagri-foodsectorhastobecomemoreefficienttomeetgrowing
demand .• Around30percentofglobalenergyconsumptioncanbetracedbacktothe
agri-food sector .
Figure A3 | Food Losses Along Agricultural Value Chains (FAO, 2014)

SUSTAINABLE ENERGY FOR FOOD – Massive Open Online Course – Reader
CHAPTER A | UNIT A2 | CLIMATE CHANGE 11
UNIT A2 CLIMATE CHANGE
The relationship between agriculture and climate change is twofold – agri-culture is both a contributor to greenhouse gases and a sector affected by the impacts of climate change .
Unit A2.1 | Climate Change and Primary Agricultural ProductionMeeting increasing demand for food is further challenged by the impacts of climate change . Impacts can include extreme events such as drought and floodsandchangingrainandtemperaturepatterns.Collectivelythishasagreat impact on the agri-business sector and poses a threat to food security .
Agriculture remains the main income source for rural populations (2 .5 bil-lion) . Already extreme weather events and diseases are reported to affect agricultural production negatively . As a result of climate change impacts, FAOexpectssignificantcropdecreaseinmaizeproductionofupto30per-cent by 2030 in Africa and up to 10 percent for staple crops in Asia (2013) .
Studies predict the shortage of water and food for billions of people due to climate change (Sims et al ., 2015) . These changes call for adaptation mea-sures such as new technologies and the cultivation of new crops .
Unit A2.2 | Adaptation to Climate ChangeIn view of growing food demand, successful adaptation to climate change require increasing production under inferior conditions . Therefore, adapta-tion strategies need to be broadly supported by institutions, and national frameworks,andinternationalagreementsneedtobemodifiedaswell.Tar-geted investments will be required, as well as development capacity, in order to achieve integrated action across diverse sectors . The complexity of the challenge has been highlighted in a report by UNEP, which also stresses the central role of the small-scale farming sector . (UNEP, 2009)
Broadly speaking, climate change adaptation will require the farmer/small-holder to1. shifttomorerobustcropsormorestress-tolerantvarieties,2. modifylanduse,e.g.treesinfarmland,3. integratesoilcultivationandconservation,4. increaseirrigatedlandtakingsustainablewatermanagementinto
account,5 . integrate water harvesting technologies .
CLOSE-UP Conservation Agriculture with Ripper-Furrower System in Namibia
Farmers in the north of Namibia are using conservation agriculture to grow drought-tolerant crops, includ-ing millet, sorghum and maize . The farming system uses a tractor-drawn ripper-furrower to rip the hard pan to a depth of 60 centimeters and to formfurrowsforin-fieldrainfallhar-vesting . The harvested water is con-centrated in the root zone of crops, which are planted in the rip lines with a mixture of fertilizer and manure . Tractorsareusedinthefirstyeartoestablish the system . From the sec-ond year onwards, farmers plant crops directly into the rip lines using an animal-drawn direct seeder .
In addition, farmers are encouraged to practice crop rotation with legumes . These techniques lengthen the growing season and improve soil structure, fertility and moisture reten-tion . Average maize yields have increased from 300 kilograms per hectare to more than 1 .5 tons . (FAO, 2011)
FAO NAMA LEARNING TOOL
The FAO Learning tool on Nationally Appropriate Mitigation Actions (NAMAs) gives more information on agriculture and climate change, GHG emission and mitigating options, as well as funding sources .

SUSTAINABLE ENERGY FOR FOOD – Massive Open Online Course – Reader
CHAPTER A | UNIT A2 | CLIMATE CHANGE 12
Whereas it is a central need to adapt our agricultural production systems to better deal with the effects of climate change, agriculture also contributes to climate change by emitting Greenhouse Gases GHG: carbon dioxide is emit-ted by burning or mineralizing biomass (e .g . deforestation) and by fossil fuel consumption; methane is produced through enteric fermentation by rumi-nants, by manure management, as well as in irrigated rice production and, finally,bynitrousoxidefromtheuseofnitrogenousfertilizer(GIZ,2014).
Unit A2.3 | Climate Neutral Productivity GrowthAgricultural, food and other land use represent 24 percent of total GHG emis-sions, representing the second largest emitting sector after the energy sector . Agriculture alone contributes 10 – 12 percent (IPCC, 2014) . In addition, agri-culture must produce more without further increasing the GHG load . However, from 2001 to 2011, carbon dioxide emissions from crop and livestock produc-tion increased from 4 .7 billion tons to over 5 .3 billion tons (Tubiello et al ., 2014) . The use of fossil-based energy needs to be reduced dramatically . Possible solutions include introducing renewables [» Unit B1], optimizing processes and lowering energy intensity [» Unit B3] – but also reducing food losses and waste . Land use needs to change so that it no longer releases GHG into the atmo-sphere, but eventually builds up carbon stocks in soils and biomass . Emissions in land and livestock management also have to be mitigated .
Potential optimization of food supplies of is very much linked to the supply of energy . Abundant energy resources such as wind, solar, hydro and biomass are available [» Unit B2]. These technologies make on-site generation of elec-tricity and thermal energy possible . The implementation could be both techni-cally and economically feasible on all scales, from subsistence farming to large-scale agriculture .
Lowering energy intensity builds on behavioral changes, the development and implementation of low-carbon practices, and investment in improved technologies with a particular focus on energy efficiency [» Unit B3] . In the lastthreedecadesthedeploymentofenergy-efficientpracticeshasledtomoreefficientenergyusageinhigh-GDPcountries.Thegoalshouldbetoenable the production of more food per unit of land globally with less energy inputs . An example of energy saving potential can be found in the highly energy-in-tensive processing of tea in Kenya . Drying, grading and packaging consume immense amounts of energy and account for up to 30 percent of total pro-ductioncosts.Efficientlighting,upgradingfans,betterfuelwoodmanage-
CLOSE-UP Adaptation and Mitigation
Mitigation: “An anthropogenic inter-vention to reduce the sources or enhance the decrease of greenhouse gases .”Adaptation: “Adaptation to climate change refers to adjustment in natu-ral or human systems in response to actual or expected climatic stimuli or their effects, which moderates harm orexploitsbeneficialopportunities.”(IPCC, 2007)
CLOSE-UP Carbon Footprint
“A carbon footprint is a measure of the exclusive total amount of carbon dioxide equivalent emissions that is directly and indirectly caused by an activity or is accumulated over the life stages of a product .” (Wiedmann & Minx, 2007)

SUSTAINABLE ENERGY FOR FOOD – Massive Open Online Course – Reader
CHAPTER A | UNIT A3 | ENERGY INPUT IN AGRICULTURAL VALUE CHAINS 13
ment and the use of alternative fuels can save up to 34 percent fuel wood and two percent electricity (Ethical Tea Partnership) .
RECAP • Extremeweathereventsduetoclimatechangeimpactagriculturalpro-
duction .• Adaptationandmitigationmeasuresneedtobeimplemented,suchas
new technologies and cultivation of new crops .• Introductionofrenewableresources,optimizationofprocessesandlowering
of energy intensity can design productivity growth in a carbon-neutral way .
UNIT A3 ENERGY INPUT IN AGRICULTURAL VALUE CHAINS
This unit discusses indirect and direct energy inputs along the agricultural valuechain,includingthefinancingsideofalternativeenergysolutions.
Unit A3.1 | Energy Input in Agricultural ProductionEnergy is used at every stage of the agricultural value chain: from production over processing, post-harvest and storage to distribution and retail . (Figure A4)
CLOSE-UP Climate Smart Agriculture
Climate Smart Agriculture means• Sustainablyincreasingagricultural
productivity and incomes• Adaptingandbuildingresilienceto
climate change• ReducingGHGemissions,where
possible (FAO, 2011)
Figure A4 | Energy Inputs in Agricultural Value Chains (Best, 2014)
» Unit B1.1 – Milk value chain
SUSTAINABLE ENERGY FOR FOOD – Massive Open Online Course – Reader
CHAPTER A | UNIT A3 | ENERGY INPUT IN AGRICULTURAL VALUE CHAINS 14
Direct and indirect energy inputs are equally necessary but they occur at different steps . Farms and processing plants apply direct energy at the oper-ational level . It comprises, for instance, product supply and transport energy, with fuel or biofuel being used to bring the produce to market . Additional energy consumed for production, processing and commercialization of prod-ucts is categorized as direct energy input, as is energy for irrigation, land preparation and harvesting .
When correctly used, direct energy in irrigation systems has the potential to reduce water and energy consumption at the same time and further increase yield . If conventional energy sources are substituted by wind-powered or solar PV irrigation systems, irrigation can become sustainable . Neverthe-less, sustainable irrigation also uses resources and there is a risk of over-ex-ploitation when low-cost energy is available (see CLOSE-UP of the Rebound Effect for more information) .
Indirect energy is applied through the use of machinery, pesticides and fertiliz-ers . Nitrogen fertilizer production alone accounts for about half of the fossil fuelsusedinprimaryproduction.Significantamountsofnitrousoxidecanbeemitted during the production of nitrate (Sims et al ., 2015) . Nonetheless, ener-gy-intensive fertilizers can save indirect energy through advanced engineering and computer-aided technologies . Improving accuracy and timing of applica-tions, with biosensors for soil fertility monitoring and trace gas detection, can significantlyreducefertilizerusageandthusdecreaseenergyinputs.
Unit A3.2 | Energy Input in the Downstream Sector The downstream sector includes processing, post-harvest, storage, cooling, distribution and retail . These activities can easily consume large amounts of energy,soenergyefficiencymeasuresandrenewablesareveryimportant.Tobacco production in Zimbabwe is an example: the (heat) curing process accounts for over 50 percent of the total on-farm energy demand . Solar power canreplacenaturalgasorliquefiedpetroleumgasinthisheatingprocess. There are several measures to preserve food . Cooling is one alternative to maintain food quality; however, the total carbon footprint can amount to up to 10 percent . If electricity input, the manufacturing of cooling equipment and lost refrigerants are considered, it is clear that GHG emissions from the refrigeration process are skyrocketing (Sims et al ., 2015) .
The processing and packaging part of agricultural food chains is also a main contributor to overall energy utilization . A retail food product, for instance,
CLOSE-UP The Rebound Effect
Be aware of the rebound effect: “The rebound effect occurs when reduc-tions in energy demand result in lower energy prices which, in turn, encour-age energy purchases in other areas .” (Barker & Dagoumas, 2009)
CLOSE-UP Solar Cooling for Storing Livestock Vaccine in Angola
Animal husbandry is an important source of livelihood in rural Angola and a major agriculture activity . But the livestock are vulnerable to dis-eases due to a lack of reliable veteri-nary services and access to vaccina-tion, and vaccines are required to be storedinspecifictemperaturestosur-vive . The lack of access to energy hampers the storage and distribution of these vaccines across rural Angola resulting in loss of preventable animal life . In 2011 the ‘Strengthening of Live-stock Services in Angola’ project led by FAO, co-funded by the EU and the Institute of Veterinary Services of Angola, installed solar energy systems in refrigeration rooms in 15 municipal veterinary pharmacies . This included four PV systems to power veterinary centers, incl . cold storage rooms, and around 15 absorption refrigerators to store vaccines in different villages . Solar energy systems and solar cool-ers have made vaccines more avail-able and have provided herders with the right tools to treat their animals, thus reducing livestock mortality (and consequently, the waste of natural resources) .” (FAO, 2011)

SUSTAINABLE ENERGY FOR FOOD – Massive Open Online Course – Reader
CHAPTER A | UNIT A3 | ENERGY INPUT IN AGRICULTURAL VALUE CHAINS 15
needs around 14 kWh/kg to 28 kWh/kg for processing and packaging (Sims, 2008) . Food processing plants in the USA are one example of this immense consumption of energy . The wet-milling of corn accounts for up to 15 per-cent of total energy used by the food industry . By utilizing thermal and mechanical vapor compression, the milling of wet corn could save up to 15 to 20 percent in its energy-intensive dewatering, drying and evaporation process (Sims et al ., 2015) .
Small-scale food processing plants in developing countries often use out-datedorlessefficienttechnologies.Thepossibilitiesforimprovementareabundant . Good maintenance of older processing plants can lead to energy savingsof10to20percent.Byimprovingcombustionefficiency,reusingtheheatfromexhaustgasesandapplyinghigh-efficiencymotors,energysav-ings of up to 20 to 30 percent are achievable . With higher capital investment, even higher energy savings can be achieved (Sims et al ., 2015) .
Transport is another consumer of energy in agricultural value chains . For instance, when fresh food is transported by air or long distances by road, transport can account for up to 70 percent of the total carbon footprint . While transport is a relevant topic for the Energy Agriculture Nexus, this course does not further elaborate on this topic .
Unit A3.3 | Financing Alternative Energy SolutionsAgriculturalvaluechainscontainmanyopportunitiesforenergyefficiencymeasuresandrenewables.Investmentinthesesectorscanyieldsignificantsavings in energy and reduce GHG emissions . However, alternative energy solutions come at a cost . Whether they are applicable is very much depen-dentontheindividualsituationandfinancialbackground.Cost-benefit analy-sis and feasibility analysis are [» Unit C2.2; » Unit C1] valuable to support decision-making .
RECAP• Directandindirectenergyinputsareneededinagriculturalvaluechains.• Eachstepoftheagriculturalvaluechainpresentsoptionsformitigating
GHG emissions .• Processing,post-harvest,storageandcoolingareenergy-intensivesteps
of many agricultural value chains .• Viabilityofinvestmentsincleanenergysolutionsisverymuchdependent
on the individual context and thus requires detailed analysis .
CLOSE-UP Solar-Powered Refrigeration for Dairy Farms in Kenya
Duetolimitedelectrificationinruralareas, 85 percent of Kenya’s one mil-lion smallholder dairy farming families do not have access to refrigerated storageandtransportation.Thisdefi-ciency results in less than half of the milk produced actually reaching dairy processors . Of the milk that is pro-cessed, up to 30 percent of it may spoil without appropriate cold-storage options . Consequently, many dairy farmers and processors may unneces-sarilylosesignificantearningpoten-tials .
Recognizing the need for affordable cold-chain technologies, SunDanzer has developed a small-scale portable cooling system . The system com-prises a photo-voltaic refrigerator (PVR) that uses solar energy to cool a chest refrigerator . This uses phase-change materials (substances which are capable of storing and releasing large amounts of energy) as energy storage . SunDanzer also developed milk can blankets to retain the cold temperature as farmers transport the milk to the collection facility . This clean energy solution aims to increase dairy farm productivity and income by significantlydecreasingmilkspoilage.
» Unit C2.2» Unit C1
SUSTAINABLE ENERGY FOR FOOD – Massive Open Online Course – Reader
CHAPTER A | UNIT A3 | ENERGY INPUT IN AGRICULTURAL VALUE CHAINS 16
SUMMARY & UNIT WRAP-UP Population growth, limited resources, increased demand for food . Meeting these developments in a sustainable way poses tremendous challenges, amongst others:1. Howcanweproducemorefoodwhileusinglessenergy?2. Howcanagriculturebecomeenergy-smart?3. Howcanenergytechnologiesprovideefficientandsustainablepower
foragriculturalprocesses?
With an outline of the current situation, an introduction to climate change and its implications for agriculture, as well as insight into energy usage in agricultural value chains, this chapter provides a basis for further discussion of the Energy Agriculture Nexus in the ongoing course and introduces solu-tionsfocusingonenergyefficiencymeasuresandusingrenewableenergy.
From Week 2 to Week 4, the MOOC will provide knowledge on the technologi-cal side of the Energy Agriculture Nexus, including an overview of renewable energy resources and technologies [» Unit B1] . Further, solar and bioenergy [» Unit B2] are introduced with a focus on potential technological solutions for agriculturalvaluechains.Thefinalunitofthetechnologicalchapterwillbeonenergy efficiency [» Unit B3] .
From Week 5 to Week 7, the MOOC will continue to explore economic aspects on the macro- [» Unit C2] and micro-levels [» Unit C2] and will take a closer look at business options [» Unit C2] and investment planning for clean energy solutions for agricultural value chains . Furthermore, it is recom-mended to watch the video with Katie Kennedy Freeman from the World Bank on approaches to support investment in clean energy solutions in develop-ing and emerging countries .
MATERIALS Please find below links to our materials and references
Videowww .giz .de/gc21/pa_video_lectures
Additional Materialwww .giz .de/gc21/pa_additional_ material
Referenceswww .giz .de/gc21/pa_references

SUSTAINABLE ENERGY FOR FOOD – Massive Open Online Course – Reader
CHAPTER B 17
CHAPTER B B1 RENEWABLE ENERGY RESOURCES AND TECHNOLOGY . . . . . . . . . . . . . . . . . . . . . . . . . . . . . . . . . . . . . . . . . . .19B1 .1 Renewable Energy and Agricultural Value Chains . . . . . . . . . . . . . . . . . . . . . . . . . . . . . . . . . . . . . . . . . . . . . . . . .20B1 .2 Introduction to Energy Resources and Technologies . . . . . . . . . . . . . . . . . . . . . . . . . . . . . . . . . . . . . . . . . . . . . .26B1 .3 Solar Energy in Agriculture . . . . . . . . . . . . . . . . . . . . . . . . . . . . . . . . . . . . . . . . . . . . . . . . . . . . . . . . . . . . . . . . . . . .36
B2 BIOENERGY . . . . . . . . . . . . . . . . . . . . . . . . . . . . . . . . . . . . . . . . . . . . . . . . . . . . . . . . . . . . . . . . . . . . . . . . . . . . . . . .46B2 .1 Bioenergy Resources and Technologies . . . . . . . . . . . . . . . . . . . . . . . . . . . . . . . . . . . . . . . . . . . . . . . . . . . . . . . .46B2 .2 Introduction to Biogas . . . . . . . . . . . . . . . . . . . . . . . . . . . . . . . . . . . . . . . . . . . . . . . . . . . . . . . . . . . . . . . . . . . . . . .50B2 .3 Use of Biogas Technologies in Agricultural Value Chains . . . . . . . . . . . . . . . . . . . . . . . . . . . . . . . . . . . . . . . . . .54B2 .4 Biogas Utilization Options . . . . . . . . . . . . . . . . . . . . . . . . . . . . . . . . . . . . . . . . . . . . . . . . . . . . . . . . . . . . . . . . . . . .61
B3 ENERGY EFFICIENCY IN THE ENERGY AGRICULTURE NEXUS . . . . . . . . . . . . . . . . . . . . . . . . . . . . . . . . . . .65B3 .1 Energy Efficiency . . . . . . . . . . . . . . . . . . . . . . . . . . . . . . . . . . . . . . . . . . . . . . . . . . . . . . . . . . . . . . . . . . . . . . . . . . . .65B3 .2 Energy Auditing . . . . . . . . . . . . . . . . . . . . . . . . . . . . . . . . . . . . . . . . . . . . . . . . . . . . . . . . . . . . . . . . . . . . . . . . . . . . .71B3 .3 Energy Efficiency in Agricultural Value Chains . . . . . . . . . . . . . . . . . . . . . . . . . . . . . . . . . . . . . . . . . . . . . . . . . . .73B3 .4 Environmental Life Cycle Assessment and Sustainability . . . . . . . . . . . . . . . . . . . . . . . . . . . . . . . . . . . . . . . . . .74
© GIZ

SUSTAINABLE ENERGY FOR FOOD – Massive Open Online Course – Reader
CHAPTER B | UNIT B1 | RENEWABLE ENERGY RESOURCES AND TECHNOLOGY 18
UNIT B1B1 RENEWABLE ENERGY RESOURCES AND TECHNOLOGY . . . . . . . . . . . . . . . . . . . . . . . . . . . . . . . . . . . . . . . . . . .19B1 .1 Renewable Energy and Agricultural Value Chains . . . . . . . . . . . . . . . . . . . . . . . . . . . . . . . . . . . . . . . . . . . . . . . . .20B1.1.1 Example: Milk Value Chain . . . . . . . . . . . . . . . . . . . . . . . . . . . . . . . . . . . . . . . . . . . . . . . . . . . . . . . . . . . . . . . . . . . . . 21B1.1.2 Renewable Energy Resources . . . . . . . . . . . . . . . . . . . . . . . . . . . . . . . . . . . . . . . . . . . . . . . . . . . . . . . . . . . . . . . . . . 23B1 .2 Introduction to Energy Resources and Technologies . . . . . . . . . . . . . . . . . . . . . . . . . . . . . . . . . . . . . . . . . . . . . .26B1.2.1 Hydropower . . . . . . . . . . . . . . . . . . . . . . . . . . . . . . . . . . . . . . . . . . . . . . . . . . . . . . . . . . . . . . . . . . . . . . . . . . . . . . . . . 27B1.2.2 Wind Energy . . . . . . . . . . . . . . . . . . . . . . . . . . . . . . . . . . . . . . . . . . . . . . . . . . . . . . . . . . . . . . . . . . . . . . . . . . . . . . . . . 28B1.2.3 Bioenergy . . . . . . . . . . . . . . . . . . . . . . . . . . . . . . . . . . . . . . . . . . . . . . . . . . . . . . . . . . . . . . . . . . . . . . . . . . . . . . . . . . . 31B1.2.4 Solar Thermal . . . . . . . . . . . . . . . . . . . . . . . . . . . . . . . . . . . . . . . . . . . . . . . . . . . . . . . . . . . . . . . . . . . . . . . . . . . . . . . 33B1.2.5 Solar Photovoltaics (PV) . . . . . . . . . . . . . . . . . . . . . . . . . . . . . . . . . . . . . . . . . . . . . . . . . . . . . . . . . . . . . . . . . . . . . . 34B1 .3 Solar Energy in Agriculture . . . . . . . . . . . . . . . . . . . . . . . . . . . . . . . . . . . . . . . . . . . . . . . . . . . . . . . . . . . . . . . . . . . .36B1.3.1 Solar Powered Irrigation . . . . . . . . . . . . . . . . . . . . . . . . . . . . . . . . . . . . . . . . . . . . . . . . . . . . . . . . . . . . . . . . . . . . . . . 36B1.3.2 Solar Drying . . . . . . . . . . . . . . . . . . . . . . . . . . . . . . . . . . . . . . . . . . . . . . . . . . . . . . . . . . . . . . . . . . . . . . . . . . . . . . . . . 40B1.3.3 Solar Box Dryer . . . . . . . . . . . . . . . . . . . . . . . . . . . . . . . . . . . . . . . . . . . . . . . . . . . . . . . . . . . . . . . . . . . . . . . . . . . . . . 41B1.3.4 Solar Cabinet Dryer . . . . . . . . . . . . . . . . . . . . . . . . . . . . . . . . . . . . . . . . . . . . . . . . . . . . . . . . . . . . . . . . . . . . . . . . . . . 41B1.3.5 Solar Tunnel Dryer . . . . . . . . . . . . . . . . . . . . . . . . . . . . . . . . . . . . . . . . . . . . . . . . . . . . . . . . . . . . . . . . . . . . . . . . . . . . 42B1.3.6 Solar-Biomass Hybrid Cabinet Dryer . . . . . . . . . . . . . . . . . . . . . . . . . . . . . . . . . . . . . . . . . . . . . . . . . . . . . . . . . . . . . 43 Summary & Unit Wrap-Up . . . . . . . . . . . . . . . . . . . . . . . . . . . . . . . . . . . . . . . . . . . . . . . . . . . . . . . . . . . . . . . . . . . .44
© GIZ/Kilian Blumenthal
SUSTAINABLE ENERGY FOR FOOD – Massive Open Online Course – Reader
CHAPTER B | UNIT B1 | RENEWABLE ENERGY RESOURCES AND TECHNOLOGY 19
INTRODUCTIONUnitB1coversrenewableenergytechnologiesandenergyefficiencyinagricul-tural value chains . Unit B1 provides an overview on renewable energy (RE) resources and a selection of technologies to harness these resources . In the beginning of the chapter the linkage between REs and agricultural value chains will be discussed, followed by a general description on the origin of renewable energy resources . Unit B1 focuses on major RE technologies currently used around the world, followed by a case study . However, solar power [» Unit B1.3] will be in a unit of its own and bioenergy [» Unit B2] will be presented in detail in the next chapter of this MOOC reader .
UNIT B1 RENEWABLE ENERGY RESOURCES AND TECHNOLOGY
FOSSIL AND RENEWABLE ENERGY RESOURCES
Energy is available in many different forms . One group of energy resources – stored in oil, coal and natural gas is depleting and non-renewable – and is called fossil fuels . Another group of energy resources is renewable; most of them are derived from every day’s solar radiation (as wind, bio-mass (photosynthesis) and water are a result of solar radiation at the long end) and either directly or indirectly converted to useful forms . RE resources that do not depend on sunlight are tidal energy (conversion of gravitational energy) and geothermal energy (the earth’s internal heat gen-erated from radioactive decay) . These renewable energy resources have many advantages over fossil fuels: They are available almost everywhere on earth and do not deplete . Broadly speaking, renewable energy systems are characterized by high investment costs and low operational costs, since operating a power plant often does not require any further resources (except of course maintenance) . Energy from fossil fuels in contrast is characterized by lower investment cost and higher operational costs . Con-vertedintodifferentusefulformsoffinalenergy(e.g.mechanical,electri-cal or useful heat), renewable energy can play an important role in the agri-cultural and food sector . Particularly in remote rural areas in »
AUTHORS Ramchandra Bhandari (TH Köln – University of Applied Sciences)
David Arndt (TH Köln – University of Applied Sciences)
Günther Straub (TH Köln – University of Applied Sciences)
MATERIALS Please find below links to our materials and references
Videowww .giz .de/gc21/pa_video_lectures
Additional Materialwww .giz .de/gc21/pa_additional_material
Top5 Team Assignmentswww .giz .de/gc21/pa_assignments
Referenceswww .giz .de/gc21/pa_references
SUSTAINABLE ENERGY FOR FOOD – Massive Open Online Course – Reader
CHAPTER B | UNIT B1 | RENEWABLE ENERGY RESOURCES AND TECHNOLOGY 20
developing and emerging economies, where agriculture often is an import-ant income generating sector and grid access is not a given, renewables can provide access to modern energy for farmers and agribusiness, and even replace existing fossil fuels with more sustainable energy systems .
Unit B1.1 | Renewable Energy and Agricultural Value ChainsToday most energy inputs are based on fossil fuels such as oil, coal or natu-ral gas . This is one reason why agriculture accounts for about 12 percent of global GHG emission (IPCC, 2014) .
Most likely more energy will be needed to support agriculture becoming more resilient to more extreme weather events (Unit A2 gives more informa-tion on the agriculture and climate relationship) .
Even though, most farmers or businesses in developed or developing coun-triesmayonlygainfew,ifany,directbenefitsfromsimplyreducingtheirGHGemissions-thenumerousco-benefitsofatechnologyshifttowardsrenewableenergy makes the topic attractive and rethinking current energy use worth-while.Thismightnotonlyhelptoreduceemissionsbutalsotobenefitfrompotential cost savings, improving health, local employment opportunities, improvedindependencyandmanyotherbeneficialeffects(Simsetal.,2015).
By presenting renewable energy resources and technologies, Chapter B marks the start of a technical perspective on the Nexus, providing concrete approaches for clean energy solutions for agricultural value chains .
To identify opportunities for using renewable energy in agricultural pro-cesses, it is useful to analyze the whole value chain of a product or service . Figure B1 shows a common agricultural value chain [» Unit A1.3] with eight different steps . Each of the steps needs an energy input of some sort; for example electricity or fuels for pumping, transportation or milling . The value chain analysis method provides a simple approach to not only identify energy inputs, but to also identify opportunities for using waste products or waste energy for another step along the value chain . To clarify this approach, let us take a look at the milk production value chain .
CLOSE-UP Definition
Renewableenergycanbedefinedas“energy that is collected from resources which are naturally replen-ished on a human timescale, such as sunlight, wind, rain, tides, waves, and geothermal heat .“ (Ellabban et al ., 2014)
MORE TO LEARN Opportunities for Agri-Food Chains to Become Energy-Smart (PDF) (Sims et al ., 2015)
» Unit A2

SUSTAINABLE ENERGY FOR FOOD – Massive Open Online Course – Reader
CHAPTER B | UNIT B1 | RENEWABLE ENERGY RESOURCES AND TECHNOLOGY 21
Unit B1.1.1 | Example: Milk Value ChainMilk production is resource intensive in terms of energy inputs and water consumption . Value chains differ based on the country, as well as on the farmer . Consumption of water and energy depend on land conditions, the manner of feeding and milk processing . There are large differences in energy use in the post-harvest stages of milk production in particular .
However, the example (Figure B2) shows that energy input appears in differ-entforms.Thefirstenergyinputisrequiredduringlandpreparationforgraz-ing; fertilizer and irrigation are required . During the feeding process, fuels are used to power machinery to prepare land for feed production, transportation and processing of feed . Especially on farms with larger quantities of live-stock, milking is often mechanized and therefore electricity and sometimes heat are needed . Similar requirements can be observed during cooling, transportation and processing of milk . Requirements differ slightly for other dairy products .
Figure B1 | Agricultural Value Chains (Sims et al., 2015)
Figure B2 | Steps Along a Milk Value Chain and Energy Inputs (adopted from Sims et al., 2015)

SUSTAINABLE ENERGY FOR FOOD – Massive Open Online Course – Reader
CHAPTER B | UNIT B1 | RENEWABLE ENERGY RESOURCES AND TECHNOLOGY 22
Many of these energy inputs are fossil fuel based . Alternative energy sources for milk production, which are solely based on renewables, are shown in Figure B3 .
Energy Demands
Energy Efficiency Options
Renewable Energy Options
Relevance for the Energy Agriculture Nexus
PRODUCTION Animal feed production from grazing and crops
Fertilizer use Precision application Organic fertilizers
Use of crop residues for heat and power
Feed may be produced off-farm and brought in thereby incurring additional transport costs
Tractor and Machinery performance
Fuelefficienttractors (European standard) Operator education
Biodiesel powered tractors and harvesters
A number of fuel saving options are under the opera-tors’ control
Irrigation Apply water only as needed Proper pump/motor sizing according to water demands . GPS sprinkler controls
Solar/wind water pumping . Biodiesel-fueled engines for driving pumps
Drip irrigation may be suitable for row crops but not for pas-ture
On-farmmilking
Milk harvesting
Variable speed drive motors on vacuum and milk pumps
Biogas from anaerobic digestion of manure for heat and electricity
Biogas option depends on scale and cost of labor to maintain and operate the plant
Milk cooling
Pre-cooling of milk and heat exchanger for hot water
Standard practice to pre-cool milk before storing in refriger-ated milk tank ready for col-lection On small-scale, milk kept cool in churns by spray-ing with cold water
PROCESSINGThermaltreatment
Pasteuriza-tion, ther-mization, and homog-enization
Real time monitoring of heat energy use . Recovering steam for heating . Recovering waste heat from milk chillers
Concentrating solar power (CSP) or bioenergy for heat generation . Evaporative cool-ers using solar PV panels
Wide range of standard energy efficiencyoptionsformotors,fans
Drying and cooling
Improved technological designs of dryers
PV-powered refrigerators (solar chillers) . Bioenergy heat such as from wood pellets
Drying for milk powder produc-tion requires high tempera-tures and a reliable heat supply
Water usage Water used in clean-ing-in- place (CIP)
Water recycling and re-use . Using on-demand hot water systems rather than storage tanks
Wastewater produced from dairy processing can be recy-cled to produce biogas for heat, electricity or transport fuels
Raw biogas is corrosive and can therefore be scrubbed of H2S for use in engines
TRANSPORTDiesel fuel use
Implementing sustainability measures (such as EURO standard vehicles) . Route opti-mization . Reducing idle time . Selecting optimum truck size for the load . Driver education
Liquid biofuel or biogas-pow-ered vehicles . Heavy duty electric vehicles beginning to reach the market
Good truck operators use less fuel . Driver training courses exist
Figure B3 | Alternative Energy Sources for Milk Production (Sims et al., 2015)

SUSTAINABLE ENERGY FOR FOOD – Massive Open Online Course – Reader
CHAPTER B | UNIT B1 | RENEWABLE ENERGY RESOURCES AND TECHNOLOGY 23
As indicated in Figure B3 there are many possibilities to add value to agricul-tural products by using renewable energy . In some cases, renewable energy technologies provide basic energy access (e .g . for irrigation water pumping) or replace existing diesel generators and thereby contribute to avoiding fuel transport and costs . In other cases, the renewable energy source is an inte-gral part of the whole production, particularly when waste from production can be used directly as an energy source . An integrated energy source will eventually reduce waste, costs and increase the sustainability [» Unit B3.4] of a product or process .
To optimize the design of a sustainable process within an agricultural value chain, it is essential to assess the situation holistically: starting from explor-ing the region and location where the process will be based, and concluding by optimizing individual process parameters (week 4). Some project planners even adjust processing temperatures or similar central parameters to meet theneedsoftheavailableenergysourceinanoptimalway.Thereforethefirststep towards a holistic integration of clean energy solutions for agriculture is essentially about understanding the origins of energy resources . In addition it is important to understand the minutiae of agricultural production and their implications for energy requirements . The next unit will start with a brief sum-mary of renewable energy resources, as well as an overview of technologies used to transform these resources to energy that can actually be used .
Unit B1.1.2 | Renewable Energy ResourcesThere are three sources for renewable energy on our planet, earth: solar radi-ation, heat from the earth’s core (geothermal energy) and gravitational force resulting from planetary movements (tidal power) . Energy resulting from solar radiation accounts for about 99 .9 percent of all energy available on earth, as wind, biomass (photosynthesis) and water are results of solar radi-ation . With the help of suitable technologies, each of these resources can be converted into useful energy - some examples include: electricity, biogas, heating, cooling and mechanical energy .
Every year the earth receives much more solar energy than the world’s annual energy demand . It is even higher than the total known fossil fuel reserves, as illustrated in Figure B4 . However, due to technological limita-tions and economic reasons, our global energy supply today is dominated by fossil fuels . Nevertheless, renewable energy technologies are being devel-oped and implemented at a faster pace than ever before . Even if renewable energy resources are distributed throughout the world, location is a crucial factor when deciding which resource should be applied at what intensity .

SUSTAINABLE ENERGY FOR FOOD – Massive Open Online Course – Reader
CHAPTER B | UNIT B1 | RENEWABLE ENERGY RESOURCES AND TECHNOLOGY 24
Solar and wind energy resources are intermittent in nature - this indicates that not all resources are suitable for each location, purpose or application . Hencesite-specificanalysisisalsocrucial.Inthecaseofsolarenergy,equa-torial regions are more suitable than far northern and southern regions . Fig-ure B5 shows average solar radiation for different regions on earth .
Figure B4 | Comparing Finite and Renewable Global Energy Reserves (Perez & Perez, 2009)
Figure B5 | Spatially Resolved Solar Irradiance (Loster, 2010)

SUSTAINABLE ENERGY FOR FOOD – Massive Open Online Course – Reader
CHAPTER B | UNIT B1 | RENEWABLE ENERGY RESOURCES AND TECHNOLOGY 25
Generally speaking, every location has some sort of renewable energy poten-tial . Sometimes this potential is directly visible and at other times different resources must be combined . However, there is almost always a way to tap nature’s vast energy supply .
RECAP• Renewableenergycansupportfarmersinruralremoteareasofmany
developing countries to increase agricultural productivity and income . adding value (e .g . irrigating and drying fruits and vegetables, cheese pro-duction)
• ThereisplentyofpotentialtouseREsintheagriculturalvaluechain.Theyoften have many advantages compared to conventional technologies like diesel generators .
• IntegratingREintoagriculturalprocessescanleadtohigherefficiency,lower environmental impact and lower production costs .
• ThereisalwayssomesortofREresourceavailableinanylocation,butitis essential to choose an adequate source or a good combination of sources .

SUSTAINABLE ENERGY FOR FOOD – Massive Open Online Course – Reader
CHAPTER B | UNIT B1 | RENEWABLE ENERGY RESOURCES AND TECHNOLOGY 26
Unit B1.2 | Introduction to Energy Resources and TechnologiesThis unit will give a short overview of different technologies suitable to har-ness renewable energy resources and will introduce practical examples for agricultural uses . Wind energy, bioenergy, solar- thermal, solar photovoltaics (PV) as well as hydropower will be explained in this unit .
All energy sources can be transformed into electricity, which is the most ver-satile form of energy . It can be used to power machinery, for heating or cool-ing processes, for lightning or powering electronic devices such as pumps . Transformation of energy always entails power losses, so it is important to consider which energy form best suits the purpose .
Conversion to Most Applied Technologies and Applications Relevance for Agricultural Value ChainsSolar Energy • Heat
• Mechanical• Energy• Electricity
• Photovoltaic(PV)drivenpumps• Crops,dryingoffruits/spices,ice-
making and cold storage (through absorption or heat driven refrigeration)
• PVsystemsarelimitedtoagriculturalactivities that only require little power
• FAOprovidesaninventoryofPVapplica-tions
Wind Energy • Mechanical• Energy• Electricity
• Directuse:grinder,mills,mechanicalwater pumps
• Electricalwaterpumps
• Optionforenergy-intensiveprocessingactivities
Micro Hydro Energy
• Mechanical• Energy• Electricity
• Directuse:mill,grinder• Electricalmotorforprocessing
• Optionforenergy-intensiveprocessingactivities
Biomass Energy
• Heat• Electricity• LiquidBiofuels
Biogas
• Dryer(fruits,herbs,spices)• Fermenter(tea)• Combustionmotororelectricmotor
(fuels like ethanol and biodiesel for transportation)
• Anaerobicdigester:biogasforlighting,cooking and heating and industrial bio-gas for decentralized electricity
• Biomassisorganicmaterialusedtogen-erate electricity, to produce heat or bio-fuels for transportation .
• Bioenergyisderivedfromwood,agricul-tural crops, residues, animal by-products, agri-industrial by-products .
Hybrid Power Systems
• Combinefossilfuel-firedgener-ators with wind or solar electri-cal power
• Wind/PVHybrid• Wind/DieselHybrid(s)• Usedinthefood-processingsector
(grinding of corn, wheat and millet, and milling of grain-hulling paddy)
• Togethertheyprovideamorereliableand cost- effective power system than is possible with either wind, solar or diesel alone .
• Anemergingtechnology
Figure B6 | Renewable Energies and its Relevance for Agricultural Value Chains

SUSTAINABLE ENERGY FOR FOOD – Massive Open Online Course – Reader
CHAPTER B | UNIT B1 | RENEWABLE ENERGY RESOURCES AND TECHNOLOGY 27
Unit B1.2.1 | HydropowerWorldwide hydropower is the most widely used renewable energy resource duetoitssignificantadvantagesoverotherrenewableresources:highenergy density, low cost and reliability in particular . Hydropower plants are available from very small sizes of only few Kilowatts (kW) to multi-Gigawatts (GW) . Small hydropower plants, generally in kW range, are used for rural electrificationinmanycountries.Thegeneratedelectricitycanbeusedalongthe agricultural value chain .
Hydropower, especially small-scale hydropower (up to 1 MW), works accord-ing to a simple principle: water from streams or rivers runs through a turbine, the turbine rotates and turns tools (pumps, mills etc .) or a generator, which can produce electricity . In order to achieve reliable energy production it is important to have good knowledge about local water resources and to design the system accordingly .
Figure B7 illustrates a typical small-scale hydropower system . Its main com-ponents are: the weir (where water is raised) and diverted from the main river; the fore bay where it is collected and usually gutted and the penstock pipe, which leads the water into the power house . Inside the power house the turbine and usually a generator, is located .
POWER EQUATION P = p*Q*g*h*ηP = power [W]q=waterflowrate[m3/s]h = head (falling height) [m]p = density of water (1000[kg/m3])g = gravitational force, 9 .81 [m/s2]η=efficiencyofthesystem,usually
between 50 percent and 75 per-cent for micro/small hydro
Figure B7 | Schematic of a Small Scale Hydropower System (adopted from Schnitzer, 2009)
Small Scale Hydropower Plant in Tajikistan (UNDP/Flickr)

SUSTAINABLE ENERGY FOR FOOD – Massive Open Online Course – Reader
CHAPTER B | UNIT B1 | RENEWABLE ENERGY RESOURCES AND TECHNOLOGY 28
The theoretical power output of such a hydropower system can be esti-matedbymultiplyingthewaterflowoftheintakebytheheightdifferencefromintaketotheturbine,thesystem’sefficiency,aswellassomeconstants(see Box) . An annual or daily energy yield can be estimated by further multi-plying the power output by the number of hours the system is running during this period . An alternative hydropower is smart hydro (an in-stream turbine) . However, this type has not yet been commercially used on a wider scale .
System Example: Smart Hydropower (In-Stream-Turbine)The Smart Hydropower turbine was developed to produce a maximum amountofelectricalpowerwiththekineticenergyofflowingwater.Becauseit is powered by kinetic energy and not with potential energy, it is known as a so-called “zero-head” or “in-stream” turbine . No dams and/or height differ-ences are required to operate this device; the river’s course remains in its natural state and no high investments in infrastructure are required . Because the amount of kinetic energy (velocity) varies from river to river, the capacity of an in-stream turbine ranges from a minimum of a few watts to a maxi-mum of 5 kW .
Unit B1.2.2 | Wind EnergyHumankind has been using wind energy since ancient times - to sail, pump water and mill . Today modern wind turbines (Figure B8) also produce elec-tricity as well . The global application of wind energy has increased almost exponentially over the past years .
Wind, the result of global and local temperature differences, represents another source of renewable energy . The governing principle of wind energy is the transformation of wind flowsintorotationalmovements.This follows the same principle as hydropower systems . The power output of a wind energy system is generally estimated by multiplying the available wind speed by the area swept by the rotor (see MORE TO LEARN) . Similar to hydropower, the rotational force can be used either directly (irrigation pumps, mills etc .)
CLOSE-UP Complete Guide to Micro Hydro Power
Micro Hydro Power Scout Guide (PDF) (Schnitzer, 2009)
MORE TO LEARN Micro Hydro Power Introduction Video (10min)
Smart Hydro Power Video
Figure B8 | Modern Wind Turbine (MW Class) (Bhandari, 2016)
Swept area
Hub height
MORE TO LEARN Wind Energy Introduction
Animated Wind Pump
Energy Yield Calculation
POWER EQUATION P = 0.5*p*A*v³*Cp*ηP = power [W]A = swept area of blades [m2]v = wind speed at hub height [m/s]p = density of air (1,29[kg/m3])Cp=powercoefficientη=systemefficiency
SUSTAINABLE ENERGY FOR FOOD – Massive Open Online Course – Reader
CHAPTER B | UNIT B1 | RENEWABLE ENERGY RESOURCES AND TECHNOLOGY 29
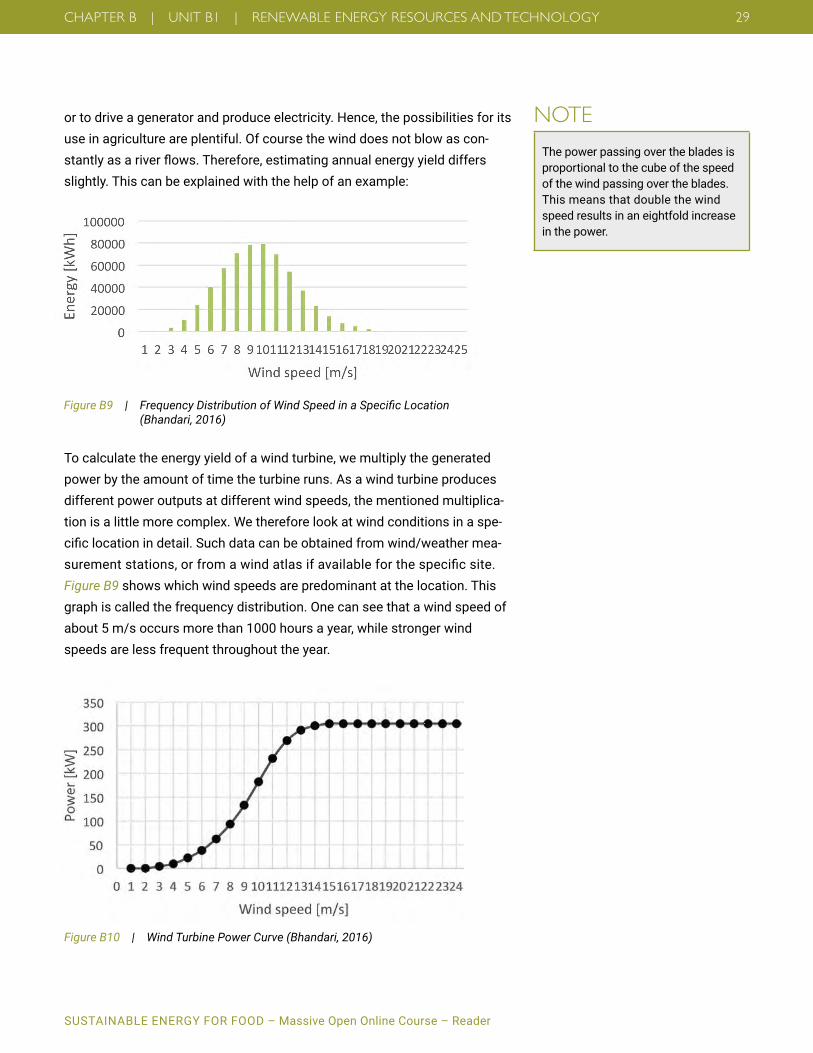
or to drive a generator and produce electricity . Hence, the possibilities for its use in agriculture are plentiful . Of course the wind does not blow as con-stantlyasariverflows.Therefore,estimatingannualenergyyielddiffersslightly . This can be explained with the help of an example:
To calculate the energy yield of a wind turbine, we multiply the generated power by the amount of time the turbine runs . As a wind turbine produces different power outputs at different wind speeds, the mentioned multiplica-tion is a little more complex . We therefore look at wind conditions in a spe-cificlocationindetail.Suchdatacanbeobtainedfromwind/weathermea-surementstations,orfromawindatlasifavailableforthespecificsite. Figure B9 shows which wind speeds are predominant at the location . This graph is called the frequency distribution . One can see that a wind speed of about 5 m/s occurs more than 1000 hours a year, while stronger wind speeds are less frequent throughout the year .
NOTE The power passing over the blades is proportional to the cube of the speed of the wind passing over the blades . This means that double the wind speed results in an eightfold increase in the power .
Figure B9 | Frequency Distribution of Wind Speed in a Specific Location (Bhandari, 2016)
Figure B10 | Wind Turbine Power Curve (Bhandari, 2016)

SUSTAINABLE ENERGY FOR FOOD – Massive Open Online Course – Reader
CHAPTER B | UNIT B1 | RENEWABLE ENERGY RESOURCES AND TECHNOLOGY 30
The second input for calculating the annual energy yield of a wind turbine is the power curve of the wind turbine we want to use . The power curve (Fig-ure B10)isspecifictoeveryturbinemodelandnormallyprovidedbythemanufacturer . It indicates at which wind speed the turbine generates power output . We then multiply the hours and the corresponding power output for every wind class (1 m/s; 2 m/s; 3 m/s . . .) . The result can be observed in Fig-ure B11 . Note that most of the annual energy is produced with a wind speed of 10 m/s even though wind speed of 5 m/s occurs most often . This is due to the power increasing with the cube of the wind speed (Take a look at the power equation above) .
To calculate the annual energy production (AEP) of the turbine, we sum up the energy yield (Ei) from every wind speed (fi × Pi) . These calculations can be done manually or with software (e .g . Excel):
Equation B1.I: Annual Energy Production
System Example: Wind Pump for IrrigationWind pumps have been used since the 9thcentury–toirrigatefieldsortodrain the land . Nowadays the technology is mostly used for pumping solu-tions (Figure B12) in areas without a grid connection but with steady wind conditions . The design of a wind pump always depends on the application . Firstly, a distinction between mechanical and electrical wind pumps has to be made . The disadvantage of electrical wind pumps is that they are normally lessefficient,buttheiradvantageispumpscanbeplacedatadistancefromthe wind turbine . To choose the right wind turbine, considerations about the desired pumping technology and extraction depth have to be made upfront .
Figure B11 | Energy Production per Wind Class (Bhandari, 2016)
Figure B12 | Wind Pump (Ben Franske/Wikimedia)
S.30 𝐴𝐴𝐴𝐴𝐴𝐴 = ∑ 𝐴𝐴𝑖𝑖 = ∑ 𝑓𝑓𝑖𝑖 × 𝐴𝐴𝑖𝑖 = [(372 ℎ × 0 𝑘𝑘𝑘𝑘) + (702 ℎ × 0 𝑘𝑘𝑘𝑘) + (941 ℎ × 4 𝑘𝑘𝑘𝑘) +(1077 ℎ × 10 𝑘𝑘𝑘𝑘) + (1107 ℎ × 22 𝑘𝑘𝑘𝑘) + ⋯ ] = 578355 𝑘𝑘𝑘𝑘ℎ S.34
𝐴𝐴𝑝𝑝𝑝𝑝𝑝𝑝𝑝𝑝 = 𝐴𝐴𝑑𝑑𝑝𝑝𝑑𝑑𝑝𝑝𝑑𝑑𝑑𝑑,𝑑𝑑𝑚𝑚𝑑𝑑𝑚𝑚ℎ𝑄𝑄 ∙ 𝐼𝐼𝑆𝑆𝑆𝑆𝑆𝑆
𝐺𝐺𝑚𝑚𝑚𝑚𝑚𝑚𝑝𝑝𝑡𝑡,𝑑𝑑𝑚𝑚𝑑𝑑𝑚𝑚ℎ
𝐴𝐴𝑝𝑝𝑝𝑝𝑝𝑝𝑝𝑝 = 𝐴𝐴𝑃𝑃𝑃𝑃𝑘𝑘 𝑝𝑝𝑝𝑝𝑝𝑝𝑃𝑃𝑝𝑝 𝑝𝑝𝑓𝑓 𝑡𝑡ℎ𝑃𝑃 𝐴𝐴𝑃𝑃 𝑃𝑃𝑝𝑝𝑝𝑝𝑃𝑃𝑎𝑎 𝑢𝑢𝑢𝑢𝑢𝑢𝑃𝑃𝑝𝑝 𝑆𝑆𝑡𝑡𝑃𝑃𝑢𝑢𝑢𝑢𝑃𝑃𝑝𝑝𝑢𝑢 𝑇𝑇𝑃𝑃𝑇𝑇𝑡𝑡 𝐶𝐶𝑝𝑝𝑢𝑢𝑢𝑢𝐶𝐶𝑡𝑡𝐶𝐶𝑝𝑝𝑢𝑢𝑇𝑇 [𝑘𝑘𝑝𝑝] 𝐴𝐴𝑑𝑑𝑝𝑝𝑑𝑑𝑝𝑝𝑑𝑑𝑑𝑑,𝑑𝑑𝑚𝑚𝑑𝑑𝑚𝑚ℎ = 𝑀𝑀𝑝𝑝𝑢𝑢𝑡𝑡ℎ𝑙𝑙𝑎𝑎 𝑃𝑃𝑢𝑢𝑃𝑃𝑝𝑝𝑒𝑒𝑎𝑎 𝑢𝑢𝑃𝑃𝑑𝑑𝑃𝑃𝑢𝑢𝑢𝑢 𝑝𝑝𝑓𝑓 𝑡𝑡ℎ𝑃𝑃 𝑇𝑇𝑎𝑎𝑇𝑇𝑡𝑡𝑃𝑃𝑑𝑑 [𝑘𝑘ℎ]
𝑄𝑄 = 𝑆𝑆𝑎𝑎𝑇𝑇𝑡𝑡𝑃𝑃𝑑𝑑 𝑞𝑞𝑢𝑢𝑃𝑃𝑙𝑙𝐶𝐶𝑡𝑡𝑎𝑎 𝑓𝑓𝑃𝑃𝑓𝑓𝑡𝑡𝑝𝑝𝑝𝑝 (𝑏𝑏𝑃𝑃𝑡𝑡𝑝𝑝𝑃𝑃𝑃𝑃𝑢𝑢 40 𝑃𝑃𝑢𝑢𝑢𝑢 70% 𝑓𝑓𝑝𝑝𝑝𝑝 𝑝𝑝𝑓𝑓𝑓𝑓 𝑒𝑒𝑝𝑝𝐶𝐶𝑢𝑢 𝑝𝑝𝑝𝑝𝑝𝑝𝑝𝑝𝑃𝑃𝑓𝑓𝑡𝑡𝑇𝑇) [%] 𝐼𝐼𝑆𝑆𝑆𝑆𝑆𝑆 = 𝐼𝐼𝑝𝑝𝑝𝑝𝑃𝑃𝑢𝑢𝐶𝐶𝑃𝑃𝑢𝑢𝑓𝑓𝑃𝑃 𝑃𝑃𝑡𝑡 𝑆𝑆𝑡𝑡𝑃𝑃𝑢𝑢𝑢𝑢𝑃𝑃𝑝𝑝𝑢𝑢 𝑇𝑇𝑃𝑃𝑇𝑇𝑡𝑡 𝐶𝐶𝑝𝑝𝑢𝑢𝑢𝑢𝐶𝐶𝑡𝑡𝐶𝐶𝑝𝑝𝑢𝑢𝑇𝑇 [𝑘𝑘𝑘𝑘/𝑑𝑑2]
𝐺𝐺𝑚𝑚𝑚𝑚𝑚𝑚𝑝𝑝𝑡𝑡,𝑑𝑑𝑚𝑚𝑑𝑑𝑚𝑚ℎ = 𝑀𝑀𝑝𝑝𝑢𝑢𝑡𝑡ℎ𝑙𝑙𝑎𝑎 𝑡𝑡𝑝𝑝𝑡𝑡𝑃𝑃𝑙𝑙 𝑇𝑇𝑝𝑝𝑙𝑙𝑃𝑃𝑝𝑝 𝑝𝑝𝑃𝑃𝑢𝑢𝐶𝐶𝑃𝑃𝑡𝑡𝐶𝐶𝑝𝑝𝑢𝑢 𝑝𝑝𝑢𝑢 𝑑𝑑𝑝𝑝𝑢𝑢𝑢𝑢𝑙𝑙𝑃𝑃 𝑝𝑝𝑙𝑙𝑃𝑃𝑢𝑢𝑃𝑃 [𝑘𝑘𝑘𝑘ℎ/𝑑𝑑²]
S.35
𝐴𝐴𝑝𝑝𝑝𝑝𝑝𝑝𝑝𝑝 = 2790 𝑘𝑘ℎ0.5 ∙
1 𝑘𝑘𝑘𝑘𝑑𝑑2
25 𝑘𝑘𝑘𝑘ℎ𝑑𝑑2
= 223.2 𝑘𝑘
S.35
𝐵𝐵𝑓𝑓 (𝑘𝑘ℎ) = 𝐴𝐴𝑑𝑑𝑝𝑝𝑑𝑑𝑝𝑝𝑑𝑑𝑑𝑑,𝑑𝑑𝑝𝑝𝑑𝑑(𝑘𝑘ℎ)
𝐵𝐵𝑃𝑃𝑡𝑡𝑡𝑡𝑃𝑃𝑝𝑝𝑎𝑎 𝑢𝑢𝑃𝑃𝑝𝑝𝑡𝑡ℎ 𝑝𝑝𝑓𝑓 𝑢𝑢𝐶𝐶𝑇𝑇𝑓𝑓ℎ𝑃𝑃𝑝𝑝𝑒𝑒𝑃𝑃 (%) ∙ 𝐴𝐴𝑢𝑢𝑡𝑡𝑝𝑝𝑢𝑢𝑝𝑝𝑑𝑑𝑎𝑎 𝑢𝑢𝑃𝑃𝑎𝑎𝑇𝑇 (𝑢𝑢𝑃𝑃𝑎𝑎)𝑂𝑂𝑂𝑂𝑃𝑃𝑝𝑝𝑃𝑃𝑙𝑙𝑙𝑙 𝑏𝑏𝑃𝑃𝑡𝑡𝑡𝑡𝑃𝑃𝑝𝑝𝑎𝑎 𝑇𝑇𝑎𝑎𝑇𝑇𝑡𝑡𝑃𝑃𝑑𝑑 𝑃𝑃𝑓𝑓𝑓𝑓𝐶𝐶𝑓𝑓𝐶𝐶𝑃𝑃𝑢𝑢𝑓𝑓𝑎𝑎 (%)
𝐵𝐵𝑓𝑓 = 90 𝑘𝑘ℎ80% ∙ 3
80% = 422 𝑘𝑘ℎ S.39
𝐴𝐴𝑝𝑝𝑝𝑝𝑝𝑝𝑝𝑝 = 8.0 ×𝐻𝐻𝑆𝑆 × 𝑃𝑃𝑑𝑑𝑝𝑝𝑑𝑑𝐺𝐺𝑚𝑚𝑚𝑚𝑚𝑚𝑝𝑝𝑡𝑡,𝑑𝑑𝑝𝑝𝑑𝑑
𝑃𝑃𝑑𝑑𝑝𝑝𝑑𝑑 = 𝐷𝐷𝑃𝑃𝐶𝐶𝑙𝑙𝑎𝑎 𝑓𝑓𝑝𝑝𝑝𝑝𝑝𝑝 𝑝𝑝𝑃𝑃𝑡𝑡𝑃𝑃𝑝𝑝 𝑝𝑝𝑃𝑃𝑞𝑞𝑢𝑢𝐶𝐶𝑝𝑝𝑃𝑃𝑑𝑑𝑃𝑃𝑢𝑢𝑡𝑡 (𝑑𝑑3/𝑢𝑢𝑃𝑃𝑎𝑎) 𝐻𝐻𝑆𝑆 = 𝑇𝑇𝑝𝑝𝑡𝑡𝑃𝑃𝑙𝑙 𝑝𝑝𝑢𝑢𝑑𝑑𝑝𝑝𝐶𝐶𝑢𝑢𝑒𝑒 ℎ𝑃𝑃𝑃𝑃𝑢𝑢 (𝑑𝑑)
𝐺𝐺𝑚𝑚𝑚𝑚𝑚𝑚𝑝𝑝𝑡𝑡,𝑑𝑑𝑝𝑝𝑑𝑑 = 𝑀𝑀𝑃𝑃𝑃𝑃𝑢𝑢 𝑢𝑢𝑃𝑃𝐶𝐶𝑙𝑙𝑎𝑎 𝑒𝑒𝑙𝑙𝑝𝑝𝑏𝑏𝑃𝑃𝑙𝑙 𝑇𝑇𝑝𝑝𝑙𝑙𝑃𝑃𝑝𝑝 𝑝𝑝𝑃𝑃𝑢𝑢𝐶𝐶𝑃𝑃𝑡𝑡𝐶𝐶𝑝𝑝𝑢𝑢 𝑓𝑓𝑝𝑝𝑝𝑝 𝑡𝑡ℎ𝑃𝑃 𝑢𝑢𝑃𝑃𝑇𝑇𝐶𝐶𝑒𝑒𝑢𝑢 𝑑𝑑𝑝𝑝𝑢𝑢𝑡𝑡ℎ (𝑘𝑘𝑘𝑘ℎ/𝑑𝑑². 𝑢𝑢𝑃𝑃𝑎𝑎) 𝐴𝐴𝑝𝑝𝑝𝑝𝑝𝑝𝑝𝑝 = 𝑆𝑆𝑝𝑝𝑙𝑙𝑃𝑃𝑝𝑝 𝑝𝑝𝑃𝑃𝑢𝑢𝑃𝑃𝑙𝑙 𝑝𝑝𝑝𝑝𝑝𝑝𝑃𝑃𝑝𝑝 (𝑘𝑘𝑝𝑝)

SUSTAINABLE ENERGY FOR FOOD – Massive Open Online Course – Reader
CHAPTER B | UNIT B1 | RENEWABLE ENERGY RESOURCES AND TECHNOLOGY 31
Centrifugal pumps generally work better with faster rotating wind turbines while piston and diaphragm pumps work better with slow rotating turbines . Inoff-gridareaswherethereissufficientwind(>5m/s)andgroundwatersupply, wind pumps often offer a cost-effective method for domestic and community water supply, small-scale irrigation and livestock water use . To select a suitable wind pump, the following information is needed: mean wind speed, total pumping head, daily water requirement, well draw down, water quality and storage requirements (GTZ, 2007) .
Unit B1.2.3 | BioenergyGenerally all bioenergy resources are all energy resources derived from bio-logical origin . They can be in solid, liquid or gaseous form . Contrary to coal or gas, which were created over a long timescale (millions of years), they are basically biological material derived from living or recently living organisms . Bio-fuelsaregenerallydefinedasliquidfuelsderivedfrombiomass.Exam-ples include ethanol produced from sugar cane, bio-diesel produced from rapeseed or Jatropha .
Biomass is often further processed (Figure B13 and B14) to increase the energydensity,whichsimplifiesitstransportationandusage.Biofuelscanbe used in many ways e .g . for heating, cooking, processing, cooling or as a directpetrolreplacement.Therefore,thefieldofbioenergyincludesmanyaspects and can be as simple as burning wood in a stove or very sophisti-cated such as biogas plants for power production . Bioenergy technologies are especially useful when waste products of agricultural production can be used for power production processes . The generation of biogas from agri-cultural residues like crops (straw and husk), animal husbandry (manures andslurries)orotherorganicmaterialfromexcessproductionorinsufficientmarket (fruit processing residues, grass silage), is most common . The idea is to have as little waste as possible and therefore a high utilization of resources . Circular economy concepts like cradle-to- cradle [» Unit C1.2] often involve bioenergy as a core technology . An overview of different ways to convert biomass into biofuels/bioenergy can be seen in Figure B14 and details on this topic will be presented in Unit B2 [» Unit B2] .
NOTE Bioenergy vs. Biofuel
Bioenergy is energy derived from bio-logical resources . It can be in solid (e .g . wood), liquid (e .g . ethanol) or gaseous (e .g . biogas) form .
Generally biofuel refers to liquid (or gaseous) fuel derived from bioenergy resources (e .g . ethanol from corn or sugar cane)
Bioenergy Biological sources End-EnergyConversionPreparation
Figure B13 | Small Biogas Plant and Stove (Dishna Schwartz/GTZ)
» Unit B2

SUSTAINABLE ENERGY FOR FOOD – Massive Open Online Course – Reader
CHAPTER B | UNIT B1 | RENEWABLE ENERGY RESOURCES AND TECHNOLOGY 32
Figure B14 | Bioenergy Conversion Pathways (REN21, 2015)
System Example: Biogas-Powered Evaporative Cooling The University of Georgia Research Foundation (UGARF) has developed a refrigeration unit powered on biogas that is generated from cow manure . (Figure B15) The unit regenerates zeolite plates, which retain their capacity
to capture water vapor from the evaporative milk chilling process . Partnered with Smallholder For-tunes,UGARFisrefiningthedesignof the refrigeration unit, and testing it with farmers in Uganda . The refrigeration device increases agri-cultural value and productivity by decreasing milk spoilage .
Figure B15 | Evaporative Cooling Project (Powering Ag)
MORE TO LEARN Lecture on Bioenergy Video
Circular Economy Video
EXPLORE MORE HERE

SUSTAINABLE ENERGY FOR FOOD – Massive Open Online Course – Reader
CHAPTER B | UNIT B1 | RENEWABLE ENERGY RESOURCES AND TECHNOLOGY 33
Unit B1.2.4 | Solar ThermalSolar thermal technologies (Figures B16 and B17) harness solar energy for thermalenergyuse(heatorcooling).Thetechnologiesarecomprisedofflatplate collectors for low temperature applications . Examples are solar water heaters, solar air heaters for space heating or drying . The concentrating col-lectors are used for high temperature application (e .g . power production) . In this case, incident solar radiation on a larger surface area is concentrated to areceiverwithasmallersurfaceareausingreflectingmirrors.Comparedtosimpleflatplatecollectoruse,theseconcentratingpowerplantsaremorecomplex . Solar cooking has also been practiced in many countries, though still on a pilot scale . Most common agricultural practice of solar thermal energy use is solar drying .
System Example: Sunchill™ Agricultural Product RefrigerationSunChill™ (Figures B18 and B19) is a novel, off-grid refrigeration solution enablingincreasedagriculturalproductivityby:(i)removingfieldheatfromcrops immediately following harvest (ii) providing continued product cooling at local markets and/or central processing facilities . This clean energy solu-tion transforms 50°C solar thermal energy into 10°C refrigeration using solid refrigerants and local, non-precision components . These characteristics enable production of a low cost, low-maintenance technology that reduces spoilageandbenefitsthelivelihoodsofsmallholderfarmers.
MORE TO LEARN Solar Collectors
Solar Water Heater Overview by Brian Norton
Figure B18 | Sunchill (Powering Ag)
Figure B17 | Process in a Solar Flat Plate Collector (Blue=Cold Liquid, Red=Hot Liquid) (Bhandari, 2016)
Figure B16 | Solar Thermal Collector for Water Heating (Cachogaray/Wikimedia)
EXPLORE MORE HERE

SUSTAINABLE ENERGY FOR FOOD – Massive Open Online Course – Reader
CHAPTER B | UNIT B1 | RENEWABLE ENERGY RESOURCES AND TECHNOLOGY 34
Unit B1.2.5 | Solar Photovoltaics (PV)Solar PV is one of the most popular renewable energy technologies . So far it has only been applied on a large-scale in developed countries, mainly for electricity generation and supply to the grid . In developing countries solar PVhasbeenusedinoff-gridapplication,mainlyforruralelectrification.Off-grid systems work independently, with the help of battery storage systems . The use of PV could be expanded beyond lighting, to different agri-process-ing activities in many countries, for example powering of small loads used in agri-enterprises, like water pumping or product cooling .
Solar PV is a technology that uses solar cells for energy production . They are made of semi-conductor materials to convert sunlight directly into electric-ity.Whensunlightisabsorbedbythesematerials,itcauseselectronstoflowthrough the conductors generating electric current .
Solar cells produce direct current (DC) electricity . There are two broad cate-goriesofsolarcells-crystallineandthinfilm.Thekeycomponentsofapho-tovoltaic power system are solar cells interconnected to form a photovoltaic module (the commercial product), mounting structure for the modules or array (several modules mounted and interconnected together to produce a desired voltage and current (power capacity), inverter (essential for grid-con-nected systems and required for many off-grid systems), storage battery and charge controller (for off-grid systems only) .
Performance of PV modules depends on the amount of solar irradiation received on the module surface, which varies with location and season . For thisreason,systemsnormallyneedtobecarefullydesignedforspecificsites . Let us have a look at an example below on how to calculate a required PV system size to supply a demand (load) .
Equation B1.II: Required Peak Power of PV Module
CLOSE-UP ENERGY 101: SOLAR – PV Video (2 min)
Solar power: An Introduction Video (10 min)
NOTE Bioenergy vs. Biofuel
Depending on the project size, accu-rate system sizing could be complex and might require deep knowledge of the technology . However, for many small applications, it can be done in a simple way making it a cost-competi-tive alternative .
Figure B19 | PV modules (David Shankbone/ Wikimedia)
S.30 𝐴𝐴𝐴𝐴𝐴𝐴 = ∑ 𝐴𝐴𝑖𝑖 = ∑ 𝑓𝑓𝑖𝑖 × 𝐴𝐴𝑖𝑖 = [(372 ℎ × 0 𝑘𝑘𝑘𝑘) + (702 ℎ × 0 𝑘𝑘𝑘𝑘) + (941 ℎ × 4 𝑘𝑘𝑘𝑘) +(1077 ℎ × 10 𝑘𝑘𝑘𝑘) + (1107 ℎ × 22 𝑘𝑘𝑘𝑘) + ⋯ ] = 578355 𝑘𝑘𝑘𝑘ℎ S.34
𝐴𝐴𝑝𝑝𝑝𝑝𝑝𝑝𝑝𝑝 = 𝐴𝐴𝑑𝑑𝑝𝑝𝑑𝑑𝑝𝑝𝑑𝑑𝑑𝑑,𝑑𝑑𝑚𝑚𝑑𝑑𝑚𝑚ℎ𝑄𝑄 ∙ 𝐼𝐼𝑆𝑆𝑆𝑆𝑆𝑆
𝐺𝐺𝑚𝑚𝑚𝑚𝑚𝑚𝑝𝑝𝑡𝑡,𝑑𝑑𝑚𝑚𝑑𝑑𝑚𝑚ℎ
𝐴𝐴𝑝𝑝𝑝𝑝𝑝𝑝𝑝𝑝 = 𝐴𝐴𝑃𝑃𝑃𝑃𝑘𝑘 𝑝𝑝𝑝𝑝𝑝𝑝𝑃𝑃𝑝𝑝 𝑝𝑝𝑓𝑓 𝑡𝑡ℎ𝑃𝑃 𝐴𝐴𝑃𝑃 𝑃𝑃𝑝𝑝𝑝𝑝𝑃𝑃𝑎𝑎 𝑢𝑢𝑢𝑢𝑢𝑢𝑃𝑃𝑝𝑝 𝑆𝑆𝑡𝑡𝑃𝑃𝑢𝑢𝑢𝑢𝑃𝑃𝑝𝑝𝑢𝑢 𝑇𝑇𝑃𝑃𝑇𝑇𝑡𝑡 𝐶𝐶𝑝𝑝𝑢𝑢𝑢𝑢𝐶𝐶𝑡𝑡𝐶𝐶𝑝𝑝𝑢𝑢𝑇𝑇 [𝑘𝑘𝑝𝑝] 𝐴𝐴𝑑𝑑𝑝𝑝𝑑𝑑𝑝𝑝𝑑𝑑𝑑𝑑,𝑑𝑑𝑚𝑚𝑑𝑑𝑚𝑚ℎ = 𝑀𝑀𝑝𝑝𝑢𝑢𝑡𝑡ℎ𝑙𝑙𝑎𝑎 𝑃𝑃𝑢𝑢𝑃𝑃𝑝𝑝𝑒𝑒𝑎𝑎 𝑢𝑢𝑃𝑃𝑑𝑑𝑃𝑃𝑢𝑢𝑢𝑢 𝑝𝑝𝑓𝑓 𝑡𝑡ℎ𝑃𝑃 𝑇𝑇𝑎𝑎𝑇𝑇𝑡𝑡𝑃𝑃𝑑𝑑 [𝑘𝑘ℎ]
𝑄𝑄 = 𝑆𝑆𝑎𝑎𝑇𝑇𝑡𝑡𝑃𝑃𝑑𝑑 𝑞𝑞𝑢𝑢𝑃𝑃𝑙𝑙𝐶𝐶𝑡𝑡𝑎𝑎 𝑓𝑓𝑃𝑃𝑓𝑓𝑡𝑡𝑝𝑝𝑝𝑝 (𝑏𝑏𝑃𝑃𝑡𝑡𝑝𝑝𝑃𝑃𝑃𝑃𝑢𝑢 40 𝑃𝑃𝑢𝑢𝑢𝑢 70% 𝑓𝑓𝑝𝑝𝑝𝑝 𝑝𝑝𝑓𝑓𝑓𝑓 𝑒𝑒𝑝𝑝𝐶𝐶𝑢𝑢 𝑝𝑝𝑝𝑝𝑝𝑝𝑝𝑝𝑃𝑃𝑓𝑓𝑡𝑡𝑇𝑇) [%] 𝐼𝐼𝑆𝑆𝑆𝑆𝑆𝑆 = 𝐼𝐼𝑝𝑝𝑝𝑝𝑃𝑃𝑢𝑢𝐶𝐶𝑃𝑃𝑢𝑢𝑓𝑓𝑃𝑃 𝑃𝑃𝑡𝑡 𝑆𝑆𝑡𝑡𝑃𝑃𝑢𝑢𝑢𝑢𝑃𝑃𝑝𝑝𝑢𝑢 𝑇𝑇𝑃𝑃𝑇𝑇𝑡𝑡 𝐶𝐶𝑝𝑝𝑢𝑢𝑢𝑢𝐶𝐶𝑡𝑡𝐶𝐶𝑝𝑝𝑢𝑢𝑇𝑇 [𝑘𝑘𝑘𝑘/𝑑𝑑2]
𝐺𝐺𝑚𝑚𝑚𝑚𝑚𝑚𝑝𝑝𝑡𝑡,𝑑𝑑𝑚𝑚𝑑𝑑𝑚𝑚ℎ = 𝑀𝑀𝑝𝑝𝑢𝑢𝑡𝑡ℎ𝑙𝑙𝑎𝑎 𝑡𝑡𝑝𝑝𝑡𝑡𝑃𝑃𝑙𝑙 𝑇𝑇𝑝𝑝𝑙𝑙𝑃𝑃𝑝𝑝 𝑝𝑝𝑃𝑃𝑢𝑢𝐶𝐶𝑃𝑃𝑡𝑡𝐶𝐶𝑝𝑝𝑢𝑢 𝑝𝑝𝑢𝑢 𝑑𝑑𝑝𝑝𝑢𝑢𝑢𝑢𝑙𝑙𝑃𝑃 𝑝𝑝𝑙𝑙𝑃𝑃𝑢𝑢𝑃𝑃 [𝑘𝑘𝑘𝑘ℎ/𝑑𝑑²]
S.35
𝐴𝐴𝑝𝑝𝑝𝑝𝑝𝑝𝑝𝑝 = 2790 𝑘𝑘ℎ0.5 ∙
1 𝑘𝑘𝑘𝑘𝑑𝑑2
25 𝑘𝑘𝑘𝑘ℎ𝑑𝑑2
= 223.2 𝑘𝑘
S.35
𝐵𝐵𝑓𝑓 (𝑘𝑘ℎ) = 𝐴𝐴𝑑𝑑𝑝𝑝𝑑𝑑𝑝𝑝𝑑𝑑𝑑𝑑,𝑑𝑑𝑝𝑝𝑑𝑑(𝑘𝑘ℎ)
𝐵𝐵𝑃𝑃𝑡𝑡𝑡𝑡𝑃𝑃𝑝𝑝𝑎𝑎 𝑢𝑢𝑃𝑃𝑝𝑝𝑡𝑡ℎ 𝑝𝑝𝑓𝑓 𝑢𝑢𝐶𝐶𝑇𝑇𝑓𝑓ℎ𝑃𝑃𝑝𝑝𝑒𝑒𝑃𝑃 (%) ∙ 𝐴𝐴𝑢𝑢𝑡𝑡𝑝𝑝𝑢𝑢𝑝𝑝𝑑𝑑𝑎𝑎 𝑢𝑢𝑃𝑃𝑎𝑎𝑇𝑇 (𝑢𝑢𝑃𝑃𝑎𝑎)𝑂𝑂𝑂𝑂𝑃𝑃𝑝𝑝𝑃𝑃𝑙𝑙𝑙𝑙 𝑏𝑏𝑃𝑃𝑡𝑡𝑡𝑡𝑃𝑃𝑝𝑝𝑎𝑎 𝑇𝑇𝑎𝑎𝑇𝑇𝑡𝑡𝑃𝑃𝑑𝑑 𝑃𝑃𝑓𝑓𝑓𝑓𝐶𝐶𝑓𝑓𝐶𝐶𝑃𝑃𝑢𝑢𝑓𝑓𝑎𝑎 (%)
𝐵𝐵𝑓𝑓 = 90 𝑘𝑘ℎ80% ∙ 3
80% = 422 𝑘𝑘ℎ S.39
𝐴𝐴𝑝𝑝𝑝𝑝𝑝𝑝𝑝𝑝 = 8.0 ×𝐻𝐻𝑆𝑆 × 𝑃𝑃𝑑𝑑𝑝𝑝𝑑𝑑𝐺𝐺𝑚𝑚𝑚𝑚𝑚𝑚𝑝𝑝𝑡𝑡,𝑑𝑑𝑝𝑝𝑑𝑑
𝑃𝑃𝑑𝑑𝑝𝑝𝑑𝑑 = 𝐷𝐷𝑃𝑃𝐶𝐶𝑙𝑙𝑎𝑎 𝑓𝑓𝑝𝑝𝑝𝑝𝑝𝑝 𝑝𝑝𝑃𝑃𝑡𝑡𝑃𝑃𝑝𝑝 𝑝𝑝𝑃𝑃𝑞𝑞𝑢𝑢𝐶𝐶𝑝𝑝𝑃𝑃𝑑𝑑𝑃𝑃𝑢𝑢𝑡𝑡 (𝑑𝑑3/𝑢𝑢𝑃𝑃𝑎𝑎) 𝐻𝐻𝑆𝑆 = 𝑇𝑇𝑝𝑝𝑡𝑡𝑃𝑃𝑙𝑙 𝑝𝑝𝑢𝑢𝑑𝑑𝑝𝑝𝐶𝐶𝑢𝑢𝑒𝑒 ℎ𝑃𝑃𝑃𝑃𝑢𝑢 (𝑑𝑑)
𝐺𝐺𝑚𝑚𝑚𝑚𝑚𝑚𝑝𝑝𝑡𝑡,𝑑𝑑𝑝𝑝𝑑𝑑 = 𝑀𝑀𝑃𝑃𝑃𝑃𝑢𝑢 𝑢𝑢𝑃𝑃𝐶𝐶𝑙𝑙𝑎𝑎 𝑒𝑒𝑙𝑙𝑝𝑝𝑏𝑏𝑃𝑃𝑙𝑙 𝑇𝑇𝑝𝑝𝑙𝑙𝑃𝑃𝑝𝑝 𝑝𝑝𝑃𝑃𝑢𝑢𝐶𝐶𝑃𝑃𝑡𝑡𝐶𝐶𝑝𝑝𝑢𝑢 𝑓𝑓𝑝𝑝𝑝𝑝 𝑡𝑡ℎ𝑃𝑃 𝑢𝑢𝑃𝑃𝑇𝑇𝐶𝐶𝑒𝑒𝑢𝑢 𝑑𝑑𝑝𝑝𝑢𝑢𝑡𝑡ℎ (𝑘𝑘𝑘𝑘ℎ/𝑑𝑑². 𝑢𝑢𝑃𝑃𝑎𝑎) 𝐴𝐴𝑝𝑝𝑝𝑝𝑝𝑝𝑝𝑝 = 𝑆𝑆𝑝𝑝𝑙𝑙𝑃𝑃𝑝𝑝 𝑝𝑝𝑃𝑃𝑢𝑢𝑃𝑃𝑙𝑙 𝑝𝑝𝑝𝑝𝑝𝑝𝑃𝑃𝑝𝑝 (𝑘𝑘𝑝𝑝)

SUSTAINABLE ENERGY FOR FOOD – Massive Open Online Course – Reader
CHAPTER B | UNIT B1 | RENEWABLE ENERGY RESOURCES AND TECHNOLOGY 35
We will now estimate the peak power of a system that is capable of power-ing a 30W (Watt) light bulb for 3 hours every day for one month in winter in Germany . Therefore, we estimate the required energy demand by multiplying 30W times 31 days times 3 hours, which equals 2790Wh in one month . This is the energy we demand from the PV system . We presume a quality factor (Q) of 50 percent for the system used . The quality factor depends on the overallperformanceofthePVsystemanditssystemconfiguration(higherfor grid connected systems and less for off-grid ones) . The total solar radia-tioninamonthisspecificforeachlocationontheglobe.ForBerlin,itisaround25 kWh/m2inDecember.Youcanfindthesemonthlyvaluesforyourlocation by using the NASA database (» Link) .
By using equation B1 .II, we can now calculate the PV size needed to supply light needed in December:
Equation B1.III: Required Peak Power for The Case Scenario
We chose the month of December, as it is the worst combination of demand and available radiation according to German weather conditions: high demand and low radiation, resulting in a bigger system size . However, with this size, we will now be able to easily supply the demand of additional months .
During night and also on cloudy days, there is no electricity generation from a PV system, so a battery should always be included . In our example we will take three autonomous days and calculate the storage battery size (Bc) needed .
Equation B1.IV: Estimation of Battery Capacity
If we choose a 12V battery, we would need about 35 Ah battery size . In grid-connected areas, we would not need any battery backup storage as a grid power supply is always available .
S.30 𝐴𝐴𝐴𝐴𝐴𝐴 = ∑ 𝐴𝐴𝑖𝑖 = ∑ 𝑓𝑓𝑖𝑖 × 𝐴𝐴𝑖𝑖 = [(372 ℎ × 0 𝑘𝑘𝑘𝑘) + (702 ℎ × 0 𝑘𝑘𝑘𝑘) + (941 ℎ × 4 𝑘𝑘𝑘𝑘) +(1077 ℎ × 10 𝑘𝑘𝑘𝑘) + (1107 ℎ × 22 𝑘𝑘𝑘𝑘) + ⋯ ] = 578355 𝑘𝑘𝑘𝑘ℎ S.34
𝐴𝐴𝑝𝑝𝑝𝑝𝑝𝑝𝑝𝑝 = 𝐴𝐴𝑑𝑑𝑝𝑝𝑑𝑑𝑝𝑝𝑑𝑑𝑑𝑑,𝑑𝑑𝑚𝑚𝑑𝑑𝑚𝑚ℎ𝑄𝑄 ∙ 𝐼𝐼𝑆𝑆𝑆𝑆𝑆𝑆
𝐺𝐺𝑚𝑚𝑚𝑚𝑚𝑚𝑝𝑝𝑡𝑡,𝑑𝑑𝑚𝑚𝑑𝑑𝑚𝑚ℎ
𝐴𝐴𝑝𝑝𝑝𝑝𝑝𝑝𝑝𝑝 = 𝐴𝐴𝑃𝑃𝑃𝑃𝑘𝑘 𝑝𝑝𝑝𝑝𝑝𝑝𝑃𝑃𝑝𝑝 𝑝𝑝𝑓𝑓 𝑡𝑡ℎ𝑃𝑃 𝐴𝐴𝑃𝑃 𝑃𝑃𝑝𝑝𝑝𝑝𝑃𝑃𝑎𝑎 𝑢𝑢𝑢𝑢𝑢𝑢𝑃𝑃𝑝𝑝 𝑆𝑆𝑡𝑡𝑃𝑃𝑢𝑢𝑢𝑢𝑃𝑃𝑝𝑝𝑢𝑢 𝑇𝑇𝑃𝑃𝑇𝑇𝑡𝑡 𝐶𝐶𝑝𝑝𝑢𝑢𝑢𝑢𝐶𝐶𝑡𝑡𝐶𝐶𝑝𝑝𝑢𝑢𝑇𝑇 [𝑘𝑘𝑝𝑝] 𝐴𝐴𝑑𝑑𝑝𝑝𝑑𝑑𝑝𝑝𝑑𝑑𝑑𝑑,𝑑𝑑𝑚𝑚𝑑𝑑𝑚𝑚ℎ = 𝑀𝑀𝑝𝑝𝑢𝑢𝑡𝑡ℎ𝑙𝑙𝑎𝑎 𝑃𝑃𝑢𝑢𝑃𝑃𝑝𝑝𝑒𝑒𝑎𝑎 𝑢𝑢𝑃𝑃𝑑𝑑𝑃𝑃𝑢𝑢𝑢𝑢 𝑝𝑝𝑓𝑓 𝑡𝑡ℎ𝑃𝑃 𝑇𝑇𝑎𝑎𝑇𝑇𝑡𝑡𝑃𝑃𝑑𝑑 [𝑘𝑘ℎ]
𝑄𝑄 = 𝑆𝑆𝑎𝑎𝑇𝑇𝑡𝑡𝑃𝑃𝑑𝑑 𝑞𝑞𝑢𝑢𝑃𝑃𝑙𝑙𝐶𝐶𝑡𝑡𝑎𝑎 𝑓𝑓𝑃𝑃𝑓𝑓𝑡𝑡𝑝𝑝𝑝𝑝 (𝑏𝑏𝑃𝑃𝑡𝑡𝑝𝑝𝑃𝑃𝑃𝑃𝑢𝑢 40 𝑃𝑃𝑢𝑢𝑢𝑢 70% 𝑓𝑓𝑝𝑝𝑝𝑝 𝑝𝑝𝑓𝑓𝑓𝑓 𝑒𝑒𝑝𝑝𝐶𝐶𝑢𝑢 𝑝𝑝𝑝𝑝𝑝𝑝𝑝𝑝𝑃𝑃𝑓𝑓𝑡𝑡𝑇𝑇) [%] 𝐼𝐼𝑆𝑆𝑆𝑆𝑆𝑆 = 𝐼𝐼𝑝𝑝𝑝𝑝𝑃𝑃𝑢𝑢𝐶𝐶𝑃𝑃𝑢𝑢𝑓𝑓𝑃𝑃 𝑃𝑃𝑡𝑡 𝑆𝑆𝑡𝑡𝑃𝑃𝑢𝑢𝑢𝑢𝑃𝑃𝑝𝑝𝑢𝑢 𝑇𝑇𝑃𝑃𝑇𝑇𝑡𝑡 𝐶𝐶𝑝𝑝𝑢𝑢𝑢𝑢𝐶𝐶𝑡𝑡𝐶𝐶𝑝𝑝𝑢𝑢𝑇𝑇 [𝑘𝑘𝑘𝑘/𝑑𝑑2]
𝐺𝐺𝑚𝑚𝑚𝑚𝑚𝑚𝑝𝑝𝑡𝑡,𝑑𝑑𝑚𝑚𝑑𝑑𝑚𝑚ℎ = 𝑀𝑀𝑝𝑝𝑢𝑢𝑡𝑡ℎ𝑙𝑙𝑎𝑎 𝑡𝑡𝑝𝑝𝑡𝑡𝑃𝑃𝑙𝑙 𝑇𝑇𝑝𝑝𝑙𝑙𝑃𝑃𝑝𝑝 𝑝𝑝𝑃𝑃𝑢𝑢𝐶𝐶𝑃𝑃𝑡𝑡𝐶𝐶𝑝𝑝𝑢𝑢 𝑝𝑝𝑢𝑢 𝑑𝑑𝑝𝑝𝑢𝑢𝑢𝑢𝑙𝑙𝑃𝑃 𝑝𝑝𝑙𝑙𝑃𝑃𝑢𝑢𝑃𝑃 [𝑘𝑘𝑘𝑘ℎ/𝑑𝑑²]
S.35
𝐴𝐴𝑝𝑝𝑝𝑝𝑝𝑝𝑝𝑝 = 2790 𝑘𝑘ℎ0.5 ∙
1 𝑘𝑘𝑘𝑘𝑑𝑑2
25 𝑘𝑘𝑘𝑘ℎ𝑑𝑑2
= 223.2 𝑘𝑘
S.35
𝐵𝐵𝑓𝑓 (𝑘𝑘ℎ) = 𝐴𝐴𝑑𝑑𝑝𝑝𝑑𝑑𝑝𝑝𝑑𝑑𝑑𝑑,𝑑𝑑𝑝𝑝𝑑𝑑(𝑘𝑘ℎ)
𝐵𝐵𝑃𝑃𝑡𝑡𝑡𝑡𝑃𝑃𝑝𝑝𝑎𝑎 𝑢𝑢𝑃𝑃𝑝𝑝𝑡𝑡ℎ 𝑝𝑝𝑓𝑓 𝑢𝑢𝐶𝐶𝑇𝑇𝑓𝑓ℎ𝑃𝑃𝑝𝑝𝑒𝑒𝑃𝑃 (%) ∙ 𝐴𝐴𝑢𝑢𝑡𝑡𝑝𝑝𝑢𝑢𝑝𝑝𝑑𝑑𝑎𝑎 𝑢𝑢𝑃𝑃𝑎𝑎𝑇𝑇 (𝑢𝑢𝑃𝑃𝑎𝑎)𝑂𝑂𝑂𝑂𝑃𝑃𝑝𝑝𝑃𝑃𝑙𝑙𝑙𝑙 𝑏𝑏𝑃𝑃𝑡𝑡𝑡𝑡𝑃𝑃𝑝𝑝𝑎𝑎 𝑇𝑇𝑎𝑎𝑇𝑇𝑡𝑡𝑃𝑃𝑑𝑑 𝑃𝑃𝑓𝑓𝑓𝑓𝐶𝐶𝑓𝑓𝐶𝐶𝑃𝑃𝑢𝑢𝑓𝑓𝑎𝑎 (%)
𝐵𝐵𝑓𝑓 = 90 𝑘𝑘ℎ80% ∙ 3
80% = 422 𝑘𝑘ℎ S.39
𝐴𝐴𝑝𝑝𝑝𝑝𝑝𝑝𝑝𝑝 = 8.0 ×𝐻𝐻𝑆𝑆 × 𝑃𝑃𝑑𝑑𝑝𝑝𝑑𝑑𝐺𝐺𝑚𝑚𝑚𝑚𝑚𝑚𝑝𝑝𝑡𝑡,𝑑𝑑𝑝𝑝𝑑𝑑
𝑃𝑃𝑑𝑑𝑝𝑝𝑑𝑑 = 𝐷𝐷𝑃𝑃𝐶𝐶𝑙𝑙𝑎𝑎 𝑓𝑓𝑝𝑝𝑝𝑝𝑝𝑝 𝑝𝑝𝑃𝑃𝑡𝑡𝑃𝑃𝑝𝑝 𝑝𝑝𝑃𝑃𝑞𝑞𝑢𝑢𝐶𝐶𝑝𝑝𝑃𝑃𝑑𝑑𝑃𝑃𝑢𝑢𝑡𝑡 (𝑑𝑑3/𝑢𝑢𝑃𝑃𝑎𝑎) 𝐻𝐻𝑆𝑆 = 𝑇𝑇𝑝𝑝𝑡𝑡𝑃𝑃𝑙𝑙 𝑝𝑝𝑢𝑢𝑑𝑑𝑝𝑝𝐶𝐶𝑢𝑢𝑒𝑒 ℎ𝑃𝑃𝑃𝑃𝑢𝑢 (𝑑𝑑)
𝐺𝐺𝑚𝑚𝑚𝑚𝑚𝑚𝑝𝑝𝑡𝑡,𝑑𝑑𝑝𝑝𝑑𝑑 = 𝑀𝑀𝑃𝑃𝑃𝑃𝑢𝑢 𝑢𝑢𝑃𝑃𝐶𝐶𝑙𝑙𝑎𝑎 𝑒𝑒𝑙𝑙𝑝𝑝𝑏𝑏𝑃𝑃𝑙𝑙 𝑇𝑇𝑝𝑝𝑙𝑙𝑃𝑃𝑝𝑝 𝑝𝑝𝑃𝑃𝑢𝑢𝐶𝐶𝑃𝑃𝑡𝑡𝐶𝐶𝑝𝑝𝑢𝑢 𝑓𝑓𝑝𝑝𝑝𝑝 𝑡𝑡ℎ𝑃𝑃 𝑢𝑢𝑃𝑃𝑇𝑇𝐶𝐶𝑒𝑒𝑢𝑢 𝑑𝑑𝑝𝑝𝑢𝑢𝑡𝑡ℎ (𝑘𝑘𝑘𝑘ℎ/𝑑𝑑². 𝑢𝑢𝑃𝑃𝑎𝑎) 𝐴𝐴𝑝𝑝𝑝𝑝𝑝𝑝𝑝𝑝 = 𝑆𝑆𝑝𝑝𝑙𝑙𝑃𝑃𝑝𝑝 𝑝𝑝𝑃𝑃𝑢𝑢𝑃𝑃𝑙𝑙 𝑝𝑝𝑝𝑝𝑝𝑝𝑃𝑃𝑝𝑝 (𝑘𝑘𝑝𝑝)

SUSTAINABLE ENERGY FOR FOOD – Massive Open Online Course – Reader
CHAPTER B | UNIT B1 | RENEWABLE ENERGY RESOURCES AND TECHNOLOGY 36
RECAP• Therearedifferentrenewableenergyresourcesavailableonearth.How-
ever, their quantity and type vary from place to place .• Hydropoweristhemostwidelyusedrenewableenergyresourcetoday.
Apart from providing light, many micro hydropower plants used in rural areas of developing countries could power different agri-processing machinery .
• Windenergyistraditionallyusedintheagriculturalsectorforprocessessuch as grinding grain and pumping water . Modern wind turbines could be used in grid-connected as well as in off-grid locations for power gener-ation . So far the use of wind power for powering agri-enterprise is limited, only mechanical energy from wind-mills is still used for pumping water .
• Bioenergyhasadirectlinktoagriculture,becauseagriculturalactivities/processes need energy, which also can be generated using agricultural wasteproductsasresources.Inrecentyearsthisfortheefficientuseofresources has gained .
• Solarenergycanhavetwoapplications,solarthermalandsolarPV.Dif-ferentthermalprocessesinagriindustriescouldbenefitfromsolarther-mal, including solar cooling . Solar PV electricity can be used in versatile ways .
• Thetypeofenergysourcepreferredalwaysdependsontheresourcesavailable on site .
• Choosingaspecifictechnologyshouldalwaysbebasedontheideaofoptimal utilization of resources as well as cost minimization .
Unit B1.3 | Solar Energy in AgricultureIn the previous section we discussed the use of solar energy in general under two broad applications — thermal use and electricity . In the following section we will discuss each common application of thermal (solar drying of fresh fruits and vegetables) and solar PV (PV powered irrigation) in agricul-tural value chains .
Unit B1.3.1 | Solar Powered IrrigationAround the world, agriculture is predominantly situated in rural areas . In these areas, especially in developing and emerging countries, good energy infrastructure often does not exist . As purely rain fed agriculture often is insufficient,groundwaterneedstobepumpedtothesurfacetoirrigateland.Where grid-based electricity is not available, diesel gas or petrol driven pumps are widely used . The prevailing disadvantage - besides their environ-mental impact - is the constant need for rather expensive fuel and a high level of maintenance . Using solar powered irrigation systems (SPIS) instead
MORE TO LEARN Promoting, Financing and Advising on SPIS - Manual and Tools for Devel-opment Practitioners, GIZ (PDF) (Hahn, Sass & Frohlich, 2016)
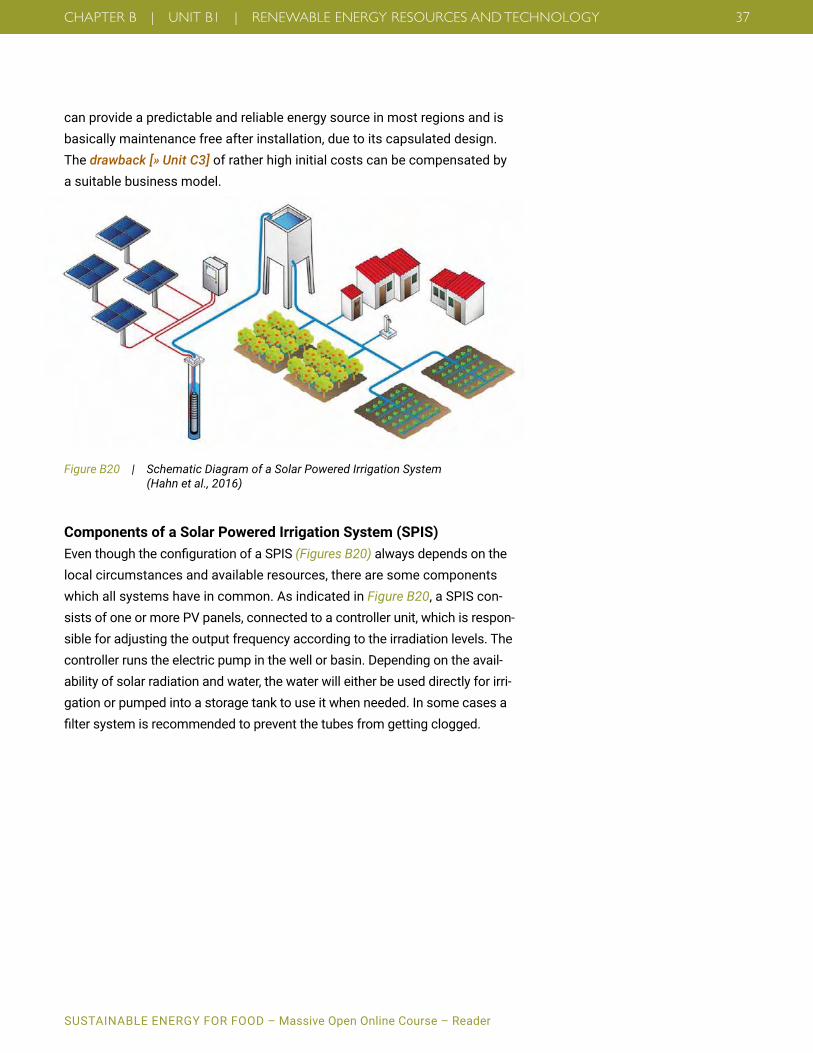
SUSTAINABLE ENERGY FOR FOOD – Massive Open Online Course – Reader
CHAPTER B | UNIT B1 | RENEWABLE ENERGY RESOURCES AND TECHNOLOGY 37
can provide a predictable and reliable energy source in most regions and is basically maintenance free after installation, due to its capsulated design . The drawback [» Unit C3] of rather high initial costs can be compensated by a suitable business model .
Components of a Solar Powered Irrigation System (SPIS) EventhoughtheconfigurationofaSPIS (Figures B20) always depends on the local circumstances and available resources, there are some components which all systems have in common . As indicated in Figure B20, a SPIS con-sists of one or more PV panels, connected to a controller unit, which is respon-sible for adjusting the output frequency according to the irradiation levels . The controller runs the electric pump in the well or basin . Depending on the avail-ability of solar radiation and water, the water will either be used directly for irri-gation or pumped into a storage tank to use it when needed . In some cases a filtersystemisrecommendedtopreventthetubesfromgettingclogged.
Figure B20 | Schematic Diagram of a Solar Powered Irrigation System (Hahn et al., 2016)
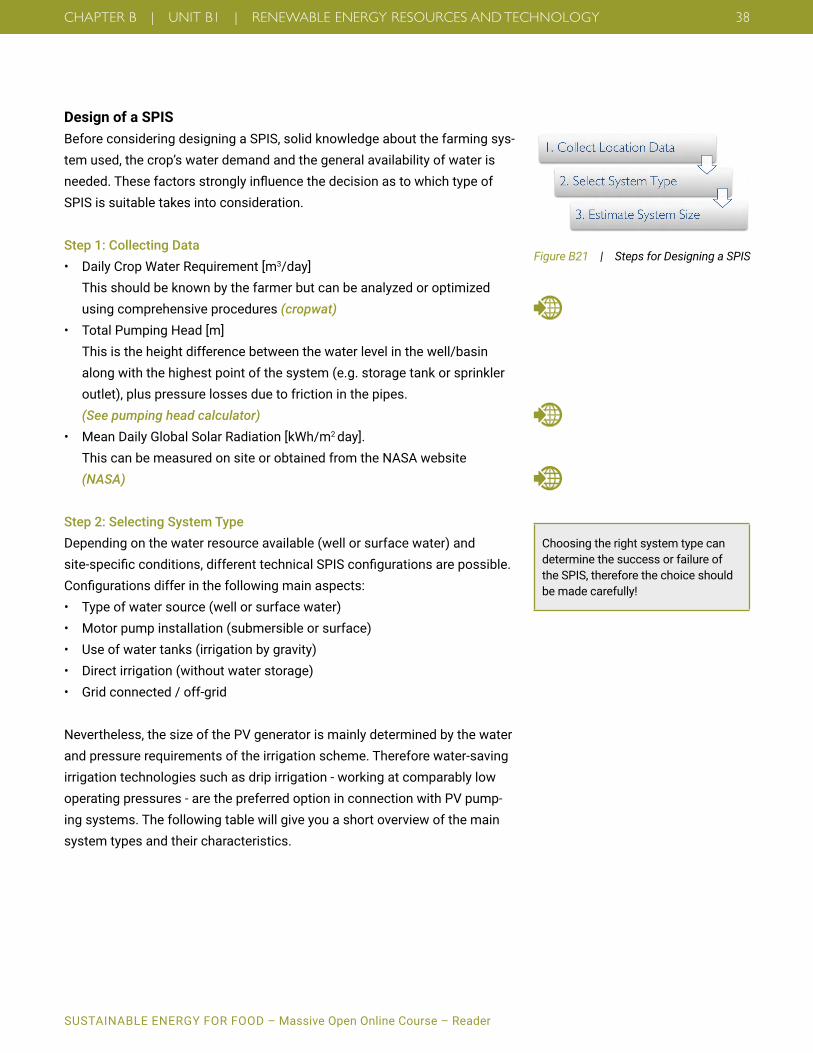
SUSTAINABLE ENERGY FOR FOOD – Massive Open Online Course – Reader
CHAPTER B | UNIT B1 | RENEWABLE ENERGY RESOURCES AND TECHNOLOGY 38
Design of a SPISBefore considering designing a SPIS, solid knowledge about the farming sys-tem used, the crop’s water demand and the general availability of water is needed.ThesefactorsstronglyinfluencethedecisionastowhichtypeofSPIS is suitable takes into consideration .
Step 1: Collecting Data• DailyCropWaterRequirement[m3/day]
This should be known by the farmer but can be analyzed or optimized using comprehensive procedures (cropwat)
• TotalPumpingHead[m] This is the height difference between the water level in the well/basin along with the highest point of the system (e .g . storage tank or sprinkler outlet), plus pressure losses due to friction in the pipes . (See pumping head calculator)
• MeanDailyGlobalSolarRadiation[kWh/m2 day] . This can be measured on site or obtained from the NASA website (NASA)
Step 2: Selecting System TypeDepending on the water resource available (well or surface water) and site-specificconditions,differenttechnicalSPISconfigurationsarepossible.Configurationsdifferinthefollowingmainaspects:• Typeofwatersource(wellorsurfacewater)• Motorpumpinstallation(submersibleorsurface)• Useofwatertanks(irrigationbygravity)• Directirrigation(withoutwaterstorage)• Gridconnected/off-grid
Nevertheless, the size of the PV generator is mainly determined by the water and pressure requirements of the irrigation scheme . Therefore water-saving irrigation technologies such as drip irrigation - working at comparably low operating pressures - are the preferred option in connection with PV pump-ing systems . The following table will give you a short overview of the main system types and their characteristics .
Choosing the right system type can determine the success or failure of the SPIS, therefore the choice should be made carefully!
Figure B21 | Steps for Designing a SPIS

SUSTAINABLE ENERGY FOR FOOD – Massive Open Online Course – Reader
CHAPTER B | UNIT B1 | RENEWABLE ENERGY RESOURCES AND TECHNOLOGY 39
System No: #1 #2 #3 #4 #5 #6
Type well watertank
welldirect irrigation
surfacedirect irrigation
surfacewatertank
well, surface direct irrigation
PV on-grid irri-gation included
Main characteristics
low head, steady pressure, night reservoir
head varies changing pres-sure only in day-time
head varies changing pres-sure only in day-time
low head, steady pressure, night reservoir
head varies changing pres-sure long-term reservoir
system pres-sure
Irrigation: 24h/7 days directly oper-ated by pump
directly oper-ated by pump
gravity fed directly oper-ated by pump
gravity or direct by AC pump
drip / micro drip - sprinkler drip - sprinkler drip / micro drip - sprinkler all typesSolar generator: fixedinstallation solar tracking or
other methodssolar tracking or other methods
fixedinstallation fixedinstallationsolar tracking or other methods
fixedortracked
Fertigation additional equipment necessary
additional equipment necessary
simple,on suction side
simple,on suction side
simple,on suction side
suction or addi-tional equipm . necessary
Motor pumps: submersible submersible surface surface submersible / surface
any AC pump
Figure B22 | SPIS Types and Characteristics (Hahn et al., 2016)
Step 3: Estimate PV System SizeAsimplifiedequationsufficestoestimatethesystemsize:
Equation B1.V: PV System Size for Irrigation (Hahn et al., 2016)
As indicated in equation B1 .V, the collected data from Step 1 will be used to calculate the power of the required photovoltaic system . The correct size and the amount of solar PV panels can be calculated based on the esti-mated power requirement . The actual water demand is crucial for choosing the right system size . As water demand is not constant throughout the year, it is important to size the system appropriately . This means the system can either be sized to meet the peak demand (during the driest months of the
NOTE For accurate system sizing, please see the tools available in the SPIS manual (Hahn, Sass & Frohlich, 2016)
S.30 𝐴𝐴𝐴𝐴𝐴𝐴 = ∑ 𝐴𝐴𝑖𝑖 = ∑ 𝑓𝑓𝑖𝑖 × 𝐴𝐴𝑖𝑖 = [(372 ℎ × 0 𝑘𝑘𝑘𝑘) + (702 ℎ × 0 𝑘𝑘𝑘𝑘) + (941 ℎ × 4 𝑘𝑘𝑘𝑘) +(1077 ℎ × 10 𝑘𝑘𝑘𝑘) + (1107 ℎ × 22 𝑘𝑘𝑘𝑘) + ⋯ ] = 578355 𝑘𝑘𝑘𝑘ℎ S.34
𝐴𝐴𝑝𝑝𝑝𝑝𝑝𝑝𝑝𝑝 = 𝐴𝐴𝑑𝑑𝑝𝑝𝑑𝑑𝑝𝑝𝑑𝑑𝑑𝑑,𝑑𝑑𝑚𝑚𝑑𝑑𝑚𝑚ℎ𝑄𝑄 ∙ 𝐼𝐼𝑆𝑆𝑆𝑆𝑆𝑆
𝐺𝐺𝑚𝑚𝑚𝑚𝑚𝑚𝑝𝑝𝑡𝑡,𝑑𝑑𝑚𝑚𝑑𝑑𝑚𝑚ℎ
𝐴𝐴𝑝𝑝𝑝𝑝𝑝𝑝𝑝𝑝 = 𝐴𝐴𝑃𝑃𝑃𝑃𝑘𝑘 𝑝𝑝𝑝𝑝𝑝𝑝𝑃𝑃𝑝𝑝 𝑝𝑝𝑓𝑓 𝑡𝑡ℎ𝑃𝑃 𝐴𝐴𝑃𝑃 𝑃𝑃𝑝𝑝𝑝𝑝𝑃𝑃𝑎𝑎 𝑢𝑢𝑢𝑢𝑢𝑢𝑃𝑃𝑝𝑝 𝑆𝑆𝑡𝑡𝑃𝑃𝑢𝑢𝑢𝑢𝑃𝑃𝑝𝑝𝑢𝑢 𝑇𝑇𝑃𝑃𝑇𝑇𝑡𝑡 𝐶𝐶𝑝𝑝𝑢𝑢𝑢𝑢𝐶𝐶𝑡𝑡𝐶𝐶𝑝𝑝𝑢𝑢𝑇𝑇 [𝑘𝑘𝑝𝑝] 𝐴𝐴𝑑𝑑𝑝𝑝𝑑𝑑𝑝𝑝𝑑𝑑𝑑𝑑,𝑑𝑑𝑚𝑚𝑑𝑑𝑚𝑚ℎ = 𝑀𝑀𝑝𝑝𝑢𝑢𝑡𝑡ℎ𝑙𝑙𝑎𝑎 𝑃𝑃𝑢𝑢𝑃𝑃𝑝𝑝𝑒𝑒𝑎𝑎 𝑢𝑢𝑃𝑃𝑑𝑑𝑃𝑃𝑢𝑢𝑢𝑢 𝑝𝑝𝑓𝑓 𝑡𝑡ℎ𝑃𝑃 𝑇𝑇𝑎𝑎𝑇𝑇𝑡𝑡𝑃𝑃𝑑𝑑 [𝑘𝑘ℎ]
𝑄𝑄 = 𝑆𝑆𝑎𝑎𝑇𝑇𝑡𝑡𝑃𝑃𝑑𝑑 𝑞𝑞𝑢𝑢𝑃𝑃𝑙𝑙𝐶𝐶𝑡𝑡𝑎𝑎 𝑓𝑓𝑃𝑃𝑓𝑓𝑡𝑡𝑝𝑝𝑝𝑝 (𝑏𝑏𝑃𝑃𝑡𝑡𝑝𝑝𝑃𝑃𝑃𝑃𝑢𝑢 40 𝑃𝑃𝑢𝑢𝑢𝑢 70% 𝑓𝑓𝑝𝑝𝑝𝑝 𝑝𝑝𝑓𝑓𝑓𝑓 𝑒𝑒𝑝𝑝𝐶𝐶𝑢𝑢 𝑝𝑝𝑝𝑝𝑝𝑝𝑝𝑝𝑃𝑃𝑓𝑓𝑡𝑡𝑇𝑇) [%] 𝐼𝐼𝑆𝑆𝑆𝑆𝑆𝑆 = 𝐼𝐼𝑝𝑝𝑝𝑝𝑃𝑃𝑢𝑢𝐶𝐶𝑃𝑃𝑢𝑢𝑓𝑓𝑃𝑃 𝑃𝑃𝑡𝑡 𝑆𝑆𝑡𝑡𝑃𝑃𝑢𝑢𝑢𝑢𝑃𝑃𝑝𝑝𝑢𝑢 𝑇𝑇𝑃𝑃𝑇𝑇𝑡𝑡 𝐶𝐶𝑝𝑝𝑢𝑢𝑢𝑢𝐶𝐶𝑡𝑡𝐶𝐶𝑝𝑝𝑢𝑢𝑇𝑇 [𝑘𝑘𝑘𝑘/𝑑𝑑2]
𝐺𝐺𝑚𝑚𝑚𝑚𝑚𝑚𝑝𝑝𝑡𝑡,𝑑𝑑𝑚𝑚𝑑𝑑𝑚𝑚ℎ = 𝑀𝑀𝑝𝑝𝑢𝑢𝑡𝑡ℎ𝑙𝑙𝑎𝑎 𝑡𝑡𝑝𝑝𝑡𝑡𝑃𝑃𝑙𝑙 𝑇𝑇𝑝𝑝𝑙𝑙𝑃𝑃𝑝𝑝 𝑝𝑝𝑃𝑃𝑢𝑢𝐶𝐶𝑃𝑃𝑡𝑡𝐶𝐶𝑝𝑝𝑢𝑢 𝑝𝑝𝑢𝑢 𝑑𝑑𝑝𝑝𝑢𝑢𝑢𝑢𝑙𝑙𝑃𝑃 𝑝𝑝𝑙𝑙𝑃𝑃𝑢𝑢𝑃𝑃 [𝑘𝑘𝑘𝑘ℎ/𝑑𝑑²]
S.35
𝐴𝐴𝑝𝑝𝑝𝑝𝑝𝑝𝑝𝑝 = 2790 𝑘𝑘ℎ0.5 ∙
1 𝑘𝑘𝑘𝑘𝑑𝑑2
25 𝑘𝑘𝑘𝑘ℎ𝑑𝑑2
= 223.2 𝑘𝑘
S.35
𝐵𝐵𝑓𝑓 (𝑘𝑘ℎ) = 𝐴𝐴𝑑𝑑𝑝𝑝𝑑𝑑𝑝𝑝𝑑𝑑𝑑𝑑,𝑑𝑑𝑝𝑝𝑑𝑑(𝑘𝑘ℎ)
𝐵𝐵𝑃𝑃𝑡𝑡𝑡𝑡𝑃𝑃𝑝𝑝𝑎𝑎 𝑢𝑢𝑃𝑃𝑝𝑝𝑡𝑡ℎ 𝑝𝑝𝑓𝑓 𝑢𝑢𝐶𝐶𝑇𝑇𝑓𝑓ℎ𝑃𝑃𝑝𝑝𝑒𝑒𝑃𝑃 (%) ∙ 𝐴𝐴𝑢𝑢𝑡𝑡𝑝𝑝𝑢𝑢𝑝𝑝𝑑𝑑𝑎𝑎 𝑢𝑢𝑃𝑃𝑎𝑎𝑇𝑇 (𝑢𝑢𝑃𝑃𝑎𝑎)𝑂𝑂𝑂𝑂𝑃𝑃𝑝𝑝𝑃𝑃𝑙𝑙𝑙𝑙 𝑏𝑏𝑃𝑃𝑡𝑡𝑡𝑡𝑃𝑃𝑝𝑝𝑎𝑎 𝑇𝑇𝑎𝑎𝑇𝑇𝑡𝑡𝑃𝑃𝑑𝑑 𝑃𝑃𝑓𝑓𝑓𝑓𝐶𝐶𝑓𝑓𝐶𝐶𝑃𝑃𝑢𝑢𝑓𝑓𝑎𝑎 (%)
𝐵𝐵𝑓𝑓 = 90 𝑘𝑘ℎ80% ∙ 3
80% = 422 𝑘𝑘ℎ S.39
𝐴𝐴𝑝𝑝𝑝𝑝𝑝𝑝𝑝𝑝 = 8.0 ×𝐻𝐻𝑆𝑆 × 𝑃𝑃𝑑𝑑𝑝𝑝𝑑𝑑𝐺𝐺𝑚𝑚𝑚𝑚𝑚𝑚𝑝𝑝𝑡𝑡,𝑑𝑑𝑝𝑝𝑑𝑑
𝑃𝑃𝑑𝑑𝑝𝑝𝑑𝑑 = 𝐷𝐷𝑃𝑃𝐶𝐶𝑙𝑙𝑎𝑎 𝑓𝑓𝑝𝑝𝑝𝑝𝑝𝑝 𝑝𝑝𝑃𝑃𝑡𝑡𝑃𝑃𝑝𝑝 𝑝𝑝𝑃𝑃𝑞𝑞𝑢𝑢𝐶𝐶𝑝𝑝𝑃𝑃𝑑𝑑𝑃𝑃𝑢𝑢𝑡𝑡 (𝑑𝑑3/𝑢𝑢𝑃𝑃𝑎𝑎) 𝐻𝐻𝑆𝑆 = 𝑇𝑇𝑝𝑝𝑡𝑡𝑃𝑃𝑙𝑙 𝑝𝑝𝑢𝑢𝑑𝑑𝑝𝑝𝐶𝐶𝑢𝑢𝑒𝑒 ℎ𝑃𝑃𝑃𝑃𝑢𝑢 (𝑑𝑑)
𝐺𝐺𝑚𝑚𝑚𝑚𝑚𝑚𝑝𝑝𝑡𝑡,𝑑𝑑𝑝𝑝𝑑𝑑 = 𝑀𝑀𝑃𝑃𝑃𝑃𝑢𝑢 𝑢𝑢𝑃𝑃𝐶𝐶𝑙𝑙𝑎𝑎 𝑒𝑒𝑙𝑙𝑝𝑝𝑏𝑏𝑃𝑃𝑙𝑙 𝑇𝑇𝑝𝑝𝑙𝑙𝑃𝑃𝑝𝑝 𝑝𝑝𝑃𝑃𝑢𝑢𝐶𝐶𝑃𝑃𝑡𝑡𝐶𝐶𝑝𝑝𝑢𝑢 𝑓𝑓𝑝𝑝𝑝𝑝 𝑡𝑡ℎ𝑃𝑃 𝑢𝑢𝑃𝑃𝑇𝑇𝐶𝐶𝑒𝑒𝑢𝑢 𝑑𝑑𝑝𝑝𝑢𝑢𝑡𝑡ℎ (𝑘𝑘𝑘𝑘ℎ/𝑑𝑑². 𝑢𝑢𝑃𝑃𝑎𝑎) 𝐴𝐴𝑝𝑝𝑝𝑝𝑝𝑝𝑝𝑝 = 𝑆𝑆𝑝𝑝𝑙𝑙𝑃𝑃𝑝𝑝 𝑝𝑝𝑃𝑃𝑢𝑢𝑃𝑃𝑙𝑙 𝑝𝑝𝑝𝑝𝑝𝑝𝑃𝑃𝑝𝑝 (𝑘𝑘𝑝𝑝)

SUSTAINABLE ENERGY FOR FOOD – Massive Open Online Course – Reader
CHAPTER B | UNIT B1 | RENEWABLE ENERGY RESOURCES AND TECHNOLOGY 40
year) or be designed to meet the average water demand throughout the year . A peak demand sized system is therefore oversized during large parts of the year while a smaller system might be less expensive, but undersized during peak demand .
Unit B1.3.2 | Solar DryingThere are two reasons why post-harvest loss of agricultural commodities [» Unit A1.3]isofsignificantconcerninmanydevelopingandemergingcountries . People are not aware of the high amount of losses, and they lack properknowledgeonthebenefitsofusingsimplepost-harvestandconser-vation technologies . Introducing appropriate post-harvest technology could help in saving wasted food . It also helps to add value to the quality of prod-ucts that result in a high market price .
The most common approach to preserve freshly harvested cereals, fruits and vegetables is to dry and store them . Open sun drying has been practiced since ancient times is accompanied by many problems such as high depen-dency on weather conditions, slow drying rates, risk of contamination to mention a few . Mechanical dryers could avoid these problems; however, they are energy-intensive . Next to mechanical solutions, simple solar powered drying can reduce the moisture content of vegetables and fruits to store them for longer periods . This simple solution has great potential – especially in countries where industrial technologies for preservation are not available or not applicable (Gewali & Bhandari, 2005) .
There are different types of solar dryers, such as direct drying (solar box dryer), indirect drying (solar cabinet dryer), mixed mode drying (solar tunnel dryer) or hybrid drying (hybrid solar/biomass cabinet dryer) . Small-scale solar box and cabinet dryers are based on natural air convection, while solar tunnel dryers are based on forced convection (air circulation fan necessary) .
You will find some additional links for SPIS sizing below
Meteorological Data Sources
Crop Water Requirement: CROPWAT
System Example
Manufacturers Channel
Case Study
MORE TO LEARN Fruits of the Nile Solar Drying
Energypedia on Solar Dryers
Hohenheim Solar Dryer
Figure B23 | Schematic of a Solar Dryer (Bhandari, 2016 adapted from http://www.fao.org/docrep/t0522f/T0522F0B.GIF)

SUSTAINABLE ENERGY FOR FOOD – Massive Open Online Course – Reader
CHAPTER B | UNIT B1 | RENEWABLE ENERGY RESOURCES AND TECHNOLOGY 41
Unit B1.3.3 | Solar Box DryerThis dryer is simply a box with a glass cover at the top, inclined at an angle to allow maximum solar radiation into the box . (Figure B24) The inner walls of the box are made of aluminum sheets with black coating to absorb the solar radiation entering through the transparent glazing . A rectangular open-ing is made at the lower part of the front wall for an air inlet . A chimney made of galvanized iron sheets, attached at the top of the box permits the moist air to exit . The products to be dried are spread on three trays made of stainless steel wire mesh, which are placed inside the box . Each tray is pro-vided with a drawer for ease of loading and unloading . Slower drying rates and discoloration of products are the major problems experienced with the box dryer . This dryer is recommended for domestic use due to its small dry-ing capacity .
Unit B1.3.4 | Solar Cabinet DryerThe design of a solar cabinet dryer (Figure B25) is somewhat complex com-pared to the box type dryer and is also relatively more expensive to fabricate . This dryer consists of two parts: a collector to heat the incoming ambient air using solar radiation and a drying chamber in which commodities to be dried are spread on a number of trays on different layers . The solar collector con-sists of a corrugated aluminum sheet which acts as absorber . The box of the collector is made of galvanized iron (Gl) sheet . For insulation purposes, glass wool is inserted in between two covers of the box . The outer cover of the drying chamber is also made of Gl sheeting and that of the inner cover is made of aluminum sheeting . Glass wool is inserted between these two cov-ers for insulation . This chamber is partitioned into separate chambers; each
Figure B24 | Solar Box Dryer (Photo: Bhandari, 2004; Sketch: Bhandari & Amatya, 2003)
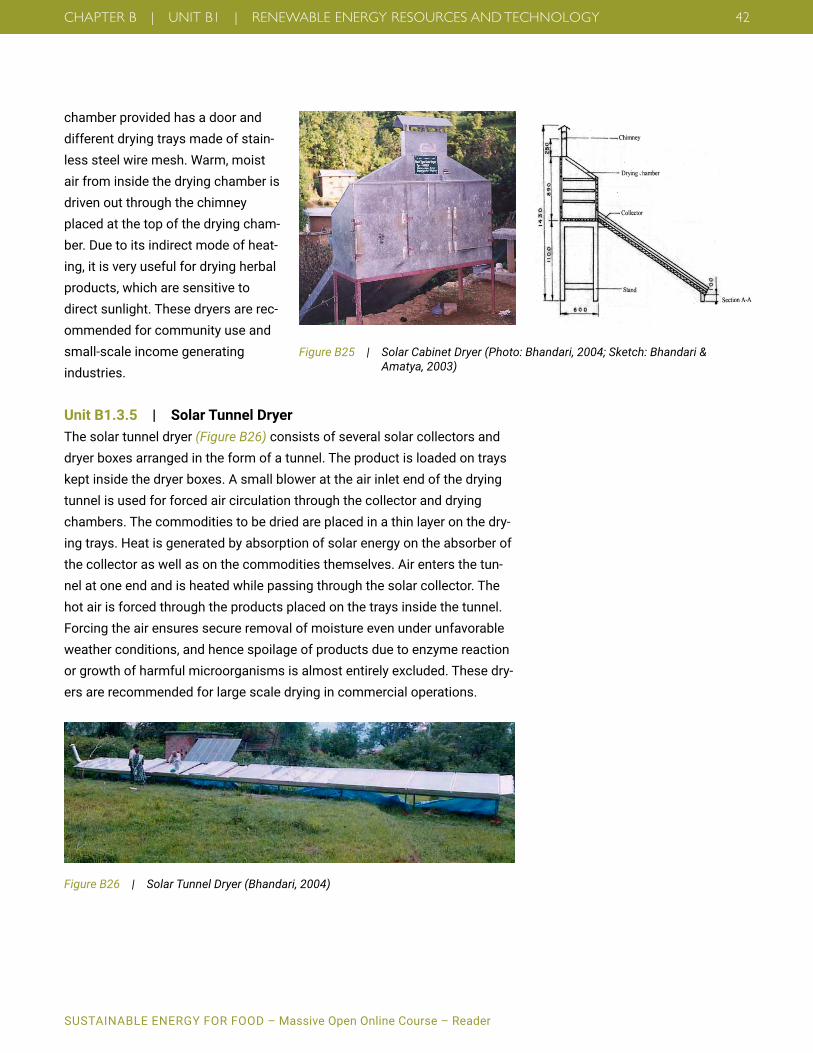
SUSTAINABLE ENERGY FOR FOOD – Massive Open Online Course – Reader
CHAPTER B | UNIT B1 | RENEWABLE ENERGY RESOURCES AND TECHNOLOGY 42
chamber provided has a door and different drying trays made of stain-less steel wire mesh . Warm, moist air from inside the drying chamber is driven out through the chimney placed at the top of the drying cham-ber . Due to its indirect mode of heat-ing, it is very useful for drying herbal products, which are sensitive to direct sunlight . These dryers are rec-ommended for community use and small-scale income generating industries .
Unit B1.3.5 | Solar Tunnel DryerThe solar tunnel dryer (Figure B26) consists of several solar collectors and dryer boxes arranged in the form of a tunnel . The product is loaded on trays kept inside the dryer boxes . A small blower at the air inlet end of the drying tunnel is used for forced air circulation through the collector and drying chambers . The commodities to be dried are placed in a thin layer on the dry-ing trays . Heat is generated by absorption of solar energy on the absorber of the collector as well as on the commodities themselves . Air enters the tun-nel at one end and is heated while passing through the solar collector . The hot air is forced through the products placed on the trays inside the tunnel . Forcing the air ensures secure removal of moisture even under unfavorable weather conditions, and hence spoilage of products due to enzyme reaction or growth of harmful microorganisms is almost entirely excluded . These dry-ers are recommended for large scale drying in commercial operations .
Figure B25 | Solar Cabinet Dryer (Photo: Bhandari, 2004; Sketch: Bhandari & Amatya, 2003)
Figure B26 | Solar Tunnel Dryer (Bhandari, 2004)

SUSTAINABLE ENERGY FOR FOOD – Massive Open Online Course – Reader
CHAPTER B | UNIT B1 | RENEWABLE ENERGY RESOURCES AND TECHNOLOGY 43
Unit B1.3.6 | Solar-Biomass Hybrid Cabinet DryerBiomass resource is the supplementary fuel in the design of the hybrid solar biomass drying system (Figure B27) . In this dryer a biomass stove has been installed at one side of the drying chamber of the basic solar cabinet dryer, adjacent to the collector system . The stove is made of steel sheets . The hot fluegasfromthestoveispassedthroughtheheatexchangerthatisinstalled at the bottom of the drying chamber . The heat exchanger transfers its heat to the ambient air coming through the solar collector into the drying chamber.Afterhavingpassedthroughtheheatexchanger,fluegasexitsthrough the outlet installed at another side of the drying chamber .During operation, hot air enters into the drying chamber and then passes through the products to be dried . Warm, moist air from the drying chamber exits through the chimney placed at the top of the drying chamber . This type ofdryerisrecommendedfordryingfishandmeatproducts.
RECAP• Solarenergyhassignificantpotentialthatcanbeintegratedintoagricul-
tural value chains, from very small to large-scale applications .• SolarPVsystemsarealreadyusedinalmostallcountriesworldwide-
ranging from large-scale power generation to small-scale solar home sys-tems for lighting . They could play a vital role in pumping water, taking advantage of cheaper (water) storage systems .
• PVpumpingcouldreplacefossilfuelorgridelectricitybasedwaterpumping, and presents an option for farmers without prior access to irri-gation solutions to increase agricultural productivity .
• Evenifthetechnologyisverysimpleandcanbemanufacturedlocally,solar dryers are important for preservation and value addition of fruit and vegetable products .
Figure B27 | Hybrid Cabinet Dryer (Bhandari & Amatya, 2003)

SUSTAINABLE ENERGY FOR FOOD – Massive Open Online Course – Reader
CHAPTER B | UNIT B1 | RENEWABLE ENERGY RESOURCES AND TECHNOLOGY 44
SUMMARY & UNIT WRAP-UP Global energy demand has been continuously increasing for decades with higher growth rates in developing countries in recent years . This trend is expected to continue with the economic and population growth in many developing and emerging countries . About one third of this energy is con-sumed as a result of food production, supply, and consumption . Today the majority of this energy comes from fossil fuels . Renewable energy resources could mitigate these problems of resource scarcity and emissions . Renew-able energy resources are distributed almost everywhere on earth . Access to clean energy solutions for agricultural processes could have multifold bene-fits,especiallyindevelopingcountrieswheresubsistenceagricultureisalifeline for many . It could not only displace fossil fuels, but also open up new opportunities for farmers to increase their productivity and add value to pro-duce . And interestingly waste products from agricultural activities could be used to produce energy .
In this Unit B1 you were provided with an overview of these resources and technologies, as well as some practical examples of their implementation in agricultural value chains . In the upcoming Unit B2 you will learn about bioen-ergy, a very important energy source within the Energy Agriculture Nexus, including in-depth knowledge about bioenergy resources and technologies, and the use of bioenergy in agricultural value chains .
Please find below links to our materials and references
Videowww .giz .de/gc21/pa_video_lectures
Additional Materialwww .giz .de/gc21/pa_additional_material
Top5 Team Assignmentswww .giz .de/gc21/pa_assignments
Referenceswww .giz .de/gc21/pa_references

SUSTAINABLE ENERGY FOR FOOD – Massive Open Online Course – Reader
CHAPTER B | UNIT B2 | BIOENERGY 45
UNIT B2B2 BIOENERGY . . . . . . . . . . . . . . . . . . . . . . . . . . . . . . . . . . . . . . . . . . . . . . . . . . . . . . . . . . . . . . . . . . . . . . . . . . . . . . . .46B2 .1 Bioenergy Resources and Technologies . . . . . . . . . . . . . . . . . . . . . . . . . . . . . . . . . . . . . . . . . . . . . . . . . . . . . . . .46B2.1.1 Bioenergy Resources . . . . . . . . . . . . . . . . . . . . . . . . . . . . . . . . . . . . . . . . . . . . . . . . . . . . . . . . . . . . . . . . . . . . . . . . . 46B2.1.2 Bioenergy Technologies . . . . . . . . . . . . . . . . . . . . . . . . . . . . . . . . . . . . . . . . . . . . . . . . . . . . . . . . . . . . . . . . . . . . . . 48B2.1.3 Thermochemical Processes . . . . . . . . . . . . . . . . . . . . . . . . . . . . . . . . . . . . . . . . . . . . . . . . . . . . . . . . . . . . . . . . . . . 49B2.1.4 Biochemical Processes . . . . . . . . . . . . . . . . . . . . . . . . . . . . . . . . . . . . . . . . . . . . . . . . . . . . . . . . . . . . . . . . . . . . . . . 49B2.1.5 Other Processes . . . . . . . . . . . . . . . . . . . . . . . . . . . . . . . . . . . . . . . . . . . . . . . . . . . . . . . . . . . . . . . . . . . . . . . . . . . . . 50B2 .2 Introduction to Biogas . . . . . . . . . . . . . . . . . . . . . . . . . . . . . . . . . . . . . . . . . . . . . . . . . . . . . . . . . . . . . . . . . . . . . . .50B.2.2.1 Methane . . . . . . . . . . . . . . . . . . . . . . . . . . . . . . . . . . . . . . . . . . . . . . . . . . . . . . . . . . . . . . . . . . . . . . . . . . . . . . . . . . . . 52B2.2.2 Carbon Dioxide . . . . . . . . . . . . . . . . . . . . . . . . . . . . . . . . . . . . . . . . . . . . . . . . . . . . . . . . . . . . . . . . . . . . . . . . . . . . . . 53B2 .3 Use of Biogas Technologies in Agricultural Value Chains . . . . . . . . . . . . . . . . . . . . . . . . . . . . . . . . . . . . . . . . . .54B2.3.1 Anaerobic Digestion Technologies . . . . . . . . . . . . . . . . . . . . . . . . . . . . . . . . . . . . . . . . . . . . . . . . . . . . . . . . . . . . . . 55B2.3.2 Large and Medium Scale Technologies . . . . . . . . . . . . . . . . . . . . . . . . . . . . . . . . . . . . . . . . . . . . . . . . . . . . . . . . . . 56B2.3.3 Small-scale Technologies. . . . . . . . . . . . . . . . . . . . . . . . . . . . . . . . . . . . . . . . . . . . . . . . . . . . . . . . . . . . . . . . . . . . . . 58B2 .4 Biogas Utilization Options . . . . . . . . . . . . . . . . . . . . . . . . . . . . . . . . . . . . . . . . . . . . . . . . . . . . . . . . . . . . . . . . . . . .61B2.4.1 Cogeneration . . . . . . . . . . . . . . . . . . . . . . . . . . . . . . . . . . . . . . . . . . . . . . . . . . . . . . . . . . . . . . . . . . . . . . . . . . . . . . . . 61B2.4.2 Lighting and Cooking with Small Biogas Plants . . . . . . . . . . . . . . . . . . . . . . . . . . . . . . . . . . . . . . . . . . . . . . . . . . . 62B2.4.3 Vehicle Fuel . . . . . . . . . . . . . . . . . . . . . . . . . . . . . . . . . . . . . . . . . . . . . . . . . . . . . . . . . . . . . . . . . . . . . . . . . . . . . . . . . 62 Summary & Unit Wrap-Up . . . . . . . . . . . . . . . . . . . . . . . . . . . . . . . . . . . . . . . . . . . . . . . . . . . . . . . . . . . . . . . . . . . .63
© GIZ/Dirk Ostermeier

SUSTAINABLE ENERGY FOR FOOD – Massive Open Online Course – Reader
CHAPTER B | UNIT B2 | BIOENERGY 46
INTRODUCTIONUnit B2 will provide you with a technical overview on bioenergy resources and technologies . The focus of this chapter is on biogas fundamentals and the many uses of biogas in the agriculture sector . This reader will introduce the process by which methane is generated, the technologies that can be used to generate methane and factors to consider when choosing a technology and the different ways biogas can be used as an energy source .
UNIT B2 BIOENERGY
Unit B2.1 | Bioenergy Resources and TechnologiesIn the past decade bioenergy has seen an uptick in interest from the interna-tional community . While instability in oil regions has been one factor in the shift towards renewable energy resources, other factors such as demand for self-supply energy commodities, increase in energy security, stimulation of rural development, reduction of the impact of energy use on climate change, and provision of a clean, more environmentally friendly energy source have played a large role in the promotion of bioenergy resource development (Cushion, Whiteman & Dieterle, 2010) .
The basic bioenergy process involves the translation of organic material into an end product, which can then be used to produce energy . This sub-chapter provides a general schematic of the biomass to bioenergy conversion process .
Unit B2.1.1 | Bioenergy ResourcesOrganic material comes from a variety of resources including municipal, industrial, forestry and agricultural activities . The main feedstocks used today to produce bioenergy are: Wood, straw and other materials containing lignin: Wood, wooden material from landscape management or straw can be used for combustion . Straw can be digested as well .
AUTHORS Miguel Franco (Tetra Tech)
Anna Perkinson (Tetra Tech)
Please find below links to our materials and references
Videowww .giz .de/gc21/pa_video_lectures
Additional Materialwww .giz .de/gc21/pa_additional_material
Referenceswww .giz .de/gc21/pa_references
MORE TO LEARN Bioenergy Development: Issues and Impacts for Poverty and Natural Resource Management (PDF) (World Bank, 2010)

SUSTAINABLE ENERGY FOR FOOD – Massive Open Online Course – Reader
CHAPTER B | UNIT B2 | BIOENERGY 47
Oily fruits: Biomasswithhighoilcontent,likepalmfruits,sunflower,rapeseeds and even algae can be used to produce bio-oil . Bio-oil can be com-busted directly (or in an engine) or further processed to biodiesel .
Agricultural residues: Animal manure or dung has high potential to be used for biogas production . Several parts of plants cannot be sold but can be digested . Examples are leaves and stems from the plants, fruits that cannot be sold due to poor quality, green fertilizer (like clover grass which is mulched to the ground) .
Industrial residue, industrial by-products and process water: In food or feed processing organic materials are generated as by-products . Typical indus-tries are fruit or vegetable processing, sugar production, breweries, slaughter houses, potato processing and many others . All of these by-products can be digested .
Municipal waste and residues: Household waste, expired food stuff, materi-als from canteens and restaurants, and residues from parks and landscape management can be used for bioenergy generation . Wooden material can be combusted; material with high water content and low lignin content can be digested in biogas plants .
Energy crops: Worldwide several fruits are grown for energy production . Examples are palm oil fruit, rage seed, sugar cane, corn and many more . However, the energetic use of fruits is under discussion because of competi-tion with food production and sustainability issues .
Agri-industrial wastewater and industrial by-products: Many agri-industries generate wastewater with high levels of organic matter that can be con-verted to biogas due to typical wastewater treatment and disposal practices . Theseagri-industriesincludepalmoilmills,sugarprocessingandrefining,ethanol production, and food processing facilities . Industrial by-products are: press cakes from oily seeds, remaining parts of crops after processing and other .
Wastewater treatment sludge: Anaerobic digestion can be used to reduce the organic load in wastewater . The produces’ sewage sludge can be digested .
To reach a stable bioenergy production it should be ensured that organic material is constantly available . In the case of harvest seasons biomass
Disney World Food Waste to Energy
Disney World has millions of visitors every year; not only do these people enjoy the attractions and rides of the amusement park, but they also eat and drink at many of the parks’ restaurants and food vendors . This results in thousands of tons of food waste . Instead of just disposing of thiswasteinatraditionallandfill,Dis-ney decided to put this waste to good use and send the waste to an anaero-bic digestion plant that produces 5.4 MWofcombinedheatandelec-tricity for the resorts’ theme parks and hotels . (Guardian, 2014)

SUSTAINABLE ENERGY FOR FOOD – Massive Open Online Course – Reader
CHAPTER B | UNIT B2 | BIOENERGY 48
might be conserved (e .g . in form of silage) to be stored for months . Securing a guaranteed and regular feedstock supply for bioenergy plants should not be taken for granted . In practice, this means that all elements of the waste management value chain must contribute to the smooth functioning of the entire system – i .e . the collection, transport, handling and storage of the organic feedstock .
Figure B28 provides examples of several different feedstocks and their asso-ciated biogas yield .
Unit B2.1.2 | Bioenergy Technologies Choosing the appropriate technology for converting organic matter into bio-energy is a key to optimizing energy production . The technologies available today for bioenergy conversion can be broken up into three general catego-ries: direct combustion and thermochemical processes; biochemical pro-cesses; and other processes .
Direct Combustion: Direct combustion is one common form of bioenergy generation . On household level wood is typically used for cooking . Big, indus-trialscaleplantsoftenusewoodasco-fueltofossil-firedpowerplants.Theprocess involves the combustion of solid biomass feedstock, most often
Figure B28 | Biomass Substrates and Biogas Production Potential (www.americanbiogascouncil.org)

SUSTAINABLE ENERGY FOR FOOD – Massive Open Online Course – Reader
CHAPTER B | UNIT B2 | BIOENERGY 49
some type of woody waste, in the presence of excess oxygen in the boiler in order to produce steam, which is then converted to electricity and heat . The heat produced can also be used in direct thermal applications such as to heat buildings or industrial processes (U .S . Environmental, 2009) .
Thermochemical and Biochemical Conversion: Materials such as grass, wood waste, and crop residue are all good feedstocks for both thermochem-ical and biochemical conversion . Thermochemical conversion uses heat and chemicals to break down the cellulose in the feedstock to make syngas . Bio-chemical conversion can use a variety of processes like high temperature, high pressure, acid, enzymes, or other treatment techniques to break down the lignin and hemicellulose that surround the cellulose . Hydrolysis using enzymes and acids then breaks down the cellulose into sugar, which in turn is fermented to produce ethanol (U .S . Environmental, 2009) .
Unit B2.1.3 | Thermochemical ProcessesPyrolysis: In the absence of oxygen pyrolysis uses high temperatures and pressure to decompose organic matter, which can result in gas, pyrolysis oil (bio-oil), or charcoal (bio-char) . Bio-oil is a typical product that can be used to heat buildings or for power generation . The temperature of the reaction determines the end-product (U .S . Environmental, 2009) .
Gasification:Gasificationconvertssolidfueltogaseitherthroughachemi-cal or a heat process . Solid biomass like woody waste is heated to a high temperature (above 700 degrees Celsius) with limited oxygen . This in turn convertsthefeedstockintoaflammablesynthesisgasknownas“syngas”,consisting mainly of CO, H2 and some other traces like tar . Syngas is then either combusted in a gas engine, in a boiler for electricity, heat generation or thermal applications (U .S . Environmental, 2009) .
Unit B2.1.4 | Biochemical ProcessesAnaerobic Digestion, often called -Biogas: Anaerobic digestion involves the decomposition of organic material by microorganisms in the absence of oxygen . This process produces a gas composed largely of methane (CH4) and carbon dioxide (CO2) . The methane produced can combusted directly (e .g . in small stoves) or be used to produce electricity or heat in combined heat and power plants (CHP) (U .S . Environmental, 2009) .
Fermentation: Starchy plants are often used in the biochemical fermentation process to convert sugar into alcohol . This is the most common process used to produce ethanol from corn and sugarcane (U .S . Environmental, 2009) .

SUSTAINABLE ENERGY FOR FOOD – Massive Open Online Course – Reader
CHAPTER B | UNIT B2 | BIOENERGY 50
Unit B2.1.5 | Other ProcessesTransesterification:Transesterificationisaprocessthatconvertsoilsorfatsinto biodiesel . The process involves removing water and contaminants from the feedstock, and mixing the latter with alcohol (typically methanol) and a catalyst (such as sodium hydroxide) . Fatty acid methyl esters and glycerin are produced as by-products of the process . The glycerin can be used in pharma-ceuticals and cosmetics, while the esters are considered biodiesel and can be used as vehicle fuel or for other fuel purposes (U .S . Environmental, 2009) .
RECAP• Thebasicbioenergyprocessisthetranslationoforganicmaterialintoa
finalproductthatisusedtoproduceenergy.• Themainfeedstocktoproducebioenergyincludeswood,animalexcre-
ments, industrial by-products, food waste, agri-industrial wastewater, and energy crops .
• Bioenergytechnologiescanbedividedintothreetypes: - Thermochemicalprocesses–pyrolysisandgasification - Biochemicalprocesses–anaerobicdigestionandfermentation - Otherprocesses–transesterification.
Unit B2.2 | Introduction to BiogasBiogas is a gas that is produced during the anaerobic degradation of organic materials . It is primarily composed of methane (50–75 percent) and carbon dioxide (25–45 percent) . Biogas also has trace amounts of other compo-nentssuchaswatervapor,hydrogensulfideandammonia.
Biogas production can help to reduce GHG emissions in several ways:• Duringthestorageoforganicmaterial(likemanureorpalmoilmillefflu-
ents) methane emissions occur . Methane has a GHG potential that is a factor about 25 times higher than carbon dioxide . Due to material treat-ment in a biogas plant, a closed system, and gas utilization (e .g . in a gas engine or boiler) methane emissions are avoided and the methane com-busted into carbon dioxide .
• Biogasisanearlycarbonneutralenergygenerationbecauseduringthegrowth of plants carbon dioxide from the atmosphere is stored in the plant in the form of carbon containing molecules (CO2 reduction) . After combustion about the same amount of carbon dioxide is emitted, as was originally extracted from the atmosphere (CO2 neutral process) .
• Duetoenergygeneration,fossilenergycarrierscanbesubstitutedandCO2 emissions avoided in the process .

SUSTAINABLE ENERGY FOR FOOD – Massive Open Online Course – Reader
CHAPTER B | UNIT B2 | BIOENERGY 51
• Digestate(theeffluentofabiogasplant)isagood quality fertilizer [» Unit A3] . Its use helps to substitute synthetic fertilizers . For the produc-tion of synthetic fertilizers high amounts of fossil fuels are used . Their CO2 emissions can be avoided .
• However,methaneisaveryeffectiveGHGandmethaneemissionsfrombiogas plants must be limited (e .g . by covering the storage of digestate orinstallingaflarethatburnsthemethaneproducedinperiodswhenbio-gas utilization is not in operation) .
There are additional motivations to produce biogas including stench reduc-tion, deactivation of unwanted seeds and pathogen bacteria, and last but not least job creation (about 10 employees per installed MW electricity) and business generation .
The World Bioenergy Association estimates that if fully utilized, biogas could cover close to 6 percent of the global primary energy supply – equal to one quarter of the current consumption of natural gas . The agricultural sector contributes almost half of global methane emissions (47 percent) [» Unit A2] .(FAO, 2014) .
Anaerobicdigestion“cutsmethaneemissionsfromlandfillandslurrypitswhile reducing the use of fossil fuels, commercial fertilizers and chemical inputs” (EBA, 2013) . However, biogas deployment at the global level has been slow due to several factors:
• Lackofinformationaboutthepossibilitiesofbiogas;• Lackofatrainedlaborforce;• Highcapitalcostsforcommercialscaleplants;• Naturalgasisacheaperalternativeaslongastheenvironmentaldamage
of CO2 emissions are not included in the natural gas costs; • Governmentpoliciesandprogramsdonotadequatelyfacilitate/support
biogas programs .
Global data on current installed capacity of biogas plants does not exist, but REN 21 (2016) estimates that the share of bioenergy in total global primary energy consumption is about 10 percent - and that bio-power generated 464 terawatt hours (TWh) in 2015 . In India and China have the most installations with an estimated 4 .5 million biogas plants in India and over 40 million bio-gas plants in China . However, the majority are small household systems that are used to produce gas for cooking, heating water, and lighting (World Bio-energy Association, 2013) . The most developed biogas market for bigger,
The Nutrient Cycle
All minerals (like N, P, K, S) in the feedstock remain in the system and are high valuable fertilizers [» Unit A3] at the end of the process . If derived exclusively from clean, source-sepa-rated waste streams, the spent and sanitized digestates are usually spread on agricultural land near the biogas plant and can replace mineral fertilizers . In this way the nutrients are recirculated, which contributes to closing the cycle between food-con-suming urban spaces and food-pro-ducing rural areas . When anaerobic digestion projects focus on waste, residues and animal excrements, they are more likely to be sustainable and far less likely to threaten food supplies .
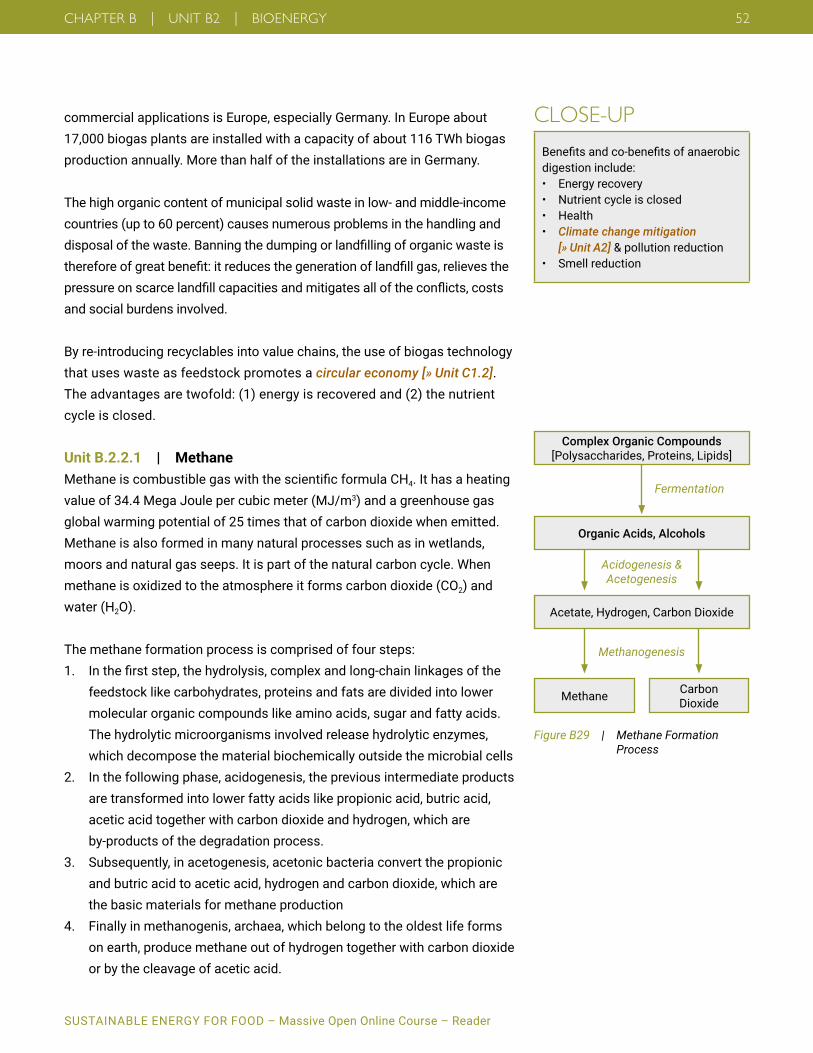
SUSTAINABLE ENERGY FOR FOOD – Massive Open Online Course – Reader
CHAPTER B | UNIT B2 | BIOENERGY 52
commercial applications is Europe, especially Germany . In Europe about 17,000 biogas plants are installed with a capacity of about 116 TWh biogas production annually . More than half of the installations are in Germany .
The high organic content of municipal solid waste in low- and middle-income countries (up to 60 percent) causes numerous problems in the handling and disposalofthewaste.Banningthedumpingorlandfillingoforganicwasteisthereforeofgreatbenefit:itreducesthegenerationoflandfillgas,relievesthepressureonscarcelandfillcapacitiesandmitigatesalloftheconflicts,costsand social burdens involved .
By re-introducing recyclables into value chains, the use of biogas technology that uses waste as feedstock promotes a circular economy [» Unit C1.2] . The advantages are twofold: (1) energy is recovered and (2) the nutrient cycle is closed .
Unit B.2.2.1 | MethaneMethaneiscombustiblegaswiththescientificformulaCH4 . It has a heating value of 34 .4 Mega Joule per cubic meter (MJ/m3) and a greenhouse gas global warming potential of 25 times that of carbon dioxide when emitted . Methane is also formed in many natural processes such as in wetlands, moors and natural gas seeps . It is part of the natural carbon cycle . When methane is oxidized to the atmosphere it forms carbon dioxide (CO2) and water (H2O) .
The methane formation process is comprised of four steps: 1. Inthefirststep,thehydrolysis,complexandlong-chainlinkagesofthe
feedstock like carbohydrates, proteins and fats are divided into lower molecular organic compounds like amino acids, sugar and fatty acids . The hydrolytic microorganisms involved release hydrolytic enzymes, which decompose the material biochemically outside the microbial cells
2. Inthefollowingphase,acidogenesis,thepreviousintermediateproductsare transformed into lower fatty acids like propionic acid, butric acid, acetic acid together with carbon dioxide and hydrogen, which are by-products of the degradation process .
3. Subsequently,inacetogenesis,acetonicbacteriaconvertthepropionicand butric acid to acetic acid, hydrogen and carbon dioxide, which are the basic materials for methane production
4. Finallyinmethanogenis,archaea,whichbelongtotheoldestlifeformson earth, produce methane out of hydrogen together with carbon dioxide or by the cleavage of acetic acid .
CLOSE-UP Benefitsandco-benefitsofanaerobicdigestion include:• Energyrecovery• Nutrientcycleisclosed• Health• Climate change mitigation
[» Unit A2] & pollution reduction• Smellreduction
Fermentation
Organic Acids, Alcohols
Complex Organic Compounds[Polysaccharides, Proteins, Lipids]
Acetate, Hydrogen, Carbon Dioxide
Methane Carbon Dioxide
Acidogenesis &Acetogenesis
Figure B29 | Methane Formation Process
Methanogenesis

SUSTAINABLE ENERGY FOR FOOD – Massive Open Online Course – Reader
CHAPTER B | UNIT B2 | BIOENERGY 53
This process is part of the global carbon cycle . Due to photosynthesis, car-bonisfixatedintheformoforganicmolecules,forexampleassugarandstored in plants . After processing in the biogas plant, the same amount of CO2 is exhausted in the CHP or stove as was originally extracted from the atmosphere .
The microorganisms responsible for Steps 1 and 2 reproduce more rapidly than the methane forming bacteria . If the population of methane forming microorganisms is not adequate to reduce organic acids and alcohol as they are produced, accumulation will occur .
Although organic acids are sources of energy and carbon at low concentra-tions, they become toxic at higher concentrations . Thus, the absence in bal-ance between the fermentation and methane forming bacterial populations can cause methane formation to be inhibited . Thus a good balance of all included microorganisms is key to biogas plant operation .
Unit B2.2.2 | Carbon DioxideCarbon dioxide is naturally produced and absorbed by many organisms such as plants, animals, and microorganisms (Figure B30) . This CO2 is part of a natural environmental balance . However, huge amount of carbon are stored in the earth in the form of fossil fuels (coal, oil, natural gas and other) . If those fossil fuels are burned (usually by human activities) CO2 and thus greenhouse gas is generated .
RECAP• Biogasisprimarilycomposedofmethane(50–75percent)andcarbon
dioxide (25–45 percent) .• Biogasisunderutilizedglobally,andthereisalotofpotentialtoincrease
biogas use .• Someofthemainchallengestobiogasimplementationare:lackofinfor-
mation, government policies and trained labor force, as well as high costs, and cheaper alternative fuel sources .
• Themethaneformationprocessisfoursteps:hydrolysis,acidogenesis,acetogensis, and methanogenesis .
Figure B30 | The Carbon Cycle (www.windows2universe.org)

SUSTAINABLE ENERGY FOR FOOD – Massive Open Online Course – Reader
CHAPTER B | UNIT B2 | BIOENERGY 54
Unit B2.3 | Use of Biogas Technologies in Agricultural Value Chains
Anaerobic digestion can be carried out using a wide range of technologies . In order to determine the technology that is best suited, there are many fac-tors to consider:
• Size:large, medium, small, micro• Cost:capital investment required• Leveloftechnology• Operationandmaintenancerequirements• Terrain:space available, logistics (like electricity connection, streets, etc.)• Qualityoffeedstock:total solid matter, biogas yields• Climate:temperature, rainfall
The cost of anaerobic digestion systems depends on the complexity of the technology and the size of the system . The cost for a biogas plant ranges from hundreds to thousands of US-$ for domestic scale biogas plants . Typi-cal larger scale investment costs for a complete biogas plants including Combined Heat and Power (CHP) (example completely stirred tank reactor) are (FNR, 2016):
75 /kWel 9,000 €/kWel250 /kWel 6,000 €/kWel500 /kWel 4,600 €/kWel1000 /kWel 3,500 €/kWel
The bigger the size, the lower are the investment costs . A 1 MWel biogas plant costs about US-$ 3 .6 million .
While investment costs for anaerobic digestion systems are often much higherthansimplydisposingofwasteinlandfills,costsareoftenoffsetbythe sale of electricity to the local grid, the replacement of electricity on-farm with energy generated from biogas, and the sale of digestate as compost . In addition, there are many grant programs and funding schemes available (especially in developing countries) to ease the upfront cost of installing a biogas system .
CLOSE-UPTakamoto Pay-as-you-go Biogas
The Takamoto company has intro-duced an innovative pay-as-you-go financingschemeforsmall-scalebio-gas systems used for cooking in Kenya . Traditionally, a family-sized biogas system in Kenya would cost from US-$1,000 up to US-$1,500, but with the pay-as-you-go scheme, instal-lation is as low as US-$100 . Once installed, farmers feed the systems with animal waste (typically from the family cows), and when they are ready to use the biogas, they simply add credit via their mobile phones and the system switches on! These systems are advantageous because most farmers can afford them without tak-ing out loans and paying high installa-tion fees, and Takamoto maintains the system for life .Source: www .takamotobiogas .com
EPA Combined Heat and Power Partnership

SUSTAINABLE ENERGY FOR FOOD – Massive Open Online Course – Reader
CHAPTER B | UNIT B2 | BIOENERGY 55
Unit B2.3.1 | Anaerobic Digestion TechnologiesAnaerobic digestion technologies (Figure B31) can be divided into two cate-gories based on size:
(1) Large scale plants are industrial technologies often operated on a com-mercial scale . They usually are constructed with a reactor size of hundreds up to thousands of cubic meters and gas storage of a similar size . The gas is often used in a Combined Heat and Power (CHP) unit for commercial elec-tricity and heat production . The size of the CHP usually is between 50 kWel to 20 MWel . The planning and construction of large scale biogas plants requires experienced persons . Robust technology should be used to ensure reliable operation for many years . It is of special importance is to have skilled personnel for biogas plant operation .
organic materialOrganic materials are the “input” or “feedstock” for a biogas system. Some organic materials will digest more readily than others. Restaurant fats, oils and grease; animal manures; wastewater solids; food scraps; and by-products from food and beverage production are some of the most commonly-digested materials. A single anaerobic digester may be built for a single material or a combination of them.
Organic material is broken down in a digester
Processed biogas is distributed and used
Raw biogas isprocessed
Organic material is delivered to the digester systemThis may include animal manure, food scraps, agricultural residues, or wastewater solids.
The digester uses a natural biological process under controlled conditions to break down organic material into products for beneficial use or disposal.
The gas may be used to produce heat, electricity, vehicle fuel or injected into natural gas pipelines.
Typically, water, carbon dioxide and other trace compounds are removed, depending on the end use, leaving mostly methane.
Digested material is processed and distributedSolids and liquids from the digester may be used to produce marketable products, like fertilizer, compost, soil amendments or animal bedding.
Some biogas can be used to heat the digester.
Digested material may be returned for livestock, agricultural and gardening uses.
Liquids and solids may be separated.
the digester An anaerobic digester is one or more airtight tanks that can be equipped for mixing and warming organic material. Naturally occurring microorganisms thrive in the zero-oxygen environment and break down (digest) organic matter into usable products such as biogas and digested materials. The system will continuously produce biogas and digested material as long as the supply of organic material is continuous, and the microorganisms inside the system remain alive.
biogas processing Biogas is mostly methane, the primary component of natural gas, and carbon dioxide, plus water vapor, and other trace compounds (e.g. siloxanes and hydrogen sulfide). Biogas can replace natural gas in almost any application, but first it must be processed to remove non-methane compounds. The level of processing varies depending on the final application.
biogas distribution Processed biogas, often called “biomethane” or “renewable natural gas,” can be used the same way you use fossil natural gas: to produce heat, electricity, or vehicle fuel, or to inject into natural gas pipelines. The decision to choose one use over another is largely driven by local markets.
digestedmaterial In addition to biogas, digesters produce solid and liquid digested material, containing valuable nutrients (nitrogen, phosphorus and potassium) and organic carbon. Typically, raw digested material, or “digestate,” is processed into a wide variety of products like fertilizer, compost, soil amendments, or animal bedding, depending on the initial feedstock and local markets. These “co-products” can be sold to agricultural, commercial and residential customers.
fertilizer
SOLIDS
LIQUIDS
BIOGAS
DIGESTED MATERIAL
Figure B31 | Anaerobic Digestion Value Chain (Biogas Opportunities Roadmap, USDA, EPA & DOE, 2014; AgStar, 2015; LMOP, 2015)
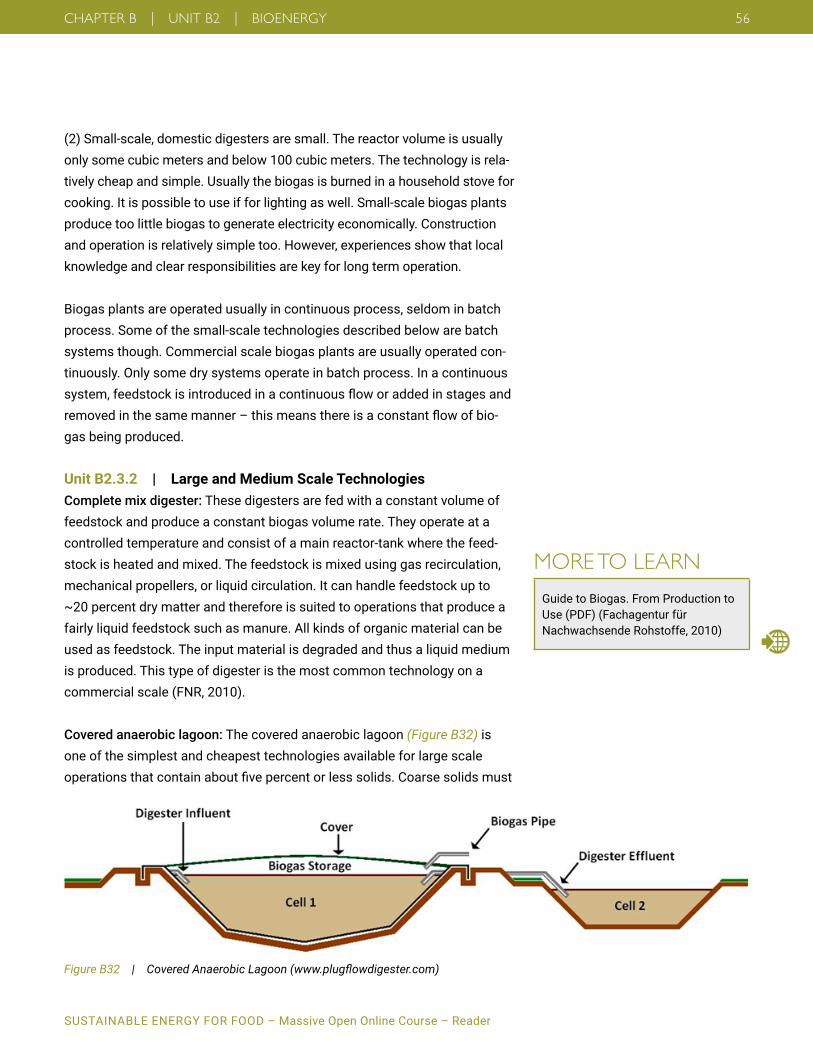
SUSTAINABLE ENERGY FOR FOOD – Massive Open Online Course – Reader
CHAPTER B | UNIT B2 | BIOENERGY 56
(2) Small-scale, domestic digesters are small . The reactor volume is usually only some cubic meters and below 100 cubic meters . The technology is rela-tively cheap and simple . Usually the biogas is burned in a household stove for cooking . It is possible to use if for lighting as well . Small-scale biogas plants produce too little biogas to generate electricity economically . Construction and operation is relatively simple too . However, experiences show that local knowledge and clear responsibilities are key for long term operation .
Biogas plants are operated usually in continuous process, seldom in batch process . Some of the small-scale technologies described below are batch systems though . Commercial scale biogas plants are usually operated con-tinuously . Only some dry systems operate in batch process . In a continuous system,feedstockisintroducedinacontinuousfloworaddedinstagesandremovedinthesamemanner–thismeansthereisaconstantflowofbio-gas being produced .
Unit B2.3.2 | Large and Medium Scale TechnologiesComplete mix digester: These digesters are fed with a constant volume of feedstock and produce a constant biogas volume rate . They operate at a controlled temperature and consist of a main reactor-tank where the feed-stock is heated and mixed . The feedstock is mixed using gas recirculation, mechanical propellers, or liquid circulation . It can handle feedstock up to ~20 percent dry matter and therefore is suited to operations that produce a fairly liquid feedstock such as manure . All kinds of organic material can be used as feedstock . The input material is degraded and thus a liquid medium is produced . This type of digester is the most common technology on a commercial scale (FNR, 2010) .
Covered anaerobic lagoon: The covered anaerobic lagoon (Figure B32) is one of the simplest and cheapest technologies available for large scale operationsthatcontainaboutfivepercentorlesssolids.Coarsesolidsmust
Figure B32 | Covered Anaerobic Lagoon (www.plugflowdigester.com)
MORE TO LEARN Guide to Biogas . From Production to Use (PDF) (Fachagentur für Nachwachsende Rohstoffe, 2010)

SUSTAINABLE ENERGY FOR FOOD – Massive Open Online Course – Reader
CHAPTER B | UNIT B2 | BIOENERGY 57
be separated out or they will form a crust on the surface of the lagoon inhib-iting biogas production . It consists of a liquid pool or “lagoon” that is topped byapontoonorfloatingcover.Sealplatesextenddownthesidesofthepon-toon into the liquid to prevent exposure of accumulated gas to the atmo-sphere . These digesters are ideal for warmer regions where atmospheric heat helps maintain the digester temperature without having to input extra energy (Balsam, 2006) . Covered lagoons are usually not heated and stirred .
Plug-flow digester:Aplug-flowdigester (Figure B33) is a tank where the feedstock is transported horizontally into one end of the digester, pushing the older material out through the opposite end in turn . A robust agitator sys-tem helps to stir the biomass and to transport it through the digester . Biogas formed in the tank bubbles to the top where it is collected . This type of digesterisusuallyheatedandthecovercaneitherbeafixedrigidtop,aflexi-bleinflatabletop,orafloatingcover(Balsam,2006).
Upflow anaerobic sludge blanket (UASB): In a UASB system (Fig-ure B34), waste- or process-water enters the reactor from the bottom andflowsupwardintosuspendedsludgeblanketfilters.Thesludgeblanketactsasafiltertoremoveunwanted solids and also contains microorganisms that facilitate the anaerobic digestion process . The motion of the biogas, that is being produced acts as a mixer, making a mechanical mixer unnecessary (Tilley et al ., 2014) .
Figure B33 | Plug-flow Digester (www.plugflowdigester.com)
Figure B34 | UASB System (www.grassrootswiki.org)

SUSTAINABLE ENERGY FOR FOOD – Massive Open Online Course – Reader
CHAPTER B | UNIT B2 | BIOENERGY 58
Unit B2.3.3 | Small-scale TechnologiesFixed dome digester: Inafixeddomedigester (Figure B35) the top is the gas holder and the bottom contains the waste slurry . As gas is produced, the slurry is displaced into a compensation tank and gas pressure increases with the volume of gas stored and the height difference between the slurry level in the digesterandtheslurrylevelinthecompensationtank.Becausefixeddomedigesters have no moving parts they are fairly inexpensive and they are well-suited to warm or medium temperature areas because they are partially con-structed underground (The GEF Small Grants Program (SGP), n .d .) . Floating drum digesters: Floating drum digesters (Figure B36) are comprised of an underground digester and a moving gas holder on top . The gas holder caneitherfloatontheslurryoronawaterjacket.Dependingontheamountofgasstoredinthegasdrum,itmovesupanddownwiththegasfluctuation.Plantsthatuseawaterjacketareslightlymoreefficientastheyarelesslikelyto get stuck in the scum layer (The GEF Small Grants Program (SGP), n .d .) .
Bag Digesters: Bag digesters (Figure B37) aremadefromdurableflexibleplastic and sit largely above ground in order to utilize sunlight as a heating source.Asthebagsheatup,methanegasisformedandthebaginflatesasthe gas moves to the surface . Gas can then be piped out of the bag for utili-zation . These systems are very inexpensive and easily transportable, how-ever the lifespan depends on the material used . Usually the material must be resistant to UV radiation and corrosive acids (from H2S) .
Figure B35 | Fixed Dome Digester (www.sgpindia.org)
Figure B36 | Floating Drum Digester (www.fao.org)
Figure B37 | Bag Digester (www.fao.org/docrep/t0541e/T0541E09.htm)

SUSTAINABLE ENERGY FOR FOOD – Massive Open Online Course – Reader
CHAPTER B | UNIT B2 | BIOENERGY 59
Figure B38 below highlights the advantages and disadvantages of the anaer-obic digestion technologies described above .
Technology Advantages Disadvantages
LARGE AND MEDIUM-SCALE TECHNOLOGIES Complete-mix digester
• Biogasproductionisgood• Handleswiderangeofconcentration• Mixingwithinthereactorisgood• Retentiontimeisless• Bacteriaandliquidhaveverygoodcontact
• Highleveloftechnology:digesterisheatedandmixed mechanically
• Capitalandenergycostsareusuallyhigh• Bacterialosscanbeanissue• Mechanicalproblems
Covered anaerobic lagoon
• Lowmaintenancerequirements• Occursatgroundtemperature,noheaterneed• Goodforseasonalharvesting• Verylowcapital• Goodinhandlingliquidwaste
• Methaneproductionfollowsseasonalpatterns• Veryhighretentiontimes• Muchofthefertilizernutrients,particularly
phosphorus, remain trapped for a long time• Slowsolidsconversion• Bacteriaandliquidhavelimitedcontact• Biogasproductionlower• Periodiccleaningisnecessary• Maintenanceoflagoonisdifficult
Plugflowdigester
• Nomechanicalmixingrequired• Verylowcapitalcost• Simplestdigesterused• Reasonableretentiontime• Canbeambienttothermophilictemperature
• Dailysystemchecktoverifyoperation• Slurrydoesnotmixlongitudinally• Noagitation• Slowsolidconversion• Biogasproductionislow• Periodiccleaningisnecessary
Upflow anaerobic sludge blanket (UASB)
• Highreductioninorganics• Canwithstandhighorganicloadingrates(upto
10 kgBOD/m3/d) and high hydraulic loading rates• Lowproductionsludge(andthus,infrequent
desludging required)• Biogascanbeusedforenergy(butusually
requiresscrubbingfirst)
• Difficulttomaintainproperhydraulicconditions(upflowandsettlingratemustbebalanced)
• Longstartuptime• Treatmentmaybeunstablewithvariablehydraulic
and organic loads• Constantsourceofelectricityisrequired• Notallpartsandmaterialsmaybeavailablelocally• Requiresexpertdesignandconstructionsupervision
SMALL-SCALE TECHNOLOGIESFixed- dome digester
• Lowinitialcosts• Nomovingorrustingpartsinvolved• Longlifeoftheplant(20yearsormore)• Constructioncreateslocalemployment
Underground construction • Protectsitfromphysicaldamageandsavesspace• Digesterisprotectedfromlowtemperaturesat
night and during cold seasons• Noday/nightfluctuationsoftemperatureinthe
digesterpositivelyinfluencethebacteriologicalprocesses (Buffers temperature extremes)
• Masonrygas-holdersrequirespecialsealantsandhigh technical skills for gas-tight construction
• Fluctuatinggaspressure.Amountofgasproducedis not immediately visible, plant operation not read-ily understandable
• Fixeddomeplantsrequireexactplanningoflevels• Excavationcanbedifficultandexpensiveinbedrock
Underground construction • Digestertemperaturesaregenerallylow• Sunshineandwarmseasonstakelongertoheat
up the digester
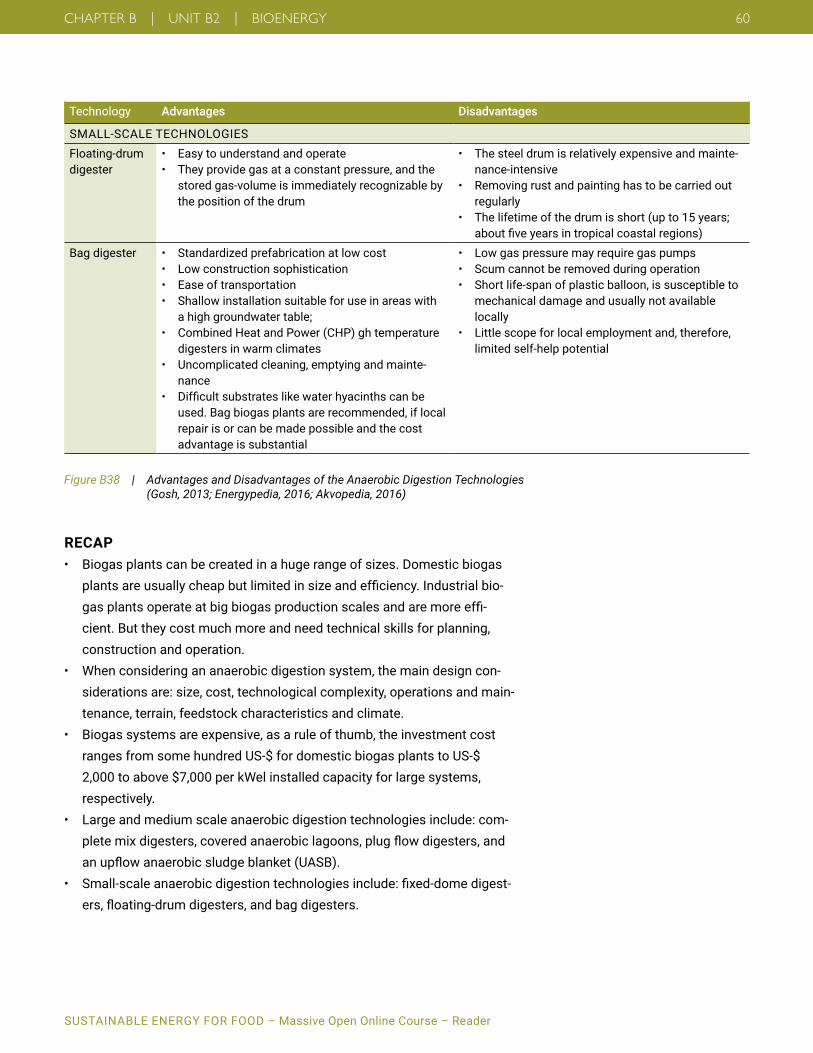
SUSTAINABLE ENERGY FOR FOOD – Massive Open Online Course – Reader
CHAPTER B | UNIT B2 | BIOENERGY 60
Technology Advantages Disadvantages
SMALL-SCALE TECHNOLOGIESFloating-drum digester
• Easytounderstandandoperate• Theyprovidegasataconstantpressure,andthe
stored gas-volume is immediately recognizable by the position of the drum
• Thesteeldrumisrelativelyexpensiveandmainte-nance-intensive
• Removingrustandpaintinghastobecarriedoutregularly
• Thelifetimeofthedrumisshort(upto15years;aboutfiveyearsintropicalcoastalregions)
Bag digester • Standardizedprefabricationatlowcost• Lowconstructionsophistication• Easeoftransportation• Shallowinstallationsuitableforuseinareaswith
a high groundwater table;• CombinedHeatandPower(CHP)ghtemperature
digesters in warm climates• Uncomplicatedcleaning,emptyingandmainte-
nance• Difficultsubstrateslikewaterhyacinthscanbe
used . Bag biogas plants are recommended, if local repair is or can be made possible and the cost advantage is substantial
• Lowgaspressuremayrequiregaspumps• Scumcannotberemovedduringoperation• Shortlife-spanofplasticballoon,issusceptibleto
mechanical damage and usually not available locally
• Littlescopeforlocalemploymentand,therefore,limited self-help potential
RECAP• Biogasplantscanbecreatedinahugerangeofsizes.Domesticbiogas
plantsareusuallycheapbutlimitedinsizeandefficiency.Industrialbio-gasplantsoperateatbigbiogasproductionscalesandaremoreeffi-cient . But they cost much more and need technical skills for planning, construction and operation .
• Whenconsideringananaerobicdigestionsystem,themaindesigncon-siderations are: size, cost, technological complexity, operations and main-tenance, terrain, feedstock characteristics and climate .
• Biogassystemsareexpensive,asaruleofthumb,theinvestmentcostranges from some hundred US-$ for domestic biogas plants to US-$ 2,000 to above $7,000 per kWel installed capacity for large systems, respectively .
• Largeandmediumscaleanaerobicdigestiontechnologiesinclude:com-pletemixdigesters,coveredanaerobiclagoons,plugflowdigesters,andanupflowanaerobicsludgeblanket(UASB).
• Small-scaleanaerobicdigestiontechnologiesinclude:fixed-domedigest-ers,floating-drumdigesters,andbagdigesters.
Figure B38 | Advantages and Disadvantages of the Anaerobic Digestion Technologies (Gosh, 2013; Energypedia, 2016; Akvopedia, 2016)

SUSTAINABLE ENERGY FOR FOOD – Massive Open Online Course – Reader
CHAPTER B | UNIT B2 | BIOENERGY 61
Unit B2.4 | Biogas Utilization Options Once biogas is produced using the anaerobic digestion process, it can be utilized as an energy source (electricity, heat, vehicle fuel or substitution of natural gas) . Industrial, commercial biogas plants usually burn the biogas in a CHP Plant, some upgrade biogas to biomethane quality .
All of the above mentioned uses replace fossil fuel sources; therefore biogas is a sustainable, renewable energy source .
Unit B2.4.1 | CogenerationCogeneration (Figure B39) is the production of electricity and heat from bio-gas . The process uses biogas to fuel a gas motor that in turn drives a gener-ator to produce electricity . Typically engines used to generate electricity throughcogenerationhaveelectricefficiencyfrom30percentforsmallerCHPs (e .g . 100 kWel) up to 40 percent for CHPs above 500 kWel . Heat is generated with the operation of the engine (cooling water and thermal energy in the exhaust) . Considering electricity and heat production, the total efficiencycanbeabout80percent.
Depending on the size of the operation, there are a variety of engines that can be used in the cogen process . For industrial processes, gas motors (50 kWel–someMWel)arethemostefficient.Thesmallerthemotor,thelowertheelectricalefficiencyis,butthehigherthethermalefficiency.
The electricity produced can usually be easily used, either directly on loca-tion (especially interesting in off-grid situations) to reduce the own electricity bill or indirectly by feeding it into the public electricity grid .
Figure B39 | Cogeneration Process Overview (www.c2es.org/technology/factsheet/CogenerationCHP)

SUSTAINABLE ENERGY FOR FOOD – Massive Open Online Course – Reader
CHAPTER B | UNIT B2 | BIOENERGY 62
The co-generated heat has two qualities: Cooling water from the motor (about90-95°C)andexhaust(about450°C).Itisoftenmoredifficulttousetheco-producedheatefficiently.However,thereareseveralopportunitiestouse the heat generated:• Locallyonthefarmforheatinghouses,stables• Dryingprocesses,forfruits(e.g.cereals)orwood• Greenhouses• Fishtanks• Sometimesitisinterestingtobuildaheatingsystemadjacenttothenext
heat consumer, e .g . a village nearby . Typical users are houses, schools, hospitals, swimming pools .
• Biogasplantscanbelocatedclosetoalocationwereheatisneeded,e.g.close to an industrial process were process heat is needed .
Unit B2.4.2 | Lighting and Cooking with Small Biogas PlantsBiogas can be used as a direct energy source for cooking stoves . This is a very popular method of use in developing countries where people often still have to spend hours each day collecting firewood for cooking [» Unit C1.4] . Small anaerobic digesters can provide a reliable source of biogas and there-foreeliminatingtheneedtousefirewoodforcooking.Cookstovesthatburnbiogas also provide a much cleaner gas that improves indoor air quality for familiesthatpreviouslyreliedonfirewood,diesel,keroseneorLPG(UnitedStates Environmental Protection Agency, 2008) .
This type of biogas can also be hooked directly into a gas lantern and pro-vide lighting .
Unit B2.4.3 | Vehicle FuelBiogas is becoming increasingly popular as a vehicle fuel in the form of compressed biomethane (CBM) . However, in order to produce biomethane the biogas must be upgraded in order to remove impurities and make it a suitable fuel . Biogas upgrading involves the removal of water, carbon diox-ide,hydrogensulfide,andothertraceelements.Theresultingupgradedbio-gas has a higher methane content (up to 99 percent) than raw biogas, which makes it comparable to conventional natural gas and thus suitable for vehi-cles that run with Compressed Natural Gas (CNG) (U .S . Department of Energy, 2015) .
Biogas-Powered Evaporative Cooling for the Dairy Industry
The University of Georgia Research Foundation (UGARF) program, Power-ing Agriculture, An Energy Grand Chal-lenge Innovator, has developed a device to chill milk and keep it cool using cow manure to produce biogas . This solution is particularly important in low-income countries where milk often spoils . These systems provide a practical solution to farmers to ensure their product lasts longer and stays cool while being transported . In addition, the systems can also be used to provide gas to households to power lights and cook stoves . Source: www .poweringag .org
MORE TO LEARN SNV: Improved Cookstoves

SUSTAINABLE ENERGY FOR FOOD – Massive Open Online Course – Reader
CHAPTER B | UNIT B2 | BIOENERGY 63
RECAP• Biogashasmanydifferentendusessuchascogenerationtoproduce
electricity and heat, cooking fuel, to power lights, and to drive vehicles• Cogenerationistheproductionofelectricityfrombiogasandtheuseof
the waste heat from the generation process• Biogascanreplacetraditionalfuelsourceslikekeroseneandwood.• Biogascanbeconvertedtovehiclefuelasbiomethaneandcansubsti-
tute CNG
SUMMARY & UNIT WRAP-UP Bioenergy resources are abundant yet underutilized throughout the world . With the wide range of available feedstocks and many different technolo-gies, there are many opportunities across many sectors to implement bioen-ergy projects .
In the developing world, 70 percent of people that live in poverty rely on agri-culture for their livelihood . This provides ample opportunities for the imple-mentation of family-size biogas operations that would greatly improve these people’s quality of life by replacing traditional fuel sources that can be expensive (kerosene or charcoal) or time-consuming and unreliable (wood gathering) with biogas; a consistent clean burning fuel source . Inevitably by increasing the amount of biogas produced and utilized around the world, the release of harmful greenhouse gases to the atmosphere would be reduced, hence contributing to global efforts to mitigate climate change [» Unit A2] . It would also contribute to the reduction of reliance on natural gas and other fossil fuel sources that are not renewable, with much cleaner, renewable fuel .
MATERIALS Please find below links to our materials and references
Videowww .giz .de/gc21/pa_video_lectures
Additional Materialwww .giz .de/gc21/pa_additional_material
Referenceswww .giz .de/gc21/pa_references
SUSTAINABLE ENERGY FOR FOOD – Massive Open Online Course – Reader
UNIT B3B3 ENERGY EFFICIENCY IN THE ENERGY AGRICULTURE NEXUS . . . . . . . . . . . . . . . . . . . . . . . . . . . . . . . . . . .65B3 .1 Energy Efficiency . . . . . . . . . . . . . . . . . . . . . . . . . . . . . . . . . . . . . . . . . . . . . . . . . . . . . . . . . . . . . . . . . . . . . . . . . . . .65B3.1.1 Efficiency . . . . . . . . . . . . . . . . . . . . . . . . . . . . . . . . . . . . . . . . . . . . . . . . . . . . . . . . . . . . . . . . . . . . . . . . . . . . . . . . . . . 65B3.1.2 Energy Efficiency in the Energy System . . . . . . . . . . . . . . . . . . . . . . . . . . . . . . . . . . . . . . . . . . . . . . . . . . . . . . . . . . 66B3.1.3 Energy Efficiency – Global Dimension and Co-Benefits . . . . . . . . . . . . . . . . . . . . . . . . . . . . . . . . . . . . . . . . . . . . . 69B3 .2 Energy Auditing . . . . . . . . . . . . . . . . . . . . . . . . . . . . . . . . . . . . . . . . . . . . . . . . . . . . . . . . . . . . . . . . . . . . . . . . . . . . .71B3.2.1 Review of Energy Use . . . . . . . . . . . . . . . . . . . . . . . . . . . . . . . . . . . . . . . . . . . . . . . . . . . . . . . . . . . . . . . . . . . . . . . . . 71B3.2.2 Site Assessment . . . . . . . . . . . . . . . . . . . . . . . . . . . . . . . . . . . . . . . . . . . . . . . . . . . . . . . . . . . . . . . . . . . . . . . . . . . . . 72B3.2.3 Data Analysis . . . . . . . . . . . . . . . . . . . . . . . . . . . . . . . . . . . . . . . . . . . . . . . . . . . . . . . . . . . . . . . . . . . . . . . . . . . . . . . . 72B3.2.4 Audit Report . . . . . . . . . . . . . . . . . . . . . . . . . . . . . . . . . . . . . . . . . . . . . . . . . . . . . . . . . . . . . . . . . . . . . . . . . . . . . . . . . 72B3 .3 Energy Efficiency in Agricultural Value Chains . . . . . . . . . . . . . . . . . . . . . . . . . . . . . . . . . . . . . . . . . . . . . . . . . . .73B3.3.1 Energy Demand Assessment . . . . . . . . . . . . . . . . . . . . . . . . . . . . . . . . . . . . . . . . . . . . . . . . . . . . . . . . . . . . . . . . . . . 73B3.3.2 Recommendations for Energy Efficiency Measures . . . . . . . . . . . . . . . . . . . . . . . . . . . . . . . . . . . . . . . . . . . . . . . . 73B3 .4 Environmental Life Cycle Assessment and Sustainability . . . . . . . . . . . . . . . . . . . . . . . . . . . . . . . . . . . . . . . . . .74B3.4.1 The Environmental LCA . . . . . . . . . . . . . . . . . . . . . . . . . . . . . . . . . . . . . . . . . . . . . . . . . . . . . . . . . . . . . . . . . . . . . . . 75B3.4.2 Life Cycle Costing . . . . . . . . . . . . . . . . . . . . . . . . . . . . . . . . . . . . . . . . . . . . . . . . . . . . . . . . . . . . . . . . . . . . . . . . . . . . 75B3.4.3 Social Life Cycle Assessment . . . . . . . . . . . . . . . . . . . . . . . . . . . . . . . . . . . . . . . . . . . . . . . . . . . . . . . . . . . . . . . . . . 76 Summary & Unit Wrap-Up . . . . . . . . . . . . . . . . . . . . . . . . . . . . . . . . . . . . . . . . . . . . . . . . . . . . . . . . . . . . . . . . . . . .77
© iEnergia
CHAPTER B | UNIT B3 | ENERGY EFFICIENCY IN THE ENERGY AGRICULTURE NEXUS 64

SUSTAINABLE ENERGY FOR FOOD – Massive Open Online Course – Reader
CHAPTER B | UNIT B3 | ENERGY EFFICIENCY IN THE ENERGY AGRICULTURE NEXUS 65
AUTHORS Ramchandra Bhandari (TH Köln – University of Applied Sciences)
David Arndt (TH Köln – University of Applied Sciences)
Günther Straub (TH Köln – University of Applied Sciences)
Please find below links to our materials and references
Videowww .giz .de/gc21/pa_video_lectures
Case Studywww .giz .de/gc21/pa_case_studies
Additional Materialwww .giz .de/gc21/pa_additional_material
Referenceswww .giz .de/gc21/pa_references
INTRODUCTIONUnitB3willprovideyouwithageneralunderstandingofthetermefficiencyand the concept of energy efficiency [» Unit B3.1] (EE) . Furthermore, this chap-terwillbrieflypresentenergy auditing [» Unit B3.2] (EA) – a tool to identify energyefficiencymeasuresandtoassessinvestmentrelatedenergyefficiencymeasures . Typical energy technologies and energy processes that occur in many agricultural value chains [» Unit B3.3] are thereby also addressed, as well as the concept of life cycle assessments and sustainability [» Unit B3.4] .
UNIT B3 ENERGY EFFICIENCY IN THE ENERGY AGRICULTURE NEXUS
Unit B3.1 | Energy Efficiency
Unit B3.1.1 | EfficiencyThetermefficiencyisusedinmanydifferentfields,forexampleinengineer-ing,economy,medicineaswellasinagriculture.Butwhatdoesefficiencyreallymean?
Generally,efficiencyisdefinedastheratioofthedesiredoutput(usefuleffect) to the required input (used resources) of any system(Pérez-Lombardetal.,2012).Efficiencycaneasilybeexpressedas:
Theequationhighlightsthatefficiencyalwaysinvolvesboththeresourcesusedandtheservicesprovided.Thereforeefficiencycanbeimprovedifthesameservice is provided using fewer resources, or if a better service is achieved with the same resource consumption as before . These two scenarios are often referred to respectively as minimization and maximization strategy .
Equation B3.I: Efficiency
S.83
𝐸𝐸𝐸𝐸𝐸𝐸𝐸𝐸𝐸𝐸𝐸𝐸𝐸𝐸𝐸𝐸𝐸𝐸𝐸𝐸 = 𝑂𝑂𝑂𝑂𝑂𝑂𝑂𝑂𝑂𝑂𝑂𝑂𝐼𝐼𝐸𝐸𝑂𝑂𝑂𝑂𝑂𝑂 = 𝑆𝑆𝐸𝐸𝑆𝑆𝑆𝑆𝐸𝐸𝐸𝐸𝐸𝐸 𝑂𝑂𝑂𝑂𝑂𝑂𝑂𝑂𝑂𝑂𝑂𝑂
𝑈𝑈𝑈𝑈𝐸𝐸𝑈𝑈 𝑅𝑅𝐸𝐸𝑈𝑈𝑅𝑅𝑂𝑂𝑆𝑆𝐸𝐸𝐸𝐸
S.84
𝜂𝜂 = 𝑈𝑈𝑈𝑈𝐸𝐸𝐸𝐸𝑂𝑂𝑈𝑈 𝐸𝐸𝐸𝐸𝐸𝐸𝑆𝑆𝐸𝐸𝐸𝐸 𝑂𝑂𝑂𝑂𝑂𝑂𝑂𝑂𝑂𝑂𝑂𝑂𝐸𝐸𝐸𝐸𝐸𝐸𝑆𝑆𝐸𝐸𝐸𝐸 𝐼𝐼𝐸𝐸𝑂𝑂𝑂𝑂𝑂𝑂
S.85
𝐿𝐿𝐸𝐸𝐿𝐿 𝑏𝑏𝑂𝑂𝑈𝑈𝑏𝑏 = 𝑂𝑂𝑂𝑂𝑂𝑂𝑂𝑂𝑂𝑂𝑂𝑂𝐼𝐼𝐸𝐸𝑂𝑂𝑂𝑂𝑂𝑂 = 𝐵𝐵𝑆𝑆𝐸𝐸𝐸𝐸ℎ𝑂𝑂𝐸𝐸𝐸𝐸𝑈𝑈𝑈𝑈
𝑃𝑃𝑅𝑅𝑃𝑃𝐸𝐸𝑆𝑆 = 1000 𝐿𝐿𝑂𝑂𝑢𝑢𝐸𝐸𝐸𝐸20 𝑊𝑊𝑊𝑊𝑂𝑂𝑂𝑂 = 50 𝑈𝑈𝑢𝑢
𝑊𝑊
𝐼𝐼𝐸𝐸𝐸𝐸𝑊𝑊𝐸𝐸𝑈𝑈𝐸𝐸𝑈𝑈𝐸𝐸𝐸𝐸𝐸𝐸𝑂𝑂 𝑈𝑈𝐸𝐸𝐸𝐸ℎ𝑂𝑂 𝑏𝑏𝑂𝑂𝑈𝑈𝑏𝑏 = 𝑂𝑂𝑂𝑂𝑂𝑂𝑂𝑂𝑂𝑂𝑂𝑂𝐼𝐼𝐸𝐸𝑂𝑂𝑂𝑂𝑂𝑂 = 𝐵𝐵𝑆𝑆𝐸𝐸𝐸𝐸ℎ𝑂𝑂𝐸𝐸𝐸𝐸𝑈𝑈𝑈𝑈
𝑃𝑃𝑅𝑅𝑃𝑃𝐸𝐸𝑆𝑆 = 1000 𝐿𝐿𝑂𝑂𝑢𝑢𝐸𝐸𝐸𝐸100 𝑊𝑊𝑊𝑊𝑂𝑂𝑂𝑂 = 10 𝑈𝑈𝑢𝑢
𝑊𝑊
S.152 NPV EQUATION
𝑁𝑁𝑃𝑃𝑁𝑁 = ∑ 𝑅𝑅𝑡𝑡(1 + 𝐸𝐸)𝑡𝑡 + 𝑅𝑅0
𝑁𝑁
𝑡𝑡=0
𝑅𝑅𝑡𝑡 = 𝑆𝑆𝑂𝑂𝑢𝑢 𝑅𝑅𝐸𝐸 𝑊𝑊𝑈𝑈𝑈𝑈 𝑂𝑂ℎ𝐸𝐸 𝑈𝑈𝐸𝐸𝑈𝑈𝐸𝐸𝑅𝑅𝑂𝑂𝐸𝐸𝑂𝑂𝐸𝐸𝑈𝑈 𝐸𝐸𝑂𝑂𝑂𝑂𝑂𝑂𝑆𝑆𝐸𝐸 𝐸𝐸𝑊𝑊𝑈𝑈ℎ 𝐸𝐸𝑈𝑈𝑅𝑅𝑃𝑃𝑈𝑈 𝑅𝑅0 = (𝑁𝑁𝐸𝐸𝐸𝐸𝑊𝑊𝑂𝑂𝐸𝐸𝑆𝑆𝐸𝐸) 𝐸𝐸𝑊𝑊𝑈𝑈ℎ 𝐸𝐸𝑈𝑈𝑅𝑅𝑃𝑃 𝑊𝑊𝑂𝑂 𝑂𝑂𝐸𝐸𝑢𝑢𝐸𝐸 𝑧𝑧𝐸𝐸𝑆𝑆𝑅𝑅, 𝑆𝑆𝐸𝐸𝑂𝑂𝑆𝑆𝐸𝐸𝑈𝑈𝐸𝐸𝐸𝐸𝑂𝑂𝐸𝐸𝐸𝐸𝐸𝐸 𝑂𝑂ℎ𝐸𝐸 𝐸𝐸𝐸𝐸𝐸𝐸𝑂𝑂𝐸𝐸𝑊𝑊𝑈𝑈 𝐸𝐸𝐸𝐸𝑆𝑆𝐸𝐸𝑈𝑈𝑂𝑂𝑢𝑢𝐸𝐸𝐸𝐸𝑂𝑂
𝑂𝑂 = 𝑇𝑇𝐸𝐸𝑢𝑢𝐸𝐸 𝑅𝑅𝐸𝐸 𝑂𝑂ℎ𝐸𝐸 𝐸𝐸𝑊𝑊𝑈𝑈ℎ 𝐸𝐸𝑈𝑈𝑅𝑅𝑃𝑃, 𝑈𝑈𝐸𝐸𝑂𝑂𝐸𝐸𝐸𝐸𝑈𝑈𝐸𝐸𝐸𝐸𝐸𝐸 𝑅𝑅𝐸𝐸 𝑂𝑂ℎ𝐸𝐸 𝑂𝑂𝑆𝑆𝑅𝑅𝑝𝑝𝐸𝐸𝐸𝐸𝑂𝑂 𝑈𝑈𝐸𝐸𝐸𝐸𝐸𝐸𝑂𝑂𝐸𝐸𝑢𝑢𝐸𝐸 𝐸𝐸 = 𝐿𝐿𝐸𝐸𝑈𝑈𝐸𝐸𝑅𝑅𝑂𝑂𝐸𝐸𝑂𝑂 𝑆𝑆𝑊𝑊𝑂𝑂𝐸𝐸 𝑅𝑅𝑆𝑆 𝑆𝑆𝑊𝑊𝑂𝑂𝐸𝐸 𝑅𝑅𝐸𝐸 𝑆𝑆𝐸𝐸𝑂𝑂𝑂𝑂𝑆𝑆𝐸𝐸
S.83
𝐸𝐸𝐸𝐸𝐸𝐸𝐸𝐸𝐸𝐸𝐸𝐸𝐸𝐸𝐸𝐸𝐸𝐸𝐸𝐸 ↑ = 𝑆𝑆𝑆𝑆𝑆𝑆𝑆𝑆𝑆𝑆𝑆𝑆𝑆𝑆 𝑂𝑂𝑂𝑂𝑂𝑂𝑂𝑂𝑂𝑂𝑂𝑂 =𝑈𝑈𝑈𝑈𝑈𝑈𝑈𝑈 𝑅𝑅𝑅𝑅𝑅𝑅𝑅𝑅𝑅𝑅𝑅𝑅𝑅𝑅𝑅𝑅 ↓
𝐸𝐸𝐸𝐸𝐸𝐸𝐸𝐸𝐸𝐸𝐸𝐸𝐸𝐸𝐸𝐸𝐸𝐸𝐸𝐸 ↑ = 𝑆𝑆𝑆𝑆𝑆𝑆𝑆𝑆𝑆𝑆𝑆𝑆𝑆𝑆 𝑂𝑂𝑂𝑂𝑂𝑂𝑂𝑂𝑂𝑂𝑂𝑂 ↑𝑈𝑈𝑈𝑈𝑈𝑈𝑈𝑈 𝑅𝑅𝑅𝑅𝑅𝑅𝑅𝑅𝑅𝑅𝑅𝑅𝑅𝑅𝑅𝑅 =
S.83
𝐸𝐸𝐸𝐸𝐸𝐸𝐸𝐸𝐸𝐸𝐸𝐸𝐸𝐸𝐸𝐸𝐸𝐸𝐸𝐸 ↑ = 𝑆𝑆𝑆𝑆𝑆𝑆𝑆𝑆𝑆𝑆𝑆𝑆𝑆𝑆 𝑂𝑂𝑂𝑂𝑂𝑂𝑂𝑂𝑂𝑂𝑂𝑂 =𝑈𝑈𝑈𝑈𝑈𝑈𝑈𝑈 𝑅𝑅𝑅𝑅𝑅𝑅𝑅𝑅𝑅𝑅𝑅𝑅𝑅𝑅𝑅𝑅 ↓
𝐸𝐸𝐸𝐸𝐸𝐸𝐸𝐸𝐸𝐸𝐸𝐸𝐸𝐸𝐸𝐸𝐸𝐸𝐸𝐸 ↑ = 𝑆𝑆𝑆𝑆𝑆𝑆𝑆𝑆𝑆𝑆𝑆𝑆𝑆𝑆 𝑂𝑂𝑂𝑂𝑂𝑂𝑂𝑂𝑂𝑂𝑂𝑂 ↑𝑈𝑈𝑈𝑈𝑈𝑈𝑈𝑈 𝑅𝑅𝑅𝑅𝑅𝑅𝑅𝑅𝑅𝑅𝑅𝑅𝑅𝑅𝑅𝑅 =

SUSTAINABLE ENERGY FOR FOOD – Massive Open Online Course – Reader
CHAPTER B | UNIT B3 | ENERGY EFFICIENCY IN THE ENERGY AGRICULTURE NEXUS 66
Letuslookatasimpleexample:Onepersonpushesarockonaflatsurfaceoveradistanceoffivemeters.Heretheusedresourceistheenergyofthepersonwhiletheserviceoroutputispushingtherockfivemeters.Nowletus add that the person uses something to reduce friction between the sur-face and the rock . The person can either go with the maximization strategy and push the rock further with the same energy used as before or the person canpushtherockoverthesamedistance(fivemeters)anduselessenergy– this would then be called a minimization strategy . Mathematically both wayshavethesameefficiencyimprovement.However,onewayaimstoreduce the input resource while the other way attempts to extract as much aspossiblefromtheresource.Asyoucanconclude,increasingefficiencydoes not necessarily mean saving resources .
Unit B3.1.2 | Energy Efficiency in the Energy SystemNowthatweknowaboutthegeneralconceptofefficiency,letusturnourfocustoenergysystems.Assessingtheirefficiencyisclassicallyachievedbylookingatenergyconversionefficiency(η),(GreekletterEta).
Equation B3.II: Energy Conversion Efficiency
Adiagramonenergyflowsandenergy losses serves to better illus-trate EE, considering the energy losses occurring in all energy con-verting processes .
The most common example of cal-culating EE is a conventional power plant where heat is converted into electricity by using a turbine and a generator . In such thermal power plants, energy input would refer to the heat we feed into the process and electricity to the useful output gained . Bothelementsareenergyflowsandcanbequantifiedbyusingthermody-namiccalculations,whichresultinanabsolutevalueforefficiency.
Unfortunately, such a straight forward procedure is not always applicable as in the example as this video (week 4) shows:
S.83
𝐸𝐸𝐸𝐸𝐸𝐸𝐸𝐸𝐸𝐸𝐸𝐸𝐸𝐸𝐸𝐸𝐸𝐸𝐸𝐸 = 𝑂𝑂𝑂𝑂𝑂𝑂𝑂𝑂𝑂𝑂𝑂𝑂𝐼𝐼𝐸𝐸𝑂𝑂𝑂𝑂𝑂𝑂 = 𝑆𝑆𝐸𝐸𝑆𝑆𝑆𝑆𝐸𝐸𝐸𝐸𝐸𝐸 𝑂𝑂𝑂𝑂𝑂𝑂𝑂𝑂𝑂𝑂𝑂𝑂
𝑈𝑈𝑈𝑈𝐸𝐸𝑈𝑈 𝑅𝑅𝐸𝐸𝑈𝑈𝑅𝑅𝑂𝑂𝑆𝑆𝐸𝐸𝐸𝐸
S.84
𝜂𝜂 = 𝑈𝑈𝑈𝑈𝐸𝐸𝐸𝐸𝑂𝑂𝑈𝑈 𝐸𝐸𝐸𝐸𝐸𝐸𝑆𝑆𝐸𝐸𝐸𝐸 𝑂𝑂𝑂𝑂𝑂𝑂𝑂𝑂𝑂𝑂𝑂𝑂𝐸𝐸𝐸𝐸𝐸𝐸𝑆𝑆𝐸𝐸𝐸𝐸 𝐼𝐼𝐸𝐸𝑂𝑂𝑂𝑂𝑂𝑂
S.85
𝐿𝐿𝐸𝐸𝐿𝐿 𝑏𝑏𝑂𝑂𝑈𝑈𝑏𝑏 = 𝑂𝑂𝑂𝑂𝑂𝑂𝑂𝑂𝑂𝑂𝑂𝑂𝐼𝐼𝐸𝐸𝑂𝑂𝑂𝑂𝑂𝑂 = 𝐵𝐵𝑆𝑆𝐸𝐸𝐸𝐸ℎ𝑂𝑂𝐸𝐸𝐸𝐸𝑈𝑈𝑈𝑈
𝑃𝑃𝑅𝑅𝑃𝑃𝐸𝐸𝑆𝑆 = 1000 𝐿𝐿𝑂𝑂𝑢𝑢𝐸𝐸𝐸𝐸20 𝑊𝑊𝑊𝑊𝑂𝑂𝑂𝑂 = 50 𝑈𝑈𝑢𝑢
𝑊𝑊
𝐼𝐼𝐸𝐸𝐸𝐸𝑊𝑊𝐸𝐸𝑈𝑈𝐸𝐸𝑈𝑈𝐸𝐸𝐸𝐸𝐸𝐸𝑂𝑂 𝑈𝑈𝐸𝐸𝐸𝐸ℎ𝑂𝑂 𝑏𝑏𝑂𝑂𝑈𝑈𝑏𝑏 = 𝑂𝑂𝑂𝑂𝑂𝑂𝑂𝑂𝑂𝑂𝑂𝑂𝐼𝐼𝐸𝐸𝑂𝑂𝑂𝑂𝑂𝑂 = 𝐵𝐵𝑆𝑆𝐸𝐸𝐸𝐸ℎ𝑂𝑂𝐸𝐸𝐸𝐸𝑈𝑈𝑈𝑈
𝑃𝑃𝑅𝑅𝑃𝑃𝐸𝐸𝑆𝑆 = 1000 𝐿𝐿𝑂𝑂𝑢𝑢𝐸𝐸𝐸𝐸100 𝑊𝑊𝑊𝑊𝑂𝑂𝑂𝑂 = 10 𝑈𝑈𝑢𝑢
𝑊𝑊
S.152 NPV EQUATION
𝑁𝑁𝑃𝑃𝑁𝑁 = ∑ 𝑅𝑅𝑡𝑡(1 + 𝐸𝐸)𝑡𝑡 + 𝑅𝑅0
𝑁𝑁
𝑡𝑡=0
𝑅𝑅𝑡𝑡 = 𝑆𝑆𝑂𝑂𝑢𝑢 𝑅𝑅𝐸𝐸 𝑊𝑊𝑈𝑈𝑈𝑈 𝑂𝑂ℎ𝐸𝐸 𝑈𝑈𝐸𝐸𝑈𝑈𝐸𝐸𝑅𝑅𝑂𝑂𝐸𝐸𝑂𝑂𝐸𝐸𝑈𝑈 𝐸𝐸𝑂𝑂𝑂𝑂𝑂𝑂𝑆𝑆𝐸𝐸 𝐸𝐸𝑊𝑊𝑈𝑈ℎ 𝐸𝐸𝑈𝑈𝑅𝑅𝑃𝑃𝑈𝑈 𝑅𝑅0 = (𝑁𝑁𝐸𝐸𝐸𝐸𝑊𝑊𝑂𝑂𝐸𝐸𝑆𝑆𝐸𝐸) 𝐸𝐸𝑊𝑊𝑈𝑈ℎ 𝐸𝐸𝑈𝑈𝑅𝑅𝑃𝑃 𝑊𝑊𝑂𝑂 𝑂𝑂𝐸𝐸𝑢𝑢𝐸𝐸 𝑧𝑧𝐸𝐸𝑆𝑆𝑅𝑅, 𝑆𝑆𝐸𝐸𝑂𝑂𝑆𝑆𝐸𝐸𝑈𝑈𝐸𝐸𝐸𝐸𝑂𝑂𝐸𝐸𝐸𝐸𝐸𝐸 𝑂𝑂ℎ𝐸𝐸 𝐸𝐸𝐸𝐸𝐸𝐸𝑂𝑂𝐸𝐸𝑊𝑊𝑈𝑈 𝐸𝐸𝐸𝐸𝑆𝑆𝐸𝐸𝑈𝑈𝑂𝑂𝑢𝑢𝐸𝐸𝐸𝐸𝑂𝑂
𝑂𝑂 = 𝑇𝑇𝐸𝐸𝑢𝑢𝐸𝐸 𝑅𝑅𝐸𝐸 𝑂𝑂ℎ𝐸𝐸 𝐸𝐸𝑊𝑊𝑈𝑈ℎ 𝐸𝐸𝑈𝑈𝑅𝑅𝑃𝑃, 𝑈𝑈𝐸𝐸𝑂𝑂𝐸𝐸𝐸𝐸𝑈𝑈𝐸𝐸𝐸𝐸𝐸𝐸 𝑅𝑅𝐸𝐸 𝑂𝑂ℎ𝐸𝐸 𝑂𝑂𝑆𝑆𝑅𝑅𝑝𝑝𝐸𝐸𝐸𝐸𝑂𝑂 𝑈𝑈𝐸𝐸𝐸𝐸𝐸𝐸𝑂𝑂𝐸𝐸𝑢𝑢𝐸𝐸 𝐸𝐸 = 𝐿𝐿𝐸𝐸𝑈𝑈𝐸𝐸𝑅𝑅𝑂𝑂𝐸𝐸𝑂𝑂 𝑆𝑆𝑊𝑊𝑂𝑂𝐸𝐸 𝑅𝑅𝑆𝑆 𝑆𝑆𝑊𝑊𝑂𝑂𝐸𝐸 𝑅𝑅𝐸𝐸 𝑆𝑆𝐸𝐸𝑂𝑂𝑂𝑂𝑆𝑆𝐸𝐸
Remember the ‘Rebound Effect’ [» Unit A3]
Recommended reading:The Rebound Effect . An Assessment of the Evidence for Economy-wide Energy Savings due to Improved EnergyEfficiency(PDF)(Sorrell,2007)
WHAT IS ENERGY EFFICIENCY?“Energyefficiencyisawayofman-aging and restraining the growth in energy consumption . Something is moreenergyefficientifitdeliversmore services for the same energy input, or the same services for less energy input .” (International Energy Agency)
Figure B40 | Illustration of Energy Flows within a System (Wikimedia)

SUSTAINABLE ENERGY FOR FOOD – Massive Open Online Course – Reader
CHAPTER B | UNIT B3 | ENERGY EFFICIENCY IN THE ENERGY AGRICULTURE NEXUS 67
As we said, modern light bulbs with LED technology are able to provide light of 1000 lumen with electricity input of 20 Watt whereas the old light bulb technol-ogyneedsfivetimesmoreelectricityinputtoprovidethesamebrightness.Using equation B3 .I, we can actually see the difference in numbers:
Asyoucansee,theLEDusestheinputresourceinamoreefficientway.However, we have to be aware that this comparison is only acceptable when the output or service is the same . In the case of a light bulb, some people say that brightness is the only important factor, but others argue, the LED provides a different light color and hence a different or less valuable service .
“Therefore, it is worth distinguishing between the quality and quantity of out-putservice.Evaluatingthequalityofservicesisgenerallydifficult”(Pérez-Lombard et al ., 2012) . As a result, we tend to focus on evaluating the quan-tity of output service, which can be measured more easily .
Inaddition,itisimportanttolookcloselyatthedenominatoroftheefficiencyequation B3 .I (the energy input) . When comparing different technologies with each other, not only the end use appliances (like a light bulb) might be changed, but also the form of energy input . For example, changing a system in which power and heat are conventionally generated in separate generation cycles whilewasteheatremainsunusedtoa)amoreefficientsystemwithheatre-useand heat recovery or b) even to a combined heat & power supply (co-generation facilities) system . See the info boxes for more detailed examples .
Energy production itself should now be incorporated into the evaluation of efficiency.
Nowadays in most countries worldwide, electricity is supplied to theend-user through a distribution grid, which is fed by centralized power plants . Commonly these power plants are powered by fossil resources like coal, gas or oil and in some cases they are nuclear power plants .
Inordertounderstandhowenergyefficiencyplaysaroleinpowergenera-tion let us discuss the power generation from coal .
CLOSE-UPHeat Recovery & Co-generation [» Unit B3.4]
a) A system of heat re-use and heat recovery: This could e .g . mean waste heat from power generation processes in power plants or from industrial production processes or others is used for other nearby cooling/ heating demands .
b) A combined heat & power supply/co-generation facilities: Due to the simultaneous generation of heat & power on-site and in a de- central-ized way, co-generation plants reachaggregateefficienciesofupto80–95percentcomparedtoeffi-ciencies of separate generation processes of around 50 percent . A ‘tri-generation’ system can also be applied in agro-food production to cover heat, power and even cooling demandsinonecombinedandeffi-cient generation processes .
Excurse to conventional electricity grids and their relation to energy efficiency
S.83
𝐸𝐸𝐸𝐸𝐸𝐸𝐸𝐸𝐸𝐸𝐸𝐸𝐸𝐸𝐸𝐸𝐸𝐸𝐸𝐸 = 𝑂𝑂𝑂𝑂𝑂𝑂𝑂𝑂𝑂𝑂𝑂𝑂𝐼𝐼𝐸𝐸𝑂𝑂𝑂𝑂𝑂𝑂 = 𝑆𝑆𝐸𝐸𝑆𝑆𝑆𝑆𝐸𝐸𝐸𝐸𝐸𝐸 𝑂𝑂𝑂𝑂𝑂𝑂𝑂𝑂𝑂𝑂𝑂𝑂
𝑈𝑈𝑈𝑈𝐸𝐸𝑈𝑈 𝑅𝑅𝐸𝐸𝑈𝑈𝑅𝑅𝑂𝑂𝑆𝑆𝐸𝐸𝐸𝐸
S.84
𝜂𝜂 = 𝑈𝑈𝑈𝑈𝐸𝐸𝐸𝐸𝑂𝑂𝑈𝑈 𝐸𝐸𝐸𝐸𝐸𝐸𝑆𝑆𝐸𝐸𝐸𝐸 𝑂𝑂𝑂𝑂𝑂𝑂𝑂𝑂𝑂𝑂𝑂𝑂𝐸𝐸𝐸𝐸𝐸𝐸𝑆𝑆𝐸𝐸𝐸𝐸 𝐼𝐼𝐸𝐸𝑂𝑂𝑂𝑂𝑂𝑂
S.85
𝐿𝐿𝐸𝐸𝐿𝐿 𝑏𝑏𝑂𝑂𝑈𝑈𝑏𝑏 = 𝑂𝑂𝑂𝑂𝑂𝑂𝑂𝑂𝑂𝑂𝑂𝑂𝐼𝐼𝐸𝐸𝑂𝑂𝑂𝑂𝑂𝑂 = 𝐵𝐵𝑆𝑆𝐸𝐸𝐸𝐸ℎ𝑂𝑂𝐸𝐸𝐸𝐸𝑈𝑈𝑈𝑈
𝑃𝑃𝑅𝑅𝑃𝑃𝐸𝐸𝑆𝑆 = 1000 𝐿𝐿𝑂𝑂𝑢𝑢𝐸𝐸𝐸𝐸20 𝑊𝑊𝑊𝑊𝑂𝑂𝑂𝑂 = 50 𝑈𝑈𝑢𝑢
𝑊𝑊
𝐼𝐼𝐸𝐸𝐸𝐸𝑊𝑊𝐸𝐸𝑈𝑈𝐸𝐸𝑈𝑈𝐸𝐸𝐸𝐸𝐸𝐸𝑂𝑂 𝑈𝑈𝐸𝐸𝐸𝐸ℎ𝑂𝑂 𝑏𝑏𝑂𝑂𝑈𝑈𝑏𝑏 = 𝑂𝑂𝑂𝑂𝑂𝑂𝑂𝑂𝑂𝑂𝑂𝑂𝐼𝐼𝐸𝐸𝑂𝑂𝑂𝑂𝑂𝑂 = 𝐵𝐵𝑆𝑆𝐸𝐸𝐸𝐸ℎ𝑂𝑂𝐸𝐸𝐸𝐸𝑈𝑈𝑈𝑈
𝑃𝑃𝑅𝑅𝑃𝑃𝐸𝐸𝑆𝑆 = 1000 𝐿𝐿𝑂𝑂𝑢𝑢𝐸𝐸𝐸𝐸100 𝑊𝑊𝑊𝑊𝑂𝑂𝑂𝑂 = 10 𝑈𝑈𝑢𝑢
𝑊𝑊
S.152 NPV EQUATION
𝑁𝑁𝑃𝑃𝑁𝑁 = ∑ 𝑅𝑅𝑡𝑡(1 + 𝐸𝐸)𝑡𝑡 + 𝑅𝑅0
𝑁𝑁
𝑡𝑡=0
𝑅𝑅𝑡𝑡 = 𝑆𝑆𝑂𝑂𝑢𝑢 𝑅𝑅𝐸𝐸 𝑊𝑊𝑈𝑈𝑈𝑈 𝑂𝑂ℎ𝐸𝐸 𝑈𝑈𝐸𝐸𝑈𝑈𝐸𝐸𝑅𝑅𝑂𝑂𝐸𝐸𝑂𝑂𝐸𝐸𝑈𝑈 𝐸𝐸𝑂𝑂𝑂𝑂𝑂𝑂𝑆𝑆𝐸𝐸 𝐸𝐸𝑊𝑊𝑈𝑈ℎ 𝐸𝐸𝑈𝑈𝑅𝑅𝑃𝑃𝑈𝑈 𝑅𝑅0 = (𝑁𝑁𝐸𝐸𝐸𝐸𝑊𝑊𝑂𝑂𝐸𝐸𝑆𝑆𝐸𝐸) 𝐸𝐸𝑊𝑊𝑈𝑈ℎ 𝐸𝐸𝑈𝑈𝑅𝑅𝑃𝑃 𝑊𝑊𝑂𝑂 𝑂𝑂𝐸𝐸𝑢𝑢𝐸𝐸 𝑧𝑧𝐸𝐸𝑆𝑆𝑅𝑅, 𝑆𝑆𝐸𝐸𝑂𝑂𝑆𝑆𝐸𝐸𝑈𝑈𝐸𝐸𝐸𝐸𝑂𝑂𝐸𝐸𝐸𝐸𝐸𝐸 𝑂𝑂ℎ𝐸𝐸 𝐸𝐸𝐸𝐸𝐸𝐸𝑂𝑂𝐸𝐸𝑊𝑊𝑈𝑈 𝐸𝐸𝐸𝐸𝑆𝑆𝐸𝐸𝑈𝑈𝑂𝑂𝑢𝑢𝐸𝐸𝐸𝐸𝑂𝑂
𝑂𝑂 = 𝑇𝑇𝐸𝐸𝑢𝑢𝐸𝐸 𝑅𝑅𝐸𝐸 𝑂𝑂ℎ𝐸𝐸 𝐸𝐸𝑊𝑊𝑈𝑈ℎ 𝐸𝐸𝑈𝑈𝑅𝑅𝑃𝑃, 𝑈𝑈𝐸𝐸𝑂𝑂𝐸𝐸𝐸𝐸𝑈𝑈𝐸𝐸𝐸𝐸𝐸𝐸 𝑅𝑅𝐸𝐸 𝑂𝑂ℎ𝐸𝐸 𝑂𝑂𝑆𝑆𝑅𝑅𝑝𝑝𝐸𝐸𝐸𝐸𝑂𝑂 𝑈𝑈𝐸𝐸𝐸𝐸𝐸𝐸𝑂𝑂𝐸𝐸𝑢𝑢𝐸𝐸 𝐸𝐸 = 𝐿𝐿𝐸𝐸𝑈𝑈𝐸𝐸𝑅𝑅𝑂𝑂𝐸𝐸𝑂𝑂 𝑆𝑆𝑊𝑊𝑂𝑂𝐸𝐸 𝑅𝑅𝑆𝑆 𝑆𝑆𝑊𝑊𝑂𝑂𝐸𝐸 𝑅𝑅𝐸𝐸 𝑆𝑆𝐸𝐸𝑂𝑂𝑂𝑂𝑆𝑆𝐸𝐸
Figure B41 | LED Technology
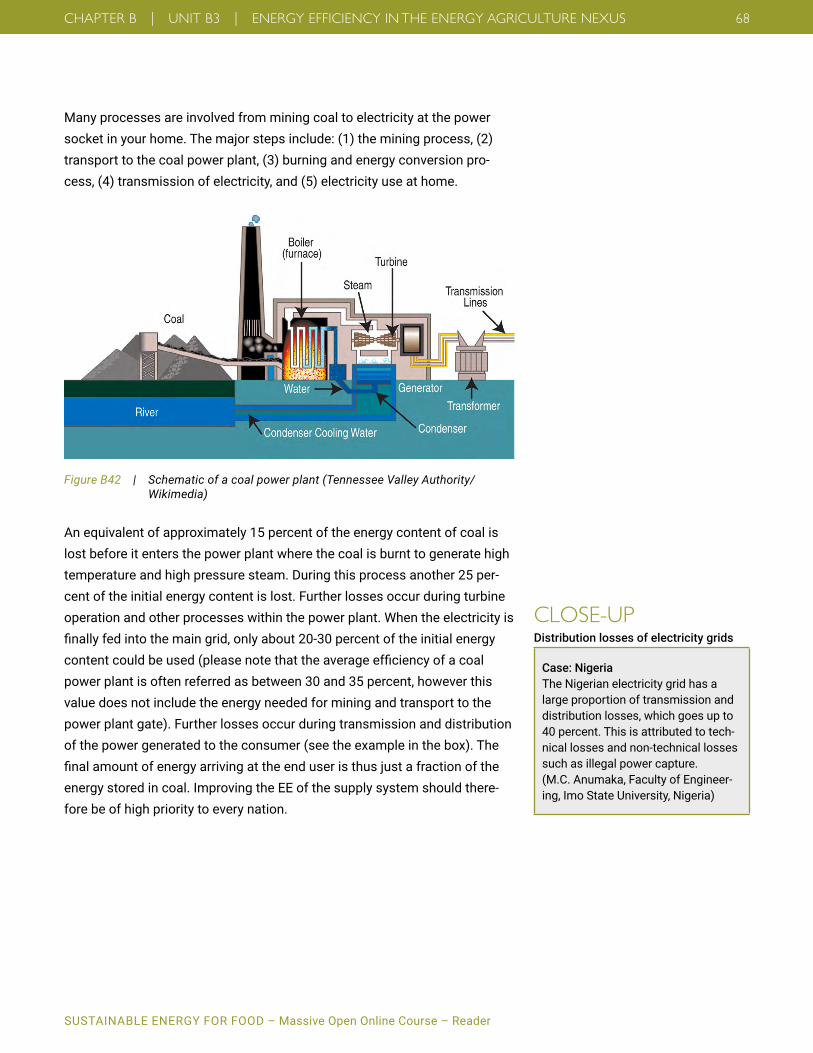
SUSTAINABLE ENERGY FOR FOOD – Massive Open Online Course – Reader
CHAPTER B | UNIT B3 | ENERGY EFFICIENCY IN THE ENERGY AGRICULTURE NEXUS 68
Many processes are involved from mining coal to electricity at the power socket in your home . The major steps include: (1) the mining process, (2) transport to the coal power plant, (3) burning and energy conversion pro-cess, (4) transmission of electricity, and (5) electricity use at home .
An equivalent of approximately 15 percent of the energy content of coal is lost before it enters the power plant where the coal is burnt to generate high temperature and high pressure steam . During this process another 25 per-cent of the initial energy content is lost . Further losses occur during turbine operation and other processes within the power plant . When the electricity is finallyfedintothemaingrid,onlyabout20-30percentoftheinitialenergycontentcouldbeused(pleasenotethattheaverageefficiencyofacoalpower plant is often referred as between 30 and 35 percent, however this value does not include the energy needed for mining and transport to the power plant gate) . Further losses occur during transmission and distribution of the power generated to the consumer (see the example in the box) . The finalamountofenergyarrivingattheenduseristhusjustafractionoftheenergy stored in coal . Improving the EE of the supply system should there-fore be of high priority to every nation .
Figure B42 | Schematic of a coal power plant (Tennessee Valley Authority/ Wikimedia)
CLOSE-UPDistribution losses of electricity grids
Case: NigeriaThe Nigerian electricity grid has a large proportion of transmission and distribution losses, which goes up to 40 percent . This is attributed to tech-nical losses and non-technical losses such as illegal power capture .(M .C . Anumaka, Faculty of Engineer-ing, Imo State University, Nigeria)
SUSTAINABLE ENERGY FOR FOOD – Massive Open Online Course – Reader
CHAPTER B | UNIT B3 | ENERGY EFFICIENCY IN THE ENERGY AGRICULTURE NEXUS 69
Unit B3.1.3 | Energy Efficiency – Global Dimension and Co-Benefits
WeconsiderEEas„theworld´sfirstfuel“.Thepotentialisimmense.Theyare not only an important lever to protect the climate, but also an instrument to combat poverty . Agriculture and food production play an important role hereby . After all they are responsible for 30 percent of global greenhouse gas emissions, and use four percent of global fossil energy alone . (Gilbert, 2012) On the other hand crop yield irrigation can increase up to 300 percent and therefore increase small farmers’ income (Giordano et al ., 2012) . If renewables-based water pumping is used, only an unnoticeable increase in emissions ensues .
In the meantime governments, as well as international committees, have recognizedthesignificanceofEEandenshrineditasanobjective.Henceahigher EE is an important goal of Sustainable Development Goals (SDGs) . Apart from this, in the second commitment of the Paris Declaration govern-ments,regionsandcitiesissuedatargetofincreasingenergyefficiencyby40 percent by 2030 (based on 1990 data) . Climate change cannot be stoppedwithoutenergyefficiency.EEisalsoalong-termpriorityforG20 states, which consume about 80 percent of all global energy (G20, 2016) .
In2014theyadoptedtheEnergyEfficiencyActionPlan,whichisbeingimple-mentedbytheInternationalPartnershipforEnergyEfficiencyCooperation(IPEEC) . According to the thinking of the G20 states, increased collaboration onenergyefficiencycandriveso-calledco-benefits(ormultiplebenefits)likeeconomic activity and productivity, strengthen energy security and improve environmental outcomes . Furthermore it improves energy intensity, for example the energy consumption of a national economy in comparison to its gross domestic product . This key indicator makes it possible to compare EE (G20, 2016) . The Global Tracking Framework, a Sustainable Energy for All (SE4All) initiative started by the UN and published under the successful EE Models and Milestones, allows a further comparison .
What Agriculture Can ContributeThe nutritional sector continues to be based on fossil energy sources to a high degree, be it in farm mechanization, fertilizer production, food process-ing or distribution (remember Chapter 1) . In order to feed 9 .7 billion people by 2050 the sector must produce 70 percent more food . If energy consump-tion is not to increase comparatively, savings potential must be achieved through EE . According to IRENA the potentials lie between ten and twenty percent . There are many possibilities as the figure B43 illustrates .
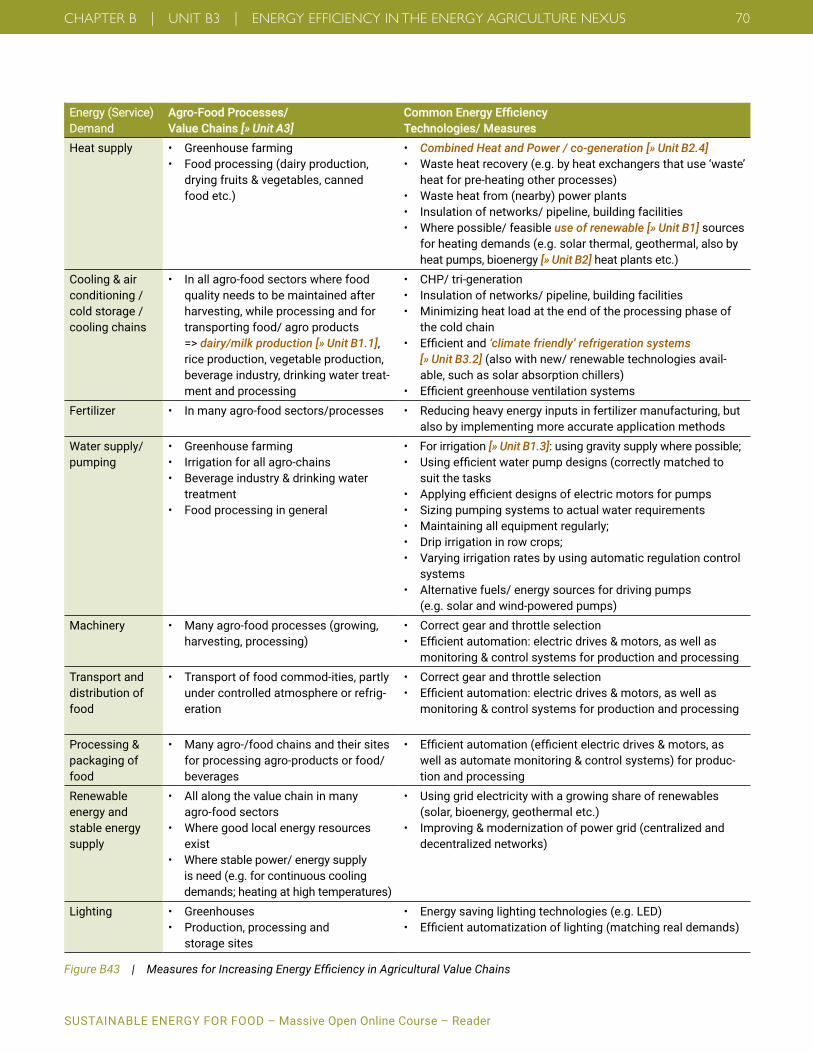
SUSTAINABLE ENERGY FOR FOOD – Massive Open Online Course – Reader
CHAPTER B | UNIT B3 | ENERGY EFFICIENCY IN THE ENERGY AGRICULTURE NEXUS 70
Energy (Service) Demand
Agro-Food Processes/ Value Chains [» Unit A3]
Common Energy Efficiency Technologies/ Measures
Heat supply • Greenhousefarming• Foodprocessing(dairyproduction,
drying fruits & vegetables, canned food etc .)
• Combined Heat and Power / co-generation [» Unit B2.4]• Wasteheatrecovery(e.g.byheatexchangersthatuse‘waste’
heat for pre-heating other processes)• Wasteheatfrom(nearby)powerplants• Insulationofnetworks/pipeline,buildingfacilities• Wherepossible/feasibleuse of renewable [» Unit B1] sources
for heating demands (e .g . solar thermal, geothermal, also by heat pumps, bioenergy [» Unit B2] heat plants etc .)
Cooling & air conditioning / cold storage / cooling chains
• Inallagro-foodsectorswherefoodquality needs to be maintained after harvesting, while processing and for transporting food/ agro products =>dairy/milk production [» Unit B1.1], rice production, vegetable production, beverage industry, drinking water treat-ment and processing
• CHP/tri-generation• Insulationofnetworks/pipeline,buildingfacilities• Minimizingheatloadattheendoftheprocessingphaseof
the cold chain• Efficientand‘climate friendly’ refrigeration systems
[» Unit B3.2] (also with new/ renewable technologies avail-able, such as solar absorption chillers)
• EfficientgreenhouseventilationsystemsFertilizer • Inmanyagro-foodsectors/processes • Reducingheavyenergyinputsinfertilizermanufacturing,but
also by implementing more accurate application methodsWater supply/ pumping
• Greenhousefarming• Irrigationforallagro-chains• Beverageindustry&drinkingwater
treatment• Foodprocessingingeneral
• Forirrigation [» Unit B1.3]: using gravity supply where possible;• Usingefficientwaterpumpdesigns(correctlymatchedto
suit the tasks• Applyingefficientdesignsofelectricmotorsforpumps• Sizingpumpingsystemstoactualwaterrequirements• Maintainingallequipmentregularly;• Dripirrigationinrowcrops;• Varyingirrigationratesbyusingautomaticregulationcontrol
systems• Alternativefuels/energysourcesfordrivingpumps
(e .g . solar and wind-powered pumps)Machinery • Manyagro-foodprocesses(growing,
harvesting, processing)• Correctgearandthrottleselection• Efficientautomation:electricdrives&motors,aswellas
monitoring & control systems for production and processingTransport and distribution of food
• Transportoffoodcommod-ities,partlyunder controlled atmosphere or refrig-eration
• Correctgearandthrottleselection• Efficientautomation:electricdrives&motors,aswellas
monitoring & control systems for production and processing
Processing & packaging of food
• Manyagro-/foodchainsandtheirsitesfor processing agro-products or food/ beverages
• Efficientautomation(efficientelectricdrives&motors,aswell as automate monitoring & control systems) for produc-tion and processing
Renewable energy and stable energy supply
• Allalongthevaluechaininmany agro-food sectors
• Wheregoodlocalenergyresourcesexist
• Wherestablepower/energysupply is need (e .g . for continuous cooling demands; heating at high temperatures)
• Usinggridelectricitywithagrowingshareofrenewables(solar, bioenergy, geothermal etc .)
• Improving&modernizationofpowergrid(centralizedanddecentralized networks)
Lighting • Greenhouses• Production,processingand
storage sites
• Energysavinglightingtechnologies(e.g.LED)• Efficientautomatizationoflighting(matchingrealdemands)
Figure B43 | Measures for Increasing Energy Efficiency in Agricultural Value Chains

SUSTAINABLE ENERGY FOR FOOD – Massive Open Online Course – Reader
CHAPTER B | UNIT B3 | ENERGY EFFICIENCY IN THE ENERGY AGRICULTURE NEXUS 71
RECAP• Generally,efficiencyisdefinedastheratioofthedesiredoutput(useful
effect) to the required input (used resources) of any system .• Whenassessingenergyefficiencyonehastomakesurethattheservices
provided and the input resources used by the system are comparable and measurable .
• Energyefficiencyhasbeenformulatedasanimportantgoalinmultipleinternational agreements in the meantime .
• Thenutritionalsectoriscurrentlymainlybasedonfossilenergy.Therearemanypossibilitiestotherebyincreaseenergyefficiencyorreplacefossil with renewables .
Unit B3.2 | Energy Auditing A Tool for Identifying Energy Efficency Potential & MeasuresWithin the agricultural value chain many [» Figure 2 in Unit A1] processes need energy, mainly for electricity, heat and cooling demands . A good exam-ple in agriculture is irrigation . In India for example, farmers operate around 18 million grid-connected pump sets and seven million diesel pump sets . Replacing these pumps with solar pumps could decrease India´s annual car-bon dioxide emissions by nearly six percent (Shah, 2015) . However, incen-tivestobuymoreefficientpumpsorsolarpumpsarelackingaslongasthestate subsidizes electricity and diesel for farmers . If one wants to promote energyefficiency,thennotonlytechnicalaspects,butalsosocio-culturalandpolitical aspects must be considered .
Energy audits (EA) are an important instrument to analyze potentials of EE . EAcanalsoformanimportantbasisorfirststepforintroducingandestab-lishing energy management systems (EMS) in enterprises/ other institu-tions.Theyenableefficientmanagementofenergydemandandconsump-tion in production o processing entities . (International Standard for EMS: ISO 50001).RegardingEA,ISO50002:2014isveryimportant.Itspecifiesnotonly the process requirements for carrying out an EA in relation to energy performance, but also the procedures of carrying out EA . However, EA for the agricultural value chains of developing countries must be adjusted . Pro-fessionals must be trained accordingly .
Unit B3.2.1 | Review of Energy UseIn this phase of the auditing process the energy use of the system,is assessed by reviewing energy bills or fuel consumption patterns in the past.Also,asystemdiagramissketchedshowingtheenergyflowswithinthe system along with a list of equipment used and the energy required to
1. ReviewofEnergyUse
2. SiteAssessment
3. EnergyandCostAnalysis
4. AuditReport
THE MAIN GOALS OF ENERGY AUDITS ARE• Understandinghowenergyisused
within the system or process and where it is wasted
• Findingalternativemeasurestoreduce energy losses and improve overall performance
• Performingacost-benefitanalysistoidentifywhichenergyefficiencymeasures are best to implement

SUSTAINABLE ENERGY FOR FOOD – Massive Open Online Course – Reader
CHAPTER B | UNIT B3 | ENERGY EFFICIENCY IN THE ENERGY AGRICULTURE NEXUS 72
run it . The more detailed the energy usage data is the better will be the actual analysis . At this point, monthly data is most common; however, daily or even hourly data would be more accurate . With the collected data the auditorisabletocalculatethetotalenergydemandforspecificscenarios(seasonal variation/ production intensity) . Then, it is possible to determine a “per square meter energy use“ or an „energy use per produced product unit”, to benchmark the system against other similar processes .
Unit B3.2.2 | Site AssessmentDuring the site assessment, the system components are examined and their performance data is collected . This step can for example include, the opera-tion characteristics of a fan used for drying or lighting used throughout the building .
Unit B3.2.3 | Data AnalysisThe data analysis step is the most complex part and involves technical and cost analysis . Analyzing methodologies vary widely and are subject to the system or process to be assessed . The technical analysis can incorpo-rate a simple spreadsheet energy balance where all parameters are deter-mined or can be achieved by designated software packages . The same methods apply for the cost analysis, where current energy costs, costs for energyefficiencymeasuresaswellaspotentialsavingsareconsidered.The results of both analyses lead to a hierarchy of the most promising changesfrombothfinancialandtechnicalpointsofview.Guidingindica-tors are amongst others the payback period, life cycle costs as well as the internalrateofreturnofenergyefficiencymeasures.MoreinformationaboutsuchfinancialanalysiswillbeavailableinUnits C2 [» Unit C2] and C3 [» Unit C3] of this Reader .
Unit B3.2.4 | Audit ReportThe last phase of the auditing process is creating a comprehensive report .
RECAP• Energyauditingistheanalysisofprocessorsystemwithregardtotheir
energy usage and energy losses .• Byreviewingloadpatterns,executingsitevisitsandmeasuringprocess
energydemands,suitableenergyefficiencymeasurescanbedetermined.• Energyauditresultsareusefulforeconomicandenvironmentalbetter-
ment of the analyzed processes, thus it is a very important tool in the energy sector .
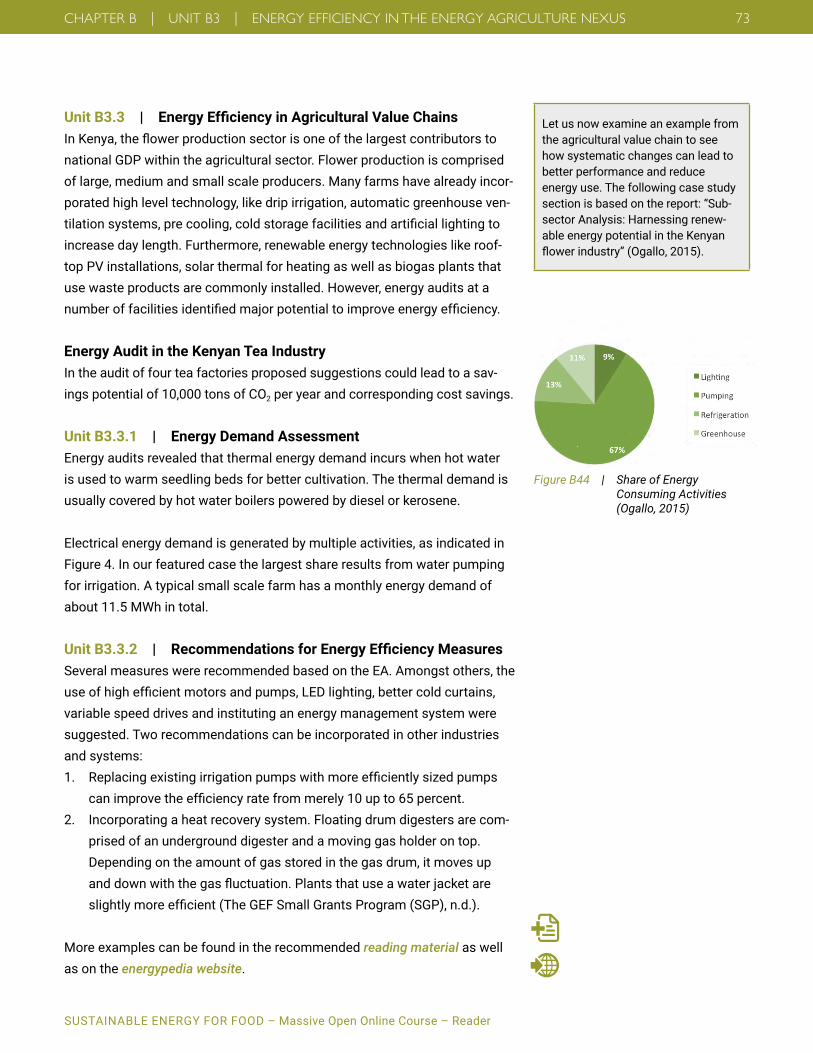
SUSTAINABLE ENERGY FOR FOOD – Massive Open Online Course – Reader
CHAPTER B | UNIT B3 | ENERGY EFFICIENCY IN THE ENERGY AGRICULTURE NEXUS 73
Let us now examine an example from the agricultural value chain to see how systematic changes can lead to better performance and reduce energy use . The following case study section is based on the report: “Sub-sector Analysis: Harnessing renew-able energy potential in the Kenyan flowerindustry”(Ogallo,2015).
Unit B3.3 | Energy Efficiency in Agricultural Value ChainsInKenya,theflowerproductionsectorisoneofthelargestcontributorstonational GDP within the agricultural sector . Flower production is comprised of large, medium and small scale producers . Many farms have already incor-porated high level technology, like drip irrigation, automatic greenhouse ven-tilationsystems,precooling,coldstoragefacilitiesandartificiallightingtoincrease day length . Furthermore, renewable energy technologies like roof-top PV installations, solar thermal for heating as well as biogas plants that use waste products are commonly installed . However, energy audits at a numberoffacilitiesidentifiedmajorpotentialtoimproveenergyefficiency.
Energy Audit in the Kenyan Tea Industry In the audit of four tea factories proposed suggestions could lead to a sav-ings potential of 10,000 tons of CO2 per year and corresponding cost savings .
Unit B3.3.1 | Energy Demand AssessmentEnergy audits revealed that thermal energy demand incurs when hot water is used to warm seedling beds for better cultivation . The thermal demand is usually covered by hot water boilers powered by diesel or kerosene .
Electrical energy demand is generated by multiple activities, as indicated in Figure 4 . In our featured case the largest share results from water pumping for irrigation . A typical small scale farm has a monthly energy demand of about 11 .5 MWh in total .
Unit B3.3.2 | Recommendations for Energy Efficiency MeasuresSeveral measures were recommended based on the EA . Amongst others, the useofhighefficientmotorsandpumps,LEDlighting,bettercoldcurtains,variable speed drives and instituting an energy management system were suggested . Two recommendations can be incorporated in other industries and systems:1. Replacingexistingirrigationpumpswithmoreefficientlysizedpumps
canimprovetheefficiencyratefrommerely10upto65percent.2. Incorporatingaheatrecoverysystem.Floatingdrumdigestersarecom-
prised of an underground digester and a moving gas holder on top . Depending on the amount of gas stored in the gas drum, it moves up anddownwiththegasfluctuation.Plantsthatuseawaterjacketareslightlymoreefficient(TheGEFSmallGrantsProgram(SGP),n.d.).
More examples can be found in the recommended reading material as well as on the energypedia website .
Figure B44 | Share of Energy Consuming Activities (Ogallo, 2015)

SUSTAINABLE ENERGY FOR FOOD – Massive Open Online Course – Reader
CHAPTER B | UNIT B3 | ENERGY EFFICIENCY IN THE ENERGY AGRICULTURE NEXUS 74
RECAP• Energyauditsareparticularlysignificantwhenfarmsorcompanieswith
similar processes are compared .• Re-usingenergywithinasystem,e.g.heatrecoverysystems,oftenleads
tomajorimprovementsinefficiency.
Unit B3.4 | Environmental Life Cycle Assessment and Sustainability
Transformingaprojecttobecomemoreenergyefficientisabigachieve-ment.However,energyefficiencygoesbeyondthefarmgate.Evenmore,producing or consuming a product should be sustainable . But what does sustainabilitymeanandhowcanweachieveit?
What is Sustainability/Sustainable Development?Themostcommondefinitionofsustainabledevelopmentwasestablishedby the United Nations’ World Commission on Environment and Development in 1987 . It states:
“Sustainable development is development that meets the needs of the pres-ent without compromising the ability of future generations to meet their own needs .”
In more practical terms sustainability has three pillars: Environment, Econ-omy and Society . If one of the three pillars is not considered adequately, the system’s sustainability is affected . Environmental sustainability is the ability oftheenvironmenttosupportadefinedlevelofenvironmentalqualityandnaturalresourceextractionratesindefinitely.Socialsustainabilityistheabilityof a social system, such as a country, family, or organization, to function at a definedlevelofsocialwell-beingindefinitely.War,poverty,inequality,injustice,and low education rates, etc . are symptoms of a system that is socially less sustainable . The last pillar is economic sustainability, which is the ability of aneconomytosupportadefinedlevelofproductionindefinitely.
Todetermineifweareworkinginasustainablemanner,differentscientifictools such as Life Cycle Sustainability Assessment (LCSA) may be used . It systematically analyses the impact of products, processes or services along the entire life cycle . Formerly LCAs were mainly applied to quantify environ-mental impacts . Nowadays approaches to quantify even the economic and the social impacts exist . These rather new approaches are called life cycle costing and social life cycle assessment .
Figure B45 | Life Cycle Sustainability Assessment (SFB sus-tainable manufacturing/TU Berlin)

SUSTAINABLE ENERGY FOR FOOD – Massive Open Online Course – Reader
CHAPTER B | UNIT B3 | ENERGY EFFICIENCY IN THE ENERGY AGRICULTURE NEXUS 75
TheUnitedNationEnvironmentProgram(UNEP)definesLCSAastheevalua-tionofallenvironmental,socialandeconomicnegativeimpactsandbenefitsin decision-making processes to produce in a sustainable manner throughout the life cycle . Performing such an assessment for a product makes it possi-ble to not only structure all information about a product in a coherent way, but to also illuminate parts within a value chain in order to avoid or reduce nega-tive impacts on the environment . In general the LCAs are used to support decision making . The (environmental) life cycle assessment (LCA) measures negative impacts on nature, life cycle costing addresses economic sustain-ability and social life cycle assessment assesses impact on societies .
Unit B3.4.1 | The Environmental LCANowadays, Environmental LCA is the most commonly performed assessment tool . ISO (International Standardization Organization)has developed two standards: ISO 14040 describes the framework for LCA and ISO 14044 describes the procedure to carry out the LCA . ISO performs the LCA in four phases to:1. Goal and Scope Definition: ThefirstphaseofaLCAspecifiestheobjec-
tive(s) and the framework of the assessment . This includes, for instance, definitionofthesystemboundaries,ofthesystem’sfunctionalunit,andof data quality requirements .
2. Life Cycle Inventory (LCI): The LCI step includes data collection for all required input and output materials (resources, emissions), as well as energyflows.Allmaterialandenergyflowsarerecordedandcompiledinthe inventory .
3. Life Cycle Impact Assessment (LCIA): LCIA refers to the calculation of potential environmental impact, human health impact and effects on resource availability . Impact is calculated based on the inventory results andspecificcharacterizationmodelsforeachsubstance.
4. Interpretation: The calculated LCI and LCIA results are interpreted with respect to the goal of the LCA study and decision-making recommenda-tions are given .
Unit B3.4.2 | Life Cycle CostingLife cycle costing (LCC) is the oldest of the three life cycle techniques . Devel-oped originally from a strict cost accounting perspective, in recent years LCC has become increasingly important .

SUSTAINABLE ENERGY FOR FOOD – Massive Open Online Course – Reader
CHAPTER B | UNIT B3 | ENERGY EFFICIENCY IN THE ENERGY AGRICULTURE NEXUS 76
LCC is essentially an aggregation of all costs that are directly related to a product or services over its entire life . It also takes external relevant costs andanticipatedbenefitsintoaccount.Thefourphases,similartoenviron-mental LCA, are:1. Definition of Goal2. Scope and Functional Unit 3. Inventory Costs4. Aggregate Costs (by categories and interpretation of results)
Unit B3.4.3 | Social Life Cycle AssessmentA social life cycle assessment (SLCA) is described as ‘a social impact (and potential impact) assessment technique that aims to assess the social and socio-economic aspects of products and their potential positive and negative impacts along their life cycle . SLCA focuses on the people involved . It assesses not only working hours per product produced, but also the impact ofhowaproduct’slifecycleinfluenceshumanrights,workingconditions,health and safety, as well as socio-economic repercussions .
Due to the fact that social impacts are often subjective and far-reaching, findingaquantitativemeasureisdifficult.However,awellperformedSLCAcan reveal major shortcomings and negative impacts that LCA and LCC can-not capture .
MORE TO LEARNGuideline for Social Life Cycle Assessment (PDF) (UNEP, 2009)
LCA for Milk Packaging
Life-Cycle Assessment of Energy and Environmental Impacts of LED Light-ing Products
LCA of Drinking Water Systems
SUSTAINABLE ENERGY FOR FOOD – Massive Open Online Course – Reader
CHAPTER B | UNIT B3 | ENERGY EFFICIENCY IN THE ENERGY AGRICULTURE NEXUS 77
SUMMARY & UNIT WRAP-UP • Energyefficiencyhasthepotentialtoreduceusageofresources,energy
costs and environmental impacts often with simple methods or small changes .
• Insomecasesenergyefficiencyisachievedbyincreasingoutputwhilemaintaining the input resource . However, note that a small change in usedinputresources(e.g.electrification)canresultinmuchlargerresource conservation as the effect multiplies at the beginning of the value chain (e .g . amount of coal that will not be excavated) .
• Energyaudithelpstosystematicallyfindenergylossesandpotentialsforenergy savings and can therefore lead to quick return of the costs for the analysis .
• Notonlytheprocesseslocatedonthefarmorinthefactoryneedtobesustainable but also the whole product chain from resource to disposal or recycling .
• Assessingthelifecycleofaproductinformsregardingitsenvironmental,economic and social impacts and provides the bases for fact-based deci-sion making .
MATERIALS Please find below links to our materials and references
Videowww .giz .de/gc21/pa_video_lectures
Case Studywww .giz .de/gc21/pa_case_studies
Additional Materialwww .giz .de/gc21/pa_additional_material
Referenceswww .giz .de/gc21/pa_references

SUSTAINABLE ENERGY FOR FOOD – Massive Open Online Course – Reader
CHAPTER C 78
CHAPTER CC1 POLICIES AND REGULATIONS FOR THE ENERGY AGRICULTURE NEXUS . . . . . . . . . . . . . . . . . . . . . . . . . .79C1 .1 Policies and Politics of Renewable Energy . . . . . . . . . . . . . . . . . . . . . . . . . . . . . . . . . . . . . . . . . . . . . . . . . . . . . .81C1 .2 Circular Economy and Scarcity of Resources . . . . . . . . . . . . . . . . . . . . . . . . . . . . . . . . . . . . . . . . . . . . . . . . . . . .86C1 .3 Regulation of Energy Use . . . . . . . . . . . . . . . . . . . . . . . . . . . . . . . . . . . . . . . . . . . . . . . . . . . . . . . . . . . . . . . . . . . . .89C1 .4 Economic and Social Impacts of Energy Production and Use . . . . . . . . . . . . . . . . . . . . . . . . . . . . . . . . . . . . . .91C1 .5 Markets for Projects at the Interface of Agriculture and Energy . . . . . . . . . . . . . . . . . . . . . . . . . . . . . . . . . . . . .93C1 .6 Financing for Renewable Energy and Energy Efficiency Solutions in the Agricultural Sector . . . . . . . . . . . . .94C1 .7 Definitions and Key Concepts . . . . . . . . . . . . . . . . . . . . . . . . . . . . . . . . . . . . . . . . . . . . . . . . . . . . . . . . . . . . . . . . .96
C2 ENERGY AND AGRICULTURE ON A MICRO LEVEL . . . . . . . . . . . . . . . . . . . . . . . . . . . . . . . . . . . . . . . . . . . . . .97C2 .1 Scales of Agri-Food Enterprises . . . . . . . . . . . . . . . . . . . . . . . . . . . . . . . . . . . . . . . . . . . . . . . . . . . . . . . . . . . . . .100C2 .2 Techno-Economic Analysis of Energy Projects in Agricultural Value Chains . . . . . . . . . . . . . . . . . . . . . . . . .103C2.2.1 Micro-level Investment Planning . . . . . . . . . . . . . . . . . . . . . . . . . . . . . . . . . . . . . . . . . . . . . . . . . . . . . . . . . . . . . .103C2.2.2 Financial Cost-Benefit Analysis . . . . . . . . . . . . . . . . . . . . . . . . . . . . . . . . . . . . . . . . . . . . . . . . . . . . . . . . . . . . . . . .108C2.2.3 NPV equation . . . . . . . . . . . . . . . . . . . . . . . . . . . . . . . . . . . . . . . . . . . . . . . . . . . . . . . . . . . . . . . . . . . . . . . . . . . . . . .109C2.2.4 Economic Analysis . . . . . . . . . . . . . . . . . . . . . . . . . . . . . . . . . . . . . . . . . . . . . . . . . . . . . . . . . . . . . . . . . . . . . . . . . .111C2.2.5 Cost-Benefit Analysis Tools . . . . . . . . . . . . . . . . . . . . . . . . . . . . . . . . . . . . . . . . . . . . . . . . . . . . . . . . . . . . . . . . . . .112 Summary & Unit Wrap-Up . . . . . . . . . . . . . . . . . . . . . . . . . . . . . . . . . . . . . . . . . . . . . . . . . . . . . . . . . . . . . . . . . . .114
C3 BUSINESS MODELS FOR PROJECTS IN THE ENERGY AGRICULTURE NEXUS . . . . . . . . . . . . . . . . . . . . .115C3 .1 Business Models . . . . . . . . . . . . . . . . . . . . . . . . . . . . . . . . . . . . . . . . . . . . . . . . . . . . . . . . . . . . . . . . . . . . . . . . . .115C3.1.1 Introduction to Business Models . . . . . . . . . . . . . . . . . . . . . . . . . . . . . . . . . . . . . . . . . . . . . . . . . . . . . . . . . . . . . . .115C3.1.2 Definition of Financial Terms . . . . . . . . . . . . . . . . . . . . . . . . . . . . . . . . . . . . . . . . . . . . . . . . . . . . . . . . . . . . . . . . . .117C3.1.3 Financial Profitability . . . . . . . . . . . . . . . . . . . . . . . . . . . . . . . . . . . . . . . . . . . . . . . . . . . . . . . . . . . . . . . . . . . . . . . .118C3.1.4 Common Methods of Capital Budgeting . . . . . . . . . . . . . . . . . . . . . . . . . . . . . . . . . . . . . . . . . . . . . . . . . . . . . . . .120C3.1.5 Project Financing: Example of Microfinance . . . . . . . . . . . . . . . . . . . . . . . . . . . . . . . . . . . . . . . . . . . . . . . . . . . . .124C3 .2 Clean Energy Projects in the Agricultural Sector . . . . . . . . . . . . . . . . . . . . . . . . . . . . . . . . . . . . . . . . . . . . . . . . .125C3.2.1 Grid vs. Off-Grid Energy Projects in Agricultural Value Chains . . . . . . . . . . . . . . . . . . . . . . . . . . . . . . . . . . . . . .126C3.2.2 Grid-Connected Energy Projects in Agricultural Value Chains . . . . . . . . . . . . . . . . . . . . . . . . . . . . . . . . . . . . . . .126C3.2.3 Off-Grid Energy Projects in Agricultural Value Chains . . . . . . . . . . . . . . . . . . . . . . . . . . . . . . . . . . . . . . . . . . . . .127 Summary & Unit Wrap-Up . . . . . . . . . . . . . . . . . . . . . . . . . . . . . . . . . . . . . . . . . . . . . . . . . . . . . . . . . . . . . . . . . . .133
© GIZ

SUSTAINABLE ENERGY FOR FOOD – Massive Open Online Course – Reader
CHAPTER C | UNIT C1 | POLICIES AND REGULATIONS FOR THE ENERGY AGRICULTURE NEXUS 79
UNIT C1 POLICIES AND REGULATIONS FOR THE ENERGY AGRICULTURE NEXUS
INTRODUCTIONUnitC1constitutesthefirstoftheMOOCchaptersontheeconomicsoftheEnergy Agriculture Nexus . Focusing on regulations and policies, the chapter starts by presenting relevant policy tools and regulations . Following this the concept of circular economy [» Unit C1.7] is introduced as a mode of eco-nomic organization to minimize resource use and promote adoption of cleaner technologies in agricultural value chains . Chapter C also touches upon regulation of energy use and transitions to cleaner, renewable energy, as well as upon socio-economic impacts of energy production and use . The chaptercloseswithaunitonmarketsandfinancingneedsandopportunitiesfor projects at the interface of energy and agriculture .
Global demands for both food and energy are increasing rapidly due to popu-lation growth and rising incomes . However, land degradation, climatic changes, and decreasing growth rates in agricultural productivity are limiting the expansion of food production (von Braun, 2007) . Moreover, mitigating global warming and climate change requires reducing carbon emissions from using fossil fuels and from agricultural production, primarily through a transi-tion to cleaner renewable energy sources, resource conservation and more efficientagriculturalpractices(Edenhoferetal.,2011;Brancaetal.,2011).
In this context, the Energy Agriculture Nexus is a key platform for sustainable development . Access to clean, reliable and affordable energy for all is not only a crucial Sustainable Development Goal (SDG) (UN Assembly General, 2015), but is also an important entry point for achieving several other SDGs, such as eradicating poverty and hunger, mitigating climate change, achieving gender equality and promoting healthy lives . Today however, over 1 .2 billion people still lack access to electricity and 2 .7 billion people rely on traditional fuels,namely,firewood,cropresidesandanimaldungforcooking(IEA, 2015) .
AUTHOR Alisher Mirzabaev (Center for Development Research, ZEF)
Please find below links to our materials and references
Videowww .giz .de/gc21/pa_video_lectures
Additional Materialwww .giz .de/gc21/pa_additional_material
Referenceswww .giz .de/gc21/pa_references
» Chapter A

SUSTAINABLE ENERGY FOR FOOD – Massive Open Online Course – Reader
CHAPTER C | UNIT C1 | POLICIES AND REGULATIONS FOR THE ENERGY AGRICULTURE NEXUS 80
This often leads to women’s drudgery, children’s lower school performance, health hazards from indoor air pollution, deforestation, soil erosion, loss of biodiversity and negative impacts on ecology and food security (Rehfuess et al ., 2005; Rasul, 2014; Mirzabaev et al ., 2015) . To illustrate: women and chil-dren in rural areas of many developing countries are spending an increasing shareoftheirtimecollectingfirewood,insteadofspendingthistimeonother income-generating activities, or in the case of children, for studying . The indoor smoke from the use of traditional fuels is estimated to claim up to 4 million lives annually through lung diseases and cancer, again mostly among women – since they are responsible for cooking in most households (Lim & Seow, 2012) (» video) .
Therefore a massive deployment of renewable clean energy sources in rural areas and agricultural value chains is necessary . Energy and food production activities often compete for scarce land, water, labor and capital resources that may, consequently, lead to fuel-food tradeoffs . Fortunately the nexus between energy and agriculture is not only that of tradeoffs; there are also ample opportunities for synergies . For example, if smallholder farming households have access to cleaner energies [» Unit B1.2] for cooking, they coulduseanimaldungforfertilizingfieldsratherthanasfuel,andobtainhigher crop yields . Another example is if farmers have access to clean cool-ing technologies, using biogas or solar panels, post-harvest losses could be decreased, improving product quality and farmers’ incomes .
Exploiting such opportunities in the Energy Agriculture Nexus can thus raise agricultural productivity, incomes, and hence, enhance food security and help to decarbonize the global energy mix . Last but not least, better access to energy can also stimulate the expansion of productive uses of energy for rural development (Cabral et al ., 2005; GIZ 2013; » video), through expanding agricultural and non-farm income generating activities by helping to create new small and medium-sized businesses along agricultural value chains [» Unit A1.3] and also through re-location of manufacturing industries into rural areas with more favorable access to land and labor resources, thus energizing broad rural development (» video) .
Given these opportunities, there is a growing commitment at the global and national levels to increasing the share of renewable energy in overall energy use,asexemplifiedbyMission Innovation and Breakthrough Energy Coalition initiatives during the recent Conference of Parties of the UN Framework Con-vention on Climate Change in Paris .

SUSTAINABLE ENERGY FOR FOOD – Massive Open Online Course – Reader
CHAPTER C | UNIT C1 | POLICIES AND REGULATIONS FOR THE ENERGY AGRICULTURE NEXUS 81
However, in addition to such initiatives, it is also necessary to enable institu-tional, regulatory and policy frameworks to facilitate renewable energy inno-vations and their wide-spread adoption, as well as to optimize the Energy Agriculture Nexus, by minimizing potential tradeoffs and promoting syner-gies . The next section elaborates on such regulatory and policy issues .
INTRODUCTION RECAP• TheEnergyAgricultureNexuscanserveasakeyplatformforsustainable
development .• Awiderdeploymentofrenewableenergyinagriculturalvaluechainsand
rural areas will help in improving agricultural productivity, improving food security, eradicating poverty and hunger and promoting healthy lives, especiallybenefittingwomenandchildren.
• Renewableenergyinruralareasservesnotonlyforconsumptiveuses,but also to create new business opportunities .
• Tocapitalizeontheseopportunities,enablingregulationsandpoliciesareneeded .
Unit C1.1 | Policies and Politics of Renewable EnergyRenewable energy sources have considerable potential to improve sustain-ability and incomes along agricultural value chains [» Unit A1.3] . However, thispotentialisnotalwaysutilizedduetoalackofsufficientpoliticalwilltochallenge fossil-fuel based technologies (Anthoff & Hahn, 2010; Lehmann et al ., 2012; Sims et al ., 2015) .
Economic policy plays a key role in the development of the renewable energy sector . Enabling polices and regulations are often essential to the promotion of renewable energy technologies, especially in early stages when they are not prevalent on a large commercial scale (Sims et al . 2015) . For example, the success of bioenergy in a major producing country such as Brazil, is linked to policies promoting biofuel production (» video) .
However, there are many politically sensitive issues in energy policies and reg-ulation regarding food security, the premise of job creation, reducing depen-dence on fossil fuels, climate change mitigation [» Unit A2], preserving eco-logical integrity and concerns over large scale land acquisitions in develop-ing countries, and many more . To illustrate, one of the most controversial top-ics in the Energy Agriculture Nexus is the role of food crops in the production of biofuels [» Unit B1.2] . The increase in food prices due to competition betweenfoodandbiofuelsforagriculturalcropshassignificantimpacts(vonBraun et al ., 2008; Ewing & Msangi, 2009) . The poor are especially affected

SUSTAINABLE ENERGY FOR FOOD – Massive Open Online Course – Reader
CHAPTER C | UNIT C1 | POLICIES AND REGULATIONS FOR THE ENERGY AGRICULTURE NEXUS 82
negatively because they spend a larger share of their income on food (von Braun et al ., 2008) . For example, a large-scale introduction of biofuels may substantially increase maize prices (Bryngelsson & Lindgren, 2013) .
Biofuel expansion could also increase the number of malnourished children by 9 .6 million in Africa (Rosegrant et al ., 2008) . In contrast, emerging tech-nologies such as ethanol based on cellulosic matter, allow biofuel genera-tion from non-food biomass, but they need to become commercially viable (IEA, 2013; Slade et al ., 2009) through supportive regulatory and policy frameworks . This section focuses on policies and regulations used to sup-port the development and deployment of renewable energy technologies .
We can distinguish two ways in which regulations could be viewed in this regard: The legalistic approach to regulations considers them to consist of laws, rules and decrees by all levels of government and by non-governmental bodies, which are vested with regulatory power . Ideally the major objectives ofregulationtargetachievingefficiencyinenergyprovision,fairpricing,equality of access and environmental sustainability [» Unit B3.4] . However, theeconomics-baseddefinitionproposesthattheroleofregulationistocre-ateconditionsformarketstofunctionefficiently(Minogue,2013).However,efficientmarketsmaynotnecessarilysatisfysocialequityconsiderationsnor take environmental concerns into account as many ecosystem services have no market price, hence, are not incorporated into markets .
Both approaches have their strengths and weaknesses . There are often risks associated with government failures while trying to solve complex resource allocation problems in renewable energy, which call for the use of markets and setting clear incentives and standards (Purkus et al., 2012) . At the same time government action is needed to overcome market failures . Accordingly, implementing innovative renewable energy policies requires proactive gov-ernment action, societal support and the involvement of local governments and communities (Beltramello et al ., 2013) .
As a result the renewable energy sector involves a host of policy tools and regulations (Peters & Thielmann, 2008; Wesseler et al ., 2010; White et al ., 2013; Sims et al ., 2015), such as: Renewable Energy Mandates: legal requirements to produce a certain share of energy from renewable sources . For example, presently several countries impose renewable energy mandates on electricity generation on utilities . Similarly in another example Mexico City mandated all new and renovated

SUSTAINABLE ENERGY FOR FOOD – Massive Open Online Course – Reader
CHAPTER C | UNIT C1 | POLICIES AND REGULATIONS FOR THE ENERGY AGRICULTURE NEXUS 83
swimming pools, as well as large commercial buildings must cover 30 per-cent of their energy needs for water heating with solar energy (Cabre et al ., 2015) . Renewable energy mandates are being applied by an increasing num-ber of countries . According to Renewable Energy Policy Network (REN21) (2015),98 countriesandsub-nationalunitshadrenewableenergymandatesby the end of 2014, which represents a nine-fold increase compared to 2004 (REN21, 2015) .
Renewable Energy Targets: policy commitments to generate a determined share of total energy using renewable sources . For example, targets in Ger-many are to generate 35 percent of its electricity from renewable energy sources by 2020, reaching 80 percent by 2050 (Droste-Franke, 2012) . Suc-cessful implementation of these targets requires the establishment of effec-tive systems of monitoring and reinforcement (GIZ, 2012) .
Feed-in-tariffs: a policy tool designed to promote renewable energy genera-tion by guaranteeing the purchase of the renewable energy generated with a long-term contract and at cost-based purchase prices . Under this scheme, electricity generated using solar panels or other types of RE based electricity can receive higher prices than, for example, from the fossil fuel-based elec-tricity generator . Feed-in-tariffs often have a digressive element, when guar-anteed prices gradually decline over time in order to stimulate cost-reducing innovations in the renewable energy sector (» video) . Feed-in-tariffs can also be applied to photovoltaic irrigation schemes, whereby farmers could sell the excess of electricity generated to the central grid . Feed-in-tariffs are one of the most widely applied tools for promoting renewable energy . In 2014, they were applied by 108 countries and sub-national jurisdictions (REN21, 2015) .
Net Metering and Flexible Grid Access: a mechanism that enables small-scale renewable energy producers, for example households with rooftop solar energy generation, to sell the amount of electricity that exceeds their own needs to the central grid .
Transfers and Subsidies: direct or indirect monetary support to producers or other actors involved in renewable energy production . For example, China pro-vides subsidies for solar energy technologies benefitting poor communities.
Fiscal Incentives: reduction of taxes by various mechanisms, such as tax credits, deductions and exemptions, in order to stimulate renewable energy . For instance, under Brazil’s Social Fuel Seal initiative, biodiesel producers are given tax credits (BEFSCI, 2012) .
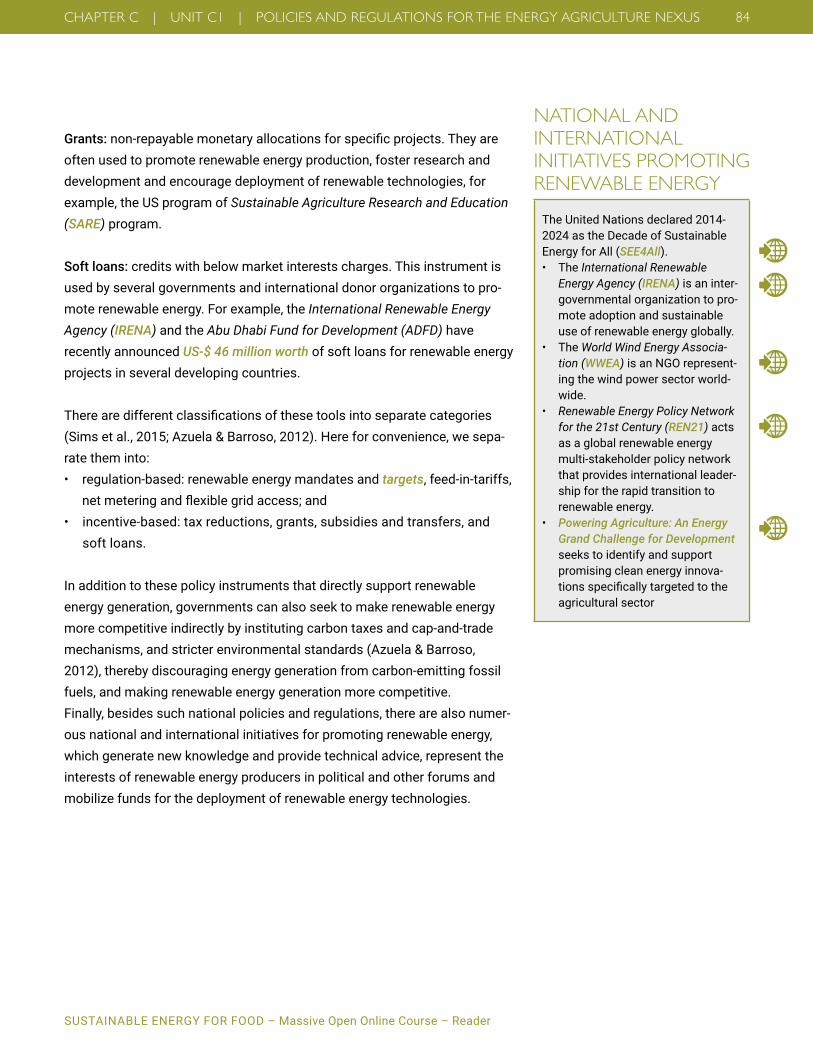
SUSTAINABLE ENERGY FOR FOOD – Massive Open Online Course – Reader
CHAPTER C | UNIT C1 | POLICIES AND REGULATIONS FOR THE ENERGY AGRICULTURE NEXUS 84
Grants:non-repayablemonetaryallocationsforspecificprojects.Theyareoften used to promote renewable energy production, foster research and development and encourage deployment of renewable technologies, for example, the US program of Sustainable Agriculture Research and Education (SARE) program .
Soft loans: credits with below market interests charges . This instrument is used by several governments and international donor organizations to pro-mote renewable energy . For example, the International Renewable Energy Agency (IRENA) and the Abu Dhabi Fund for Development (ADFD) have recently announced US-$ 46 million worth of soft loans for renewable energy projects in several developing countries .
Therearedifferentclassificationsofthesetoolsintoseparatecategories(Sims et al ., 2015; Azuela & Barroso, 2012) . Here for convenience, we sepa-rate them into:• regulation-based:renewableenergymandatesandtargets, feed-in-tariffs,
netmeteringandflexiblegridaccess;and• incentive-based:taxreductions,grants,subsidiesandtransfers,and
soft loans .
In addition to these policy instruments that directly support renewable energy generation, governments can also seek to make renewable energy more competitive indirectly by instituting carbon taxes and cap-and-trade mechanisms, and stricter environmental standards (Azuela & Barroso, 2012), thereby discouraging energy generation from carbon-emitting fossil fuels, and making renewable energy generation more competitive .Finally, besides such national policies and regulations, there are also numer-ous national and international initiatives for promoting renewable energy, which generate new knowledge and provide technical advice, represent the interests of renewable energy producers in political and other forums and mobilize funds for the deployment of renewable energy technologies .
NATIONAL AND I NTERNATIONAL INITIATIVES PROMOTING RENEWABLE ENERGY
The United Nations declared 2014-2024 as the Decade of Sustainable Energy for All (SEE4All) . • TheInternational Renewable
Energy Agency (IRENA) is an inter-governmental organization to pro-mote adoption and sustainable use of renewable energy globally .
• TheWorld Wind Energy Associa-tion (WWEA) is an NGO represent-ing the wind power sector world-wide .
• Renewable Energy Policy Network for the 21st Century (REN21) acts as a global renewable energy multi-stakeholder policy network that provides international leader-ship for the rapid transition to renewable energy .
• Powering Agriculture: An Energy Grand Challenge for Development seeks to identify and support promising clean energy innova-tionsspecificallytargetedtotheagricultural sector
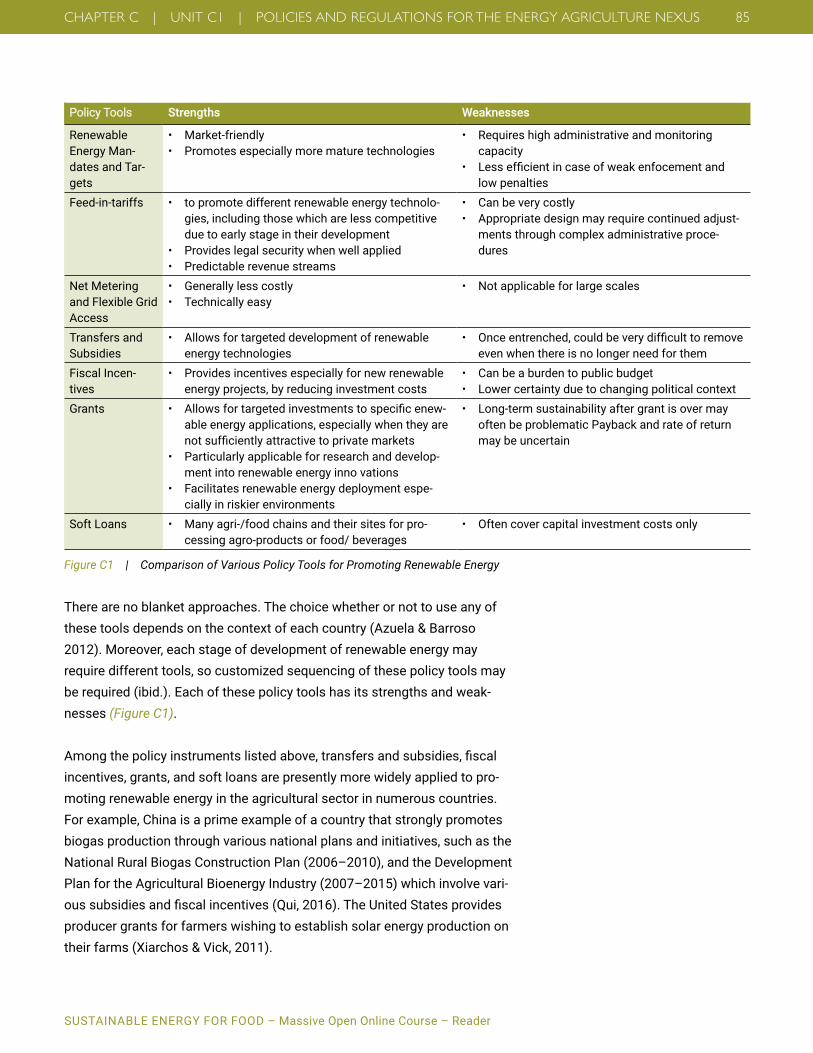
SUSTAINABLE ENERGY FOR FOOD – Massive Open Online Course – Reader
CHAPTER C | UNIT C1 | POLICIES AND REGULATIONS FOR THE ENERGY AGRICULTURE NEXUS 85
Policy Tools Strengths Weaknesses
Renewable Energy Man-dates and Tar-gets
• Market-friendly• Promotesespeciallymorematuretechnologies
• Requireshighadministrativeandmonitoringcapacity
• Lessefficientincaseofweakenfocementandlow penalties
Feed-in-tariffs • topromotedifferentrenewableenergytechnolo-gies, including those which are less competitive due to early stage in their development
• Provideslegalsecuritywhenwellapplied• Predictablerevenuestreams
• Canbeverycostly• Appropriatedesignmayrequirecontinuedadjust-
ments through complex administrative proce-dures
Net Metering and Flexible Grid Access
• Generallylesscostly• Technicallyeasy
• Notapplicableforlargescales
Transfers and Subsidies
• Allowsfortargeteddevelopmentofrenewableenergy technologies
• Onceentrenched,couldbeverydifficulttoremoveeven when there is no longer need for them
Fiscal Incen-tives
• Providesincentivesespeciallyfornewrenewableenergy projects, by reducing investment costs
• Canbeaburdentopublicbudget• Lowercertaintyduetochangingpoliticalcontext
Grants • Allowsfortargetedinvestmentstospecificenew-able energy applications, especially when they are notsufficientlyattractivetoprivatemarkets
• Particularlyapplicableforresearchanddevelop-ment into renewable energy inno vations
• Facilitatesrenewableenergydeploymentespe-cially in riskier environments
• Long-termsustainabilityaftergrantisovermayoften be problematic Payback and rate of return may be uncertain
Soft Loans • Manyagri-/foodchainsandtheirsitesforpro-cessing agro-products or food/ beverages
• Oftencovercapitalinvestmentcostsonly
Figure C1 | Comparison of Various Policy Tools for Promoting Renewable Energy
There are no blanket approaches . The choice whether or not to use any of these tools depends on the context of each country (Azuela & Barroso 2012) . Moreover, each stage of development of renewable energy may require different tools, so customized sequencing of these policy tools may be required (ibid .) . Each of these policy tools has its strengths and weak-nesses (Figure C1) .
Amongthepolicyinstrumentslistedabove,transfersandsubsidies,fiscalincentives, grants, and soft loans are presently more widely applied to pro-moting renewable energy in the agricultural sector in numerous countries . For example, China is a prime example of a country that strongly promotes biogas production through various national plans and initiatives, such as the National Rural Biogas Construction Plan (2006–2010), and the Development Plan for the Agricultural Bioenergy Industry (2007–2015) which involve vari-oussubsidiesandfiscalincentives(Qui,2016).TheUnitedStatesprovidesproducer grants for farmers wishing to establish solar energy production on their farms (Xiarchos & Vick, 2011) .

SUSTAINABLE ENERGY FOR FOOD – Massive Open Online Course – Reader
CHAPTER C | UNIT C1 | POLICIES AND REGULATIONS FOR THE ENERGY AGRICULTURE NEXUS 86
EthiopiainstitutedtheRuralElectrificationFundtopromoteoff-gridrenew-able energy adoptions in rural areas, and since 2010 also exempts import duties on renewable energy equipment . In many developing countries inter-national donor grants serve as important sources for promoting renewable energy in rural areas and agricultural value chains (GIZ, 2012) .
RECAP• Renewableenergyregulationsandpoliciesareoftenoutcomesofcom-
plex political and social bargaining .• Policytoolspromotingrenewableenergyarenumerousandvaried.They
include options such as renewable energy mandates and targets, feed-in-tariffs;netmeteringandflexiblegridaccess,transfersandsubsidies,fis-cal incentives, grants and soft loans .
• Thechoiceofanypolicyinstrumentdependsonthecontextofeachcountry, as each of these tools has its own advantages and disadvan-tages .
Unit C1.2 | Circular Economy and Scarcity of ResourcesCircular economy is a mode of economic organization, which seeks to mini-mize resource use and promote adoption of cleaner technologies (Andersen, 2007) . It is opposed to the traditional so-called linear economy concept built around the “make-use-dispose” model .
Under linear economy, many negative externalities of resource extraction, production, consumption and disposal are not included in their price . Exter-nalitiesarethecostsorbenefitsthataffectthethirdpartieswhodidnotchoosetoincurthesecostsorbenefits.Ingeneraltheconceptofexternali-ties is a crucial one in environmental economics and in environmental sus-tainabilityy [» Unit C3.4] (» video) .
The true social cost – that includes all externalities - of the linear economy is very high, making it unsustainable . For example, in agriculture the unsustain-able use of soils and land resources could lead to their degradation and ero-sion . In relation to human lifetimes, fertile soils are non-renewable resource, as it takes hundreds of years to form one centimeter of fertile topsoil . As a result not only land users themselves are affected negatively . Degraded soils notonlyprovidelessfoodandfeed,butalsosignificantlylessofothereco-systemservices,suchascarbonsequestration,waterpurification,nutrientcycling, and many others . This loss of ecosystem services negatively affects notonlydirectlandusersbutallofsociety.Erodedsoilscouldbeflushedtorivers,increasingtheirsiltationfillingupdownstreamreservoirsandreducing
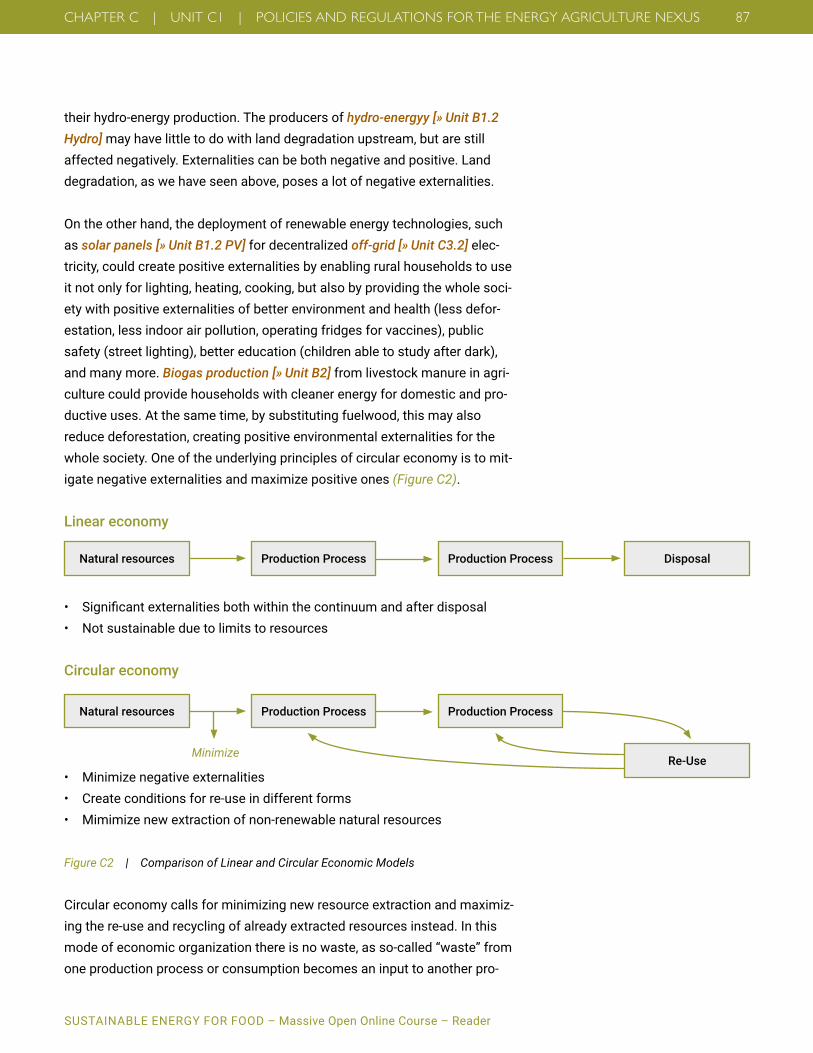
SUSTAINABLE ENERGY FOR FOOD – Massive Open Online Course – Reader
CHAPTER C | UNIT C1 | POLICIES AND REGULATIONS FOR THE ENERGY AGRICULTURE NEXUS 87
their hydro-energy production . The producers of hydro-energyy [» Unit B1.2 Hydro] may have little to do with land degradation upstream, but are still affected negatively . Externalities can be both negative and positive . Land degradation, as we have seen above, poses a lot of negative externalities .
On the other hand, the deployment of renewable energy technologies, such as solar panels [» Unit B1.2 PV] for decentralized off-grid [» Unit C3.2] elec-tricity, could create positive externalities by enabling rural households to use it not only for lighting, heating, cooking, but also by providing the whole soci-ety with positive externalities of better environment and health (less defor-estation, less indoor air pollution, operating fridges for vaccines), public safety (street lighting), better education (children able to study after dark), and many more . Biogas production [» Unit B2] from livestock manure in agri-culture could provide households with cleaner energy for domestic and pro-ductive uses . At the same time, by substituting fuelwood, this may also reduce deforestation, creating positive environmental externalities for the whole society . One of the underlying principles of circular economy is to mit-igate negative externalities and maximize positive ones (Figure C2) .
Circular economy calls for minimizing new resource extraction and maximiz-ing the re-use and recycling of already extracted resources instead . In this mode of economic organization there is no waste, as so-called “waste” from one production process or consumption becomes an input to another pro-
Natural resources Production Process Production Process Disposal
Minimize
Linear economy
• Significantexternalitiesbothwithinthecontinuumandafterdisposal• Notsustainableduetolimitstoresources
Circular economy
• Minimizenegativeexternalities• Createconditionsforre-useindifferentforms• Mimimizenewextractionofnon-renewablenaturalresources
Figure C2 | Comparison of Linear and Circular Economic Models
Natural resources Production Process Production Process
Re-Use

SUSTAINABLE ENERGY FOR FOOD – Massive Open Online Course – Reader
CHAPTER C | UNIT C1 | POLICIES AND REGULATIONS FOR THE ENERGY AGRICULTURE NEXUS 88
duction process . Circular economy requires that all energy be produced from renewable or otherwise sustainable sources .
Major conceptual directions in circular economic thinking are given below .
Cradle-to-Cradle Approach: opposes the so-called cradle-to-grave approach when natural resources are extracted, used, and then disposed of . The cra-dle-to-cradle approach seeks to maximize the re-use of each natural resource as much as possible (Braungart et al ., 2007), even though the achievement of a zero waste objective remains elusive for now .
Biomimicry: seeks to organize production processes in ways that emulate nature.Forexample,studyingthestructureofleavestocreatemoreefficientsolar panels is an example of biomimicry (Benyus, 1997) .
Industrial Ecology: a model of industrial organization, which seeks to achieve closed loop production processes when waste become inputs for new processes .
Blue Economy: cascading use of resources through value chains, when the waste of one production becomes the input to the other .
Aswecansee,thedifferencesbetweenthespecificschoolsofthoughtwithin the circular economy concept are small, as all of them emphasize minimizing resources use and waste, and call for no-waste production sys-tems . In this regard water-energy-food security nexus [» Unit A1.1] thinking partially overlaps with the circular economy concept, as it also seeks to min-imize negative externalities between energy, water and food sectors, and promote synergies between them .
Agricultural production presents ample opportunities for a rapid transition to circular economy . Such approaches as conservation agriculture, integrated pest management, organic farming, use of solar energy for water pumping for irrigation, integrated crop-livestock management, and re-use of organic waste for producing compost can help to reduce the environmental impact of agricultural production and food systems in general . Deployment of renewable energy sources to replace fossil-fuel energies in post-harvest management [» Unit B1] (e .g . solar energy for the refrigeration of dairy prod-ucts), transportation (biofuels) and along other components of food value chains [» Unit A1.3] can provide promising opportunities for their de-carbon-ization .

SUSTAINABLE ENERGY FOR FOOD – Massive Open Online Course – Reader
CHAPTER C | UNIT C1 | POLICIES AND REGULATIONS FOR THE ENERGY AGRICULTURE NEXUS 89
RECAP• Circulareconomyisamodeofeconomicorganization,whichseeksto
minimize resource use and promote adoption of cleaner technologies .• Circulareconomyincludessuchapproachesascradle-to-cradle,biomim-
icry, industrial ecology and blue economy .• Agriculturalvaluechainsoffersignificantopportunitiesforapplyingcircu-
lar economy approaches .
Unit C1.3 | Regulation of Energy UseMajorobjectivesofregulatingenergyuseareincreasingenergyuseeffi-ciency and promotion of the transition to cleaner energy sources . The poli-ciespromotingenergyefficiencyarehighlydiverseandnumerous.Theregu-lationstargetedatincreasingtheenergyefficiencyoftheresidentialsectorrepresent a major section of these measures .
Policy tools used include eco-labels, which certify environmental friendliness of various consumer and industrial products, elaboration of more energy-ef-ficientbuildingcodes,variousincentivesforretrofittingexistingbuildingsforhigherenergyefficiency,includinginfarmbuildingsbyheatinsulation,moreefficientlighting,heating,coolingandventilationsystems,publiccampaignsat promoting positive behavioral change for reducing the waste of energy . There are vast opportunities for improving energy efficiency of agriculture [» Unit B3]aswell.Forexample,evenbeyondmoreenergy-efficientfarmbuildings,thereissignificantscopeforreducingenergyconsumptionincropproduction by measures of conservation agriculture such as zero tillage, which reduce the amount of fuel consumed, and precision agriculture, which helps in applying the exact amounts of fertilizers needed by each patch of cropped land . Furthermore, as also indicated earlier there are opportunities for agriculture-energy synergies in the livestock production sector related to biogas production [» Unit B2] , with remaining slurry to be used as fertilizer for crop production (» video) .
Macro-economic and sectoral policies promoting the transition to cleaner energies include regulations limiting polluting sources of energy such as coal, setting limits to carbon emissions, instituting cap and trade mechanisms, imposing environmental taxes . On the other hand, the transition to cleaner energies is not only a global or national process . The stakes of using cleaner energies are not less, but arguably, they are even more vital at the household andcommunitylevel.Householdtransitiontocleanerandmoreefficientenergy sources can follow two approaches: energy ladder or energy stacking .
SUSTAINABLE ENERGY FOR FOOD – Massive Open Online Course – Reader
CHAPTER C | UNIT C1 | POLICIES AND REGULATIONS FOR THE ENERGY AGRICULTURE NEXUS 90
The energy ladder, conceptualizes energy choice as a linear step by step transitionprocess:asincomesincreaseenergyusersabandonlessefficientand cheap traditional biomass and shift to intermediate energy sources (charcoalandcoal);andthentomodern,saferandmoreefficientenergysources, such as electricity (Hosier & Dowd, 1987) . In contrast, energy stack-ing states that there is no unique and monotonic energy transition process, but rather energy consumers use multiple energy sources and their choice is dictated by a multitude of socio-economic and cultural preferences (Guta, 2014; Heltberg, 2004) .
Recently, “energy leapfrogging” has gained increasing policy attention . It refers to a process of energy transition that involves bypassing conventional energyandleapingdirectlytomoreefficient,safeandenvironmentallyfriendly energy technologies (Murphy, 2001) . Accordingly developing coun-tries have the opportunity to borrow advanced energy technologies from industrialized countries to “leapfrog” from less sophisticated energy technol-ogies to modern, cleaner energy alternatives without the necessity of going through more polluting energy sources such as coal and oil (Marcotullio & Schulz, 2007) . In practical terms however, a rapid and fast energy transition fromtraditionalbiomassandcoaltoelectricitymaybedifficulttoenact(Zhang, 2014; Guta, 2014) . Recently the most successful “leapfrogging” has taken place in mobile phone technology, as the millions of people in develop-ing countries have bypassed landline technology and skipped directly to the use of mobile phones . Energy technology leapfrogging however, appears to be much more challenging (Murphy, 2001) . Energy leapfrogging needs a simultaneous “institutional leapfrogging” (Han et al ., 2008) and is often lim-ited by lack of technological capabilities (Murphy, 2001; Gallagher, 2006) . Therefore, in developing countries energy transition has been constrained by the interplay of various socio-economic factors, risk-averse behavior, and lack of institutional and technical capabilities (Guta, 2014; Mirzabaev et al ., 2014; Murphy, 2001) .
Thus, energy transition may often be an ‘incremental’ or ‘gradual process’ that requires technical capacity development, awareness raising and improvements in purchasing power (Murphy, 2001) .
Transition to renewable energy in agriculture [» Unit B1] and its varied appli-cationsinagriculturalvaluechainscanprovidesubstantialbenefits,asindi-cated in the introductory section . Presently many rural communities in devel-oping countries do not have access to centralized grids [» Unit C3.2] . In this context, decentralized off-grid or community-based mini-grid access to elec-
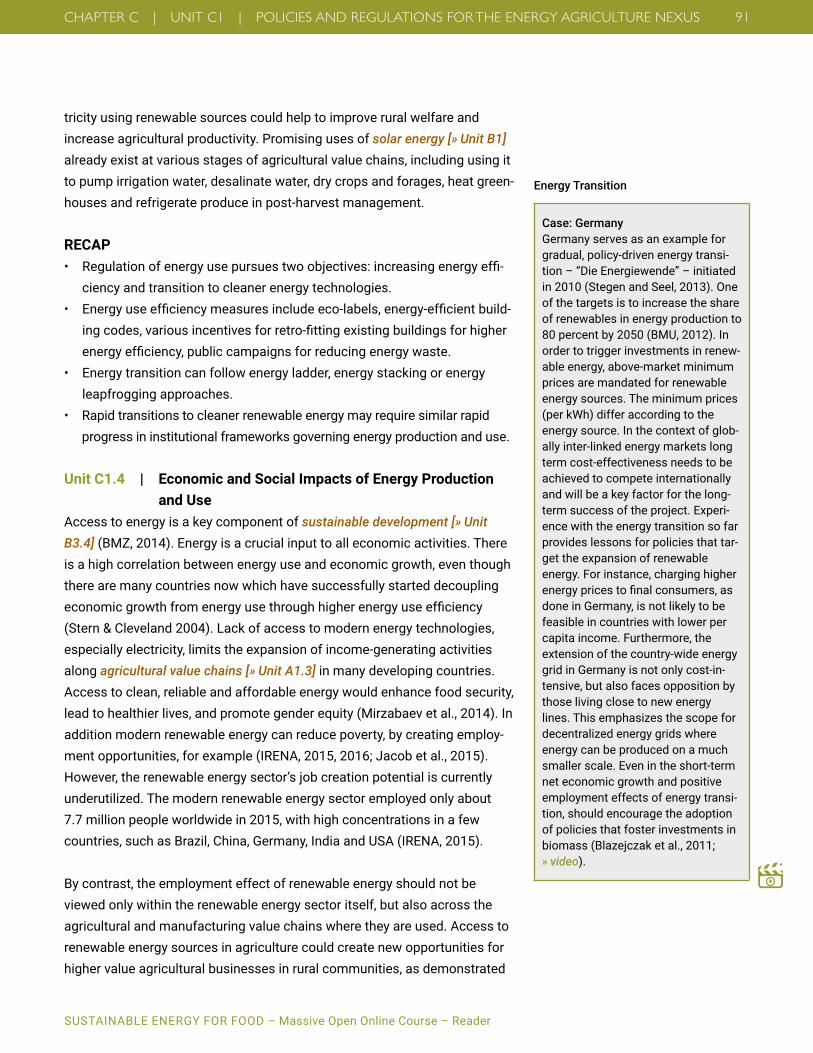
SUSTAINABLE ENERGY FOR FOOD – Massive Open Online Course – Reader
CHAPTER C | UNIT C1 | POLICIES AND REGULATIONS FOR THE ENERGY AGRICULTURE NEXUS 91
tricity using renewable sources could help to improve rural welfare and increase agricultural productivity . Promising uses of solar energy [» Unit B1] already exist at various stages of agricultural value chains, including using it to pump irrigation water, desalinate water, dry crops and forages, heat green-houses and refrigerate produce in post-harvest management .
RECAP• Regulationofenergyusepursuestwoobjectives:increasingenergyeffi-
ciency and transition to cleaner energy technologies .• Energyuseefficiencymeasuresincludeeco-labels,energy-efficientbuild-
ingcodes,variousincentivesforretro-fittingexistingbuildingsforhigherenergyefficiency,publiccampaignsforreducingenergywaste.
• Energytransitioncanfollowenergyladder,energystackingorenergyleapfrogging approaches .
• Rapidtransitionstocleanerrenewableenergymayrequiresimilarrapidprogress in institutional frameworks governing energy production and use .
Unit C1.4 | Economic and Social Impacts of Energy Production and Use
Access to energy is a key component of sustainable development [» Unit B3.4] (BMZ, 2014) . Energy is a crucial input to all economic activities . There is a high correlation between energy use and economic growth, even though there are many countries now which have successfully started decoupling economicgrowthfromenergyusethroughhigherenergyuseefficiency(Stern & Cleveland 2004) . Lack of access to modern energy technologies, especially electricity, limits the expansion of income-generating activities along agricultural value chains [» Unit A1.3] in many developing countries . Access to clean, reliable and affordable energy would enhance food security, lead to healthier lives, and promote gender equity (Mirzabaev et al ., 2014) . In addition modern renewable energy can reduce poverty, by creating employ-ment opportunities, for example (IRENA, 2015, 2016; Jacob et al ., 2015) . However, the renewable energy sector’s job creation potential is currently underutilized . The modern renewable energy sector employed only about 7 .7 million people worldwide in 2015, with high concentrations in a few countries, such as Brazil, China, Germany, India and USA (IRENA, 2015) .
By contrast, the employment effect of renewable energy should not be viewed only within the renewable energy sector itself, but also across the agricultural and manufacturing value chains where they are used . Access to renewable energy sources in agriculture could create new opportunities for higher value agricultural businesses in rural communities, as demonstrated
Energy Transition
Case: GermanyGermany serves as an example for gradual, policy-driven energy transi-tion – “Die Energiewende” – initiated in 2010 (Stegen and Seel, 2013) . One of the targets is to increase the share of renewables in energy production to 80 percent by 2050 (BMU, 2012) . In order to trigger investments in renew-able energy, above-market minimum prices are mandated for renewable energy sources . The minimum prices (per kWh) differ according to the energy source . In the context of glob-ally inter-linked energy markets long term cost-effectiveness needs to be achieved to compete internationally and will be a key factor for the long-term success of the project . Experi-ence with the energy transition so far provides lessons for policies that tar-get the expansion of renewable energy . For instance, charging higher energypricestofinalconsumers,asdone in Germany, is not likely to be feasible in countries with lower per capita income . Furthermore, the extension of the country-wide energy grid in Germany is not only cost-in-tensive, but also faces opposition by those living close to new energy lines . This emphasizes the scope for decentralized energy grids where energy can be produced on a much smaller scale . Even in the short-term net economic growth and positive employment effects of energy transi-tion, should encourage the adoption of policies that foster investments in biomass (Blazejczak et al ., 2011; » video) .

SUSTAINABLE ENERGY FOR FOOD – Massive Open Online Course – Reader
CHAPTER C | UNIT C1 | POLICIES AND REGULATIONS FOR THE ENERGY AGRICULTURE NEXUS 92
by the Powering Agriculture Initiative projects . Such innovative uses of renewable energy could increase the incomes of rural households; stimulate entrepreneurial dynamics through micro- to small-sized rural business cre-ation . Furthermore, renewable energy projects could also increase agricul-tural productivity .
Besides these economic dimensions, the deployment of renewable energy has considerable effects on society and gender . By some estimates the use oftraditionalbiomassfordomesticcookingwithinefficientcookingstovesaccount for up to 4 million premature deaths annually worldwide, which mainly affects women and children (Lim & Seow, 2012; Rehfuess et al ., 2006) .
Improved access to clean bioenergy sources, such as using biogas for cook-ingandadoptingmoreefficientcookingstoves,couldthushavesubstantialhealthbenefitswhich,inturnaffectlaborproductivity,incomesandsavingspositively(Dufloetal.,2008;» video) . For example, better access to clean energy could facilitate boiling water before consumption thus lowering the risks of waterborne diseases (Rehfuess et al ., 2006) and may also reduce medical expenses for poor households, and improve school and work atten-dance(Dufloetal.,2008).
Access to electricity also facilitates broad rural development . Many poor communities do not have access to centralized grids [» Unit C3.2], and are especiallylikelytobenefitfromlocalsmall-scalerenewableenergyprojects,such as local mini-hydro or solar and wind energy for mini-grids (Gerber, 2008; Chakrabarty et al ., 2013) . Access to electricity through decentralized mini-grids could facilitate a wider fuel switch to modern renewable energy (Heltberg, 2004) . In Assam, India, access to electricity was found to increase literacy rates from 63 .3 to 74 .4 percent (Kanagawa & Nakata, 2007); simi-larly,inBrazil,ruralelectrificationwasfoundtoreducepovertyby8percentandtheGinicoefficientofinequalityfrom0.39to0.22(Pereiraetal.,2008).
RECAP• Accesstoclean,reliableandaffordableenergy,especiallyinruralareas
of developing countries would help reduce poverty, enhance food secu-rity, lead to healthier lives, and promote gender equity .
• Majorwaystoachievetheseobjectivesdeployingrenewableenergyinrural areas are to generate employment, add value to agricultural and rural businesses and raise agricultural productivity .
• Deploymentofmodernrenewableenergyisalsolikelytohavesignificant
BIOGAS PLANTS PRODUCE GAS AND MANURE
Biogas projects make manure avail-abletofertilizefields,PVlightingextendsdaylighthoursforfieldwork,renewable energy-based mechaniza-tion technologies improve agricultural labor productivity .
» B2

SUSTAINABLE ENERGY FOR FOOD – Massive Open Online Course – Reader
CHAPTER C | UNIT C1 | POLICIES AND REGULATIONS FOR THE ENERGY AGRICULTURE NEXUS 93
gender dividends, improving women’s health and expanding their employ-ment opportunities in income-generating activities .
Unit C1.5 | Markets for Projects at the Interface of Agriculture
and EnergyThe Energy Agriculture Nexus provides substantial business development opportunities along agricultural value chains . [» Unit A1.3] Value chains are modes of organization of economic activities that “are required to bring a product or service from conception, through the different phases of produc-tion (involving a combination of physical transformation and the input of var-iousproducerservices),deliverytofinalconsumers,andfinaldisposalafteruse” (Kaplinsky & Morris, 2001) . Dairy value chain [» Unit B1.1.1] for example may start with livestock farming, whose product – milk, would then serve as input to milk processors, who produce a variety of dairy products (cheese, yoghurts, etc .), which then go to retailers, and from them to consumers .
However, experts (Virchow et al ., 2014) argue that this conventional view of valuechainsisnolongersufficient.Sincesynergisticlinksamongvaluechains in agriculture exist, they need to be viewed as comprehensive value webs . Any changes in one of the chains will have repercussions all across thevalueweb.Hence,thepolicyactionsmustseektominimizeinefficien-cies in the entire value web (ibid .), if we take maize value web, for example, maize produced on the farm could be fed to various value chains; it can be used either in food production, feed production, or fuel production . Each of these represent distinct value chains however, price changes in any of these would affect the rest of the value web .
Modernrenewableenergysolutionscouldhelpincreaseproductivity,effi-ciency and incomes by providing opportunities to increase the generation of added value . There are numerous, promising uses of renewable energy [» Unit B1] to increase the value added along various stages of agricultural value chains . At the production level crop and livestock production are already being used to produce energy (biofuels, biogas [» Unit B1]), and due to various policy incentives and technological innovations this is likely to continue to grow . Solar energy is being used for irrigation water pumping, water desalination, for heating greenhouses . At postharvest stage there are opportunities to use renewable energy to dry crops and forages, to refriger-ate produce and to reduce food losses (REEEP 2015) . There are also oppor-tunities for wider use of biomass to combine heat and electricity generation, to process wood products thermally, and to gasify rice husks .

SUSTAINABLE ENERGY FOR FOOD – Massive Open Online Course – Reader
CHAPTER C | UNIT C1 | POLICIES AND REGULATIONS FOR THE ENERGY AGRICULTURE NEXUS 94
Private businesses are expected to play an important role in all stages of this process if rapid growth in demand for clean energy technologies offers newprofitopportunities(Beltramelloetal.,2013).Economic viability [» Unit C2] of renewable energy applications in agriculture depends on effective demand availability, which can pay for the delivered goods and services, cost competitiveness of renewable energy with fossil fuels, enable regulations indicated earlier, such as government subsidies, and access to other sources of capital and know-how, such as private investments or credits, or development grants, loans and technical assistance . To give an example, studies have indicated that in off-grid rural communities [» Unit C3.2] con-ventional diesel electricity generation can be less cost-effective compared to renewablesources.Alfaro&Miller(2014)findthatinLiberia,smallhydro-power, small biomass projects and solar panels generate electricity at lower prices even though small diesel units have the lowest capital costs .
The comparison of long-run per unit breakeven cost of electricity and house-holds’ willingness to pay showed that households can afford biomass and small hydropower, but not electricity generation from diesel and solar panels (ibid) . In such contexts extended payment schedules, low interest rates and taxes can improve household electricity affordability (Lahimer et al ., 2013) .
RECAP• Renewableenergyprovidesopportunitiestoincreaseincomesbydevel-
oping higher valued added agricultural value chains in rural areas .• Variousagriculturalvaluechainsoftenformcomplexinter-linkagesin
value webs .• Economicviabilityofrenewableenergyapplicationsinagriculturedepends
on various factors such as availability of effective demand, cost competi-tivenesswithfossilfuels,enablingregulationsandaccesstofinance.
Unit C1.6 | Financing for Renewable Energy and Energy Efficiency Solutions in the Agricultural Sector
To reiterate, over 1 .2 billion people today still lack access to electricity and 2 .7 billion people are without clean cooking technology (IEA, 2015) . Agricul-ture in developing countries is hardly mechanized .
Evidently,financingneedstoovercomethesechallengesaresubstantial.According to the International Energy Agency (2011), 49 billion US-$ of investments will be needed annually to achieve universal access to modern energy services by 2030 (45 billion for universal electricity access and an additional 4 .4 billion US-$ for clean cooking) . Fischedick et al . estimate

SUSTAINABLE ENERGY FOR FOOD – Massive Open Online Course – Reader
CHAPTER C | UNIT C1 | POLICIES AND REGULATIONS FOR THE ENERGY AGRICULTURE NEXUS 95
(2010)thatbetween2021–2030annualglobalfinancingneedsforrenew-able energy to keep CO2concentrationbelow450ppm(partspermillion)−correspondstoa50percentchanceofkeepingglobalwarmingunder2°C−areabout750billionUS-$.Inordertodoubletheglobalrateofenergyeffi-ciency an additional 30-35 billion US-$ is needed in low-income countries, and 140–170 billion US-$ in medium-income countries (AGECC, 2010) .
Achievingthesefinancingobjectivespresentssubstantialchallenges.Giventhe scarce public resources in developing countries in addition to competing demands from other sectors (for example education or health care), the gov-ernmentbudgetmaynotbeabletofinanceenergyinfrastructureatneces-sary levels (Terrapon-Pfaff et al ., 2014) .The key barriers to many renewable energyprojects’long-termsustainabilityarefinancialconstraintsandlackofcredit for costs of operation and management of projects over time . By con-trast capital markets, which prefer to work with large actors to limit opera-tional costs and better manage risk, often discriminate against small-scale renewable energy projects, like those we have seen in the agricultural sector, –, making the role of government and development partners indispensable .
Therearenumerousfinancialandorganizationaltoolstofundrenewableenergy projects in rural areas and agricultural value chains, including soft loans, subsidies, venture capital and private equity, renewable energy service compa-nies (RESCOs) [» Unit C1.7], and microfinance [» Unit C3.1] . Microfinance and RESCOs are most often used approaches to finance small-scale renewable energy, especially for solar panels . RESCOs are innovative organizational forms that sell their renewal energy services for a monthly fee instead of selling the actual technology . RESCOs are especially suitable for small rural solar energy technologies, for example PV solar home systems (Liming, 2009) .
These various sources of funding for renewable energy could be combined innovatively through public-private-community partnerships (ibid .) . Such funding tools as venture capital, corporate bonds and private equity could fund large-scale agricultural value chains . Initiatives to improve energy use efficiencyinagriculturalvaluechainsareoftenfundedthroughpublicorinternational sources . The Clean Development Mechanism (CDM) can be a funding tool for using agricultural by-products as an energy source, for example (Larson et al ., 2011); however, the extent of funding the CDM gives to agricultural energy projects remains relatively limited .
In summary, successfully deploying clean energy businesses in the agricul-tural sector requires a good understanding of how related value [» Unit A1.3]
SUSTAINABLE ENERGY FOR FOOD – Massive Open Online Course – Reader
CHAPTER C | UNIT C1 | POLICIES AND REGULATIONS FOR THE ENERGY AGRICULTURE NEXUS 96
chainsandthebroadervaluewebfunction.Soundbusinessandfinancialplanning [» Unit C2; » Unit C3] could ensure the economic viability of the busi-ness, its access to funding, technologies, inputs: a good knowledge of the business outputs’ demand characteristics, and last but not least, a careful study of relevant regulations and policies . RECAP• Thefinancingneedstoprovideuniversalaccesstomodernenergyare
substantial and often exceed local funding capacities .• Thereareseveralfinancingtoolstofundrenewableenergyintheagricul-
turalsector,suchasmicrofinance,softloansandloanguarantees,subsi-dies and grants, venture capital and private equity, and various combina-tions thereof through public-private-community partnerships .
• Governmentandinternationaldonorsmustoftenplayanindispensablerole in promoting renewable energy in agricultural value chains, as private funding sources tend to avoid these investment sectors due to high administrative and monitoring costs .
Unit C1.7 | Definitions and Key ConceptsCircular Economy is a mode of economic organization that seeks to mini-mize resource use and promote adoption of cleaner technologies .
Decentralized Energy Solution (DES): This denotes small-scale and local transformation of renewable resources (wind, solar radiation, biomass, small hydropower) into electricity or thermal energy used for different activities by communities or households in diverse rural settings around the world .
Energy Transition: a theoretical concept used to describe the relationship between economic growth (income) and energy utilization pattern .
Externalitiesarecostsorbenefitsthataffectthirdpartieswhodidnotchoosetoincurthesecostsorbenefits.
Feed-In-Tariffs: a policy tool designed to promote renewable energy genera-tion by guaranteeing the purchase of generated renewable energy with a long-term contract and at cost-based purchase prices . Feed-in-tariffs often have a digressive element, when guaranteed prices gradually decline over time in order to stimulate cost-reducing innovations in the renewable energy sector .
Net Metering and Flexible Grid Access: a mechanism that enables small-scale renewable energy producers, for example households with rooftop
MATERIALS Please find below links to our materials and references
Videowww .giz .de/gc21/pa_video_lectures
Additional Materialwww .giz .de/gc21/pa_additional_material
Referenceswww .giz .de/gc21/pa_references

SUSTAINABLE ENERGY FOR FOOD – Massive Open Online Course – Reader
CHAPTER C | UNIT C2 | ENERGY AND AGRICULTURE ON A MICRO LEVEL 97
solar energy generation, to sell the amount of electricity exceeding their own needs to the central grid .
Regulations: laws, rules and decrees by all levels of government, and non-governmental bodies, which are vested with regulatory power .
RESCOs: renewable energy service companies are innovative organizational forms that sell their services for a monthly fee instead of selling the renew-able energy technology itself . RESCOs are especially suitable for small rural solar energy technologies .
Transfers and Subsidies: direct or indirect monetary support to producers or other actors involved in renewable energy production .
UNIT C2 ENERGY AND AGRICULTURE ON A MICRO LEVEL
INTRODUCTIONUnitC2describeshowtoanalyzethecostsandbenefitsofinvestinginagri-food energy technologies, highlighting the related economic aspects . Adopt-ing an agricultural value chain [» Unit A1.3] approach illustrates different investment opportunities . Investments include interventions to provide mod-ernenergyforthereductionofpost-harvestlosses,efficiencygainsinthemanufacture and management of agricultural inputs and in the introduction of renewables to displace costly and environmentally unsustainable fossil fuels . Section C2 .1 introduces different scales of agricultural enterprises, which show differing management and potential to adopt renewable energy [» Unit B1] and energy efficiency [» Unit B3] interventions, and that vary in terms of capital availability . Section C2 .2 presents investment planning for renewableorenergy-efficienttechnologiesinagriculturalandfoodenter-prises, providing guidelines on how to perform an energy investment cost-benefitanalysisandidentifiesdecisionmakingtoolsthatcanbeeasilyadopted by farmers and food processors .
AUTHORS Stefania Bracco (Climate and Envi-ronment Division, FAO)Alessandro Flammini (Investment Centre Division, FAO)
MATERIALS Please find below links to our materials and references
Videowww .giz .de/gc21/pa_video_lectures
Additional Materialwww .giz .de/gc21/pa_additional_material
Referenceswww .giz .de/gc21/pa_references

SUSTAINABLE ENERGY FOR FOOD – Massive Open Online Course – Reader
CHAPTER C | UNIT C2 | ENERGY AND AGRICULTURE ON A MICRO LEVEL 98
Traditionally agricultural production has depended on external energy inputs, such as manual labor, animal power and combustion of biomass to provide heat . Energy inputs are also needed for storage, processing, transport and distribution of food products . These forms of energy inputs have largely been displaced by fossil fuels, as agriculture has become more industrial-ized and farm production and food processing have become more intensive . Hence, provision of modern energy services is essential throughout the agri-food chain and its associated industries have become largely dependent on fossil fuel inputs for activities such as heating, cooling, transportation, pumping water, lighting, animal comfort, mechanical power, etc . (Sims et al ., 2015) .
Indirect energy embedded in further agricultural activities such as machinery or fertilizers is also considered . It is estimated that around one third of total end use energy is consumed by the agriculture and food sector globally (FAO, 2011) .
Sustainable energy interventions could reduce fossil dependency as well as CO2 emissions along the agriculture value chain . This could be achieved by introducingrenewableenergytechnologiesaswellasenergyefficiencyandthus improve energy intensity .
Renewable energy technology [» Unit B1] may be very relevant for rural com-munities still without access to modern energy services or where conven-tional energy is particularly expensive due to poor road infrastructure and unreliability of the national electricity grid for example . In such remote loca-tions, small-scale hydro, wind, and solar power systems can replace fossil fuel generators to produce electricity for the production, storage, handling and processing of food products .
Investment in renewable energy and energy-efficient technologies [» Unit C1.6] that address the food-energy nexus can target different stages of the food value chain, therefore it is appropriate to adopt a value chain approach (Fig-ure C3) . In fact each step of the value chain presents different challenges to ensurerelevantenergyservicesareprovidedefficiently,cost-effectivelyandminimize reliance on the fossil fuel market .
Thislecturereferstoinvestmentsinrenewableenergyandenergyefficiencyoptions from the agricultural production stage to food processing activities, leaving aside intervention in transport and logistic sectors, marketing and distribution phases, and food preparation and consumption .

SUSTAINABLE ENERGY FOR FOOD – Massive Open Online Course – Reader
CHAPTER C | UNIT C2 | ENERGY AND AGRICULTURE ON A MICRO LEVEL 99
Applying a value chain approach, it becomes evident how the value of food products tends to increase as more processing occurs and more inputs (energy, water, packaging materials) are consumed . Taking milk [» Unit B1.1 – Milk value chain] as an example (Figure C4); producing, pasteurizing and bottling fresh milk requires around one tenth of the total energy input of cheesemaking.Theenergyinputdecreasesthewatercontentofthefinalproduct, from around 0 .6 calories per gram of fresh milk, to the 5 to 8 times higher calorie content per gram of cheese . Similarly the energy used for mill-
Figure C3 | Food Value Chains in the Agricultural Production and Processing Sector (Sims et al., 2015)
Figure C4 | Differences in Energy Consumption of Different Milk Products (Sims et al., 2015) Energy inputs along the food chain (MJ/kg) tend to increase the value of the product for which the consumer is willing to pay more in terms of USD/calorie delivered.

SUSTAINABLE ENERGY FOR FOOD – Massive Open Online Course – Reader
CHAPTER C | UNIT C2 | ENERGY AND AGRICULTURE ON A MICRO LEVEL 100
ing paddy rice (to remove bran and husks) or for the post-harvest treatment of vegetables increases their value . The energy interventions considered span from solar-power irrigation systems to cooling and cold storage facilities and from the use of residues (e .g . rice husks) for energy production to geothermal energy for processing (drying, cooling, boiling, etc .) (Sims et al ., 2015) .
Introduction RECAP• Sustainableenergyinterventionsinanagri-foodenterpriseincludethe
introductionofrenewableenergytechnologiesorofenergyefficiencymeasures, which can result in an improvement in energy intensity .
• Eachstepofthevaluechainpresentsdifferentchallengestoensurethatrelevantenergyservicesareprovidedefficiently,cost-effectivelyandmini-mize reliance on the fossil fuel market .
• Applyingavaluechainapproach,itbecomesevidenthowthevalueoffood products tends to increase as more processing occurs and more inputs (energy, water, packaging materials) are consumed .
• Theenergyinterventionsconsideredspansolar-powerirrigationsystemsto cooling and cold storage facilities, and the use of residues for energy production to geothermal energy for food processing .
Unit C2.1 | Scales of Agri-Food EnterprisesThe spectrum of agricultural enterprises is complex and diverse . They range from basic subsistence smallholder farmers to large commercial, corporate farms supplying huge supermarket chains across the world . These systems vary according to their dependence on energy inputs and different energy sources, so they differ in managing and incorporating renewables .
Human and animal power are commonly used in small-scale operations for instance, but are increasingly substituted with fossil fuels in other systems . Obviously the adoption of fossil fuels depends on availability and prices, so it will be favored in regions where these are relatively inexpensive . At the same time renewable energy technologies [» Unit B1] increasingly substitute fossil fuels in several medium and large-scale agricultural production and processing activities .
Itisnotpossibletodefineclearboundariesbetween‘small’farmand‘large’farm enterprises, but in this lecture we try to identify some features that can be used to classify agri-food enterprises . Table 1 illustrates the relationship between the different farm size and energy carriers and intensity . Obviously there are exceptions to this categorization . Small enterprise tea plantations
MORE TO LEARNAn overview of energy technologies that can be introduced along the rele-vant ‘hot points’ in the production chain of selected food products is provided in Sims et al ., 2015 . (PDF)
NOTEEnergy Intensity
In this context energy intensity is definedastheamountofenergyused in food production per unit of food produced (MJ per ton of food produced) .

SUSTAINABLE ENERGY FOR FOOD – Massive Open Online Course – Reader
CHAPTER C | UNIT C2 | ENERGY AND AGRICULTURE ON A MICRO LEVEL 101
employmanypickersorsmallfamilyfishingboatshaverelativelyhighfossilfuel dependence for example .
In order to represent the various levels and intensities of energy inputs, agri-food enterprises can be divided between industrial large-scale farming sys-tems, small business and family farms, and small-scale subsistence farming (Figure C5) . These differences in impact scale rely on the ability to manage and incorporate renewable or energy-efficient technologies [» Unit B1.2] and are therefore taken into consideration throughout the techno-economic anal-ysis of agri value chains/projects .
Scale of Producer
Overall Input Intensity
Human Labor Units
Animal Power Use
Fossil Fuel Dependence
Capital Availability
Major Food Markets
Energy Intensity
Subsistence level
Low 1–2 Common Zero / low MicrofinanceOwn consumption
Low
Small family unit
Low / medium
2–3 PossibleLow / medium
LimitedLocalfresh /process / own use
Low / high
Medium / high
2–4 RarelyMedium / high
Limited
Localfresh /regional process / own use
Low / high
Small business
Low / medium
3–10 RarelyMedium / high
MediumLocal /regional /export
Low / high
Medium / high
3–10 Never High MediumLocal /regional /export
Low / high
High 10–50 Never High GoodRegional /regional /export
Low / high
Large corporate business
Medium / high
3–10 Never High MediumLocal /regional /export
Low / high
Figure C5 | Levels and Intensities of Energy Inputs in Farms and Fisheries (FAO, 2011) Typologies of typical “small” and “large” scale farms and fisheries based on qualitative assessments of unit scale, levels of production intensity, labor demand, direct and indirect fossil fuel dependence, investment capital availability, food markets supplied, and energy intensity.
SUSTAINABLE ENERGY FOR FOOD – Massive Open Online Course – Reader
CHAPTER C | UNIT C2 | ENERGY AND AGRICULTURE ON A MICRO LEVEL 102
Subsistence Level: This is the smallest system in which households are engaged in basic forms of small-scale agricultural activities . They produce solely for their own consumption . Subsistence farmers use very low energy inputs, usually derived from human and animal power . These energy inputs aredifficulttomeasureandnotincludedinworldenergystatistics(FAO,2011) . For subsistence farmers priorities are gaining access to energy and securinganadequatelivelihood.Lackoffinancialresourceslimitstheirabil-ity to meet these priorities and to invest in sustainable energy solutions . Nevertheless,coordinatednetworksofsubsistencefarmerscanbenefitfrom renewable energy systems such as small-scale hydro, wind and solar powered systems .
Small Family Units: They are usually engaged in a variety of activities, includ-ingcultivatingsmallgardensorricefields,tendingorchards,raisinglive-stock and maintaining dairy herds (FAO, 2011) . In most countries small-scale farmers provide fresh food to local markets and/or to processing plants . Depending on the degree of modernization, different renewable energy tech-nologiesandenergy-efficiencyoptionsexistforthesesmallenterprises.Forinstance small farms may utilize solar heat for crop drying, on-farm pro-duced biogas for cooking and electricity generated from a solar photovoltaic (PV) system (FAO, 2011) .
Small Businesses: The differences between Small Businesses and Small Family Units are that small businesses can be family-managed, but are usu-ally privately-owned . They usually operate at a slightly larger scale and employ several staff . Since these businesses have more capital available, they have opportunities to reduce their fossil fuel dependence by investing in on-farmrenewableenergy,whichcouldalsoprovideadditionalbenefitstothe surrounding local community .
Large Corporate Businesses: ‘Corporate’, ‘industrialized’, ‘market-based’, ‘commercial’ and ‘multinational’ are terms used to describe modern, large-scalefoodsystemsthatproducefood,fish,feedorfiber.Thesesystemsareusually dependent on high direct and indirect energy inputs throughout the supplychainandhaveaccesstofinancerenewableenergytechnologiesandenergy-efficientequipment.Therefore,theirpotentialtosubstitutefossilfuelswithrenewableenergysourcesandenergy-efficientoptionsforpro-duction or processing activities, such as solar/wind irrigation systems, stor-age facilities, and drying operations is large . Energy may be used on-farm or sold off-farm for additional revenues (FAO, 2011) .

SUSTAINABLE ENERGY FOR FOOD – Massive Open Online Course – Reader
CHAPTER C | UNIT C2 | ENERGY AND AGRICULTURE ON A MICRO LEVEL 103
RECAP• Thespectrumofagriculturalenterprisesiscomplexanddiverse,ranging
from basic subsistence smallholder farmers to large commercial farms .• Inordertorepresentthevariouslevelsandintensitiesofenergyinputs,
agri-food enterprises can be divided between industrial large-scale farm-ing systems using modern technologies, small businesses and family farms using simple technologies, and small-scale subsistence farming systems equipped with traditional technologies .
• Thedifferencesinscaleimpacttheabilitytomanageandincorporaterenewableorenergy-efficienttechnologiesandarethereforeconsideredthroughout the techno-economic analysis of agri value chains/projects .
Unit C2.2 | Techno-Economic Analysis of Energy Projects in Agricultural Value Chains
Unit C2.2.1 | Micro-level Investment Planning This section presents steps to plan investment in renewable energy technol-ogiesandenergyefficiencyinagriculturalandfoodenterprises.Ithighlightsopportunities for sustainable energy interventions along agri-food value chains,andanalyzestheirfeasibilityandfinancialandeconomiccost-bene-fitsinrelationtotheinvestment.Lastly,thissectionpresentsexistingtoolsthatcanbeusedtoassessthefinancialandeconomicviabilityandenviron-mental impact of such interventions .
Whenplanninganinvestment,theoperatororprojectmanagershouldfirstperform a feasibility analysis . It analyzes whether a project can be com-pleted successfully, taking legal, economic, technological, scheduling and other factors into account . It permits the investigation of possible positive and negative outcomes of a project before too much time and money is invested .
Afirststepistocontextualizetheinvestmentintoaneconomic,institutional,social and technical framework . Constraints and challenges to the use of sustainable energy in agricultural and food industries in developing coun-tries can indeed stem from these areas . Figure C6 summarizes the main constraints on biomass supply and barriers to sustainable bioenergy supply chain mobilization . A preliminary test for the value of the investment requires clear identification of financial, economic, institutional, social and technical opportunities and risks [» Chapter C] .
» Unit C3
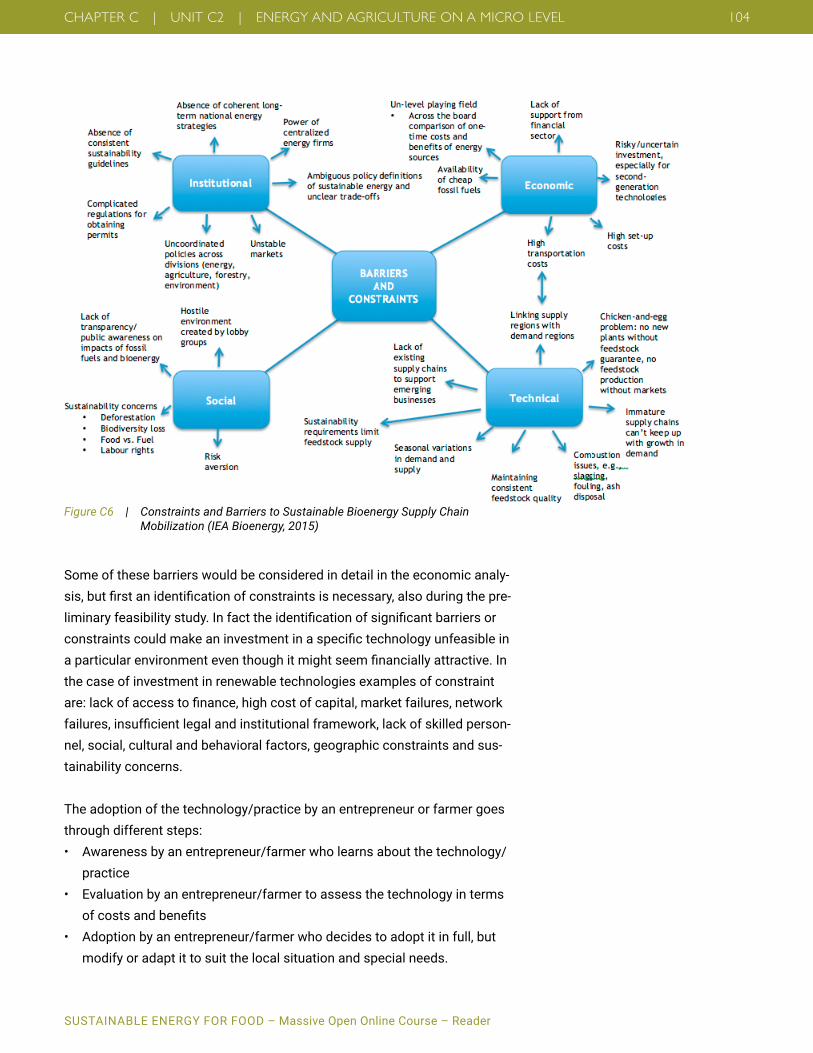
SUSTAINABLE ENERGY FOR FOOD – Massive Open Online Course – Reader
CHAPTER C | UNIT C2 | ENERGY AND AGRICULTURE ON A MICRO LEVEL 104
Some of these barriers would be considered in detail in the economic analy-sis,butfirstanidentificationofconstraintsisnecessary,alsoduringthepre-liminaryfeasibilitystudy.Infacttheidentificationofsignificantbarriersorconstraintscouldmakeaninvestmentinaspecifictechnologyunfeasibleinaparticularenvironmenteventhoughitmightseemfinanciallyattractive.Inthe case of investment in renewable technologies examples of constraint are:lackofaccesstofinance,highcostofcapital,marketfailures,networkfailures,insufficientlegalandinstitutionalframework,lackofskilledperson-nel, social, cultural and behavioral factors, geographic constraints and sus-tainability concerns .
The adoption of the technology/practice by an entrepreneur or farmer goes through different steps:• Awarenessbyanentrepreneur/farmerwholearnsaboutthetechnology/
practice• Evaluation by an entrepreneur/farmer to assess the technology in terms
ofcostsandbenefits• Adoptionbyanentrepreneur/farmerwhodecidestoadoptitinfull,but
modify or adapt it to suit the local situation and special needs .
Figure C6 | Constraints and Barriers to Sustainable Bioenergy Supply Chain Mobilization (IEA Bioenergy, 2015)

SUSTAINABLE ENERGY FOR FOOD – Massive Open Online Course – Reader
CHAPTER C | UNIT C2 | ENERGY AND AGRICULTURE ON A MICRO LEVEL 105
The adoption of the technological option also depends on the risk perceived by the farmer/ entrepreneur, therefore stakeholder involvement is relevant . Weak connectivity between actors, social biases and traditions may repre-sent constraints to the adoption of sustainable energy technologies .
Renewableenergyandenergy-efficiencyinterventionscanbeatdifferencestages of the agri-food value chain, from production to commercialization (Figure C7) .
The methodology to perform a techno-economic analysis of the investment is the same regardless of the technology and value chain stage . The analy-sis performed in this lecture covers investments from production to process-ing, but does not consider the commercialization stage .
While deciding whether to invest in renewable energy technologies and energyefficiency,anagriculturalandfoodenterprisewouldcomparethisoption with the energy source or technology currently used (e .g . fossil fuels) . Analysis from many demonstration and commercial renewable energy plantsshowthatprojectcostsareverysite-specific(Figure C8) . Levelized costs of many renewable energy technologies are becoming more and more competitive with current average costs of fossil-fuel powered electricity,
MORE TO LEARNAn overview of energy technologies that can be introduced along the rele-vant ‘hot points’ in the production chain of selected food products is provided in Sims et al ., 2015 . (PDF)
Figure C7 | Examples of Clean Energy in the Agri-Food Value Chain (REEP, 2015)

SUSTAINABLE ENERGY FOR FOOD – Massive Open Online Course – Reader
CHAPTER C | UNIT C2 | ENERGY AND AGRICULTURE ON A MICRO LEVEL 106
heat and transport fuels they displace . Moreover, costs for renewable energy technologies decline as the size of their markets increases . In remote rural regions with no electricity grid access [» Unit C3.2] for example, autonomous renewable energy systems avoid expensive grid connection costs and are already competitive .
In order to quantitatively assess the attractiveness of an investment a Finan-cial and Economic Analysis (FEA) needs to be performed . In the following paragraphwedescribethenecessarystepstoperformafinancialanalysisand an economic analysis . Additionally we introduce some tools that can helpsmallbusinessestoperformafinancialanalysis.
Themaingoaloffinancialanalysis(FA)istoexaminethefinancialreturnstoprojectstakeholders(i.e.beneficiaries,institutionsandgovernments,etc.)in
Figure C8 | Cost Comparison of Fossil and Renewable Energy Products (based on IPCC, 2011)
CLOSE-UPLevelized Cost of Energy (LCOE)
The levelized cost of energy (LCOE) represents the cost of an energy gen-erating system over its lifetime . Lev-elized cost of electricity is often cited as a convenient summary measure of the overall competiveness of differ-ent generating technologies . It is cal-culated as the per-unit price at which energy must be generated from a specificsourceoveritslifetimetobreak even (recover all costs, includ-ingfinancingandanassumedreturnon investment) . LCOE usually includes all private costs that accrue upstream in the value chain, but does not include the downstream cost of deliverytothefinalcustomer,thecost of integration, or external envi-ronmental or other costs . Subsidies and tax credits are also not included .
The costs of electricity, heat and liquid biofuels produced from renewable energy sources can be higher than when produced from conventional fos-sil fuels, but under specific circumstances, some renewable technologies are already competitive (shown where they overlap with the vertical range bars of conventional wholesale electricity, heat and gasoline/diesel costs).

SUSTAINABLE ENERGY FOR FOOD – Massive Open Online Course – Reader
CHAPTER C | UNIT C2 | ENERGY AND AGRICULTURE ON A MICRO LEVEL 107
order to demonstrate that the incentive of all actors is high enough to partic-ipate.Afinancialanalysisprovidesthefoundationforaneconomicanalysis(EA), which is carried out to ascertain a project’s desirability in terms of its net contribution to the economic and social welfare of the country (or sub-national entities) as a whole (FAO) . In the area of development studies, theterms“financial”and“economic”arecommonlydefinedasfollows:
• Afinancialanalysisisundertakenfromtheperspectiveofindividualagents, or categories of agents (farmers, retail traders, primary assem-blers); it includes the analysis of production-utilization accounts, the prof-itability of investments, etc .
• Aneconomicanalysisisundertakenfromtheperspectiveoftheoveralleconomic system (national economy, sector or chain) or large groups of heterogeneous agents; it includes the analysis of taxes, subsidies, etc .
Most governments and International Financing Institutions (IFIs) usually requireafinancialandeconomicanalysis(FEA)ofinvestmentprojectsinordertoensurethefinancialandeconomicviabilityofaninvestment.
Inthecontextoftheproject’slogicalframework,thefinancialandeconomicanalysis starts with investigating the proposed project’s main objectives and targets.Thentherelevantprojectbenefitsandcostsareidentifiedandmon-etized to perform a quantitative analysis .
Thefinancialandeconomicanalysisbasicallyconsistsoftwomainsteps:
1. Financial Cost-Benefit Analysis:anassessmentoftheproject’sfinancialprofitabilityandsustainabilityinordertodeterminewhetherthefarmersorotherstakeholdershavesufficientincentive to participate in the project
2. Economic Cost-Benefit Analysis:an assessment of the project’s economic viability from the point of view of the national (or sub-national) economy . This step should also examine its expectedimpactonthegovernmentbudgettoensureitsfiscalsustainabil-ity . Furthermore, the economic analysis of investments in renewable energy usually includes an assessment of a project’s impact on social and environ-mental aspects [» Unit C1.4] .
In the paragraph below, we will explore these two steps in more detail .In agricultural and food enterprises, renewable energy technologies [» Unit B1]

SUSTAINABLE ENERGY FOR FOOD – Massive Open Online Course – Reader
CHAPTER C | UNIT C2 | ENERGY AND AGRICULTURE ON A MICRO LEVEL 108
are usually adopted as substitutes to traditional energy sources, usually fos-silfuels.Thereforethefinancialandeconomicanalysisoftheinvestmentrequires a comparison with this benchmark . Project FEA is concerned with theincrementalcostsandbenefitsofaproject,andthusrequiresacompari-son between the potential situations “with” and “without” the project .
1. Thefirststepistheidentificationanddescriptionofboththebenchmarkscenario(whichnormallyconsistsoffossilfuel-poweredand/orineffi-cient technologies) and the post-energy intervention scenario (where the technology is adopted) . For instance, an irrigation system can be pow-ered by a diesel pump (benchmark scenario) or by a solar photovoltaic (PV)poweredpump(post-energyinterventionscenario).Thefinancialanalysis of an investment in the PV pump would require the comparison between the two scenarios .
2. Thesecondstepistheidentificationoftheinvestmentoutcomes,includingcapitalandoperatingcosts,andmonetizedbenefits.Becausecostsandbenefitsdonotoccuratthesametime–withcostsgenerallyprecedingandexceedingbenefitsduringthefirstyearsoftheproject–the comparison requires discounting techniques .
3. Thethirdstepisdeterminingtheproject’sincrementalnetflows(finan-cialand/oreconomic),whichresultsfromcomparingcostsandbenefitsof the project with the benchmark scenario . It is possible to calculate thecorrespondingprojectprofitabilityindicatorswiththeseelements.
Unit C2.2.2 | Financial Cost-Benefit AnalysisThe standard and comprehensive approach for performing a Financial and EconomicAnalysisisaCost-BenefitAnalysis(CBA).ACBAconsistsofmon-etizingallmajorbenefitsandallcostsgeneratedbytheinvestmentandpre-senting their streams over the lifetime of the technology, usually expressed innumberofyears(cashflow).Costsandbenefitscanthenbecompareddirectly between different scenarios, as well as with reasonable alternatives to the proposed project .
Generally speaking a project is considered ‘viable’ if the sum of expected incrementalbenefitsislargerthanthesumofallcostsaccruedinprojectimplementation.Thiscanbeassessedthroughprofitabilityindicators.Ingeneral CBA provides four main indicators: Net Present Value (NPV), Internal RateofReturn(IRR),benefit/cost(B/C)ratioandthepaybacktime.Theseindicators assess attractiveness of investment by comparing the present value of money to the future value of money, taking the time value of money

SUSTAINABLE ENERGY FOR FOOD – Massive Open Online Course – Reader
CHAPTER C | UNIT C2 | ENERGY AND AGRICULTURE ON A MICRO LEVEL 109
(discount rate) and returns on investment into account . Therefore these indi-cators are important decision-making tools for investors, national govern-ments, as well as for donors and IFIs .
Net Present Value (NPV): The NPV indicator is determined by calculating the costs(negativecashflows)andbenefits(positivecashflows)foreachperiod of an investment and by discounting their value over a periodic rate of return.TheNPVisdefinedasthesumoftheresultswhentheinitialcostsoftheinvestmentaredeductedfromthediscountedvalueofthenetbenefits(revenues minus cost, Rt) .
Unit C2.2.3 | NPV equation
Therefore,theNPVofaprojectdependonitsnetbenefits,projectlifetimeanddiscountrate.WhenevertheNPVispositive(NPV>0),theprojectisconsideredworthwhileorprofitable.ComparingtheNPVofseveralpossibleinvestmentspermitsidentificationofthealternativethatyieldsthehighestresult – for cases in which the alternatives are mutually exclusive . Among mutually exclusive projects, the one with the highest NPV should be chosen .
Internal Rate of Return: TheIRRindicatorisdefinedasthediscountrateatwhich the NPV equals zero . This rate means that the present value of positive cashflowfortheprojectequalsthepresentvalueofitscosts.IfIRRexceedscostofcapital,theprojectisworthwhile,i.e.itisprofitabletoundertake.
Foraprojecttobeprofitable,theIRRhastobegreaterthantheinterestratethat could be earned in alternative investments or than the opportunity costs ofcapital(r).ThereforewhenIRR>rtheprojectisconsideredviable.
NPVandIRRarecalculatedonthesameprojectcashflowsofincrementalnetbenefits.However,whenwewanttochoosebetweentwoalternativeprojects with differences in the scale of investment, IRR should not be used . In fact NPV is preferable when the investors set their goals in absolute terms, since it ensures that the operator reaches an optimal scale of invest-
MORE TO LEARNNPV Equation
MORE TO LEARNIFAD’S Internal Guidelines Economic and Financial Analysis of rural invest-ment projects . Basic concepts and rationale . The International Fund for Agricultural Development (PDF) (IFAD, 2015) .
S.83
𝐸𝐸𝐸𝐸𝐸𝐸𝐸𝐸𝐸𝐸𝐸𝐸𝐸𝐸𝐸𝐸𝐸𝐸𝐸𝐸 = 𝑂𝑂𝑂𝑂𝑂𝑂𝑂𝑂𝑂𝑂𝑂𝑂𝐼𝐼𝐸𝐸𝑂𝑂𝑂𝑂𝑂𝑂 = 𝑆𝑆𝐸𝐸𝑆𝑆𝑆𝑆𝐸𝐸𝐸𝐸𝐸𝐸 𝑂𝑂𝑂𝑂𝑂𝑂𝑂𝑂𝑂𝑂𝑂𝑂
𝑈𝑈𝑈𝑈𝐸𝐸𝑈𝑈 𝑅𝑅𝐸𝐸𝑈𝑈𝑅𝑅𝑂𝑂𝑆𝑆𝐸𝐸𝐸𝐸
S.84
𝜂𝜂 = 𝑈𝑈𝑈𝑈𝐸𝐸𝐸𝐸𝑂𝑂𝑈𝑈 𝐸𝐸𝐸𝐸𝐸𝐸𝑆𝑆𝐸𝐸𝐸𝐸 𝑂𝑂𝑂𝑂𝑂𝑂𝑂𝑂𝑂𝑂𝑂𝑂𝐸𝐸𝐸𝐸𝐸𝐸𝑆𝑆𝐸𝐸𝐸𝐸 𝐼𝐼𝐸𝐸𝑂𝑂𝑂𝑂𝑂𝑂
S.85
𝐿𝐿𝐸𝐸𝐿𝐿 𝑏𝑏𝑂𝑂𝑈𝑈𝑏𝑏 = 𝑂𝑂𝑂𝑂𝑂𝑂𝑂𝑂𝑂𝑂𝑂𝑂𝐼𝐼𝐸𝐸𝑂𝑂𝑂𝑂𝑂𝑂 = 𝐵𝐵𝑆𝑆𝐸𝐸𝐸𝐸ℎ𝑂𝑂𝐸𝐸𝐸𝐸𝑈𝑈𝑈𝑈
𝑃𝑃𝑅𝑅𝑃𝑃𝐸𝐸𝑆𝑆 = 1000 𝐿𝐿𝑂𝑂𝑢𝑢𝐸𝐸𝐸𝐸20 𝑊𝑊𝑊𝑊𝑂𝑂𝑂𝑂 = 50 𝑈𝑈𝑢𝑢
𝑊𝑊
𝐼𝐼𝐸𝐸𝐸𝐸𝑊𝑊𝐸𝐸𝑈𝑈𝐸𝐸𝑈𝑈𝐸𝐸𝐸𝐸𝐸𝐸𝑂𝑂 𝑈𝑈𝐸𝐸𝐸𝐸ℎ𝑂𝑂 𝑏𝑏𝑂𝑂𝑈𝑈𝑏𝑏 = 𝑂𝑂𝑂𝑂𝑂𝑂𝑂𝑂𝑂𝑂𝑂𝑂𝐼𝐼𝐸𝐸𝑂𝑂𝑂𝑂𝑂𝑂 = 𝐵𝐵𝑆𝑆𝐸𝐸𝐸𝐸ℎ𝑂𝑂𝐸𝐸𝐸𝐸𝑈𝑈𝑈𝑈
𝑃𝑃𝑅𝑅𝑃𝑃𝐸𝐸𝑆𝑆 = 1000 𝐿𝐿𝑂𝑂𝑢𝑢𝐸𝐸𝐸𝐸100 𝑊𝑊𝑊𝑊𝑂𝑂𝑂𝑂 = 10 𝑈𝑈𝑢𝑢
𝑊𝑊
S.152 NPV EQUATION
𝑁𝑁𝑃𝑃𝑁𝑁 = ∑ 𝑅𝑅𝑡𝑡(1 + 𝐸𝐸)𝑡𝑡 + 𝑅𝑅0
𝑁𝑁
𝑡𝑡=0
𝑅𝑅𝑡𝑡 = 𝑆𝑆𝑂𝑂𝑢𝑢 𝑅𝑅𝐸𝐸 𝑊𝑊𝑈𝑈𝑈𝑈 𝑂𝑂ℎ𝐸𝐸 𝑈𝑈𝐸𝐸𝑈𝑈𝐸𝐸𝑅𝑅𝑂𝑂𝐸𝐸𝑂𝑂𝐸𝐸𝑈𝑈 𝐸𝐸𝑂𝑂𝑂𝑂𝑂𝑂𝑆𝑆𝐸𝐸 𝐸𝐸𝑊𝑊𝑈𝑈ℎ 𝐸𝐸𝑈𝑈𝑅𝑅𝑃𝑃𝑈𝑈 𝑅𝑅0 = (𝑁𝑁𝐸𝐸𝐸𝐸𝑊𝑊𝑂𝑂𝐸𝐸𝑆𝑆𝐸𝐸) 𝐸𝐸𝑊𝑊𝑈𝑈ℎ 𝐸𝐸𝑈𝑈𝑅𝑅𝑃𝑃 𝑊𝑊𝑂𝑂 𝑂𝑂𝐸𝐸𝑢𝑢𝐸𝐸 𝑧𝑧𝐸𝐸𝑆𝑆𝑅𝑅, 𝑆𝑆𝐸𝐸𝑂𝑂𝑆𝑆𝐸𝐸𝑈𝑈𝐸𝐸𝐸𝐸𝑂𝑂𝐸𝐸𝐸𝐸𝐸𝐸 𝑂𝑂ℎ𝐸𝐸 𝐸𝐸𝐸𝐸𝐸𝐸𝑂𝑂𝐸𝐸𝑊𝑊𝑈𝑈 𝐸𝐸𝐸𝐸𝑆𝑆𝐸𝐸𝑈𝑈𝑂𝑂𝑢𝑢𝐸𝐸𝐸𝐸𝑂𝑂
𝑂𝑂 = 𝑇𝑇𝐸𝐸𝑢𝑢𝐸𝐸 𝑅𝑅𝐸𝐸 𝑂𝑂ℎ𝐸𝐸 𝐸𝐸𝑊𝑊𝑈𝑈ℎ 𝐸𝐸𝑈𝑈𝑅𝑅𝑃𝑃, 𝑈𝑈𝐸𝐸𝑂𝑂𝐸𝐸𝐸𝐸𝑈𝑈𝐸𝐸𝐸𝐸𝐸𝐸 𝑅𝑅𝐸𝐸 𝑂𝑂ℎ𝐸𝐸 𝑂𝑂𝑆𝑆𝑅𝑅𝑝𝑝𝐸𝐸𝐸𝐸𝑂𝑂 𝑈𝑈𝐸𝐸𝐸𝐸𝐸𝐸𝑂𝑂𝐸𝐸𝑢𝑢𝐸𝐸 𝐸𝐸 = 𝐿𝐿𝐸𝐸𝑈𝑈𝐸𝐸𝑅𝑅𝑂𝑂𝐸𝐸𝑂𝑂 𝑆𝑆𝑊𝑊𝑂𝑂𝐸𝐸 𝑅𝑅𝑆𝑆 𝑆𝑆𝑊𝑊𝑂𝑂𝐸𝐸 𝑅𝑅𝐸𝐸 𝑆𝑆𝐸𝐸𝑂𝑂𝑂𝑂𝑆𝑆𝐸𝐸
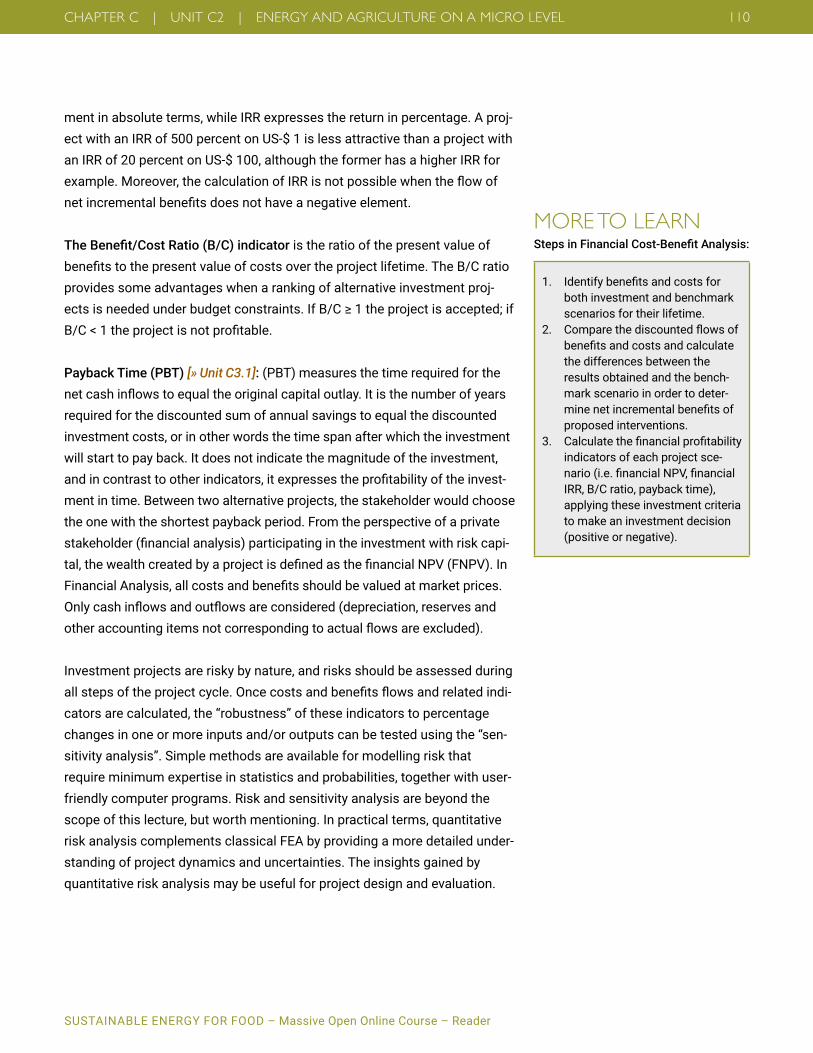
SUSTAINABLE ENERGY FOR FOOD – Massive Open Online Course – Reader
CHAPTER C | UNIT C2 | ENERGY AND AGRICULTURE ON A MICRO LEVEL 110
ment in absolute terms, while IRR expresses the return in percentage . A proj-ect with an IRR of 500 percent on US-$ 1 is less attractive than a project with an IRR of 20 percent on US-$ 100, although the former has a higher IRR for example.Moreover,thecalculationofIRRisnotpossiblewhentheflowofnetincrementalbenefitsdoesnothaveanegativeelement.
The Benefit/Cost Ratio (B/C) indicator is the ratio of the present value of benefitstothepresentvalueofcostsovertheprojectlifetime.TheB/Cratioprovides some advantages when a ranking of alternative investment proj-ectsisneededunderbudgetconstraints.IfB/C≥1theprojectisaccepted;ifB/C<1theprojectisnotprofitable.
Payback Time (PBT) [» Unit C3.1]: (PBT) measures the time required for the netcashinflowstoequaltheoriginalcapitaloutlay.Itisthenumberofyearsrequired for the discounted sum of annual savings to equal the discounted investment costs, or in other words the time span after which the investment will start to pay back . It does not indicate the magnitude of the investment, andincontrasttootherindicators,itexpressestheprofitabilityoftheinvest-ment in time . Between two alternative projects, the stakeholder would choose the one with the shortest payback period . From the perspective of a private stakeholder(financialanalysis)participatingintheinvestmentwithriskcapi-tal,thewealthcreatedbyaprojectisdefinedasthefinancialNPV(FNPV).InFinancialAnalysis,allcostsandbenefitsshouldbevaluedatmarketprices.Onlycashinflowsandoutflowsareconsidered(depreciation,reservesandotheraccountingitemsnotcorrespondingtoactualflowsareexcluded).
Investment projects are risky by nature, and risks should be assessed during allstepsoftheprojectcycle.Oncecostsandbenefitsflowsandrelatedindi-cators are calculated, the “robustness” of these indicators to percentage changes in one or more inputs and/or outputs can be tested using the “sen-sitivity analysis” . Simple methods are available for modelling risk that require minimum expertise in statistics and probabilities, together with user-friendly computer programs . Risk and sensitivity analysis are beyond the scope of this lecture, but worth mentioning . In practical terms, quantitative risk analysis complements classical FEA by providing a more detailed under-standing of project dynamics and uncertainties . The insights gained by quantitative risk analysis may be useful for project design and evaluation .
MORE TO LEARNSteps in Financial Cost-Benefit Analysis:
1. Identifybenefitsandcostsforboth investment and benchmark scenarios for their lifetime .
2. Comparethediscountedflowsofbenefitsandcostsandcalculatethe differences between the results obtained and the bench-mark scenario in order to deter-minenetincrementalbenefitsofproposed interventions .
3. Calculatethefinancialprofitabilityindicators of each project sce-nario(i.e.financialNPV,financialIRR, B/C ratio, payback time), applying these investment criteria to make an investment decision (positive or negative) .

SUSTAINABLE ENERGY FOR FOOD – Massive Open Online Course – Reader
CHAPTER C | UNIT C2 | ENERGY AND AGRICULTURE ON A MICRO LEVEL 111
Unit C2.2.4 | Economic AnalysisThebasicprinciplesforcarryingoutfinancialandeconomicanalysisarethesame and both are required for project screening and selection . However, FinancialAnalysisdealswiththecostandbenefitflowsfromthepointofview of the individual, farmer or food processor in our case, while economic analysisdealswithcostsandbenefitstosociety.EconomicAnalysistakesabroaderviewofcostsandbenefits,andthemethodsofanalysisdifferinimportantaspects.Anenterpriseisinterestedinfinancialprofitabilityandthesustainabilityofthatprofit,whilesocietyisconcernedwithwiderobjec-tives, such as social and environmental issues [» Unit C1.4],andnetbenefitsto society as a whole .
An economic analysis takes energy subsidies and taxes [» Unit C1], the impacts of the renewable energy project on land, labor and human rights, local people livelihood, environment, GHG emission, etc . into account (FAO, 2015).Theseandotherexternalitiesandco-benefitsarecontextspecificandcan be inserted in the analysis in order to modify the project’s structure of economiccostsandbenefits.Theseincludeforexampleeconomicincen-tives to renewables or fossil fuels, or costs to mitigate climate change [» Unit A2],ortoensuremoreefficientuseofwaterandland,costsaccruedin water treatment, measures to contain negative environmental impact, whicharepartofthepicture,althoughnotpresentinthefinancialinvestorbusiness plan .
The FAO Nexus Assessment [» Unit A1.1] (FAO, 2014) is a tool that can be used to introduce basic social and environmental externalities of a technical intervention into the analysis . This assessment consists of an easily applica-blemethodologytoquicklyevaluatepossibleinterventionsinaspecificcon-text against overarching development goals, such as food security, and the sustainabilityofenergyandwatersupply,useandmanagement.Asimplifiedversion of this tool, the Water-Energy-Food (WEF) Nexus Rapid Appraisal, can be used for a desk assessment of the impacts of an intervention on water,energy,food,labourandcostsinthecontextofaspecificcountry.
The procedures to quantify and monetize these and other environmental and social factors are not always straightforward and are beyond the scope of this lecture . Deriving “shadow” and economic prices net of transfer pay-ments are therefore not easy tasks, but leading factors to calculate eco-nomic performance indicators adopting a social discount rate: economic NPV (ENPV), IRR, B/C ratio and payback time .
MORE TO LEARNWalking the Nexus Talk: Assessing the Water-Energy-Food Nexus in the Context of the Sustainable Energy for All Initiative (PDF) (FAO, 2014)
FAO Water-Energy-Food (WEF) Nexus Rapid Appraisal .
CLOSE-UPMain differences between financial and economic analysis:
• attemptstoquantify“externali-ties”, i .e . negative or positive effectsonspecificgroupsinsoci-ety without the project entity incur-ring a corresponding monetary cost or enjoying a monetary bene-fit.Thisincludesbothenvironmen-tal and social impacts resulting from the energy intervention
• removestransferpayments,i.e.subsidies and taxes; and
• makesuseof“shadowprices”that might differ from “market prices”,whichreflecttheeffectiveopportunity costs for the econ-omy, thus achieving a proper valu-ation of Economic Costs and Ben-efitsfromtheperspectiveoftheeconomy as a whole .

SUSTAINABLE ENERGY FOR FOOD – Massive Open Online Course – Reader
CHAPTER C | UNIT C2 | ENERGY AND AGRICULTURE ON A MICRO LEVEL 112
Unit C2.2.5 | Cost-Benefit Analysis ToolsCost-BenefitAnalysiscanbedifficultfornon-professionals.Severalonlinetools are available to support small and medium businesses in performing cost-benefitevaluationoftheirinvestmentinanenergy-foodcontext.Anon-exhaustive list with some examples is provided below:
WinDASI - a software for Cost-Benefit Analysis (CBA) of investment projects:FAOprovidesthistooltocarryoutcost-benefitcalculationsofinvestmentprojects.Aftercostandbenefitdataareinsertedinthedatabase,WinDASIguidestheuseronhowtocalculate:a)flowsofphysicalquantitiesofout-puts,inputsandinvestmentitems;b)flowsofcurrent,discountedandcumu-lativecosts,benefits,andnetbenefits;c)flowsofincremental(With-Withoutproject)current,discountedandcumulativenetbenefits;ande)projectindi-cators such as the Net Present Value (NPV), the Internal Rate of Return (IRR),theBenefit/CostRatio(B/C)andSensitivityAnalysis.Calculationscanbe carried out at different levels of aggregation for the different components of an investment project (i .e . plans, zones and projects) . In addition WinDASI permits calculation and comparisons of different projects’ alternative sce-narios (with–project versus without-project) . The WinDASI program is down-loadable from the FAO EASYPol website: » HERE
VCA Tool - a software for Value Chain Analysis to assess socioeconomic and environmental policy impacts: developed by FAO, this tool allows different scenarios to be built and to analyze the socio-economic impact of various pol-iciessuchastheadoptionofnewlow-carbonenergy-efficienttechnologiesorsupport for renewable energy . The information about how inputs and outputs would change before and after intervention is exogenous and can come from other sources . Among other things, the tool permits: commodity chain analy-sis,impactanalysisusingshadowprices,financialanalysis,impactanalysisusingmarketprices,scenarioscomparison,cost-benefitanalysis,competi-tivenessandprofitabilityindicators.Thesoftwareisavailableat:» HERE
Power Irrigation Tool: this FAO tool evaluates economic, environmental and social aspects of different energy sources for irrigation in order to help oper-ators assess the economic viability of different power supply options and water pumping technologies . The tool assesses the economics associated with different energy sources for irrigation including cost, price, and payback time . It can be accessed: » HERE

SUSTAINABLE ENERGY FOR FOOD – Massive Open Online Course – Reader
CHAPTER C | UNIT C2 | ENERGY AND AGRICULTURE ON A MICRO LEVEL 113
Rural Invest - A Participatory Approach to Identifying and Preparing Small/Medium Scale Agricultural and Rural Investments: developed by the FAO Investment Centre, it provides support to local communities, private entre-preneurs or producers’ associations to conceive and implement their own investment projects through a range of materials and training courses including technical manuals, custom-developed software, user guides and instructor materials . More information: » HERE
RETScreen:thetoolperformscostandfinancialanalysisconsideringforinstance: base case system energy cost (e .g . retail price of heating oil), financing(e.g.debtratioandlength),taxes,environmentalcharacteristicsofenergy displaced (e .g . grid electricity), environmental credits and/or subsi-dies (e .g . GHG credits, deployment incentives), indicators such as payback period, ROI, NPV, energy production costs . It has been developed by Canme-tENERGY and can be downloaded » HERE
Thejourneyfromfinancialtoeconomicanalysisisnotalwayssmoothandaccording to the focus of the analysis the investigator has to make a deci-sion on political, economic, social and environmental factors to be included in the analysis . Regarding investment in renewable technology, a list of rele-vant energy policies adopted by each country is provided by the IEA/IRENA Joint Policies and Measures database . This dataset summarizes economic instruments, policy support and regulatory instruments, research, develop-ment and deployment (RD&D) strategy and voluntary approaches targeting renewable technologies . Hence, it can be useful to identify transfer pay-ments (taxes and subsidies) and to convert market prices into economic/shadow prices .
Another useful tool that can be adopted to include in social and environmen-tal factors of the analysis is the already mentioned FAO Nexus Assessment, which assesses the performance of some energy interventions in terms of water,energy,food,laborandcostsinaspecificcontext(FAO,2014).
RECAP• Beforeperformingfinancialandeconomiccost-benefitanalysis,the
investment must be contextualized into an economic, institutional, social and technical framework to identify relevant barriers and constraints .
• Thefirststepistheidentificationanddescriptionofboththebenchmarkscenario and the investment scenario .
• Thesecondstepistheidentificationoftheinvestment’soutcomes,includingthecapitalandoperatingcostsandmonetizedbenefits.
CLOSE-UPSteps in Economic Cost-benefit Analysis:
1. Convertallmarketpricesintoeconomic/shadow prices that betterreflectthesocialopportu-nity cost of goods .
2. Removetransferpayments(taxesand subsidies) and quantify exter-nalities (positive and negative) .
3. Compareaproject’scostsandbenefitswiththebenchmarksce-nario to obtain the project’s incre-mentalnetflows.
4. Calculateeconomicperformanceindicators adopting a social dis-count rate: ENPV, IRR, B/C ratio and payback time .
5. Performsensitivityanalysisinorder to deal with the main risks and uncertainties that could affect a proposed project .

SUSTAINABLE ENERGY FOR FOOD – Massive Open Online Course – Reader
CHAPTER C | UNIT C2 | ENERGY AND AGRICULTURE ON A MICRO LEVEL 114
• Thethirdstepisdeterminingtheproject’sincrementalnetflows,whichresultfromcomparingcostsandbenefitsoftheprojectwithcostsandbenefitsofthebenchmarkscenario.Thenitispossibletocalculatethefinancialprojectprofitabilityindicators.
• Thenextstepsareconvertingmarketpricesintoeconomic/shadowprices; removing transfer payments (e .g . taxes and subsidies) and quanti-fyingpositiveandnegativeexternalitiestocalculateeconomicflows.
• PerformSensitivityAnalysisinordertodealwiththemainrisksanduncertainties that could affect the proposed project (optional) .
SUMMARY & UNIT WRAP-UP This unit has provided a general overview on how to perform a micro assessment of investments in renewable energy . More details on this topic can be found in the recommended literature and references .
MORE TO LEARNOpportunities for Agri-Food Chains to Become Energy-Smart (PDF) (Sims et al ., 2015)
IEA/IRENA Joint Policies and Measures database .
MATERIALS Please find below links to our materials and references
Videowww .giz .de/gc21/pa_video_lectures
Additional Materialwww .giz .de/gc21/pa_additional_material
Referenceswww .giz .de/gc21/pa_references
SUSTAINABLE ENERGY FOR FOOD – Massive Open Online Course – Reader
CHAPTER C | UNIT C3 | BUSINESS MODELS FOR PROJECTS IN THE ENERGY AGRICULTURE NEXUS 115
UNIT C3 BUSINESS MODELS FOR PROJECTS IN THE ENERGY AGRICULTURE NEXUS
INTRODUCTIONBuilding on the previous chapters C3 aims to provide you with basic knowl-edge on business models and common methods for business decision mak-ing (capital budgeting) – with a focus on hands-on aspects . Business mod-els do not thereby necessarily refer to a completely new business, but also applytochangeswithinanexistingbusinesse.g.introducingenergy-effi-ciency measures in a food processing company . The second part of this chapterdiscussesdetailedexamplesoffinancialanalysisofgrid-connectedandoff-gridcleanenergyprojectsintheagriculturalsector.Youwillfindthatthese case studies bring together much of the content of the previous chap-ters and will hopefully help you in implementing your own clean energy solu-tions for agricultural activities .
Unit C3.1 | Business Models Unit C3.1.1 | Introduction to Business ModelsAlthough a business model is a fundamental part of economic activity, the termisunderstoodanddefinedinmanydifferentways.Toputitsimplyabusi-ness model describes the core strategy of an organization for how to generate money and by this determines how the company produces, distributes, prices andpromotesitsproducts.Abusinessmodelcanalsobedefinedas“thespe-cificcombinationoftheproductmadeandsoldbythefirm,thetechnologyuti-lized, and the scale of production, backward and forward market linkages and financingarrangements”(ValueLinksAssociation,2009).
Usually everything starts with an idea about how to earn money . Ideas might expand further on how to improve livelihood . The crucial point is about offer-ing a product or a service that does not yet exist in the market, but that has a high potential to create value for people who will be willing to pay for the product or service . This idea should be commercially viable and sustainable . It should be noted that established businesses also develop new business models; for instance, optimizing a core process affects the business model . An example is improved energy access e .g . for a diary collection center that
AUTHORS Ramchandra Bhandari (TH Köln – University of Applied Sciences)
Rebecca Besser (TH Köln – Univer-sity of Applied Sciences)
David Arndt (TH Köln – University of Applied Sciences)
Günther Straub (TH Köln – University of Applied Sciences)
MATERIALS Please find below links to our materials and references
Videowww .giz .de/gc21/pa_video_lectures
Additional Materialwww .giz .de/gc21/pa_additional_material
Top5 Team Assignmentswww .giz .de/gc21/pa_assignments
Referenceswww .giz .de/gc21/pa_references
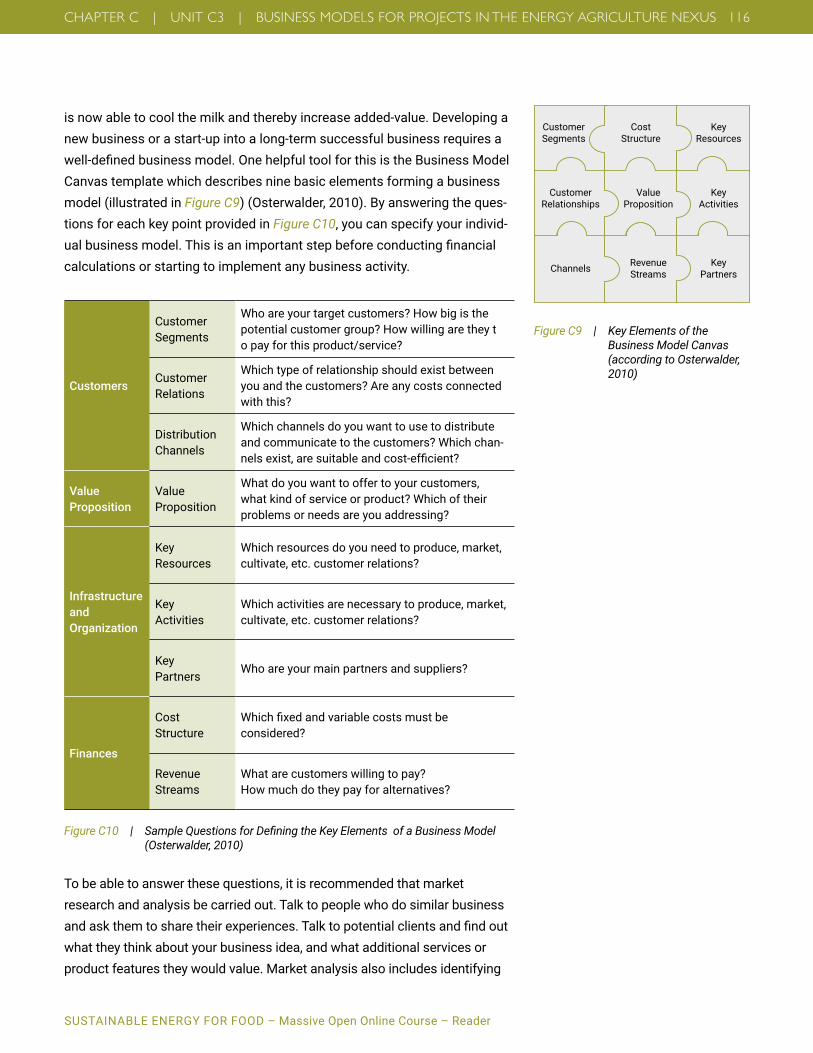
SUSTAINABLE ENERGY FOR FOOD – Massive Open Online Course – Reader
CHAPTER C | UNIT C3 | BUSINESS MODELS FOR PROJECTS IN THE ENERGY AGRICULTURE NEXUS 116
is now able to cool the milk and thereby increase added-value . Developing a new business or a start-up into a long-term successful business requires a well-definedbusinessmodel.OnehelpfultoolforthisistheBusinessModelCanvas template which describes nine basic elements forming a business model (illustrated in Figure C9) (Osterwalder, 2010) . By answering the ques-tions for each key point provided in Figure C10, you can specify your individ-ualbusinessmodel.Thisisanimportantstepbeforeconductingfinancialcalculations or starting to implement any business activity .
Customer Segments
Cost Structure
Key Resources
Customer Relationships
Value Proposition
Key Activities
Channels Revenue Streams
Key Partners
Figure C9 | Key Elements of the Business Model Canvas (according to Osterwalder, 2010)
Customers
Customer Segments
Whoareyourtargetcustomers?Howbigisthepotentialcustomergroup?Howwillingaretheyt opayforthisproduct/service?
Customer Relations
Which type of relationship should exist between youandthecustomers?Areanycostsconnectedwiththis?
Distribution Channels
Which channels do you want to use to distribute andcommunicatetothecustomers?Whichchan-nelsexist,aresuitableandcost-efficient?
Value Proposition
Value Proposition
What do you want to offer to your customers, whatkindofserviceorproduct?Whichoftheirproblemsorneedsareyouaddressing?
Infrastructure and Organization
Key Resources
Which resources do you need to produce, market, cultivate,etc.customerrelations?
Key Activities
Which activities are necessary to produce, market, cultivate,etc.customerrelations?
Key Partners
Whoareyourmainpartnersandsuppliers?
Finances
Cost Structure
Whichfixedandvariablecostsmustbeconsidered?
Revenue Streams
Whatarecustomerswillingtopay? Howmuchdotheypayforalternatives?
Figure C10 | Sample Questions for Defining the Key Elements of a Business Model (Osterwalder, 2010)
To be able to answer these questions, it is recommended that market research and analysis be carried out . Talk to people who do similar business andaskthemtosharetheirexperiences.Talktopotentialclientsandfindoutwhat they think about your business idea, and what additional services or product features they would value . Market analysis also includes identifying

SUSTAINABLE ENERGY FOR FOOD – Massive Open Online Course – Reader
CHAPTER C | UNIT C3 | BUSINESS MODELS FOR PROJECTS IN THE ENERGY AGRICULTURE NEXUS 117
competitors and characteristics of potential customers, including their willing-nesstopay.Inaddition,youhavetofigureoutatwhatproductioncostsyouhaveandwhatprofitmargincanbereachedbysellingtheproductorservice.
Of course, macro-economic aspects also need to be considered – these have been presented in Unit C1 [» Unit C1], so that this Unit C3 will focus on hands-on knowledge of business models .
Different kinds of business models exist around the world, and new and innovative ones are being developed continuously, interdependent with mar-ket demand and companies’ attempts to increase their competitiveness . Youshouldbeawarethatthereisnosinglemodelthatfitsalltypesofbusi-ness.Youhavetodefineyourownmodelthatspecificallyfitsyourintendedeconomic activity .
Let us look at some examples for business ideas at the interface of energy and agriculture . You see market potential to sell dried fruits to the market for instance – hence, you decide to purchase a solar dryer . Using the business canvas(seeabove)youdefineyourtargetcustomersandyourvaluepropo-sition,analyzefinancestructuresandidentifykeypartners.
Another possibility is that you are already operating a business . Integrating a clean energy solution [» Unit B1.2] in your processes could be an option to increasetheenergy-efficiencyand/orproductivityofyourbusiness.Chang-ing processes might impact your business model, as aspects like cost struc-ture and key resources need to be adopted . For instance, if you replace the diesel generators of your irrigation system by a PV plant, you do not need to buy diesel anymore . Instead you have to consider the purchase and operat-ing costs of the PV plant . If you have not had an irrigation system before, the installation of a PV irrigation system [» Unit B1.2] will enhance your agricul-tural productivity . All these factors will of course affect your economic calcu-lations.Withthehelpofspecificeconomicmethodsthatwillbeexplainedinthis document, you can analyze whether such a clean energy solution is prof-itable for your agri-business, considering the costs as well as productivity gains .
Unit C3.1.2 | Definition of Financial TermsLetusstartwithsomefinancialtermsthatcommonlyoccurwhentalkingaboutbusinessmodels.Thefollowingtablecontainsbriefdefinitionsofrelevant terms (some were mentioned in Unit C2 [» Unit C2] of this MOOC reader) .
MORE TO LEARNDefine your own business model
TOOLS Tools that support you in developing a business model:
Boston Matrix: to support your deci-sions on which products you could invest in analysing their market share .
PEST(LE) (political, economic, social, technological, legal, and environmen-tal): the framework helps to analyze external macro environmental factors thatmightinfluenceyourbusiness.Results can be used for the SWOT Analysis .
SWOT Analysis (strengths, weak-nesses, opportunities, threats): for planning and marketing strategy . It helps you to analyze your internal business capabilities against the real-ities of the business environment, to lay the foundations for a successful business .

SUSTAINABLE ENERGY FOR FOOD – Massive Open Online Course – Reader
CHAPTER C | UNIT C3 | BUSINESS MODELS FOR PROJECTS IN THE ENERGY AGRICULTURE NEXUS 118
Term DefinitionDirect cost Costs that are directly related to the production of a particular service or good, e .g . material, labor, and
other expenses attributed to the production .Indirect cost Costs that arise but cannot be assigned to a particular produced good or service . They are necessary
to keep the business running . Examples are electricity, rent for buildings, plant maintenance, adminis-tration, etc .
Opportunity cost Value of the best alternative forgone, when choosing between several mutually exclusive alternatives givenlimitedresources.Itisthe'cost'incurredbylosingthebenefitsofthesecond-bestchoiceavailable.
Capital cost This is a one-time expense to set up a plant or project . For example, capital costs include purchasing land, buildings, machinery, and administrative expenses (e .g . for permits) . They can be paid by equity or by tak-ingaloanfromafinancialinstitution.Thelatterresultsincostofdebt.Thismeansthatinterestisaddedto the loan and has to be paid back in addition to the borrowed amount of money (see “Interest rate”) .
Interest rate / Interest It is basically the cost of borrowing money . This rate is usually given as an annual percentage of the total amount of the loan .
Profit Profit=totalrevenue–totalcosts.Profitscanbefurtherdividedintobeforeandaftertaxprofit.Revenue This is the income earned by a business typically through selling services or goods . Revenue = quantity
of items sold * retail priceCashflow Incomingandoutgoingcashofabusiness.Costsareconsideredasnegativecashflowsandrevenues
aspositiveones.Cashflowofoneperiod=revenuesoftheperiod–costsoftheperiodDiscount rate Thisrateisgenerallyusedtobringfuturecashflowstotheirmarketvalueatthepresenttime.It
expressesthepresentvalueoffuturecashflows.Itisanindicatorfortheriskinessofaninvestment.
Figure C11 | Definition of Common Financial Terms (FAO, 1995a; FAO, 1995b; FAO, 1998)
Unit C3.1.3 | Financial ProfitabilityToassessthefinancialprofitabilityofyourbusinessidea,youmustbeginbymaking several considerations and assumptions . Some examples of rele-vant questions (HCC, 2009):
• Whoarethepotentialcustomers?Whatisthemarketpotential(numberofpotentialclients,currentmarketprices,possiblefuturemarketprices)?Howtoaccessthismarket?
• Doyoupossessthenecessaryland,buildingsorotherthingsthatyouneed for your business idea or do you have to buy, rent or construct these assets?
• Doyouhaveaccesstocapitalfortherequiredinvestment(funding)ordoyouhavetotakealoantocovertheexpenses(fullyorpartly)?
• Arethereanytaxesorfeesthathavetobetakenintoconsideration?• Furtherfactorssuchascostandamount
Ingeneralafinancialanalysisfirstdefinestotalcostsandthendeterminestotal revenues . Subsequently you need to apply one or even more methods of capital budgeting (as described later in this document) . Additionally you should answer the questions in above to come up with a concrete business

SUSTAINABLE ENERGY FOR FOOD – Massive Open Online Course – Reader
CHAPTER C | UNIT C3 | BUSINESS MODELS FOR PROJECTS IN THE ENERGY AGRICULTURE NEXUS 119
model . Before discussing capital budgeting, let’s now take a look at the fol-lowingsimplifieddefinitions(HCC,2009):
• Cost=anythingthatdecreasesyourbusinessprofit• Benefit=anythingthatincreasesyourbusinessprofit
When calculating costs, costs should by divided into two categories (HCC, 2009):
• Capital expenditures (CAPEX): are one-time expenses . Normally they are long-term investments in non-consumable parts of the business, e .g . money that is spent on inventory .
• Operating expenses (OPEX): are the ongoing costs to run and maintain a business . They are the expenses of the business and they are divided into:- Fixed costs: are independent from the output of goods or services
generated by a business . They do not change during the production period . So these costs have to be paid even during periods when the business is not operating .
- Variable costs: vary with the change of the output/activity of an orga-nization . Consequently, they change during the production period .
The following illustration (Figure C12) shows the distribution of cost types . However, note that the points mentioned are only generalized examples and thusshouldberevisedforeachspecificproject.
Capital expenditures (CAPEX)
Operating expenses (OPEX)
preliminary (planning, legal fees and permits, land acquiring, etc .)
construction (excavation, buildings, etc .)
equipment (machinery, vehicles, etc .)
rental costs of buildings, insurance premi-ums, land taxes, principal and interest on loans, sometimes salaries, administrative costs, maintenance, etc .
costs for raw materials and packaging, supplies, material, fuel, repairs, utilities (electricity, water, . . .), sometimes salaries, advertising, etc .
Variable cost
Fixed cost
Figure C12 | Cost Types (HCC, 2009)
Cost

SUSTAINABLE ENERGY FOR FOOD – Massive Open Online Course – Reader
CHAPTER C | UNIT C3 | BUSINESS MODELS FOR PROJECTS IN THE ENERGY AGRICULTURE NEXUS 120
Unit C3.1.4 | Common Methods of Capital BudgetingMakingadecisiononacapitalinvestmentcanbedifficult,especiallyifahigh investment is required, if it is a long-term investment, or if several investment alternatives are available . However, using Capital Budgeting can support you in the decision-making process as it provides you with an over-view about eventual returns on investment . Through it you will discover if the investment is worth pursuing . A project is worth pursuing if it increases the valueofthecompany.Furthermore,ithelpsyoutoidentifythemostprofit-able investment options .
So let’s start with the theory of Capital Budgeting . First of all you should be awarethattherearetwoprincipalapproachestoassesstheprofitabilityofinvestment projects: the static and the dynamic approach . Both are subdi-vided into several methods . A common example of the static appraisal pro-cedure is payback time (PBT) . Examples of the dynamic appraisal procedure are net present value (NPV) and internal rate of return (IRR) methods . All of them can be used to compare several investment options as well as to assess one individual investment .
SinceyouhavelearnedabouttheseprofitabilityindicatorsalreadyinUnit C2 [» Unit C2],themostcommonmethodswillonlybepresentedbrieflyinthefollowing pages . The focus is on practical examples .
Payback Time (PBT)Thisstaticapproachisrecommendedtogetafirst,quickoverviewregardinginvestment options and / or when looking at very short periods between cashflows.
As explained, payback time is “the number of years required for the dis-counted sum of annual savings to equal the discounted investment costs, or in other words the time span until the investment will start to be paid back” . It allows a comparison of different investment options, as well as an evalua-tion of the risk of an investment . In general the investment option with the shortest payback period is the most favorable one . The method for calculat-
DEFINITION“Capital budgeting is the process in which a business determines and evaluates potential expenses or investments that are large in nature” Investopia
» Unit C2.2

SUSTAINABLE ENERGY FOR FOOD – Massive Open Online Course – Reader
S.169 AVERAGE METHOD: If annual repayment is constant over the project life time (meaning 𝐶𝐶𝐶𝐶1 = 𝐶𝐶𝐶𝐶2 = 𝐶𝐶𝐶𝐶𝑛𝑛):
𝑃𝑃𝑃𝑃 = 𝐼𝐼0𝐶𝐶𝐶𝐶1
CUMULATIVE METHOD: If the annual repayments fluctuate, the payback time is determined by adding up the annual repayments until their sum equals the initial investment 𝐼𝐼0:
∑(𝐶𝐶𝐶𝐶1 + 𝐶𝐶𝐶𝐶2 + 𝐶𝐶𝐶𝐶3 + ⋯ ) = 𝐼𝐼0
𝐶𝐶𝐶𝐶𝑡𝑡 = 𝑅𝑅𝑡𝑡 − 𝐶𝐶𝑡𝑡
𝐶𝐶𝐶𝐶𝑡𝑡 = 𝐶𝐶𝐶𝐶𝐶𝐶ℎ 𝐶𝐶𝑓𝑓𝑓𝑓𝑓𝑓 𝑖𝑖𝑖𝑖 𝑦𝑦𝑦𝑦𝐶𝐶𝑦𝑦 𝑡𝑡 𝐼𝐼0 = 𝐼𝐼𝑖𝑖𝑖𝑖𝑡𝑡𝑖𝑖𝐶𝐶𝑓𝑓 𝑖𝑖𝑖𝑖𝑖𝑖𝑦𝑦𝐶𝐶𝑡𝑡𝑖𝑖𝑦𝑦𝑖𝑖𝑡𝑡 𝑐𝑐𝑓𝑓𝐶𝐶𝑡𝑡 𝑅𝑅𝑡𝑡 = 𝑅𝑅𝑦𝑦𝑖𝑖𝑦𝑦𝑖𝑖𝑅𝑅𝑦𝑦𝐶𝐶 𝑖𝑖𝑖𝑖 𝑦𝑦𝑦𝑦𝐶𝐶𝑦𝑦 𝑡𝑡 𝐶𝐶𝑡𝑡 = 𝐶𝐶𝑓𝑓𝐶𝐶𝑡𝑡𝐶𝐶 𝑖𝑖𝑖𝑖 𝑦𝑦𝑦𝑦𝐶𝐶𝑦𝑦 𝑡𝑡
S.171
𝑁𝑁𝑃𝑃𝑁𝑁 = ∑ 𝐶𝐶𝐶𝐶𝑡𝑡(1 + 𝑦𝑦)𝑡𝑡 − 𝐼𝐼0 + 𝑆𝑆
𝑛𝑛
𝑡𝑡=1
NPV EQUATION
𝑁𝑁𝑃𝑃𝑁𝑁 = ∑ 𝑅𝑅𝑡𝑡(1 + 𝑖𝑖)𝑡𝑡 + 𝑅𝑅0
𝑁𝑁
𝑡𝑡=0
𝑅𝑅𝑡𝑡 = 𝑆𝑆𝑅𝑅𝑖𝑖 𝑓𝑓𝐶𝐶 𝐶𝐶𝑓𝑓𝑓𝑓 𝑡𝑡ℎ𝑦𝑦 𝑑𝑑𝑖𝑖𝐶𝐶𝑐𝑐𝑓𝑓𝑅𝑅𝑖𝑖𝑡𝑡𝑦𝑦𝑑𝑑 𝐶𝐶𝑅𝑅𝑡𝑡𝑅𝑅𝑦𝑦𝑦𝑦 𝑐𝑐𝐶𝐶𝐶𝐶ℎ 𝐶𝐶𝑓𝑓𝑓𝑓𝑓𝑓𝐶𝐶 𝑅𝑅0 = (𝑁𝑁𝑦𝑦𝑁𝑁𝐶𝐶𝑡𝑡𝑖𝑖𝑖𝑖𝑦𝑦) 𝑐𝑐𝐶𝐶𝐶𝐶ℎ 𝐶𝐶𝑓𝑓𝑓𝑓𝑓𝑓 𝐶𝐶𝑡𝑡 𝑡𝑡𝑖𝑖𝑖𝑖𝑦𝑦 𝑧𝑧𝑦𝑦𝑦𝑦𝑓𝑓, 𝑦𝑦𝑦𝑦𝑟𝑟𝑦𝑦𝑦𝑦𝐶𝐶𝑦𝑦𝑖𝑖𝑡𝑡𝑖𝑖𝑖𝑖𝑁𝑁 𝑡𝑡ℎ𝑦𝑦 𝑖𝑖𝑖𝑖𝑖𝑖𝑡𝑡𝑖𝑖𝐶𝐶𝑓𝑓 𝑖𝑖𝑖𝑖𝑖𝑖𝑦𝑦𝐶𝐶𝑡𝑡𝑖𝑖𝑦𝑦𝑖𝑖𝑡𝑡
𝑡𝑡 = 𝑇𝑇𝑖𝑖𝑖𝑖𝑦𝑦 𝑓𝑓𝐶𝐶 𝑡𝑡ℎ𝑦𝑦 𝑐𝑐𝐶𝐶𝐶𝐶ℎ 𝐶𝐶𝑓𝑓𝑓𝑓𝑓𝑓, 𝑑𝑑𝑦𝑦𝑟𝑟𝑦𝑦𝑖𝑖𝑑𝑑𝑖𝑖𝑖𝑖𝑁𝑁 𝑓𝑓𝑖𝑖 𝑡𝑡ℎ𝑦𝑦 𝑟𝑟𝑦𝑦𝑓𝑓𝑝𝑝𝑦𝑦𝑐𝑐𝑡𝑡 𝑓𝑓𝑖𝑖𝐶𝐶𝑦𝑦𝑡𝑡𝑖𝑖𝑖𝑖𝑦𝑦 𝑖𝑖 = 𝐷𝐷𝑖𝑖𝐶𝐶𝑐𝑐𝑓𝑓𝑅𝑅𝑖𝑖𝑡𝑡 𝑦𝑦𝐶𝐶𝑡𝑡𝑦𝑦 𝑓𝑓𝑦𝑦 𝑦𝑦𝐶𝐶𝑡𝑡𝑦𝑦 𝑓𝑓𝐶𝐶 𝑦𝑦𝑦𝑦𝑡𝑡𝑅𝑅𝑦𝑦𝑖𝑖
CHAPTER C | UNIT C3 | BUSINESS MODELS FOR PROJECTS IN THE ENERGY AGRICULTURE NEXUS 121
ing the payback period differs depending on the type of annual repayment (Rudolf, 2008):
AVERAGE METHOD:If annual repayment is constant over the project life time (meaning Cf1= Cf2= Cfn ):
S.169 AVERAGE METHOD: If annual repayment is constant over the project life time (meaning 𝐶𝐶𝐶𝐶1 = 𝐶𝐶𝐶𝐶2 = 𝐶𝐶𝐶𝐶𝑛𝑛):
𝑃𝑃𝑃𝑃 = 𝐼𝐼0𝐶𝐶𝐶𝐶1
CUMULATIVE METHOD: If the annual repayments fluctuate, the payback time is determined by adding up the annual repayments until their sum equals the initial investment 𝐼𝐼0:
∑(𝐶𝐶𝐶𝐶1 + 𝐶𝐶𝐶𝐶2 + 𝐶𝐶𝐶𝐶3 + ⋯ ) = 𝐼𝐼0
𝐶𝐶𝐶𝐶𝑡𝑡 = 𝑅𝑅𝑡𝑡 − 𝐶𝐶𝑡𝑡
𝐶𝐶𝐶𝐶𝑡𝑡 = 𝐶𝐶𝐶𝐶𝐶𝐶ℎ 𝐶𝐶𝑓𝑓𝑓𝑓𝑓𝑓 𝑖𝑖𝑖𝑖 𝑦𝑦𝑦𝑦𝐶𝐶𝑦𝑦 𝑡𝑡 𝐼𝐼0 = 𝐼𝐼𝑖𝑖𝑖𝑖𝑡𝑡𝑖𝑖𝐶𝐶𝑓𝑓 𝑖𝑖𝑖𝑖𝑖𝑖𝑦𝑦𝐶𝐶𝑡𝑡𝑖𝑖𝑦𝑦𝑖𝑖𝑡𝑡 𝑐𝑐𝑓𝑓𝐶𝐶𝑡𝑡 𝑅𝑅𝑡𝑡 = 𝑅𝑅𝑦𝑦𝑖𝑖𝑦𝑦𝑖𝑖𝑅𝑅𝑦𝑦𝐶𝐶 𝑖𝑖𝑖𝑖 𝑦𝑦𝑦𝑦𝐶𝐶𝑦𝑦 𝑡𝑡 𝐶𝐶𝑡𝑡 = 𝐶𝐶𝑓𝑓𝐶𝐶𝑡𝑡𝐶𝐶 𝑖𝑖𝑖𝑖 𝑦𝑦𝑦𝑦𝐶𝐶𝑦𝑦 𝑡𝑡
S.171
𝑁𝑁𝑃𝑃𝑁𝑁 = ∑ 𝐶𝐶𝐶𝐶𝑡𝑡(1 + 𝑦𝑦)𝑡𝑡 − 𝐼𝐼0 + 𝑆𝑆
𝑛𝑛
𝑡𝑡=1
NPV EQUATION
𝑁𝑁𝑃𝑃𝑁𝑁 = ∑ 𝑅𝑅𝑡𝑡(1 + 𝑖𝑖)𝑡𝑡 + 𝑅𝑅0
𝑁𝑁
𝑡𝑡=0
𝑅𝑅𝑡𝑡 = 𝑆𝑆𝑅𝑅𝑖𝑖 𝑓𝑓𝐶𝐶 𝐶𝐶𝑓𝑓𝑓𝑓 𝑡𝑡ℎ𝑦𝑦 𝑑𝑑𝑖𝑖𝐶𝐶𝑐𝑐𝑓𝑓𝑅𝑅𝑖𝑖𝑡𝑡𝑦𝑦𝑑𝑑 𝐶𝐶𝑅𝑅𝑡𝑡𝑅𝑅𝑦𝑦𝑦𝑦 𝑐𝑐𝐶𝐶𝐶𝐶ℎ 𝐶𝐶𝑓𝑓𝑓𝑓𝑓𝑓𝐶𝐶 𝑅𝑅0 = (𝑁𝑁𝑦𝑦𝑁𝑁𝐶𝐶𝑡𝑡𝑖𝑖𝑖𝑖𝑦𝑦) 𝑐𝑐𝐶𝐶𝐶𝐶ℎ 𝐶𝐶𝑓𝑓𝑓𝑓𝑓𝑓 𝐶𝐶𝑡𝑡 𝑡𝑡𝑖𝑖𝑖𝑖𝑦𝑦 𝑧𝑧𝑦𝑦𝑦𝑦𝑓𝑓, 𝑦𝑦𝑦𝑦𝑟𝑟𝑦𝑦𝑦𝑦𝐶𝐶𝑦𝑦𝑖𝑖𝑡𝑡𝑖𝑖𝑖𝑖𝑁𝑁 𝑡𝑡ℎ𝑦𝑦 𝑖𝑖𝑖𝑖𝑖𝑖𝑡𝑡𝑖𝑖𝐶𝐶𝑓𝑓 𝑖𝑖𝑖𝑖𝑖𝑖𝑦𝑦𝐶𝐶𝑡𝑡𝑖𝑖𝑦𝑦𝑖𝑖𝑡𝑡
𝑡𝑡 = 𝑇𝑇𝑖𝑖𝑖𝑖𝑦𝑦 𝑓𝑓𝐶𝐶 𝑡𝑡ℎ𝑦𝑦 𝑐𝑐𝐶𝐶𝐶𝐶ℎ 𝐶𝐶𝑓𝑓𝑓𝑓𝑓𝑓, 𝑑𝑑𝑦𝑦𝑟𝑟𝑦𝑦𝑖𝑖𝑑𝑑𝑖𝑖𝑖𝑖𝑁𝑁 𝑓𝑓𝑖𝑖 𝑡𝑡ℎ𝑦𝑦 𝑟𝑟𝑦𝑦𝑓𝑓𝑝𝑝𝑦𝑦𝑐𝑐𝑡𝑡 𝑓𝑓𝑖𝑖𝐶𝐶𝑦𝑦𝑡𝑡𝑖𝑖𝑖𝑖𝑦𝑦 𝑖𝑖 = 𝐷𝐷𝑖𝑖𝐶𝐶𝑐𝑐𝑓𝑓𝑅𝑅𝑖𝑖𝑡𝑡 𝑦𝑦𝐶𝐶𝑡𝑡𝑦𝑦 𝑓𝑓𝑦𝑦 𝑦𝑦𝐶𝐶𝑡𝑡𝑦𝑦 𝑓𝑓𝐶𝐶 𝑦𝑦𝑦𝑦𝑡𝑡𝑅𝑅𝑦𝑦𝑖𝑖
Cft =CashflowinyeartI0 = Initial investment costRt = Revenues in year tCt = Costs in year t
Thismethodisusefulforafirstimpressionaboutinvestmentoptions,aswellas for ranking different investment options . However, you should not base your investment decision only on the result of the payback time method since it doesnotincludecashflowsafterthepaybackperiod.Italsodoesnotconsiderthe value of cash flows over time . It is highly recommended to further assess promising investment options by using methods of the Dynamic Approach .
Net Present Value (NPV) [» Unit C2.2]An important point to consider especially for long-term investments is the time value of money, meaning that the value of money changes with time . In simple terms, one Euro today is worth more than one Euro tomorrow . The argument being that the money could be invested and generate interest . This aspect is considered by the dynamic approach (Rudolf, 2008) . Consequently, future pay-ments and revenues have to be discounted if they occur after the base year (in
CLOSE-UPDynamic Approach
d=1/(1+r)
ExampleLet’scalculatePBTforasimplifiedexampleofahouseholdsizebiogasplant . Assume an initial investment of 600 €, annual operating expenses of 20 €, and an annual revenue of 170 € (pseudo-income equivalent to avoidpaymentforLiquefiedPetroleumGas(LPG),assumingthehouse-hold had been cooking with LPG and biogas would replace it) . As you havethesamecashfloweachyear,youcanusetheaverage method .
Annual cash flow: Cf = 170 € - 20 € = 150 €
Payback: PBT = 600 € /150 € = 4 years .
Therefore, your initial investment will be recovered after 4 years . After this timeyouwillmakeaprofit(assumingtheannualcashflowsstaysthesame).
S.169 AVERAGE METHOD: If annual repayment is constant over the project life time (meaning 𝐶𝐶𝐶𝐶1 = 𝐶𝐶𝐶𝐶2 = 𝐶𝐶𝐶𝐶𝑛𝑛):
𝑃𝑃𝑃𝑃 = 𝐼𝐼0𝐶𝐶𝐶𝐶1
CUMULATIVE METHOD: If the annual repayments fluctuate, the payback time is determined by adding up the annual repayments until their sum equals the initial investment 𝐼𝐼0:
∑(𝐶𝐶𝐶𝐶1 + 𝐶𝐶𝐶𝐶2 + 𝐶𝐶𝐶𝐶3 + ⋯ ) = 𝐼𝐼0
𝐶𝐶𝐶𝐶𝑡𝑡 = 𝑅𝑅𝑡𝑡 − 𝐶𝐶𝑡𝑡
𝐶𝐶𝐶𝐶𝑡𝑡 = 𝐶𝐶𝐶𝐶𝐶𝐶ℎ 𝐶𝐶𝑓𝑓𝑓𝑓𝑓𝑓 𝑖𝑖𝑖𝑖 𝑦𝑦𝑦𝑦𝐶𝐶𝑦𝑦 𝑡𝑡 𝐼𝐼0 = 𝐼𝐼𝑖𝑖𝑖𝑖𝑡𝑡𝑖𝑖𝐶𝐶𝑓𝑓 𝑖𝑖𝑖𝑖𝑖𝑖𝑦𝑦𝐶𝐶𝑡𝑡𝑖𝑖𝑦𝑦𝑖𝑖𝑡𝑡 𝑐𝑐𝑓𝑓𝐶𝐶𝑡𝑡 𝑅𝑅𝑡𝑡 = 𝑅𝑅𝑦𝑦𝑖𝑖𝑦𝑦𝑖𝑖𝑅𝑅𝑦𝑦𝐶𝐶 𝑖𝑖𝑖𝑖 𝑦𝑦𝑦𝑦𝐶𝐶𝑦𝑦 𝑡𝑡 𝐶𝐶𝑡𝑡 = 𝐶𝐶𝑓𝑓𝐶𝐶𝑡𝑡𝐶𝐶 𝑖𝑖𝑖𝑖 𝑦𝑦𝑦𝑦𝐶𝐶𝑦𝑦 𝑡𝑡
S.171
𝑁𝑁𝑃𝑃𝑁𝑁 = ∑ 𝐶𝐶𝐶𝐶𝑡𝑡(1 + 𝑦𝑦)𝑡𝑡 − 𝐼𝐼0 + 𝑆𝑆
𝑛𝑛
𝑡𝑡=1
NPV EQUATION
𝑁𝑁𝑃𝑃𝑁𝑁 = ∑ 𝑅𝑅𝑡𝑡(1 + 𝑖𝑖)𝑡𝑡 + 𝑅𝑅0
𝑁𝑁
𝑡𝑡=0
𝑅𝑅𝑡𝑡 = 𝑆𝑆𝑅𝑅𝑖𝑖 𝑓𝑓𝐶𝐶 𝐶𝐶𝑓𝑓𝑓𝑓 𝑡𝑡ℎ𝑦𝑦 𝑑𝑑𝑖𝑖𝐶𝐶𝑐𝑐𝑓𝑓𝑅𝑅𝑖𝑖𝑡𝑡𝑦𝑦𝑑𝑑 𝐶𝐶𝑅𝑅𝑡𝑡𝑅𝑅𝑦𝑦𝑦𝑦 𝑐𝑐𝐶𝐶𝐶𝐶ℎ 𝐶𝐶𝑓𝑓𝑓𝑓𝑓𝑓𝐶𝐶 𝑅𝑅0 = (𝑁𝑁𝑦𝑦𝑁𝑁𝐶𝐶𝑡𝑡𝑖𝑖𝑖𝑖𝑦𝑦) 𝑐𝑐𝐶𝐶𝐶𝐶ℎ 𝐶𝐶𝑓𝑓𝑓𝑓𝑓𝑓 𝐶𝐶𝑡𝑡 𝑡𝑡𝑖𝑖𝑖𝑖𝑦𝑦 𝑧𝑧𝑦𝑦𝑦𝑦𝑓𝑓, 𝑦𝑦𝑦𝑦𝑟𝑟𝑦𝑦𝑦𝑦𝐶𝐶𝑦𝑦𝑖𝑖𝑡𝑡𝑖𝑖𝑖𝑖𝑁𝑁 𝑡𝑡ℎ𝑦𝑦 𝑖𝑖𝑖𝑖𝑖𝑖𝑡𝑡𝑖𝑖𝐶𝐶𝑓𝑓 𝑖𝑖𝑖𝑖𝑖𝑖𝑦𝑦𝐶𝐶𝑡𝑡𝑖𝑖𝑦𝑦𝑖𝑖𝑡𝑡
𝑡𝑡 = 𝑇𝑇𝑖𝑖𝑖𝑖𝑦𝑦 𝑓𝑓𝐶𝐶 𝑡𝑡ℎ𝑦𝑦 𝑐𝑐𝐶𝐶𝐶𝐶ℎ 𝐶𝐶𝑓𝑓𝑓𝑓𝑓𝑓, 𝑑𝑑𝑦𝑦𝑟𝑟𝑦𝑦𝑖𝑖𝑑𝑑𝑖𝑖𝑖𝑖𝑁𝑁 𝑓𝑓𝑖𝑖 𝑡𝑡ℎ𝑦𝑦 𝑟𝑟𝑦𝑦𝑓𝑓𝑝𝑝𝑦𝑦𝑐𝑐𝑡𝑡 𝑓𝑓𝑖𝑖𝐶𝐶𝑦𝑦𝑡𝑡𝑖𝑖𝑖𝑖𝑦𝑦 𝑖𝑖 = 𝐷𝐷𝑖𝑖𝐶𝐶𝑐𝑐𝑓𝑓𝑅𝑅𝑖𝑖𝑡𝑡 𝑦𝑦𝐶𝐶𝑡𝑡𝑦𝑦 𝑓𝑓𝑦𝑦 𝑦𝑦𝐶𝐶𝑡𝑡𝑦𝑦 𝑓𝑓𝐶𝐶 𝑦𝑦𝑦𝑦𝑡𝑡𝑅𝑅𝑦𝑦𝑖𝑖
CUMULATIVE METHOD:Iftheannualrepaymentsfluctuate,thepaybacktimeisdeterminedbyaddingup the annual repayments until their sum equals the initial investment I0 :
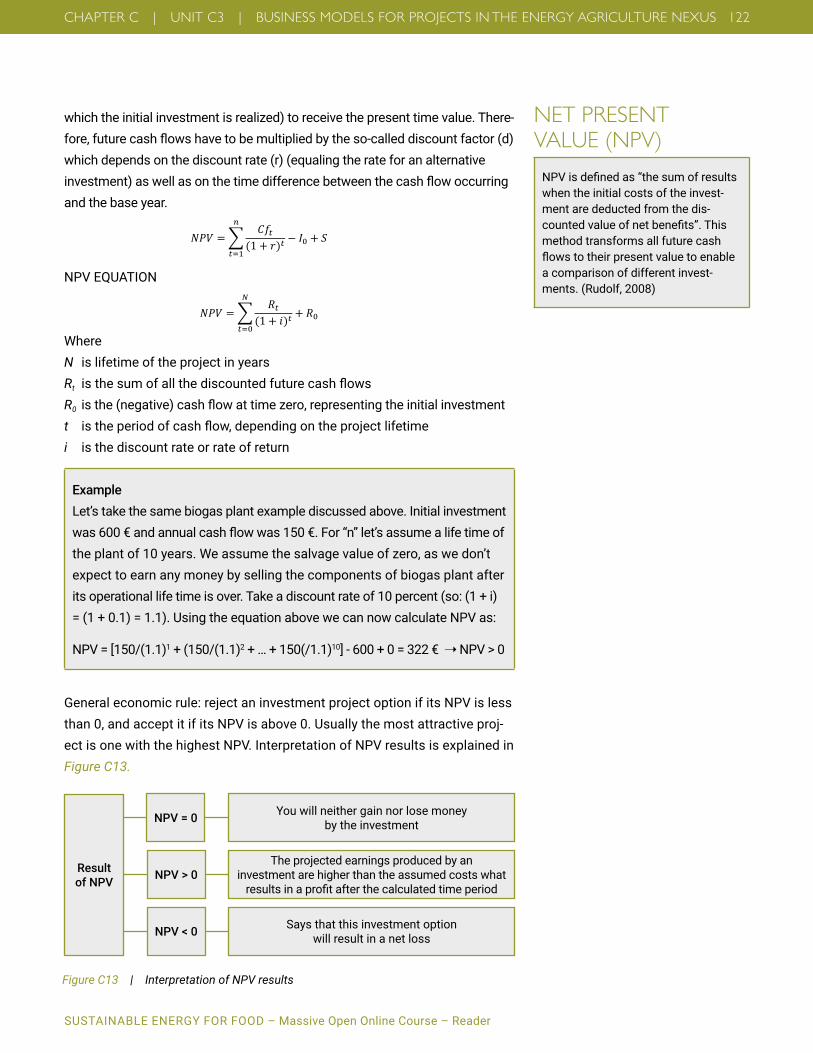
SUSTAINABLE ENERGY FOR FOOD – Massive Open Online Course – Reader
CHAPTER C | UNIT C3 | BUSINESS MODELS FOR PROJECTS IN THE ENERGY AGRICULTURE NEXUS 122
which the initial investment is realized) to receive the present time value . There-fore,futurecashflowshavetobemultipliedbytheso-calleddiscountfactor(d)which depends on the discount rate (r) (equaling the rate for an alternative investment)aswellasonthetimedifferencebetweenthecashflowoccurringand the base year .
NET PRESENT VALUE (NPV) NPVisdefinedas“thesumofresultswhen the initial costs of the invest-ment are deducted from the dis-countedvalueofnetbenefits”.Thismethod transforms all future cash flowstotheirpresentvaluetoenablea comparison of different invest-ments . (Rudolf, 2008)
S.169 AVERAGE METHOD: If annual repayment is constant over the project life time (meaning 𝐶𝐶𝐶𝐶1 = 𝐶𝐶𝐶𝐶2 = 𝐶𝐶𝐶𝐶𝑛𝑛):
𝑃𝑃𝑃𝑃 = 𝐼𝐼0𝐶𝐶𝐶𝐶1
CUMULATIVE METHOD: If the annual repayments fluctuate, the payback time is determined by adding up the annual repayments until their sum equals the initial investment 𝐼𝐼0:
∑(𝐶𝐶𝐶𝐶1 + 𝐶𝐶𝐶𝐶2 + 𝐶𝐶𝐶𝐶3 + ⋯ ) = 𝐼𝐼0
𝐶𝐶𝐶𝐶𝑡𝑡 = 𝑅𝑅𝑡𝑡 − 𝐶𝐶𝑡𝑡
𝐶𝐶𝐶𝐶𝑡𝑡 = 𝐶𝐶𝐶𝐶𝐶𝐶ℎ 𝐶𝐶𝑓𝑓𝑓𝑓𝑓𝑓 𝑖𝑖𝑖𝑖 𝑦𝑦𝑦𝑦𝐶𝐶𝑦𝑦 𝑡𝑡 𝐼𝐼0 = 𝐼𝐼𝑖𝑖𝑖𝑖𝑡𝑡𝑖𝑖𝐶𝐶𝑓𝑓 𝑖𝑖𝑖𝑖𝑖𝑖𝑦𝑦𝐶𝐶𝑡𝑡𝑖𝑖𝑦𝑦𝑖𝑖𝑡𝑡 𝑐𝑐𝑓𝑓𝐶𝐶𝑡𝑡 𝑅𝑅𝑡𝑡 = 𝑅𝑅𝑦𝑦𝑖𝑖𝑦𝑦𝑖𝑖𝑅𝑅𝑦𝑦𝐶𝐶 𝑖𝑖𝑖𝑖 𝑦𝑦𝑦𝑦𝐶𝐶𝑦𝑦 𝑡𝑡 𝐶𝐶𝑡𝑡 = 𝐶𝐶𝑓𝑓𝐶𝐶𝑡𝑡𝐶𝐶 𝑖𝑖𝑖𝑖 𝑦𝑦𝑦𝑦𝐶𝐶𝑦𝑦 𝑡𝑡
S.171
𝑁𝑁𝑃𝑃𝑁𝑁 = ∑ 𝐶𝐶𝐶𝐶𝑡𝑡(1 + 𝑦𝑦)𝑡𝑡 − 𝐼𝐼0 + 𝑆𝑆
𝑛𝑛
𝑡𝑡=1
NPV EQUATION
𝑁𝑁𝑃𝑃𝑁𝑁 = ∑ 𝑅𝑅𝑡𝑡(1 + 𝑖𝑖)𝑡𝑡 + 𝑅𝑅0
𝑁𝑁
𝑡𝑡=0
𝑅𝑅𝑡𝑡 = 𝑆𝑆𝑅𝑅𝑖𝑖 𝑓𝑓𝐶𝐶 𝐶𝐶𝑓𝑓𝑓𝑓 𝑡𝑡ℎ𝑦𝑦 𝑑𝑑𝑖𝑖𝐶𝐶𝑐𝑐𝑓𝑓𝑅𝑅𝑖𝑖𝑡𝑡𝑦𝑦𝑑𝑑 𝐶𝐶𝑅𝑅𝑡𝑡𝑅𝑅𝑦𝑦𝑦𝑦 𝑐𝑐𝐶𝐶𝐶𝐶ℎ 𝐶𝐶𝑓𝑓𝑓𝑓𝑓𝑓𝐶𝐶 𝑅𝑅0 = (𝑁𝑁𝑦𝑦𝑁𝑁𝐶𝐶𝑡𝑡𝑖𝑖𝑖𝑖𝑦𝑦) 𝑐𝑐𝐶𝐶𝐶𝐶ℎ 𝐶𝐶𝑓𝑓𝑓𝑓𝑓𝑓 𝐶𝐶𝑡𝑡 𝑡𝑡𝑖𝑖𝑖𝑖𝑦𝑦 𝑧𝑧𝑦𝑦𝑦𝑦𝑓𝑓, 𝑦𝑦𝑦𝑦𝑟𝑟𝑦𝑦𝑦𝑦𝐶𝐶𝑦𝑦𝑖𝑖𝑡𝑡𝑖𝑖𝑖𝑖𝑁𝑁 𝑡𝑡ℎ𝑦𝑦 𝑖𝑖𝑖𝑖𝑖𝑖𝑡𝑡𝑖𝑖𝐶𝐶𝑓𝑓 𝑖𝑖𝑖𝑖𝑖𝑖𝑦𝑦𝐶𝐶𝑡𝑡𝑖𝑖𝑦𝑦𝑖𝑖𝑡𝑡
𝑡𝑡 = 𝑇𝑇𝑖𝑖𝑖𝑖𝑦𝑦 𝑓𝑓𝐶𝐶 𝑡𝑡ℎ𝑦𝑦 𝑐𝑐𝐶𝐶𝐶𝐶ℎ 𝐶𝐶𝑓𝑓𝑓𝑓𝑓𝑓, 𝑑𝑑𝑦𝑦𝑟𝑟𝑦𝑦𝑖𝑖𝑑𝑑𝑖𝑖𝑖𝑖𝑁𝑁 𝑓𝑓𝑖𝑖 𝑡𝑡ℎ𝑦𝑦 𝑟𝑟𝑦𝑦𝑓𝑓𝑝𝑝𝑦𝑦𝑐𝑐𝑡𝑡 𝑓𝑓𝑖𝑖𝐶𝐶𝑦𝑦𝑡𝑡𝑖𝑖𝑖𝑖𝑦𝑦 𝑖𝑖 = 𝐷𝐷𝑖𝑖𝐶𝐶𝑐𝑐𝑓𝑓𝑅𝑅𝑖𝑖𝑡𝑡 𝑦𝑦𝐶𝐶𝑡𝑡𝑦𝑦 𝑓𝑓𝑦𝑦 𝑦𝑦𝐶𝐶𝑡𝑡𝑦𝑦 𝑓𝑓𝐶𝐶 𝑦𝑦𝑦𝑦𝑡𝑡𝑅𝑅𝑦𝑦𝑖𝑖
WhereN is lifetime of the project in yearsRt isthesumofallthediscountedfuturecashflowsR0 isthe(negative)cashflowattimezero,representingtheinitialinvestmentt istheperiodofcashflow,dependingontheprojectlifetimei is the discount rate or rate of return
General economic rule: reject an investment project option if its NPV is less than 0, and accept it if its NPV is above 0 . Usually the most attractive proj-ect is one with the highest NPV . Interpretation of NPV results is explained in Figure C13.
S.169 AVERAGE METHOD: If annual repayment is constant over the project life time (meaning 𝐶𝐶𝐶𝐶1 = 𝐶𝐶𝐶𝐶2 = 𝐶𝐶𝐶𝐶𝑛𝑛):
𝑃𝑃𝑃𝑃 = 𝐼𝐼0𝐶𝐶𝐶𝐶1
CUMULATIVE METHOD: If the annual repayments fluctuate, the payback time is determined by adding up the annual repayments until their sum equals the initial investment 𝐼𝐼0:
∑(𝐶𝐶𝐶𝐶1 + 𝐶𝐶𝐶𝐶2 + 𝐶𝐶𝐶𝐶3 + ⋯ ) = 𝐼𝐼0
𝐶𝐶𝐶𝐶𝑡𝑡 = 𝑅𝑅𝑡𝑡 − 𝐶𝐶𝑡𝑡
𝐶𝐶𝐶𝐶𝑡𝑡 = 𝐶𝐶𝐶𝐶𝐶𝐶ℎ 𝐶𝐶𝑓𝑓𝑓𝑓𝑓𝑓 𝑖𝑖𝑖𝑖 𝑦𝑦𝑦𝑦𝐶𝐶𝑦𝑦 𝑡𝑡 𝐼𝐼0 = 𝐼𝐼𝑖𝑖𝑖𝑖𝑡𝑡𝑖𝑖𝐶𝐶𝑓𝑓 𝑖𝑖𝑖𝑖𝑖𝑖𝑦𝑦𝐶𝐶𝑡𝑡𝑖𝑖𝑦𝑦𝑖𝑖𝑡𝑡 𝑐𝑐𝑓𝑓𝐶𝐶𝑡𝑡 𝑅𝑅𝑡𝑡 = 𝑅𝑅𝑦𝑦𝑖𝑖𝑦𝑦𝑖𝑖𝑅𝑅𝑦𝑦𝐶𝐶 𝑖𝑖𝑖𝑖 𝑦𝑦𝑦𝑦𝐶𝐶𝑦𝑦 𝑡𝑡 𝐶𝐶𝑡𝑡 = 𝐶𝐶𝑓𝑓𝐶𝐶𝑡𝑡𝐶𝐶 𝑖𝑖𝑖𝑖 𝑦𝑦𝑦𝑦𝐶𝐶𝑦𝑦 𝑡𝑡
S.171
𝑁𝑁𝑃𝑃𝑁𝑁 = ∑ 𝐶𝐶𝐶𝐶𝑡𝑡(1 + 𝑦𝑦)𝑡𝑡 − 𝐼𝐼0 + 𝑆𝑆
𝑛𝑛
𝑡𝑡=1
NPV EQUATION
𝑁𝑁𝑃𝑃𝑁𝑁 = ∑ 𝑅𝑅𝑡𝑡(1 + 𝑖𝑖)𝑡𝑡 + 𝑅𝑅0
𝑁𝑁
𝑡𝑡=0
𝑅𝑅𝑡𝑡 = 𝑆𝑆𝑅𝑅𝑖𝑖 𝑓𝑓𝐶𝐶 𝐶𝐶𝑓𝑓𝑓𝑓 𝑡𝑡ℎ𝑦𝑦 𝑑𝑑𝑖𝑖𝐶𝐶𝑐𝑐𝑓𝑓𝑅𝑅𝑖𝑖𝑡𝑡𝑦𝑦𝑑𝑑 𝐶𝐶𝑅𝑅𝑡𝑡𝑅𝑅𝑦𝑦𝑦𝑦 𝑐𝑐𝐶𝐶𝐶𝐶ℎ 𝐶𝐶𝑓𝑓𝑓𝑓𝑓𝑓𝐶𝐶 𝑅𝑅0 = (𝑁𝑁𝑦𝑦𝑁𝑁𝐶𝐶𝑡𝑡𝑖𝑖𝑖𝑖𝑦𝑦) 𝑐𝑐𝐶𝐶𝐶𝐶ℎ 𝐶𝐶𝑓𝑓𝑓𝑓𝑓𝑓 𝐶𝐶𝑡𝑡 𝑡𝑡𝑖𝑖𝑖𝑖𝑦𝑦 𝑧𝑧𝑦𝑦𝑦𝑦𝑓𝑓, 𝑦𝑦𝑦𝑦𝑟𝑟𝑦𝑦𝑦𝑦𝐶𝐶𝑦𝑦𝑖𝑖𝑡𝑡𝑖𝑖𝑖𝑖𝑁𝑁 𝑡𝑡ℎ𝑦𝑦 𝑖𝑖𝑖𝑖𝑖𝑖𝑡𝑡𝑖𝑖𝐶𝐶𝑓𝑓 𝑖𝑖𝑖𝑖𝑖𝑖𝑦𝑦𝐶𝐶𝑡𝑡𝑖𝑖𝑦𝑦𝑖𝑖𝑡𝑡
𝑡𝑡 = 𝑇𝑇𝑖𝑖𝑖𝑖𝑦𝑦 𝑓𝑓𝐶𝐶 𝑡𝑡ℎ𝑦𝑦 𝑐𝑐𝐶𝐶𝐶𝐶ℎ 𝐶𝐶𝑓𝑓𝑓𝑓𝑓𝑓, 𝑑𝑑𝑦𝑦𝑟𝑟𝑦𝑦𝑖𝑖𝑑𝑑𝑖𝑖𝑖𝑖𝑁𝑁 𝑓𝑓𝑖𝑖 𝑡𝑡ℎ𝑦𝑦 𝑟𝑟𝑦𝑦𝑓𝑓𝑝𝑝𝑦𝑦𝑐𝑐𝑡𝑡 𝑓𝑓𝑖𝑖𝐶𝐶𝑦𝑦𝑡𝑡𝑖𝑖𝑖𝑖𝑦𝑦 𝑖𝑖 = 𝐷𝐷𝑖𝑖𝐶𝐶𝑐𝑐𝑓𝑓𝑅𝑅𝑖𝑖𝑡𝑡 𝑦𝑦𝐶𝐶𝑡𝑡𝑦𝑦 𝑓𝑓𝑦𝑦 𝑦𝑦𝐶𝐶𝑡𝑡𝑦𝑦 𝑓𝑓𝐶𝐶 𝑦𝑦𝑦𝑦𝑡𝑡𝑅𝑅𝑦𝑦𝑖𝑖
You will neither gain nor lose money by the investment
The projected earnings produced by an investment are higher than the assumed costs what resultsinaprofitafterthecalculatedtimeperiod
Says that this investment option will result in a net lossNPV < 0
NPV > 0
NPV = 0
Result of NPV
Figure C13 | Interpretation of NPV results
NPV EQUATION
ExampleLet’s take the same biogas plant example discussed above . Initial investment was600€andannualcashflowwas150€.For“n”let’sassumealifetimeofthe plant of 10 years . We assume the salvage value of zero, as we don’t expect to earn any money by selling the components of biogas plant after its operational life time is over . Take a discount rate of 10 percent (so: (1 + i) = (1 + 0 .1) = 1 .1) . Using the equation above we can now calculate NPV as:
NPV = [150/(1 .1)1 + (150/(1 .1)2 + … + 150(/1 .1)10] - 600 + 0 = 322 € ➝NPV>0

SUSTAINABLE ENERGY FOR FOOD – Massive Open Online Course – Reader
CHAPTER C | UNIT C3 | BUSINESS MODELS FOR PROJECTS IN THE ENERGY AGRICULTURE NEXUS 123
Internal Rate of Return (IRR)AsdescribedinChapterC2,theIRRindicatorisdefinedas“thediscountrateat which NPV equals zero” . The IRR gives you an answer to the question how much you get in return for your investment . The favored project should have anIRRequaltoorhigherthanthepredefineddiscountrate,i.e.youwouldearn less by depositing your money in the bank . Comparing the rates of return of different investment options, the one with the highest IRR is the mostprofitableonefromaneconomicperspective.TocalculatetheIRR,theNPV needs to be set at zero in the previous NPV equation (Rudolf, 2008) .
Once again your investment decision should not be made solely based on the result of IRR . Its results might not present an accurate picture since it is not designed to make a comparison between investment options of different timing or duration .
To recapitulate; all of the investment assessment methods presented have their strengths and weaknesses . To achieve reliable results, which one can base investment decisions on, it is advisable to apply at least two of the methods explained to calculate your investment (options) . However, NPV is always a good choice to reduce the risk of losing money .
S.173
𝑁𝑁𝑁𝑁𝑁𝑁 = 0, 𝑜𝑜𝑜𝑜
∑ 𝐶𝐶𝐶𝐶𝑡𝑡(1 + 𝐼𝐼𝐼𝐼𝐼𝐼)𝑡𝑡 − 𝐼𝐼0 + 𝑆𝑆
𝑛𝑛
𝑡𝑡=1= 0
ExampleUse the numbers provided in the NPV example for calculating the IRR of the biogas plant:
0 = [150/(1 + IRR)1 + (150/(1+IRR)2 + … + 150/(1 + IRR)10] - 600 IRR = 21 .41 %
The resulting IRR, at which the NPV is zero, is about 21 .41 percent . This percentageishigherthanthepredefinedminimumacceptablerateforthis example of 10 percent (discount rate) . Thus, investing in biogas results in capital gains .

SUSTAINABLE ENERGY FOR FOOD – Massive Open Online Course – Reader
CHAPTER C | UNIT C3 | BUSINESS MODELS FOR PROJECTS IN THE ENERGY AGRICULTURE NEXUS 124
Unit C3.1.5 | Project Financing: Example of MicrofinanceIn most cases clean energy solutions for agricultural value chains require a significant investment [» Unit C1.6].Accesstofinanceishencecrucial–andoften the biggest challenge for rural farmers, as well as for renewable energy project developers and service providers . Generally there are two ways to source capital: either by borrowing it from a bank, or through equity capital (i .e . selling a stake in the business) . Of course there is a wide scale of investment sizes [» Unit C2.1], ranging from e .g . small biogas plants for smallholder farmers, via bigger PV-powered cold rooms for vegetables, up to windparksforgeneratingenergyforflowerfarms.
Large-scale renewable energy investments include large power generation projects, involving the construction and operation of power plants . The main actorsareprojectdevelopers,powerplantoperators,financiersandgovern-ments .
The industrial energy efficiency [» Unit B3]fieldconsistsofprojectsthataimto reduce the use of electricity or other forms of energy in an industrial con-text . The main protagonists are industrial companies, energy service compa-nies,financiersandgovernments(GIZ,2014).
In this chapter we limit the focus to small-scale investments in renewable energyandenergyefficiencyliketheonesintheexamples.Theseaimtopro-vide solutions to low-income populations, mostly in rural contexts – in our case theEnergyAgricultureNexus,specificallywithconnectionstoproductiveagri-culturalactivities.Thekeystakeholdersinthisfieldarehouseholdsorsmallbusinessesserved,businessesprovidingsolutionsandproducts,financiers(often microfinance [» Unit C1.6] institutions) and government (GIZ, 2014) .
Microfinancecanbeanattractivesourceoffinancinginthesecasesforexample a solar powered irrigation system, a biogas plant or payment of capital cost . The relatively high capital cost of renewable solutions also requires access to end-user financing adapted to the consumers’ income . Microfinanceincludesdiverseservicessuchasinsurance,leasing,savings,cashtransferandcredits;providedbymicrofinanceinstitutes(MFI)thatcanbe NGOs, banks, credit and savings cooperatives and associations . Their tar-get groups are generally low-income households and small businesses who normally would not be offered a credit from a traditional bank due to the lack of guarantees or higher administrative expenses . A microcredit is one of the instrumentsprovided.Sometimesspecialcreditschemesforonespecifictechnology are offered (FAO, 2005) .
MORE TO LEARNAbout financing large-scale energy proj-ects for agriculture
• AFD“Green Credit Line”: Provid-ing commercial banks with an incentive to explore the renew-ableenergyandenergyefficiencymarkets .
• Energypedia“Financing Portal”: Information on funding and financingpossibilitiestobridgegapsinthefinancialrenewableenergy sector .
• GIZ“Financing Green Growth”: A reviewofgreenfinancialsectorpolicies in emerging and develop-ing economies (covering both small- and large-scale renewable energyandenergyefficiencyinvestments) .
• PAEGC“An Energy Grand Chal-lenge for Development”: Supports new and sustainable approaches to accelerate the development and deployment of clean energy solu-tions in developing countries .
• UNEP“Financing Renewable Energy in Developing Countries”: Drivers and barriers for private financeinsub-SaharanAfrica.
• UNEP“Private Financing of Renewable Energy – A Guide for Policymakers”:Howfinancegen-erally works / the role of different partsofthefinancesector/whatissuesfinanciersconsiderwheninvesting, including the role of pol-icy and regulation / others .
• WorldBank“Readiness for Invest-ment in Sustainable Energy”: Com-pares the investment climate of countries across energy access, energyefficiencyandrenewableenergy .

SUSTAINABLE ENERGY FOR FOOD – Massive Open Online Course – Reader
CHAPTER C | UNIT C3 | BUSINESS MODELS FOR PROJECTS IN THE ENERGY AGRICULTURE NEXUS 125
Microfinancesplitstheoftenrelativelyhighinitialinvestmentcostsintosmaller monthly rates . This can make an energy project affordable . The inter-estratesofMFIsvarybroadly.IfyouwanttofinanceyourintendedprojectbyaMFI,comparecreditconditionsandinterestratesofnearbyMFIs.Tofindoutif the project is viable for you, include the capital costs in your calculations with the methods of capital budgeting (see above) . Sometimes financial sup-port [» Unit C1] istiedtospecificpre-conditionse.g.useofdripirrigationforpumping water to support sustainable water management (IRENA, 2016) .
RECAP• Abusinessmodeldescribesthecorestrategyofanorganizationonhow
tomakemoney.Todefinekeyelementsofyourbusinessmodel,itisrec-ommended that you carry out a detailed market analysis .
• Thetotalcostsofaprojectcanbedividedintocapitalexpenditures(CAPEX) and operating expenses (OPEX), whereby the latter can be sub-dividedintofixedandvariablecost.
• ThemethodsofCapitalBudgeting(e.g.PaybackPeriod,NPVandIRRarethemostcommonones)helptoascertaintheprofitabilityofplannedprojects .
• Theservicesofmicrofinance(e.g.microcredits)canhelplow-incomehouseholdstofinancesmall-scaleenergyprojects.
Unit C3.2 | Clean Energy Projects in the Agricultural SectorSeveral existing on- and off-grid installations prove that renewable energy can easily be integrated into agricultural value chains [» Unit B1.2] to enhance agricultural activities/productivity . Good examples for this are wind turbines installedonagriculturalfieldswithoutmucheffectoncropgrowthorlive-stock grazing . Solar PV systems are able to pump water and farmers can dry crops, vegetables and fruits with solar thermal systems . Solar cooling is also promising . Furthermore, biomass [» Unit B2] resources provide sources for addressing heat energy demands (Sims, Mercado, Krewitt et al ., 2011) .
In the following sections three examples of on-grid and off-grid energy proj-ects in agricultural value chains are discussed . You are already familiar with these technologies from the previous chapters . So this chapter focusses on aspectsoffinancialanalysisyoushouldconsiderwhenplanningtoimple-ment a clean energy solution – either as a new business or as an adapta-tion/add-on to your existing business . The examples combine the most importantcontentfromthischaptertoshowyouhowfinancialanalysisofenergy projects for agricultural value chains can be conducted and help you to make business decisions .
FIND MORE INFOR MATION ABOUT THIS TOPIC • Aninterestingstudyaboutathree
continentcomparisonofmicrofi-nance for energy service was pre-pared by The SEEK Network: » Link
• FAO(FoodandAgricultureOrgani-zation of the United Nations) pre-pared a paper about Guidelines andCaseStudiesforMicrofinancein Fisheries and Aquaculture: » Link
• Microfinanceandforest-basedsmall-scale enterprises: » Link
• EnergypediaFinancingandFund-ing Portal: » Link
• WatchtheMOOCexpertvideowith Katie Kennedy Freeman from the World Bank (week 2): » Link
REMINDERAs presented in Unit B3 [» Unit B3] measurestoincreaseenergyeffi-ciency in agricultural processes are relevant investment options as well . Have another look at the tea factories in Kenya case study that invested in several measures that resulted in energy savings, costs reductions, and GHGemissionsavings.Profitabilityof such investments can be calcu-lated in the same way as presented here .

SUSTAINABLE ENERGY FOR FOOD – Massive Open Online Course – Reader
CHAPTER C | UNIT C3 | BUSINESS MODELS FOR PROJECTS IN THE ENERGY AGRICULTURE NEXUS 126
Unit C3.2.1 | Grid vs. Off-Grid Energy Projects in Agricultural Value Chains
Until population densities and/or urbanization rates increase considerably, grid extension is not likely to be a cost-effective way to provide remote areas with access to electricity . Hence, extension requires large subsidies . Off-grid solutions [» Unit C1] could be an alternative on an individual basis (i .e ., for consumerse.g.PVsolardryers)orforagroupsofbeneficiaries(e.g.remoteisolated village with a mini grid) .
Deciding whether to select an on- or off-grid solution should be based on social considerations, cost-effectiveness criteria or a combination of both . Typically cost-effectiveness criteria include distance to the existing grid, population size, affordability and productive potential . However, while using cost-effectivenesscriteriasupportsfinancialsustainability,itoftenleadstopromotingtheconnectionoflessaffluentcommunities(Energypedia,2015).
Unit C3.2.2 | Grid-Connected Energy Projects in Agricultural Value Chains
The advantage of grid-tied systems is that the grid can be used as back-up when the renewable energy source is not available (e .g . sun not shining, wind not blowing) . Consequently, expenses for electricity storage devices like batteries can be avoided .
In developed countries typical grid-connected renewable energy solutions for agricultural activities are e .g . biogas, PV or wind plants . Excess electricity – electricity that is generated but cannot be consumed instantly – can be fed into the grid . In many countries feed-in tariffs [» Unit C1] have been intro-duced . It varies from country to country, but principally a price based on the kWh of renewable electricity fed into the grid is paid, or net metering (excess electricity that is fed into the grid reduces the electricity bill) is implemented .
In order to feed electricity into the public / local grid, legal requirements given by the grid operator and technical requirements for the connection of yoursystemtothegridmustbeverified.Obviouslythisinformationisrele-vant to your business model, since revenues are impacted .
Also many developing countries face a rising demand for grid-connected power to meet manufacturing and industrial energy need (as well as to pro-vide electricity in rapidly-growing urban areas and extend basic electrical services to rural areas) . For urban customers based within a reasonable dis-tance to the grid, extending the central power grid remains the most cost-ef-
GENERAL ASPECTSGeneral aspects that you should con-sider for an on-grid gasification system are (amongst others):
• Feedstockissues:isareliablesourceoffeedstockavailable?Ifso, is it suitable for usage in a gas-ifier?Whichquantityisavailableandisthereafluctuationofthequantity over the different sea-sons?Isthesourceconsideredas“waste” and might therefore be available“forfree”orlittlemoney?Is the resource available in an area close to the plant keep transporta-tioncostslow?Aretherecompeti-tors who are interested in the sameresource?Whatisthecur-rentmarketpricefortheresource?
• Istherequiredgasifiertypeavail-able and is it also appropriate for existinglocalconditions?
• Logistics:storagerequirements,appropriate site for the plant, sup-plyoffeedstock?
• Financialaspects:istheprojectfinanciallyviable?Considerthecosts (e .g . initial investment + costs for feedstock purchase + transport + pre-processing + repaying credit taken including interest + maintenance and opera-tion costs, including labor, other fees and/or taxes etc .) in compari-son to possible revenue (avoided payment for fuels + sale of by-products + electricity sale into thegrid).Doincentivesexist?
• Technicalplantparameter:fullload hours, internal rate of use, life time?
• Legalissues:arepermissionsrequired?Istheconnectiontothegridallowed?
• Regulationissues:Ownershipandoperation?Maintenanceresponsi-bility?Expertiseavailable?

SUSTAINABLE ENERGY FOR FOOD – Massive Open Online Course – Reader
CHAPTER C | UNIT C3 | BUSINESS MODELS FOR PROJECTS IN THE ENERGY AGRICULTURE NEXUS 127
fective solution . Supplying grid-based electricity is also cheaper than install-ing off-grid options when transmission and distribution lines are nearby (PWC, 2016) .
Case Study of Grid-Connected Energy Agriculture ProjectsAn example of grid-connected technology is gasification technology [» Unit B3] to convert biomass to power, heat and biofuels . These systems generate syn-thesis gas that can be burned in gas engines for power production or in boil-ers for heat generation (ECN, SNV, 2014) . They can be used as grid-connected systems to feed the total or surplus electricity produced into the grid to obtain financialremuneration.However,small-scalegasifiersalsopresentapromis-ing option, since off-grid systems for rural settlements are not connected to the national grid .
Unit C3.2.3 | Off-Grid Energy Projects in Agricultural Value Chains
Off-grid systems are not connected to the public utility grid for electricity, water or gas supply . The off-grid sector presents a huge potential for regions with unreliable and / or expensive supply from the national grid or for remote areas that will not be connected to the national grid within the next years (IRENA, 2015) . Hence, off-grid renewable energy systems are often the best economical solution for the 1.4 billion people without access to electricity [» Unit C1] (Energypedia, 2014b) . Most of these people live in developing countries and a large portion of them works in the agriculture sector . The countries with the largest populations without electricity are India, Nigeria, Ethiopia, Côte d’Ivoire, Democratic Republic of Congo and Bangladesh (PWC, 2016) .
Generally, off-grid systems require battery storage and often a backup gener-ator to ensure access to electricity at all times . Typically batteries are expen-sive and need to be replaced at some point .
A broad range of off-grid energy supply systems is available . Mini-grids can supply several houses or even a small town with electricity . They are based on fossil fuels or renewable energy, or a combination of both (e .g . diesel-PV hybrid system) . Another possibility is a stand-alone system . Direct-use systems are without battery storage (e .g . PV-powered water pumping or ventilation), whereas most other renewable energy systems include storage to compensate fluctuatingavailabilityoftheseresources.Solarhomesystemsarequitepopu-lar for this type . Various different off-grid energy projects can be found in the agricultural sector . Very common ones are biogas plants [» Unit B2] on different
NOTEDetailed calculations can be found in Annex I [» Annex I] .
MORE TO LEARNA study by IRENA analyzes the impact of decentralized renewable energy solutions on the livelihoods of com-munities, covering technologies that can be used along the agri-food chain . » Link

SUSTAINABLE ENERGY FOR FOOD – Massive Open Online Course – Reader
CHAPTER C | UNIT C3 | BUSINESS MODELS FOR PROJECTS IN THE ENERGY AGRICULTURE NEXUS 128
scales and PV powered irrigation systems . Moreover, PV and sometimes also small-scale wind power or micro-hydro power [» Unit B1.2] can be used for live-stockwatering,electricfences,lighting,aquacultureandfishing,aswellasforrefrigeration systems for meat and dairy products . Solar water heaters or bio-gas plants can be used to supply heat, e .g . to sterilize fruits and vegetables .
Case Studies of Off-Grid Energy-Agriculture Projects1. Small -Biogas PlantYou want to have your own biogas plant [» Unit B2] to convert your organic wasteintobiogas?Firstthinkaboutyourintendedbusinessmodeltype(fol-lowing the list above), including the following points:
• Doyouhaveaccesstoorganicmaterial(suchasanimalmanure,sewage,food and organic waste, human excreta, plants or any residues from agri-culturalproductionthatyoucouldusetofeedthebiogasplant?Isitforfreeordoyouhavetopayforit?Howmuchistheavailablequantityperdayandoverthecourseoftheyear?
• Whatdoyouwanttogenerate?Biogas,electricity,heatorbiofuel?Doyouwanttousethistomeetyourownneedsand/ordoyouwanttosellit?
• Intheeventyouwanttosellit,howbigisthemarket?Howmanypossiblecustomers?Whatisthecurrentmarketpriceforyourproduct?Howandviawhichchannelsdoyouwanttosellit?
After this you can try to predict the potential profit of your biogas plant by subtracting all costs from the total revenue . The list in Table 3 provides an indication about important items that should be taken into account . How-ever, consider that revenue and OPEX occur annually whereas CAPEX is gen-erally a one-time expense . Nevertheless, you should apply the methods of capitalbudgetingtoobtainareliablefinancialresult.Todosoyouneedtoknow the lifetime of the biogas plant (ask the producer!) and the current interest rate (ask your bank!) .
Regarding costs considerations, generally it can be said that capital expen-ditures for an anaerobic digester are moderate . To prevent failures an expert should assist in planning . The required effort for operation and maintenance is quite small . If construction is properly designed, maintenance costs should be minimal . In most cases you can maintain the plant by yourself and save money .
To calculate the revenue, use the amount you currently pay for the items that will be replaced by biogas (e .g . electricity bill), and for the sales calculation,
REMINDERHave a look at chapter B2 again, which provides detailed information on biogas and bioenergy technolo-gies . » Chapter B2
“Turn your organic waste into energy and reduce your energy costs in the process.”

SUSTAINABLE ENERGY FOR FOOD – Massive Open Online Course – Reader
CHAPTER C | UNIT C3 | BUSINESS MODELS FOR PROJECTS IN THE ENERGY AGRICULTURE NEXUS 129
use current market prices . You can collect part of the required cost informa-tion from producers of biogas plants . The advice of your neighbors or friends who already use such a plant can also be very helpful . Over and above this your bank might be able to inform you about the capital costs .
FinancialBenefits
Revenue • Avoidedpaymentforfertilizer,kerosene,cookinggas,fuelwood,etc.These direct savings goes into the calculation as indirect revenue .
• Revenuesfromthesalesofbiogas,electricityandheatorbiofueldepending on plant size and type
• SaleofqualityfertilizerCosts ConsiderationsCAPEX Initial investment:
• purchasingcostsoropportunitycostsforlandneededforthebio-gas plant and slurry storage
• modelofthebiogasplant(thedigester)andotherrequiredpartslike dung storage, gas storage, safety provisions, mixing equip-ment, piping system including liquid-manure and gas lines, biogas stove etc .
• planninganddimensioning,constructionsupervision,licensingfees, etc .
• laborinputandwagesforthepeoplewhoplanandinstalltheplant(excavation-work, construction of the digester and gas-holder, etc .)
• yourownlaborcostsintheeventyouassistinorcarryoutthecon-struction
Reinvestment costs for replacement of components with a shorter life time than the whole project (forexamplepumps,floatinggasholder,etc.)
OPEX • acquisition(purchase,collectionandtransportation)ofthesub-strate (if you get something for free, for example substrate from your own livestock, then no costs have to be considered to purchase it)
• watersupplytocleanthestableandmixthesubstrate• feedingandoperatingtheplant• supervision,maintenance,cleaningandrepairoftheplant• storageanddisposaloftheslurry• gasdistributionandutilization• administration• youropportunitycostsforcarryingoutthenecessaryactivitiesto
ensure the plant operates smoothly• incaseofsale,additionalcostsoccurforexampletransport,pack-
aging, advertising, etc .• maybecreditcosts(interest)intheeventaloanwastakenout
Figure C14 | Important Aspects to Consider in the Financial Analysis of a Small Biogas Plant (Energypedia, 2015; ECN, 2011)
MORE TO LEARN• Energypedia Biogas Portal: » Link
• GTZ Biogas Report: » Link
NOTEDetailed calculations can be found in Annex II [» Annex II] .

SUSTAINABLE ENERGY FOR FOOD – Massive Open Online Course – Reader
CHAPTER C | UNIT C3 | BUSINESS MODELS FOR PROJECTS IN THE ENERGY AGRICULTURE NEXUS 130
2. Solar dryerSolar Dryers [» Unit B1.3] do not depend on fuel and in general they present a simple and cheap way to preserve vegetables and fruits for weeks or months . Their advantage is that you can use the dried products for your own needs, as well as trade them throughout the year .
Therefore, if you store them appropriately, your dependence on the harvest timetogenerateprofitdecreasesandyoupreventthespoilageofthoseprod-ucts . By offering dried products outside the harvest season, you might be even able to sell them for higher prices than fresh products at harvest time whenthereisoftenanoversupply.Allinall,asolardryercouldgenerateprofitforyou,butfirstthinkaboutthefollowingpointsandsumupthepossiblerev-enue and costs, including the issues mentioned in Table 4 . For a more reliable assessmentofprofitability,applythemethodsofcapitalbudgeting.Todefineyour business model (following Table 1) in detail, consider the next points:
• Whichofthevegetablesandfruitsthatyougrowissuitablefordrying?• Whichamountcanyouusefordrying?• Doesamarketfordriedfoodproductsexist?Howmanypossiblecus-
tomersfortheproductdoyouestimate?Howmuchwouldtheypayfortheseproducts?Aretherecompetitors?
“Ensure long-term storage of your fruits and vegetables and convert them into high quality goods.”
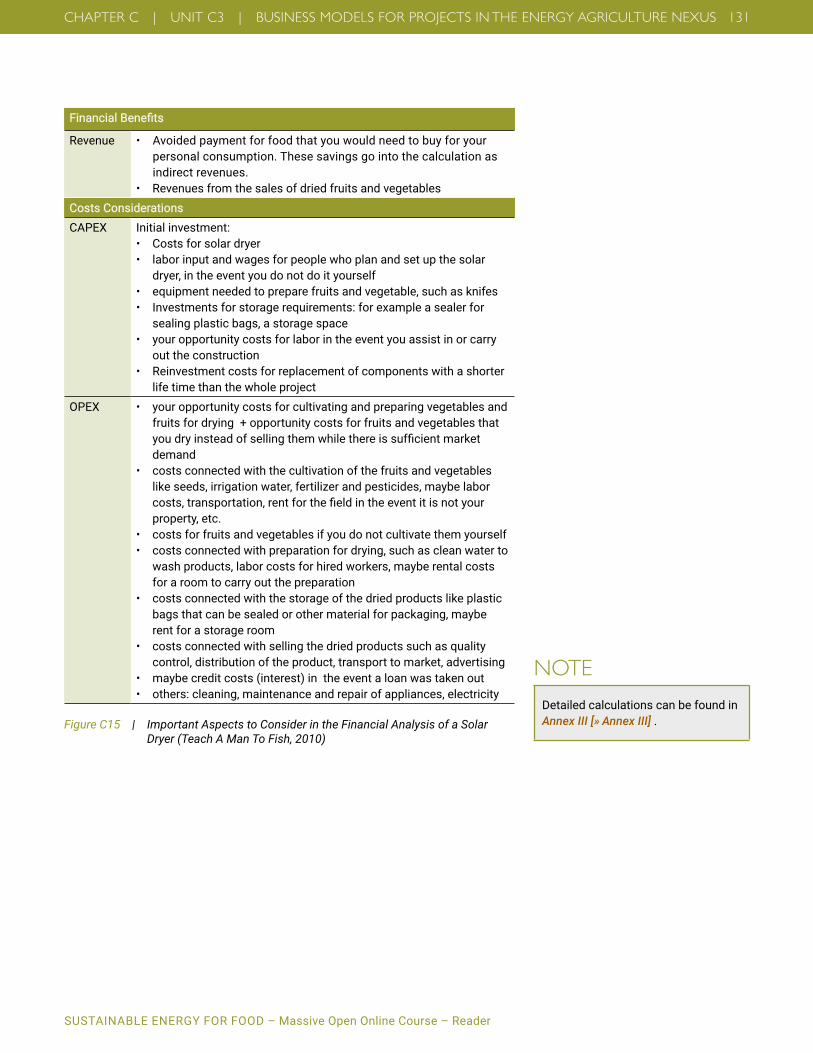
SUSTAINABLE ENERGY FOR FOOD – Massive Open Online Course – Reader
CHAPTER C | UNIT C3 | BUSINESS MODELS FOR PROJECTS IN THE ENERGY AGRICULTURE NEXUS 131
FinancialBenefits
Revenue • Avoidedpaymentforfoodthatyouwouldneedtobuyforyourpersonal consumption . These savings go into the calculation as indirect revenues .
• RevenuesfromthesalesofdriedfruitsandvegetablesCosts ConsiderationsCAPEX Initial investment:
• Costsforsolardryer• laborinputandwagesforpeoplewhoplanandsetupthesolar
dryer, in the event you do not do it yourself• equipmentneededtopreparefruitsandvegetable,suchasknifes• Investmentsforstoragerequirements:forexampleasealerfor
sealing plastic bags, a storage space• youropportunitycostsforlaborintheeventyouassistinorcarry
out the construction• Reinvestmentcostsforreplacementofcomponentswithashorter
life time than the whole projectOPEX • youropportunitycostsforcultivatingandpreparingvegetablesand
fruits for drying + opportunity costs for fruits and vegetables that youdryinsteadofsellingthemwhilethereissufficientmarketdemand
• costsconnectedwiththecultivationofthefruitsandvegetableslike seeds, irrigation water, fertilizer and pesticides, maybe labor costs,transportation,rentforthefieldintheeventitisnotyourproperty, etc .
• costsforfruitsandvegetablesifyoudonotcultivatethemyourself• costsconnectedwithpreparationfordrying,suchascleanwaterto
wash products, labor costs for hired workers, maybe rental costs for a room to carry out the preparation
• costsconnectedwiththestorageofthedriedproductslikeplasticbags that can be sealed or other material for packaging, maybe rent for a storage room
• costsconnectedwithsellingthedriedproductssuchasqualitycontrol, distribution of the product, transport to market, advertising
• maybecreditcosts(interest)intheeventaloanwastakenout• others:cleaning,maintenanceandrepairofappliances,electricity
Figure C15 | Important Aspects to Consider in the Financial Analysis of a Solar Dryer (Teach A Man To Fish, 2010)
NOTEDetailed calculations can be found in Annex III [» Annex III] .
SUSTAINABLE ENERGY FOR FOOD – Massive Open Online Course – Reader
CHAPTER C | UNIT C3 | BUSINESS MODELS FOR PROJECTS IN THE ENERGY AGRICULTURE NEXUS 132
RECAP • Inprinciple,cleanenergyprojectsdistinguishbetweenon-gridandoff-
grid systems . • Grid-tiedenergysystemscanusethegridasback-upincasesoftempo-
rary unavailability of the renewable energy source . If a feed-in tariff exists, income from the energy project can also be generated by supplying elec-tricity to the grid .
• Gasificationtechnologyisonepossibilitytoconvertbiomasstopower,heatandbiofuels.Apossiblefeedstockforagasifiercanbeagriwaste,e .g . rice husks .
• Off-gridsystemsaredecentralizedenergysystemsthatarenotcon-nected to the national grid . They present a huge potential especially for notyetelectrifiedremoteareasindevelopingcountries,andcansupplyindividual households or whole communities .
• Commonrenewableoff-gridsystemsaresolarhomesystems,biogasplants, solar water heaters, small-scale wind power and micro-hydro power plants .
• Forafirstimpressionofaproject’sprofitability,oneneedstosumupallrelevant factors that make up total revenue and total cost, and compare the results . More reliable results can be achieved by applying capital bud-geting methods .
• Theeconomicviabilityofasmall-scalebiogasplantsdependsontheavailability of organic material, the type of end product and its market demand . The revenue is composed by sales of the end products and pay-ments spared for formerly used fuels . The initial investment constitutes the main part of the total cost .
• Theprofitabilityofasolardryerdependsmainlyonthemarketvaluefordried foods . Consider the initial investment and additional cost items during operation to calculate the costs .
SUSTAINABLE ENERGY FOR FOOD – Massive Open Online Course – Reader
CHAPTER C | UNIT C3 | BUSINESS MODELS FOR PROJECTS IN THE ENERGY AGRICULTURE NEXUS 133
SUMMARY & UNIT WRAP-UP In this unit, you were provided with an overview on the basic aspects of a business model and the basic methods of capital budgeting to assess the profitabilityofprojects.Thecasestudiesdescribedgaveyouanideaabouthowtodraftadetailedlistofcostandrevenuefactorsforspecificprojects.
The potential for implementing renewable energy technologies for agricul-turalactivitiesisenormous.Toensurealong-term,sustainableandprofit-ableenergyproject,awell-definedbusinessmodelisrequired.Itdescribesthe core strategy of how an organization plans to generate income . This decision should be based on a detailed market analysis to determine the key elementsofthebusinessmodel.Tofindoutiftheinvestmentintheconsid-eredprojectisprofitableinthelongrun,thecapitalbudgetingmethodpres-ents a helpful tool . First of all, necessary information needs to be gathered about the relevant revenue and cost items to estimate the required initial investmentandannualcashflows.Itisimportanttoknowthatrenewableenergy technologies can be used on-grid as well as off-grid . Examples con-sideredinthisreaderweresmall-scalegasifiers,biogasplantsandsolardry-ers . Implementation of these energy projects developed with a carefully designed business model can not only often replace fossil fuels in the agri-cultural sector, but also contribute to the economic and social development of local communities .
MATERIALS Please find below links to our materials and references
Videowww .giz .de/gc21/pa_video_lectures
Additional Materialwww .giz .de/gc21/pa_additional_material
Top5 Team Assignmentswww .giz .de/gc21/pa_assignments
Referenceswww .giz .de/gc21/pa_references

SUSTAINABLE ENERGY FOR FOOD – Massive Open Online Course – Reader
ANNEX 134
ANNEX I“Example of a Financial Analysis for a Grid-connected Energy Project”Letusdiscussonesimplifiedexampleofagrid-connectedgasificationpower plant fueled with rice husk in Vietnam . In order to apply the described methods of capital budgeting, we will assume the following data (please note:thenumbersusedaresimplifiedandarenotrepresentative):
Revenue • Ownannualhouseholdelectricitydemand:4000kWh• Electricityprice:0.082€/kWh• Feed-intariff:0.058€/kWh
Cost CAPEX • Initialinvestmentcost(planning,
construction, equipment, insurance, fee and interest) of 3000€/kW.Foragasifierof 100 kW capacity, this means investment cost of 300,000 € .
OPEX • Feedstock(ricehusk)price
including transport: 0 .025 € / kg • Operationandmaintenancecost:
assumed3 %ofinvestmentcost
Other Parameters • Assumedplantcapacity(assumingabout67 %capacityfactor):100kW• Usedquantityoffeedstock:500tons/year• Heatingvalueofricehusk:14MJ/kg• Nolandpurchasecostorrentpaymentconsidered• Projectlifetimeof15years• Internaluserateofplantis10 %(thatis10 %oftheproducedelectricity
is used by the plant itself)
Wecancalculatetheprofitabilityofthisprojectwiththedataprovided(see next page):

SUSTAINABLE ENERGY FOR FOOD – Massive Open Online Course – Reader
ANNEX 135
FINANCIAL ANALYSIS
Project lifetime (years) 15 Used quantity of rice husk as feedstock (kg/year) 500,000 Heating value of rice husk (MJ/kg) 14 Systemefficiency(assumed30 %) 0 .3 Annual electricity generation (kWh) 583,333
Acquisition price for electricity from the grid (€/kWh) 0 .082 Own annual household electricity demand (kWh) 4,000 Avoided payment for electricity (€/year) 328
Internal use rate of the plant (%) 0 .1 Annual electricity fed into grid (kWh) 521,000 Feed-in tariff rate (€/kWh) 0 .058 Annual income from electricity feed-in (revenue) (€) 30,218
Initial investment (€) 300,000
Feedstock price (incl . transport) €/kg 0 .025 Annual feedstock cost 12,500 O&M(3 %ofinvestment) 9,000 Total annual cost (€) 21,500
Annual cash flow (€) 9,046
Payback time (years) 33.16
Discountrate(10 %) 0 .1
Net present value (NPV) (€) -231,195
Theappliedmethodsofcapitalbudgetingassesstheconsideredgasifierplantasnon-profitable.Thecalculatedpaybacktimeis33.16years,whichishigher than estimated project lifetime of 15 years . Since the NPV is negative, wedidnotcalculateitsIRRhere,astheprojectisnotprofitable.

SUSTAINABLE ENERGY FOR FOOD – Massive Open Online Course – Reader
ANNEX 136
ANNEX II“Example of a Financial Analysis for an Off-Grid Energy Project – BIOGAS PLANT” Letusnowdiscussonesimplifiedexampleofabiogasplantforyourfarm (2 cows, 8 pigs, 4 adult persons), assuming that you carry out most of the work yourselfandthatsufficientwaterisavailableforfree.Itisassumedthatyourfarm and household generate enough substrate to run the biogas plant . The generated biogas is used for cooking and 1/6 of the produced fertilizer is used for your farm land and the rest for sale . In order to apply the described methods of capital budgeting, we will assume the following data (Please note: The num-bersusedaresimplifiedandarenotrepresentativeonsite.Theyvarygreatlydepending on which type and size the biogas plant is, which substrate you use, your current used fuel for cooking, and how much of the work you do yourself):
Revenue • Avoidedpaymentforfertilizer:0.4$/kg,amount1/6offertilizeramount
generated by biogas plant • AvoidedpaymentforLPG:price1$/kg,amount12kg/month
Cost CAPEX • Biogasplant(3m³)incl.
construction: 400 $ • Equipmentincl.biogas
stove: 60
OPEX • Annualsubstratecost:0$• Annualcostforoperation,
maintenance, replacement: 5 % of initial investment
Other Parameters • Nolandpurchasecostorrentpaymentconsidered• Projectlifetimeof10years• Discountrate:10%• 1cow:10kgdung/dayand1kgmanure/day-->0.5m³biogas/day• 1pig:1kgdung/dayand1kgmanure/day-->0.06m³biogas/day• 1adultperson:1kgfeces/urine/day-->0.06m³/day• Cooking(3times/day):0.4m³biogas/person/day• Waterrequirementinplant(bio-waste:water):1:0.5• Assumedresidencetime:60days• Assumeddensity:1000kg/m³
Wecancalculatetheprofitabilityofthisprojectwiththisprovideddata.

SUSTAINABLE ENERGY FOR FOOD – Massive Open Online Course – Reader
ANNEX 137
CAPEX
BiogasPlant(3m³)(incl.Construction)($) 400Equipment (incl . biogas stove)($) 60Total initial investment ($) 460
OPEXSubstrate cost ($) 0Annual Operation, maintenance, replacement cost ($) (5 % of invest .)
23
Annual operational cost ($) 23.00
REVENUEAvoided payment for fertilizer (0 .4 $/kg) 155 .73Avoided payment for LPG (1 $/kg; 12 kg/month) 144 .00Total avoided payment ($/year) 299 .73Sale of fertilizer (0 .04 $/kg) 77 .87Annual revenue ($) 377.60
Annual cash-flow ($) 354.60
Payback period (years) 1.30
Discount rate (10 %) 0 .1
Net present value (NPV) ($) 1,718.86
Internal Rate of Return (IRR) (%) 76.83
Additional CalculationsBiogasgenerationbycowdung(m³/day) 1Biogasgenerationbypigdung(m³/day) 0 .48Biogasgenerationbypeople’sdung(m³/day) 0 .24Totaldailybiogasgeneration(m³/day) 1 .72Biogasrequiredforcooking(m³/day) 1 .6Water requirement (for 32 kg dung/day) 16Overall inlet into reactor (kg/day) 48Requiredbiogasplantsize(m³)basedon60days residencetimeandassumeddensityof1000kg/m³
2 .88
Generated fertilizer (1/5 of bio-waste quantity) 6 .4Own consumption of fertilizer is 1/6 of generation (kg/day): 1 .07Remaining fertilizer for sale (kg/day) 5 .33
The applied methods of capital budgeting assess the considered biogas plantprojectasprofitable.Thecalculatedpaybacktimeis1.3years.TheNPVispositiveandtheIRRiswith76.83%muchhigherthanthepre-definedminimum acceptable rate for this example of 10 % (discount rate) .

SUSTAINABLE ENERGY FOR FOOD – Massive Open Online Course – Reader
ANNEX 138
ANNEX III“Example of a Financial Analysis for an Off-Grid Energy Project – SOLAR DRYER” Letusnowdiscussonesimplifiedexampleofasolardryertodrybananasandmangos to produce 4000 bags of dried fruits per year, assuming that you carry out most of the work yourself . In order to apply the described methods of capi-tal budgeting, we will assume the following data (please note: the numbers usedaresimplifiedandarenotrepresentativeon-site).Theyvarygreatlydepending on which type and size of solar dryer you need, which fruits and veg-etable you want to dry, labor costs in your country and how much of the work you do yourself, etc .):
Revenue • Salepriceperbag(with100gofdriedfruit):1.00$• Amountofproducedandsoldbags(pieces):4,000
Cost CAPEX • SimpleSolarDryer:1,000$• Build-up(Laborcost):20$• Sealingmachineforthebags:
80 $
OPEX • Costperbag:0,10$• Costspermango(30g):0.16$• Costsperbanana(30g):0.10$• Laborcosts(incl.maintenance):
0 .35 $/bag
Other Parameters • Nolandpurchasecostorrentpaymentconsidered• Projectlifetimeof10years• Discountrate:10%
Wecancalculatetheprofitabilityofthisprojectwiththisprovideddata.

SUSTAINABLE ENERGY FOR FOOD – Massive Open Online Course – Reader
ANNEX 139
CAPEX
Simple Solar Dryer ($) 1,000Build-up (Labor cost) ($) 20Sealing machine for bags ($) 80Total initial investment ($) 1,100
OPEXCost per bag ($) 0,10Amount of bags per year (pieces) 4,000Packaging ($) 400Costs for mangos ($) 1,066 .67Costs for bananas ($) 666 .67Labor cost (incl . maintenance) ($/bag) 0,35Labor cost ($/year) 1400Annual operational cost ($) 3,533.33
REVENUEDried fruit bag (100g) sale price ($) 1 .00Amount of sold bags per year ($) 4,000Annual revenue ($) 4,000
Annual cash-flow ($) 466.67
Payback period (years) 2.36
Discount rate (10 %) 0 .1
Net present value (NPV) ($) 1,767.46
Internal Rate of Return (IRR) (%) 41.06
Additional Calculations2,000 bags of dried mango slices, 2,000 bags of dried banana slices1 bag = 100 g of dried fruit, either banana or mango4,000 bags = 400,000 g dried fruit
1 mango (30g) ($) 0,161 banana (30g) ($) 0 .1Bananas required or 2,000 bags 6,666 .67Mangos required for 2,000 bags 6,666 .67
The applied methods of capital budgeting assess the considered solar dryer projectasprofitable.Thecalculatedpaybacktimeis2.36years,whichisabout one fourth of the estimated project lifetime of 10 years . The NPV is positiveandtheIRRiswith41.06%higherthanthepredefinedminimumacceptable rate for this example of 10 % (discount rate) .

SUSTAINABLE ENERGY FOR FOOD – Massive Open Online Course – Reader
IMPRINT 140
IMPRINTThis product is made possible through the support of the “Powering Agricul-ture: An Energy Grand Challenge for Development” Founding Partners: the United States Agency for International Development (USAID), the Swedish International Development Cooperation Agency (Sida), the German Federal Ministry for Economic Cooperation and Development (BMZ), Duke Energy, and the Overseas Private Investment Cooperation (OPIC) .
Published byDeutsche Gesellschaft fürInternationale Zusammenarbeit (GIZ) GmbH
Registered officesBonn and Eschborn
AddressGlobal Programme Sustainable Energy for Food – Powering AgricultureFriedrich-Ebert-Allee 36, D-53113 Bonn, GermanyT + 49 228 4460-0I www .poweringag .org
Editingnetzhammer & breiholz, HamburgLaura Jakobeit; Monika Grossmann; Kerstin Lohr, GIZ
Layoutcreative republic, Frankfurt am Main
URL linksThis publication contains links to external websites . Responsibility for the content of the listed external sites always lies with their respective publish-ers.Whenthelinkstothesesiteswerefirstposted,GIZcheckedthethird-party content to establish whether it could give rise to civil or criminal liabil-ity . However, the constant review of the links to external sites cannot reason-ably be expected without concrete indication of a violation of rights . If GIZ itselfbecomesawareorisnotifiedbyathirdpartythatanexternalsiteithasprovided a link to gives rise to civil or criminal liability, it will remove the link to this site immediately . GIZ expressly dissociates itself from such content .
GIZ is responsible for the content of this publication .
Bonn, 2017