Embed Size (px)
Citation preview

UNESCO-EOLS
S
SAMPLE C
HAPTER
DIMENSIONS OF SUSTAINABLE DEVELOPMENT – Sustainable Development Indicators for Decision Making: Concepts, Methods, Definition and Use - Manuel Winograd and Andrew Farrow
SUSTAINABLE DEVELOPMENT INDICATORS FOR DECISION MAKING: CONCEPTS, METHODS, DEFINITION AND USE Manuel Winograd and Andrew Farrow International Centre for Tropical Agriculture (CIAT), Cali, Colombia Keywords: Indicators, Sustainable Development, Decision Making, Information Tools, GIS, Temporal/Spatial Dimensions Contents 1. Introduction 2. The Concepts of Sustainable Development and Decision Making 3. Methods: How to Define Sustainable Development Indicators? 4. Methods: How Use Sustainable Development Indicators 5. Definition of Sustainable Development Indicators: Examples of Application 6. The Use of Sustainable Development Indicators: Examples of Application Glossary Bibliography Biographical Sketches Summary Indicators are ubiquitous in daily life, yet we lack access to information to monitor and measure (1) development in relation to the environment, (2) the impact and consequences of development processes on natural resources, ecological functions and society, and (3) the interrelationships among different development factors. In recent years a world consensus has been reached on the need for sustainable development. Such a changed perspective on development implies new demands, one of which is the production of information that will play a critical role in providing a firm bases for evaluating decision making and monitoring development. Scientists and technicians are rarely able to provide decision-makers and the public with reliable information on the costs and benefits of development, or on social progress toward sustainability. The general absence of common methodological frameworks generates incompatible data, difficult-to-use information, and the multiplication of sets of indicators that are impossible to calibrate. Bringing methodological frameworks into agreement is not easy because it calls for a delicate balance between scientific validity, political acceptability, and technical feasibility. Indicators must therefore be developed in successive stages, and the different stages must be integrated. This paper demonstrates how indicators can be chosen to support development policy decision-making and clarify the needs and interests of different stakeholders. Indicators can be important tools to communicate scientific and technical information among different groups of users and to transform information into action toward sustainability. 1. Introduction In daily life, we use many types of indicators to make multi-purpose decisions. Our
©Encyclopedia of Life Support Systems (EOLSS)

UNESCO-EOLS
S
SAMPLE C
HAPTER
DIMENSIONS OF SUSTAINABLE DEVELOPMENT – Sustainable Development Indicators for Decision Making: Concepts, Methods, Definition and Use - Manuel Winograd and Andrew Farrow
bodies’ blood pressure, pulse, and temperature indicate our general health condition; the Gross Domestic Product, unemployment rates, and the rate of inflation are used to indicate the state and trends of a country’s or a region’s economy; while air pressure, temperature, and relative humidity are used to indicate and forecast the climate. However, there is a lack of analogous information that would allow us to observe and monitor (1) development in relation to the environment, (2) the impact and consequences of development processes on natural resources, ecological functions, and society, and (3) the interrelationships among different development factors. As a consequence of this scarcity, the use of this type of information in routine decision making is limited. This situation restricts and hinders the effective application of the concept of sustainable development because, without good information, it is impossible to change concepts into actions. Therefore, scientists and technicians are rarely able to provide politicians, decision-makers, planners, and the public in general with reliable and comprehensible information on the benefits, costs, and effects of development paths and on the transition toward sustainability – or, at least, indications regarding the non-sustainability of development. In fact, most of the information on the forces driving development, the state of the environment and society, the impact generated on ecological functions and human well being is generally based on post hoc empirical evidence. At the global, national, and regional levels, many institutions have numerous data and statistics on socioeconomic and environmental issues, but, in general, their production of information for decision making is poor. One reason for this is the lack of common methodological frameworks. Within the development context, these frameworks are crucial to determining the information required to recognize patterns, identify priorities, define policies, and implement actions. The absence of methodological frameworks generates incompatible data, difficult-to-use information, and the multiplication of sets of indicators that are impossible to adjust to one another. If indicators are to be used in decision making, then they must first be adjusted so that common sets of these indicators, responding to the needs of different users, can be selected. However, this process is not easy because it requires, in addition to a good exchange of information, a delicate balance between scientific validity, political acceptability, and technical feasibility when developing and using these tools. Indicators must therefore be developed in successive stages (from both technical and policy viewpoints). They must integrate the different stages involved in making decisions about development policies, as well as the needs and interests of different stakeholders. From the technical viewpoint, levels and scales must be established, causal relationships between development and environmental problems analyzed, and reference values defined. From the political viewpoint, consensus should be reached on the use and application of indicators, harmonizing conceptual and methodological frameworks, identifying priority problems and issues to be analyzed, and, finally, defining development goals to serve as reference values to guide future actions. Indicators thus become important tools to communicate scientific and technical information, and facilitate its access by different groups of users. In so doing, they can facilitate the transformation of information into action.
©Encyclopedia of Life Support Systems (EOLSS)

UNESCO-EOLS
S
SAMPLE C
HAPTER
DIMENSIONS OF SUSTAINABLE DEVELOPMENT – Sustainable Development Indicators for Decision Making: Concepts, Methods, Definition and Use - Manuel Winograd and Andrew Farrow
2. The Concepts of Sustainable Development and Decision Making The notions of progress and well being are not new. Since ancient times, humankind has taken these concepts into account, although normally as implicit objectives within visions of development. Societies try to ensure their own survival, and even if no society has defined its own extinction as a development goal, this very result has often been a consequence of the development model adopted. One only needs to look at the Greek and Roman Empires, where their failure to adapt society and economy to the environment was probably the main cause of their decline and fall (Hughes, 1973). Many human civilizations have used the concept of “health” to measure their level of well being, progress, or development, where “health” is defined as the balance or harmony between people and their environment (Bossel, 1999; Lovelock, 1992; Waltner-Toews, 1994). Within these civilizations many different tools were devised to monitor their “health”. These ideas have been displaced, however, by mechanistic and bio-medical models that are mainly based on the search for ways to tackle the unanticipated consequences of development (for instance, diseases), rather than on the identification of causes and the prevention of effects. Similarly, the concept of development has often been assimilated into that of economic growth; consequently, the tools available to monitor economic growth may be useful when analyzing various development components and their consequences. However, these tools are not suitable for analyzing causes, or, in particular, the interrelationships and synergistic effects among social, economic, and environmental components of development.
USE METHODS TOOLS
EARTH HUMAN
Driving Risk Test Consumption Pattern Life Style/PatternForces Temperature Satellite Radiometer Thermometer
Breathing Atmospheric CO2 Stethoscope
Diagnosis Anatomic Analysis Satellite Inventories Radiography/Scanner& Biochemical Analysis Water/Air Quality Blood/Urine Analysis
Forecast Biopsy Ecosystems Studies Tissues SampleMetabolic Analysis Flow Studies Excretions Sample
Responses Allopathic Limits of Emission AntibioticsHomeopathic Environmental Education Dilutions/Plants
Source: Lovelock,1992 (modified)
Table 1: Indicators for Earth and Human Medicine: Methods and Tools
Source: Lovelock, 1992 (modified) The concept of development can be incorporated into the “health” notion, as a process that implies progress and growth to achieve well being for both the individual and the society.
©Encyclopedia of Life Support Systems (EOLSS)

UNESCO-EOLS
S
SAMPLE C
HAPTER
DIMENSIONS OF SUSTAINABLE DEVELOPMENT – Sustainable Development Indicators for Decision Making: Concepts, Methods, Definition and Use - Manuel Winograd and Andrew Farrow
Another important notion is that of the “viability” of sustainability (Bossel, 1999). This could be defined as the capacity of working, functioning or developing adequately. In order to determine “health” and “viability” of the development process it is therefore necessary to design tools that identify risk factors (driving forces), perform diagnoses (assessments) and prognoses (forecasts), and generate solutions (responses) in a way similar to that of human health (Table 1). 2.1. Sustainable Development Sustainable development and sustainability have been defined in many different ways. These definitions have served many different purposes, thus the concept of sustainable development and its application has had many different scopes (de Camino and Muller, 1994; Hardi and Zdan, 1997; Moldan and Billharz, 1997; see also Basic Principles of Sustainable Development). Sustainable development is essentially a process of change that allows current human needs to be satisfied, without compromising the possibilities of future generations (WCED, 1987). It is achieved through the use and conservation of the natural resource base and the maintenance and expansion of the diversity of social, technological, and productive options (Winograd, 1995).
Figure 1: Sustainable Development: Components, Scenarios, Consequences
Nevertheless, the concept of sustainable development implies, most importantly, the consideration of spatial (i.e. “where”) and temporal (i.e. “when”) dimensions, system components (i.e. economic, social and environmental aspects), and, in particular, the interactions between these components (i.e. “why, who, how, how much”). It refers at once to a process (development) and to a condition (sustainable). Development, like all system processes, is dynamic and a function of its dimensions and components.
©Encyclopedia of Life Support Systems (EOLSS)

UNESCO-EOLS
S
SAMPLE C
HAPTER
DIMENSIONS OF SUSTAINABLE DEVELOPMENT – Sustainable Development Indicators for Decision Making: Concepts, Methods, Definition and Use - Manuel Winograd and Andrew Farrow
Sustainability, like all unbalanced system conditions, is complex and adaptive, and can be achieved via innumerable paths, yielding contrasting results for system components (Figure 1). In fact, many examples of “sustainability” can be found in nature and in human societies, with different and sometimes cruel consequences for ecosystems, species, and human populations.
Figure 2: Sustainable Development: Accessibility Domains, Goals, Ways, Scenarios
Sustainability for mankind should be analyzed from the perspective of “accessibility domains” (Bossel, 1999, Hardi and Zdan, 1997), because not everything is possible nor desirable to maintain the well being of mankind, the natural resource base, and ecological functions that allow life on Earth (Figure 2). Physical, biological, social, and cultural constraints should be taken into account when defining sustainability and the tools required for its monitoring. Laws of nature, such as the flow of energy and matter, carrying capacity, and environmental constraints, can not always be changed, eliminated,
©Encyclopedia of Life Support Systems (EOLSS)

UNESCO-EOLS
S
SAMPLE C
HAPTER
DIMENSIONS OF SUSTAINABLE DEVELOPMENT – Sustainable Development Indicators for Decision Making: Concepts, Methods, Definition and Use - Manuel Winograd and Andrew Farrow
broken, or interrupted (Bossel, 1999; Lovelock, 1992; see also Biophysical Constraints to Economic Growth). Nor is it desirable to change, eliminate, break, or interrupt cultural and social patterns, and the role played by certain values and ethics. Finally, temporal and spatial dynamics cannot be ignored, because these set the pace and direction of evolutionary and development processes (Figures 1 and 2). Although certain examples of sustainability exist for one of the system components, for example environmental sustainability based on a repressive policy of natural parks and reserves, they are not feasible from the social or economic viewpoints. For development to be sustainable, the capacities of all system components must be feasible and maintained, within the “accessibility domain” (Figures 1 and 2). As Figure 1 illustrates, development implies that system components act as open, linked balloons that are permanently fed by flows (for example, solar energy in the case of the environment, technology in the case of the economy, creativity in the case of the society). Sustainability is achieved when the flows between components (the balloons) make the system feasible because the capacities of the components are maintained. In the last few years, the concept of sustainable development has spread to all levels of society. Nevertheless, one of the crucial points from the viewpoint of the real world - and regardless of the definition of sustainable development adopted or the objectives implied - is how the concept should and can be translated from theory into practice to make it functional. Therefore the absence of, constraints, and/or threats to sustainability must be known and information made available on where we come from, where we are right now, and where we are heading with respect to certain objectives or defined criteria. In other words, we need indicators for the system and its components to determine the direction in which we are moving or should or can move. 2.2. The Decision Making Cycle Decision-making, in the development context, involves the design of a strategy, the definition of policies, and the execution of actions. Assessment and performance indicators must be used because decisions cannot be taken without information (UNEP-DPCSD, 1995). The decision making process therefore involves a series of commonly used data, statistics, and economic, social, and environmental indicators (UNEP, 1993; UNDP, 1998; World Bank, 1998; WRI, 1998). Decision making, just like development, is a dynamic process and is carried out at different levels of society, taking into account different cultural, social, economic, institutional, political, and environmental aspects. Therefore each stage of the decision-making cycle requires and uses different types of information (Figure 3). The first stage of decision making involves identifying problems and risks, and creating an awareness about them, to be able to diagnose, based on assessment indicators, the state of the society, the economy, and the environment. Problems can then be monitored to provide information that will improve the decisions taken regarding actions on specific issues. Once the problems have been identified, then policies, strategies, and actions, based on multi-sectoral integration, should be formulated. Environmental and development problems obey multiple factors and have diverse consequences, and can be approached differently in political, economic, social, and cultural terms. By seeking
©Encyclopedia of Life Support Systems (EOLSS)

UNESCO-EOLS
S
SAMPLE C
HAPTER
DIMENSIONS OF SUSTAINABLE DEVELOPMENT – Sustainable Development Indicators for Decision Making: Concepts, Methods, Definition and Use - Manuel Winograd and Andrew Farrow
equilibrium between existing and potential options, predictions can be made and a series of objectives and goals established to develop standards that can be used as reference values for implementing defined policies, strategies, and actions. The effectiveness and impact of adopted policies, strategies, and actions should also be evaluated. The fulfillment of objectives or goals and the progress made due to the measures that have been taken, also need to be evaluated in order to tailor actions and strategies, and guarantee the participation of all stakeholders. Objectives and goals should be evaluated periodically on the basis of the circumstances, evolution, and perceptions of problems. In addition to assessment indicators, performance indicators should also be defined for all stages of the decision making process (Figure 3).
Figure 3: Decision Making Cycle: Information Needed
However, the goals, objectives, and standards must be first defined and applied at the national or local level. Societies should decide what goals and objectives they want to satisfy, how, and when. Some problems are global and/or regional, requiring international cooperation and the preparation and implementation of international treaties. In this case, objectives and goals are defined by consensus, which means that indicators are jointly defined and used for the different stages and levels of decision making. 3. Methods: How to Define Sustainable Development Indicators Over millenia, humans have defined their situation in terms of wealth or plenty, in terms of indicators such as amount of land, heads of cattle, tons of grain produced, or ounces of gold. In recent years, other methods have been designed to estimate the situation of the economy, the society, and the environment, on the basis of a virtually endless number of indicators and indices (i.e. stocks of raw material, flow of materials, trends of production, market performance, financial assets, use of natural resources, etc.) (Adriaanse et al.,
©Encyclopedia of Life Support Systems (EOLSS)

UNESCO-EOLS
S
SAMPLE C
HAPTER
DIMENSIONS OF SUSTAINABLE DEVELOPMENT – Sustainable Development Indicators for Decision Making: Concepts, Methods, Definition and Use - Manuel Winograd and Andrew Farrow
1997; Rodenbourg et al., 1995; Hammond et al., 1995; United Nations, 1998). These methods, however, provide insufficient information on sustainable development, particularly regarding the viability of development, the implications of rates of change, the importance of temporal and spatial dimensions, and the contribution of each component to the system as a whole (Bartelmus, 1994; Gallopín, 1996; Hammond et al., 1995; World Bank, 1997; Winograd et al, 1998; WRI,1998). Conceptual models and frameworks are therefore needed to:
Identify components and characteristics pertinent to sustainable development. Determine and evaluate changes and characteristics of development components. Determine and evaluate the causes and effects of these characteristics on development. Assist in the preparation of development strategies, policies, and actions. Identify and assess the feasibility of the development process.
However, just as sustainable development has been defined in many ways, a large number of methods and models have been developed to define sustainability indicators. Several conceptual frameworks have been developed to guide the selection, development, and use of indicators (Bakkes et al., 1994; Hardi and Zdan, 1997; Moldan and Billharz, 1997). 3.1. The Pressure-State-Response Model The pressure-state-response (P-S-R) model organizes simple information, at the macro level, so it can be used as a format to structure and organize indicators. In theory, it implies preparing an overall causal progression of human activities that exert pressure on the environment and on natural resources, leading to changes in the environment and in society, which, in turn, generate measures or actions to reduce or prevent their impact (Friends and Raport, 1979; OCDE, 1993). In general, the use of the P-S-R model refers to a method of organizing information taxonomically and not necessarily to an interpretation of cause-and-effect (Adriaanse, 1993; OCDE, 1993). Its basic conceptual framework has therefore been adapted and expanded, to facilitate the use of indicators. For example, the Pressure-State-Impact-Response (P-S-I-R) model, similar to P-S-R, is used to define and organize a series of indicators in relation to problems or priorities at different decision-making levels (EPA, 1995; Swart et al, 1995; Winograd, 1995) (Figure 4). On the other hand, the P-S-I-R model has also been used to produce aggregated information like the Pressure Indices developed by Eurostat (Eurostat, 1999). Besides the improvements to the framework such as including the impact/effect of human activities on the environment and vice versa, the use of other information tools can help determine cause-and-effect relationships. One such case is the use of geographic information systems (GIS). These allow indicators and information to be visualized spatially, overlapped and analyzed (Winograd et al, 1998). However when the P-S-R or P-S-I-R models are used as cause-and-effect models these relationships always appears to be linear, whereas in reality the relationships between cause and effect are complex and non-linear. Furthermore, depending on the situation, on how the problem is perceived, and on the judgment of the user, one particular indicator could be an indicator of pressure, state, impact, or response, thus hindering the harmonization of the decision-making model. Within these constraints, the Pressure-State-
©Encyclopedia of Life Support Systems (EOLSS)

UNESCO-EOLS
S
SAMPLE C
HAPTER
DIMENSIONS OF SUSTAINABLE DEVELOPMENT – Sustainable Development Indicators for Decision Making: Concepts, Methods, Definition and Use - Manuel Winograd and Andrew Farrow
Impact-Response model is simple and easy to use to define and apply assessment and performance indicators. As with other models, the problems of its use are more related to the interpretation and application of information, than to limitations inherent to the model.
Figure 4: The Pressure-State-Impact-Response Model
3.2. Basic Orientors Model The theory behind this approach was developed in an effort to understand and analyze the diverging visions of the future and normative interests of different societal actors, and to define criteria and indicators for sustainable development (Bossel, 1999). This model is based on the definition of the anthroposphere as a series of interrelated systems, and attempts to measure the viability not only of each subsystem but also that of the system as a whole by defining several basic orientors (Figure 5). These orientors, as such, are not directly measurable, so appropriate indicators must be identified to measure their state. Reference values should also be explicitly established for the orientors; indicators would provide information for these values. The set of indicators selected should provide comprehensive and reliable information on the satisfaction -or lack thereof- of all orientors. Sustainable development is defined as a property of viable systems: if a system is viable in its environment, then it will be sustainable. Hence, the model first looks for orientors of viable systems. But, for a system to be viable, a set of basic orientors that are identical across all systems must be defined. These orientors can be used to develop a checklist for defining indicators for a range of diverse applications. Some basic orientors are existence, effectiveness, freedom of action, security, adaptability, coexistence, and psychological needs (Bossel, 1999). The advantage of this model is that both assessment and performance indicators can be defined and used by applying this model. However, concepts are difficult to manage and
©Encyclopedia of Life Support Systems (EOLSS)

UNESCO-EOLS
S
SAMPLE C
HAPTER
DIMENSIONS OF SUSTAINABLE DEVELOPMENT – Sustainable Development Indicators for Decision Making: Concepts, Methods, Definition and Use - Manuel Winograd and Andrew Farrow
define within this model, and objectives and goals must be clearly established, when, in reality, most countries are just beginning follow-up surveys to define policies and actions.
Figure 5: The Anthroposphere Model
3.3. Barometer of Sustainability Model The barometer model uses a performance scale. As such, it combines indicators to which the user can attach a performance value. Indicators are chosen if it is possible to define values for them that would be desirable, acceptable, or unacceptable regarding human or ecosystem well being (Prescott-Allen, 1999). The scale has two axes: one for human well being, the other for ecosystem well being (Figure 6). Conclusions about the state of the population and of the ecosystem -an index of human well being and an index of ecosystem well being- are expressed as points on their respective axes. The intersection of these points provides a reading of overall well being and progress toward sustainability. By separating human and ecosystem well being, the model ensures that an improvement in human well being does not mask a decline in ecosystem well being, or vice versa. The barometer does not allow a trade-off between human well being and ecosystem well being, reflecting a view that the human population and the ecosystem are equally important, and that sustainability is a combination of human well being and ecosystem well being. Defining the sectors of the scale extends a series of judgments that starts with definitions of sustainable development, ecosystem well being, and human well being, and continues through the choice of issues to be assessed and the selection and interpretation of indicators. It obliges users to state explicitly their assumptions about the significance of each indicator for human or ecosystem well being, and the levels of achievement that would be ideal, desirable, acceptable, unacceptable, or disastrous.
©Encyclopedia of Life Support Systems (EOLSS)

UNESCO-EOLS
S
SAMPLE C
HAPTER
DIMENSIONS OF SUSTAINABLE DEVELOPMENT – Sustainable Development Indicators for Decision Making: Concepts, Methods, Definition and Use - Manuel Winograd and Andrew Farrow
Figure 6: The Barometer of Sustainability
The barometer is mainly used to combine indicators, thus enabling users to draw broad conclusions from an array of often confusing and contradictory signals. There are two main limitations with this approach. Firstly, the main goal of the barometer is to rank regions, countries and states, which is often seen as unacceptable by many countries, institutions and individuals. Secondly, it is very difficult to integrate the spatial dimension, which makes it impossible to discover any geographical patterns or connections. 3.4. The Project-Based Model The project-based model is a very simple and pragmatic approach, as its name indicates, focuses on a project, for example a water project (World Bank, 1999). For project level indicators, the project cycle itself can help to provide a framework. This suggests the following classification of indicators (World Bank, 1999):
Input indicators: monitor the project-specific resources provided; Output indicators: measure goods and services provided by the project; Outcome indicators: measure the immediate, or short-term, results of project
implementation; Impact indicators: monitor the longer term or more pervasive results of the project.
Note that while the input-output-outcome-impact approach distinguishes theoretically between project outputs and project outcomes, in many circumstances the practical distinctions are unclear. For this reason the proposed framework speaks of ‘outcome’ indicators, including both output and outcome indicators. The project- based model is depicted in Figure 7.
©Encyclopedia of Life Support Systems (EOLSS)

UNESCO-EOLS
S
SAMPLE C
HAPTER
DIMENSIONS OF SUSTAINABLE DEVELOPMENT – Sustainable Development Indicators for Decision Making: Concepts, Methods, Definition and Use - Manuel Winograd and Andrew Farrow
Figure 7: The Project-Based Model
In this framework, the project has both overall project objectives it is designed to meet (for example, an increase in access to safe water) and components by which the implementation of the project proceeds (for example, installation of water monitoring stations). The implementation of these components, combined in complex ways, leads to the desired project impacts, but they may also result in negative externalities, that is, adverse environmental effects. Indicators are then developed for both the overall project objectives and the components: impact indicators relate to the stated objectives of the project (for example percent urban and/or rural population with access to safe water), while outcome indicators relate to the components (for example, number of water monitoring stations installed, and preferably an indicator that assesses water quality). The dotted lines in Figure 7 denote the very important linkage between objective or component and its corresponding indicator. In the same way that the project components are closely linked to the overall objectives of the project, the outcome and impact indicators should be related. The framework also includes baseline indicators, which monitor aspects viewed within the project's context. Although this model helps define assessment and performance indicators, its application is limited to institutions that work on a project basis, and its usefulness is restricted mostly to sectoral problems. 3.5. Problems and Components Model In view of the methodological deficiencies and problems of different models of aggregation and selection of indicators, many researchers, institutions, and governments prefer to select a fast and pragmatic way to define their own sets of indicators, which consist of listing indicators based on problems, issues and/or components that should be tackled. The model seeks to identify first the development problems and/or basic components that should be measured, and then the corresponding indicator or set of
©Encyclopedia of Life Support Systems (EOLSS)

UNESCO-EOLS
S
SAMPLE C
HAPTER
DIMENSIONS OF SUSTAINABLE DEVELOPMENT – Sustainable Development Indicators for Decision Making: Concepts, Methods, Definition and Use - Manuel Winograd and Andrew Farrow
indicators (CIAT-World Bank-UNEP, 1999; World Bank, 1998). Although these models have proved very useful when assessing and monitoring development efforts, they do not always have defined goals and reference values. In fact, these models are often used to define these values. The drawback with these models is that indicators are occasionally derived without any systemic conceptual framework, often reflecting the orientation of experts or institutions. The sets of indicators may be detailed for certain disciplines or problems, while nonexistent for others that are equally important or interesting. 3.6. Aggregation Models The fascination and temptation of using a single indicator or index, as in the case of economic growth to measure sustainability, has led several institutions and governments to define aggregate indicators and indices that attempt to display a more realistic picture of the state of well being, progress, and viability of development. Examples of these models are the Index of Sustainable Economic Welfare, the Wealth of Nations Indicator, the Human Development Index (HDI), and the Ecological Footprint (UNDP, 1998; Moldan and Billharz, 1997; Rodenbourg et al, 1995; Wackernagel and Rees; 1996; World Bank, 1997). The Ecological Footprint, for example, converts all variables into the surface area per capita needed to maintain human activity (Wackernagel and Rees, 1996). Although it has proved to be an excellent indicator of the environmental impact of human activity, this model does not harness, for example, the social aspects of development. Although important methodological advances have been made, these aggregate indices and indicators cannot hide their serious deficiencies and deficits in certain sectors (i.e. HDI regarding the environment). Nor can they add data presented in different units and measurements, or include value judgments on development. This is why many proposals argue that simple indicators should be used instead of trying to cover deficiencies by developing complex indices and aggregations that are difficult both to develop and to use (Bossel, 1999; Winograd et al, 1998). In many cases, however, the problem does not lie with the aggregate index or indicator, but with the use and scope it is given. The dynamics of development relationships involve a series of interactions between society and environment, in which cause-and-effect relationships may be direct, indirect, nonlinear, and/or have synergistic effects. The existence of these types of relationships implies that, in many cases (for example, land use), information relevant to sustainability will be best provided by combining values with a set of indicators, or by the “complete picture” as shown by the entire set of indicators, not just by the sum or aggregation of these indicators (Gallopín, 1996). 4. Methods: How to Use Sustainable Development Indicators? The methods and models to define indicators are important, but several other issues that go beyond the simple definition and selection of an indicator set are also important. These are related to information. 1) The first aspect relates to the type of data needed to develop indicators. In theory, the
©Encyclopedia of Life Support Systems (EOLSS)

UNESCO-EOLS
S
SAMPLE C
HAPTER
DIMENSIONS OF SUSTAINABLE DEVELOPMENT – Sustainable Development Indicators for Decision Making: Concepts, Methods, Definition and Use - Manuel Winograd and Andrew Farrow
information pyramid indicates that a very large set of primary data is needed to obtain certain analyzed data (Hammond et al., 1995). Indicator sets can be defined based on this information and, by aggregation, a reduced number of indices obtained (Figure 8a). The truth is, however, that this pyramid is inverted: a large number of indicators and indices can in fact be generated from limited data (Figure 8b). When selecting a conceptual framework and a set of indicators, the following aspects should be considered: data availability and quality; cost-effectiveness of developing indicators; and the resources needed to visualize and use the information (Winograd et al., 1998).
Figure 8: The Information Pyramid
2) A second issue relates to the characteristics of information, which should be understandable and easy to use. Models and indicator sets should be as clear and simple as possible, without implying oversimplification (Bakkes et al., 1994; Bossel, 1999). Figures 1 and 2 show that we should not expect to find a single sustainable development process, but several potential paths. Accordingly, it would be impossible, or seriously contradictory, to try to define a unique set of indicators or a universal index of sustainability. To do so, the complexity of existing situations within the development process would have to be eliminated and the diversity of options needed to monitor development restricted. 3) A third issue relates to information use. A set of indicators should yield development signs or symptoms – in other words, should indicate the sustainability or non-sustainability of development – and should facilitate monitoring. Reference values are therefore needed. The set of indicators and the model adopted should enable the user to recognize patterns, identify priorities, define policies, and implement actions. 4) A fourth important issue relates to information synthesis and aggregation. Aggregation of information is necessary to generate indices, but can hide important aspects or reflect momentary considerations. Many of the existing aggregated indices and models reflect only a few issues, in particular impact and effects. Many institutions and researchers therefore prefer to work with sets of broad, problem-based indicators. But the result is a
©Encyclopedia of Life Support Systems (EOLSS)

UNESCO-EOLS
S
SAMPLE C
HAPTER
DIMENSIONS OF SUSTAINABLE DEVELOPMENT – Sustainable Development Indicators for Decision Making: Concepts, Methods, Definition and Use - Manuel Winograd and Andrew Farrow
syndrome of lists of indicators without any supporting logical or conceptual framework that, in many cases, treat some topics in depth while showing great ignorance in others. 5) The last issue is critical and relates to information users. Sets of indicators and models are often used for purposes different from those for which they were defined, thus affecting their usefulness and applicability. In other cases, the dimensions and components necessary for application are not taken into account. Only with the appropriate use of the appropriate information tools can the user obtain a good understanding of the usefulness of models and sets of indicators. 4.1. Indicator Selection Criteria The definition and use of indicators inevitably involves a difficult selection process that will be somewhat arbitrary. Not everything should be measured and not everything can be monitored. Therefore, the correct definition and use of a set of sustainability indicators will depend on clear selection criteria. In general these criteria can be defined in relation to data that should be used to develop indicators, required indicator characteristics, and usefulness of indicators for users (Bakkes et al, 1994; Moldan and Billharz, 1997; Rump, 1995; Winograd et al, 1998, World Bank, 1999). The following criteria should be considered when assessing data:
High quality and reliability Availability Appropriate spatial and temporal scale Cost of collection
Criteria to be considered regarding indicator characteristics are:
Measurability Relevance Representativeness Sensitivity to changes Specificity Clear cause-and-effect links Targets and baselines Cost of development
Criteria to be taken into account regarding usefulness are:
Validity Limitation in number Clarity in design Applicability Non-redundancy Interpretation Retrospectivity-Predictivity
©Encyclopedia of Life Support Systems (EOLSS)

UNESCO-EOLS
S
SAMPLE C
HAPTER
DIMENSIONS OF SUSTAINABLE DEVELOPMENT – Sustainable Development Indicators for Decision Making: Concepts, Methods, Definition and Use - Manuel Winograd and Andrew Farrow
4.2. Temporal and Spatial Dimensions It is clear that development problems have dynamic temporal and spatial characteristics (Holmberg, 1995). However, the complexity of the relationships between society and environment requires that these spatial and temporal characteristics be considered jointly. Many problems that were specific at the local level several decades ago have now become regional and global problems (for example: in the case of the environment, climate change; in the case of development, trade). Similarly many environmental problems do not arise from an identified source, but from many, small, diffuse sources (for example, urban pollution). This change in the nature and scale of problems shortens the time of impact while increasing the dimension of the impact (for example, modifications in land use have a major impact within the watershed and on water supply) (Figure 9). The causal chain of these problems is increasingly complex, with an endless number of interactions and interrelationships that, in many cases, have just been recognized and are under study.
Figure 9: The Changing Character of Development Problems
The use of ecological and political frontiers as work units to monitor development and decision making is essential for analysis at the systems level, and for the determination of the interactions between environmental, economic and social components. It is increasingly clear that many development problems cannot be covered and resolved at the political-administrative level only, because the impact of human or natural disturbances may transcend national frontiers. In which case, when preparing environmental information, different and more appropriate levels or scales must be sought (Winograd, 1997) (Figure 10). The effectiveness of responses, actions, and management strategies is profoundly influenced by the definition and recognition of spatial frontiers in order to monitor development. For instance, the issue of climate change has been identified at the global level, while policies are defined at the national level and applied at the local level (Figure 10). The world's socioeconomic and environmental heterogeneity makes it difficult to analyze regions as simple units. Regions can be classified from an economic, a social, or an environmental viewpoint. However, to analyze and monitor development processes, the
©Encyclopedia of Life Support Systems (EOLSS)

UNESCO-EOLS
S
SAMPLE C
HAPTER
DIMENSIONS OF SUSTAINABLE DEVELOPMENT – Sustainable Development Indicators for Decision Making: Concepts, Methods, Definition and Use - Manuel Winograd and Andrew Farrow
state of the environment and the use of natural resources, regions should be classified from a broader perspective. Thus it will be possible to highlight not only socioeconomic differences but differences in the natural resource base, the role these resources play in the economy, and the types of human activities. From this perspective, regions can be used as political units of increasing integration within which development policies and strategies are designed. National frontiers can be used as administrative units in which political decisions orienting development are made and defined. Municipal and state units can be used as administrative areas in which policies are applied and development activities executed. Life zones or eco-regions can be used as areas with common ecological and production characteristics, in which the resource base for development is found and development activities and policies conducted. Finally, watersheds and ecosystems are local units that serve as pilot areas and in which the causes and outcomes of certain development policies can be visualized, tested or demonstrated in the short term.
Figure 10: Sustainability Indicators: Scales and Uses
4.3. Synthesis, Aggregation, and Visualization of Information In addition to the aspects already mentioned, information production should be analyzed from the users' perspective. For example, specialists need detailed information on different aspects related to development to be able to establish and quantify the state and trends of the environment, determine the cause and magnitude of problems, and predict the possible new impact of human activities and environmental changes. On the other hand, decision-makers and the general public are not necessarily interested in or capable of using all the information produced, and usually need only parts of this information. The design of a set of indicators should respond to a range of uses and users, given the production of both detailed information (data, statistics, and simple indicators) and aggregate information
©Encyclopedia of Life Support Systems (EOLSS)
UNESCO-EOLS
S
SAMPLE C
HAPTER
DIMENSIONS OF SUSTAINABLE DEVELOPMENT – Sustainable Development Indicators for Decision Making: Concepts, Methods, Definition and Use - Manuel Winograd and Andrew Farrow
(aggregate indicators and indices). But the concept of sustainable development implies integrating information from different disciplines and topics, where it is not enough to simply add up data. Special attention must be paid to the interactions and interrelationships between the different components, and to the way information is aggregated and presented (O'Connor, 1995). There should be clarity regarding methods and conventions, so as to make the preparation, dissemination, and use of information more efficient and effective. The difficulties of interpreting, communicating and transmitting interdisciplinary and multidisciplinary information mean that different communication media and tools need to be used in order to respond to different user needs. Numeric data, in the form of tables and statistics, can be used for some topics and problems, but in other cases, analyses in textual form must be used because the conventions and perceptions of topics and problems are not limited to quantitative aspects. For still other topics and problems, information should be transmitted via maps, because the temporal and spatial dimensions are important (Figure 11). For example, in Figure 11 the information for development components (economic, social and environmental circles) could be based on tabulated data, imagery or text. Nevertheless, the interaction of different components (intersection zones in Figure 11) implies that information based on data, imagery and text must incorporate the temporal and spatial dimensions of the development process, as well as the needs and perspectives of the intended users.
Figure 11: Development Components: Type of Information and Tools The geographic information system (GIS) is a useful and necessary tool to apply and develop indicators (Winograd and Eade, 1997). It allows the integration of the temporal
©Encyclopedia of Life Support Systems (EOLSS)

UNESCO-EOLS
S
SAMPLE C
HAPTER
DIMENSIONS OF SUSTAINABLE DEVELOPMENT – Sustainable Development Indicators for Decision Making: Concepts, Methods, Definition and Use - Manuel Winograd and Andrew Farrow
and spatial dimensions, and yields a more realistic analysis of the causes and consequences of development problems. For example, in the case of population, the use of traditional indicators such as population growth, population density, and population distribution, which are only based on tabulated data, do not provide information on where the population or community is located. By integrating data in a geo-referenced database, not only can the location of the population be determined, but its distribution and the sites of major population increase can also be analyzed. 5. Definition of Sustainable Development Indicators: Examples of Application Methods and models to define indicator sets are useful only if they can be applied to produce information for policy-making. As a practical guide to the definition of indicators of sustainable development, several examples are presented in this section. They cover the range from a compact set of indicators at global and regional levels to an extensive set of indicators at national, local and sectoral levels. It is important to note that these are examples of possible applications, and should not be considered as ideal methods and models to define indicators. 5.1. Indicator Set at the Global Level Table 2 shows how to define a simple set of indicators and indices to recognize patterns at the global level using the components-based model.
Economy:
Real GDP per capita (Purchase Power Parity Based) Wealth per capita
Distribution of Human Settlements and Infrastructure Society:
Human Development Index Population below Poverty Line
Distribution of Population
Environment: Water Vulnerability Index
Domesticated/Non Domesticated Land Energy Consumption per capita
Sources: WRI,1998; World Bank,1998
Table 2: Global Indices/Indicators by Components: Recognizing Patterns
Sources: WRI, 1998; World Bank, 1998 5.2. Indicator Set at the Regional Level Table 3 shows how to define a more complete set of indicators and indices at the regional level to recognize patterns and identify priorities using the components and
©Encyclopedia of Life Support Systems (EOLSS)

UNESCO-EOLS
S
SAMPLE C
HAPTER
DIMENSIONS OF SUSTAINABLE DEVELOPMENT – Sustainable Development Indicators for Decision Making: Concepts, Methods, Definition and Use - Manuel Winograd and Andrew Farrow
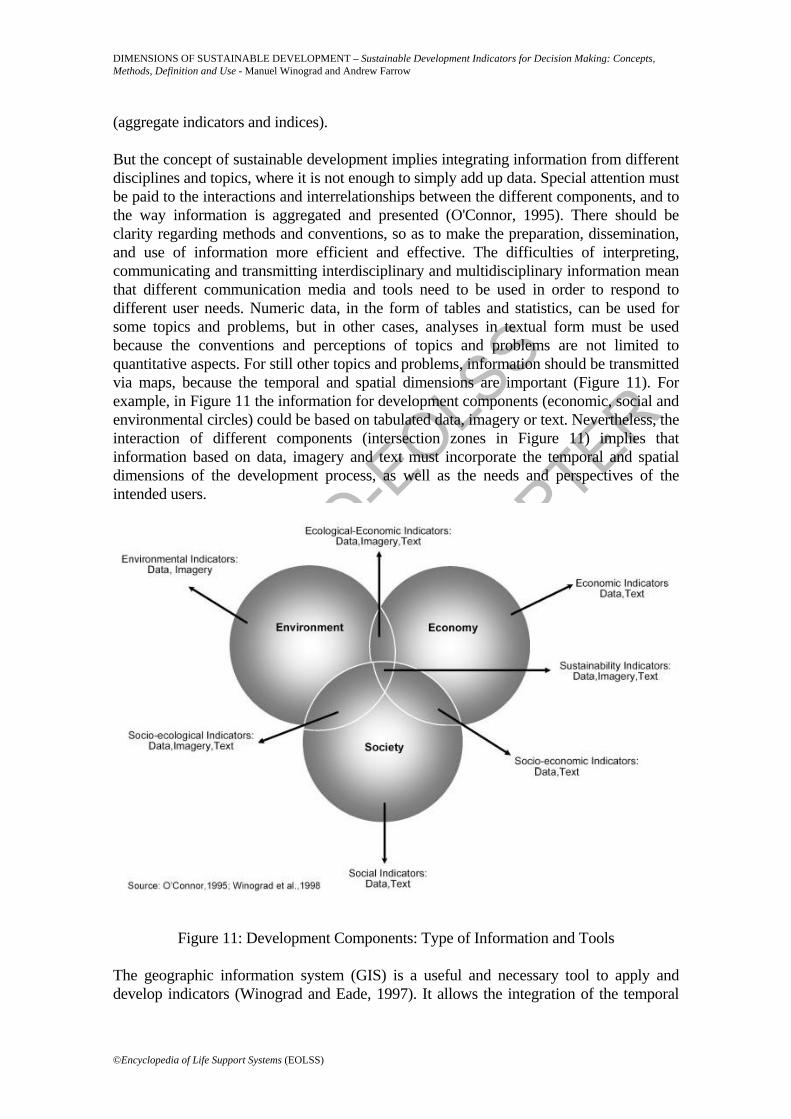
problems-based model. 5.3. Indicator Set at the National Level Table 4 shows how to define a set of indicators at the national level to recognize patterns, identify priorities and define policy using the Pressure-State-Impact-Response based model. 5.4. Indicator Set at the Local Level Table 5 shows how to define a more complex set of indicators at the local level to recognize patterns, identify priorities, define policy and apply actions using the Orientors based model. 5.5. Indicator Set at the Sectoral Level Table 6 shows how to define a set of indicators for a sector to recognize patterns, identify priorities, define policy and apply actions using the Project based model.
Components
Social: Human Development Index Economic: Wealth per capita
Environment: Land Use Index Socio-Economic: Accessibility Index
Economic-Ecologic: Night Light Index Socio-Ecologic: Climatic Risk Index
Problems
Land Use: Land Use Index Agriculture: Index of Food Production
Forests: Forest Surface/Fragmented Forest Ratio Water: Water Vulnerability Index
Biodiversity: Domesticated/Non Domesticaded Ratio Coastal/Marine Resources: Fishery Reserve/Production Ratio
Atmosphere: Greenhouse Gases Index Energy: Night Light Index
Materials: Percentage of Materials Recycling Waste: Per capita Waste Generation
Social Dynamic: Human Development Index Economic Dynamic: Wealth per capita
Infrastructure: Accessibility Index Natural Events: Climatic Risk Index
Source: CIAT-World Bank-UNEP,1999a
Table 3: Regional Indices/Indicators by Components and Problems for Latin America and the Caribbean: Recognizing Patterns and Identifying Priorities
©Encyclopedia of Life Support Systems (EOLSS)
UNESCO-EOLS
S
SAMPLE C
HAPTER
DIMENSIONS OF SUSTAINABLE DEVELOPMENT – Sustainable Development Indicators for Decision Making: Concepts, Methods, Definition and Use - Manuel Winograd and Andrew Farrow
Category Problem
Pressure State Impact Response
1. Land Use 1.Land Use Changes 2.Actual Land Use 3. Soils Degradation 4. Land Use Projections
2. Agriculture 5. Gini Coefficient of Land Tenure
6.Crops Surface/ Production
7. Pesticides/ Fertilizers Use
8. Potential Agriculture Yields
3. Forests 9. Annual Deforestation
10. Forest Surfaces 11. Forest Fragmentation
12. Reforested/ Rehabilitated Forest Surfaces
4. Fresh Water 13. Annual Sectoral Withdrawals
14. Water Consumption per capita
15. Water Availability per capita
16. Population with Access to Safe Water
5. Biodiversity 17. Conservation Condition
18. Non Domesticated Land
19. Ecoregions Needed for Conservation
20. Protected Areas
6. Coastal/Marine Resources
21. Annual Fisheries Catch
22. Mangroves/ Coral reefs Areas
23. Population in Coastal Areas
24. Marine/Coastal Protected Areas
7. Atmosphere 25. Fire Location 26. Greenhouse Gases Emissions by Activity
27. Greenhouse Gases Emissions per capita
28. Participation in Treaties and Conventions
8. Energy 29. Energy Consumption per capita
30. Hydroelectric Generation
31. Dams Efficiency 32. Hydropower Potential
9. Materials 33. Consumption of Materials per capita
34. Proven Reserves of Minerals and Oil
35. Reduction of Reserves of Mineral/Oil as % of Proven Reserves
36. % of Recycled Materials
10. Waste 37. Generation of Municipal Waste per capita
38. Waste Disposal 39. Import/Export of Dangerous Waste
40. Recycled Domestic/Industrial Waste
11. Social Dynamic 41. Population Distribution
42. Literacy Rate 43. Population in Poverty
44. Population Projections
12. Economic Dynamic
45. Structure of Production/Demand
46. Structure of Employment
47. Unemployment Rate
48. Structure of Exports
13. Infrastructure 49. Communication Network
50. Population with Access to Services
51. Infrastructure Distribution
52. GNP in Infrastructure
14. Natural Events 53. Frequency of Natural Disasters
54. Population Affected by Natural Disasters
55. Economic/ Human Losses Due to Natural Disasters
56. Susceptible Areas to Natural Disasters
Source: Source: CIAT-World Bank-UNEP,1999a
Table 4: Pressure-State-Impact-Response indicators for Central American Countries: Recognizing Patterns, Identifying Priorities and Defining Policies
©Encyclopedia of Life Support Systems (EOLSS)

UNESCO-EOLS
S
SAMPLE C
HAPTER
DIMENSIONS OF SUSTAINABLE DEVELOPMENT – Sustainable Development Indicators for Decision Making: Concepts, Methods, Definition and Use - Manuel Winograd and Andrew Farrow
Orientor
Subsystem
Subsystem Performance
Contribution to Total
System Existence Human
Support Natural
Children living in poverty - -
Low birthweight infants - -
Effectiveness Human Support Natural
Health care expenditures Residential water consumption Impervious surfaces
Distribution of personal income Work required for basic needs Solid waste generated and recycled
Freedom of action
Human Support Natural
High school graduation Real unemployment Renewable and nonrenewable energy use
Housing affordability ratio Voter participation Farm acreage
Security
Human Support Natural
Employment concentration Community capital Soil erosion
Juvenile crime Emergency room use for non-ER purposes Pollution prevention and renewable resource use
Adaptability Human Support Natural
Adult literacy Library and community centre usage Biodiversity
Youth involvement in community service Vehicle miles traveled and fuel consumption Wetlands
Coexistence Human Support Natural
Volunteer involvement Air quality Wild salmon
Ethnic diversity of teachers Asthma hospitalization rate for children Population
Psychological needs
Human Support Natural
Equity in justice Pedestrian friendly streets Gardening activity
Neighborliness Perceived quality of life Open space in urban villages
Source: Bossel,1999 Table 5: Indicators of Sustainable Development for the City of Seattle based on the
Orientors Framework: Recognizing Patterns, Identifying Priorities and Defining Policies.
Baseline/Output Indicators Outcome/Impact Indicators Water Use/Demand Water recycling potential (%) Use efficiency (%) Water annual extraction per capita (m3) Population with access to potable water (%) Water annual extraction by sector (%) Number of aqueducts (#) Water total demand (m3) Water price (US/m3) Hydroelectricity Generation Dams (#, location) Kilowatts per hectare inundated (kW) Hydroelectricity production (mw) Water Emissions/Quality N emissions (kg) Biological oxygen demand (mg L-1)
©Encyclopedia of Life Support Systems (EOLSS)

UNESCO-EOLS
S
SAMPLE C
HAPTER
DIMENSIONS OF SUSTAINABLE DEVELOPMENT – Sustainable Development Indicators for Decision Making: Concepts, Methods, Definition and Use - Manuel Winograd and Andrew Farrow
Other emissions (kg) Chemical oxygen demand (mg L-1) Eutrophication Treatment of used waters (%) Acidification Access to drains (%) Toxicity/Heavy metal concentration People affected by diarrheic diseases (#) Colibacilli (m L-1) Water Availability Water reserves (m3) Water annual extraction (as % of total) Rate of recharge (m3 yr-1) Annual rainfall (mm) Population Risk Population risking inundation (#) Population affected by inundation (#) Capital risking inundation ($) Water Protection Watershed land use (ha) Watershed protected area (ha)
Source: CIAT-World Bank-UNEP,1999b
Table 6: Water Sector Indicators for the Projects Model Framework: Recognizing Patterns, Identifying Priorities, Defining Policies and Applying Actions
6. The Use of Sustainable Development Indicators: Examples of Application The use of the information produced, based on the different models, indicator sets and tools, is the key issue for policy-making. As a practical guide to the use of indicators of sustainable development, several examples are presented in this section. They range from the use of tabulated data and/or spatial data to develop and use a single indicator, to indicator sets based on different models. The main goal of this section is to show the importance of the methods selected in order to get the most from the available information. As in the previous section, it is important to note that these are examples of possible applications and should not be considered as the only ways to use indicators. 6.1. Tabulated Data Approach Traditionally the methods to visualize and use indicators for policy-making are tables, charts and figures showing data trends and evolution in time. Nevertheless the use of other tools allows users to obtain more information from the same data and indicator. For example, Figure 12 shows the dynamic of a single indicator, GDP per capita, at the national level using traditional tabulated data time series and the “cartograms” approach (Jackel, 1997). This approach helps the user to visualize the spatial dimension of the indicator. The use of cartograms is further enhanced when the temporal changes can be seen spatially as an animation sequence. Figure 13 also shows the change over time for a set of development indicators at the regional level using the components-based model. In this figure it is difficult to analyze the temporal changes in all of the indicators simultaneously when they are displayed in a table. However by using other means to show and use the information, like the “development radar”, the analysis could show not only the changes in values of
©Encyclopedia of Life Support Systems (EOLSS)

UNESCO-EOLS
S
SAMPLE C
HAPTER
DIMENSIONS OF SUSTAINABLE DEVELOPMENT – Sustainable Development Indicators for Decision Making: Concepts, Methods, Definition and Use - Manuel Winograd and Andrew Farrow
individual indicators, but also trends and evolution of the components as well as the path followed by the development process as a whole.
Figure 12: Dynamics of a Single Indicator at National Level: GDP per capita for Latin
American Countries in Tabulated Data and “Cartograms”
Figure 13: Dynamics of an Indicator Set at the Regional Level by Components:
Indicators for Latin America in Tabulated Data and “Development Radar”
©Encyclopedia of Life Support Systems (EOLSS)

UNESCO-EOLS
S
SAMPLE C
HAPTER
DIMENSIONS OF SUSTAINABLE DEVELOPMENT – Sustainable Development Indicators for Decision Making: Concepts, Methods, Definition and Use - Manuel Winograd and Andrew Farrow
6.2. Geo-referenced Data Approach The tabulated and geo-referenced approaches are not mutually exclusive but complimentary. The tabulated approach is mostly related to the change in the value of indicators over time. However, the assessment of sustainable development requires a consideration of changes in both time and space. Figure 14 shows a comparison between the tabulated approach and the spatial approach for a single indicator at the regional level. The example shows clearly the advantage of analyzing the location of an indicator, in this case of infrastructure, in comparison to tabulated data alone.
Figure 14: Location of a Single Indicator at the Regional Level: Tabulated Infrastructure Indicator for Central America and “Infrastructure Map”
In order to ensure that information is used beneficially for policy-making it is essential to build a complete picture of the development process, rather than relying on a single indicator. Figure 15 shows the location of an indicator subset at national level using a components-based model to analyze environmental issues. This example shows the accessibility index for the economic component, deforested areas for the environmental component, and population in poverty for the social component in the case of Honduras. The indicators are in geo-referenced form, enabling users to analyze and determine the relationships between indicators (i.e., accessible areas and deforestation, deforestation and poverty, poverty and accessible areas).
©Encyclopedia of Life Support Systems (EOLSS)

UNESCO-EOLS
S
SAMPLE C
HAPTER
DIMENSIONS OF SUSTAINABLE DEVELOPMENT – Sustainable Development Indicators for Decision Making: Concepts, Methods, Definition and Use - Manuel Winograd and Andrew Farrow
Figure 15: Location of Indicators at the National Level by Components: Economic (Accessibility Index), Environmental (Deforested Areas) and Social (Population in
Poverty) Indicators for Honduras
Figure 16: Location of Land Use Indicator Set at Local Level by Pressure-State-Impact-Response: Indicators for Pucallpa (Peru)
©Encyclopedia of Life Support Systems (EOLSS)

UNESCO-EOLS
S
SAMPLE C
HAPTER
DIMENSIONS OF SUSTAINABLE DEVELOPMENT – Sustainable Development Indicators for Decision Making: Concepts, Methods, Definition and Use - Manuel Winograd and Andrew Farrow
Figure 17: Location and Dynamics of a Single Indicator at the Regional Level: Land Use Changes in Central America
Figure 18: Location and Dynamics of a Single Indicator at the National Level: Accessibility Index Before and After Hurricane Mitch in Affected Countries
©Encyclopedia of Life Support Systems (EOLSS)

UNESCO-EOLS
S
SAMPLE C
HAPTER
DIMENSIONS OF SUSTAINABLE DEVELOPMENT – Sustainable Development Indicators for Decision Making: Concepts, Methods, Definition and Use - Manuel Winograd and Andrew Farrow
Glossary Indicator: Measure that makes phenomena and trends detectable or perceptible. A
variable selected to transmit information about the condition and trends of a system. The results obtained from the monitoring of indicators analytically extend beyond those directly associated with a data value.
Index: An aggregated or weighted indicator based on several other indicators and/or data.
Information: The result of analyses of indicators, or indices; the objective of information is to be policy relevant.
Geographic Information Systems (GIS):
A set of tools for spatial analysis that permit the manipulation of tabulated data, spatial (or geo-referenced) data and indicators.
Model: A representation or simulation to help organize information about a problem or set of problems.
Primary data:
The basis for indicators, indices, and information. The data itself usually cannot be used for interpreting changes or conditions.
Statistics: Primary data in time series. Spatial: Relating to space as distinguished from time. In the context of indicators,
the spatial dimension is related to “where” things happen. Temporal: Relating to time as distinguished from space. In the context of indicators,
the temporal dimension is related to “when” things happen. Bibliography Adriaanse A. et al.,1997, Resources Flows: The Material Basis of Industrial Economies, World Resources Institute, Washington, D.C.. [Description of an indicator approach based on materials and resources use with case studies in different countries].
Adriaanse A.; 1993; Environmental Policy Performance Indicators, General of Environment of the Dutch Ministry of Housing, VROM, The Hague, The Netherlands. [First attempt showing the use of environmental indicators to measure performance and progress in policy and decision making].
Bakkes J. A., van den Born G., Helder J., Swart R., Hope C., Parker J.; 1994; An Overview of Environmental Indicators: State of the Art and Perspectives, Environment Assesment Technical Reports RIVM in co-operation with The University of Cambridgeand, UNEP-RIVM. [An assessment of the state of the art regarding different initiatives and frameworks to develop and use environmental indicators in the context of sustainable development].
Bartelmus P;1994; Toward a Framework for Indicators of Sustainable Development, Working Paper series # 7, Department of Economic and Social Information and Policy Analysis, ST/ESA/1994/WP.7, United Nations, New York. [The perspective from economic science to develop and use sustainability and environmental indicators].
Bossel H.; 1999; Indicators for Sustainable Development: Theory, Method, Application, Report to the Balaton Group, IISD, Winnipeg, Canada. [An integrative approach to develop and use sustainability indicators at different levels of decision].
CCME; 1994; A Framework for Developing Goals, Objectives and Indicators for Ecosystem Health: Tools for Ecosystem-Based Management, Water Quality Guidelines Task Group and the Canadian Council of Ministers of the Environment. [An approach to develop sustainability indicators based on ecosystems goods and services].
©Encyclopedia of Life Support Systems (EOLSS)

UNESCO-EOLS
S
SAMPLE C
HAPTER
DIMENSIONS OF SUSTAINABLE DEVELOPMENT – Sustainable Development Indicators for Decision Making: Concepts, Methods, Definition and Use - Manuel Winograd and Andrew Farrow
CIAT, The World Bank and UNEP, 1999a, Rural Sustainability Indicators: Outlook for Central America, http://www.ciat.cgiar.org/indicators/index.htm [Description of the framework to develop and use sustainability indicators at regional, national and local levels of decisions].
CIAT, The World Bank and UNEP, 2000, Developing Indicators: Experience from Central America, Toolkit Folder, The World Bank, Washington, D.C. http://www.ciat.cgiar.org/indicators/index.htm [A complete publication package that contains CD with georeferenced indicators and information, examples of application at different scales and lessons learned].
CIAT, The World Bank and UNEP,1999b, Conceptual Framework to Develop and Use Water Indicators, Technical Note prepared by Manuel Winograd, Marta Aguilar, Andrew Farrow (CIAT) and Lisa Segnestam, Michael Linddal, John Dixon (World Bank), http://www.ciat.cgiar.org/indicators/wbank/news.htm [Description of a framework and indicators set to develop and use indicators in the case of sectoral approach].
de Camino R., S. Muller ;1993; Sostenibilidad de la Agricultura y los Recursos Naturales: Bases para Establecer Indicadores, Proyecto IICA-GTZ, Serie Documentos de Programas # 38, IICA, Costa Rica, 133 pp. [Description of a practical development to develop and use sustainability indicators for agriculture and natural resources management].
DPCSD; 1996; Indicators of Sustaniable Development: Framework and Methodologies, United Nations, New York. [Technical sheets describing how develop and use sustainability indicators in the context of the Pressure-State-Response framework].
EPA; 1995; A Conceptual Framework to Support the Development and Use of Environmental Information for Decision-Making, Environmental Statistics and Information Division, Office of Policy, Planning and Evaluation, EPA 230-R-95-012. [Description on the development and use of environmental indicators to support decisions].
EUROSTAT,1999, http://www.europa.eu.int/. [Description of initiatives to develop and use environmental indicators and information to help decision making and monitor development process].
Farrow A., M. Winograd, 1999, Land Use Modeling at the Regional Scale: an input to Rural Sustainability Indicators for Central America, paper presented at Workshop on Current Progress in Quantifying Spatially Explicit Causes and Effects of Land Use/Cover Change: Examples from Different Parts of the World, Wageningen University, Wageningen, The Netherlands, 7-8 December 1999. [Good example of application about the use of indicators and scenarios for policy and decision-making].
Farrow A., Winograd M., 2001, Land Use Modelling at the Regional Scale: an input to Rural Sustainability Indicators for Central America, In: Veldkamp, A., Lambin, E. (Eds.), Modelling land use/cover change from local to regional scales. Agriculture, Ecosystems and Environment. 85 (1-3):249 –268 [Good example of application about the use of indicators and scenarios for policy and decision-making].
Friends A., Raport D.; 1979; Towards a Comprehensive Framework for Environment Statistics: A Stress-Response Approach, Statistics Canada, Ottawa, Canada. [First attempt to define a framework to develop and use environmental indicators].
Gallopín G.; 1996; Environmental and Sustainability indicators and the Concept of Situational Indicators: A Systems , Environmental Modeling and Assessment 1(3)101:118.[Description of a framework to develop and use indicators and the need to integrate environmental, social and economic information].
Hammond A., Adriaanse A., Rodemburg E., Bryant E., Woodward R.; 1995; Environmental Indicators: A Systematic Approach to Measuring and Reporting on Environmental Policy Performance in the Context of Sustainable Development, World Resources Institute, Washington, D. C..[Description on the needs to integrate environmental indicators to measure and reporting sustainability progress].
Hardi P., T. Zdan (Editors), 1997, Assessing Sustainable Development: Principles in Practice, IISD, Winnipeg, Canada.[Assessment and description on the practical principles to develop and use frameworks and indicators].
©Encyclopedia of Life Support Systems (EOLSS)

UNESCO-EOLS
S
SAMPLE C
HAPTER
DIMENSIONS OF SUSTAINABLE DEVELOPMENT – Sustainable Development Indicators for Decision Making: Concepts, Methods, Definition and Use - Manuel Winograd and Andrew Farrow
Holmberg J.; 1995; Socio-Ecological Principles and Indicators for Sustainability, Institute of Physical Resource Theory, Goteborg, Sweden.[Good description about the need to integrate social, economic and environmental information to assses progress toward sustainability].
Hughes J.D., 1973, Ecology of Ancient Civilizations, The University of New Mexico Press, Albunquerque.[Description on the perception and use of concepts, natural resources management and its implication on the societies].
IFEN; 1996; Indicateurs de Performance Environmentale de la France, Institue Francais de l’Environment, Diffusion Lavoisier, TEC & DOC, Paris, France.[Application and use of environmental indicators to assess progress toward sustainability].
Jackel C., 1997, Using Arcview to Create Contigous and Noncontigous Area Cartograms, Cartography and Geographic Information Systems, 2(2)101:109.[Some practical implications about the use of GIS to produce information].
Loh J. (Editor),2000, Living Planet Report, Published by World Wildlife Fund, World Conservation Monitoring Centre, Redefining Progress and The Center for Sustainable Studies, A Banson Production, London UK. [Good example of application of methods to measure the state of the world, with tabulated data and examples for all countries].
Lovelock J., 1992, Healing GAIA: Practical Medicine for the Planet, Harmony Books, New York.[An innovative approach to deal with changes and impacts in the environment and its implication for humankind and the planet].
Moldan B., S. Billharz (Editors);1997; Sustainability Indicators: Report of the Project on Indicators of Sustainable Development, John Wiley & Son, Sussex, England.[A complete state of the art compendium on the development and use of environmental and sustainability indicators].
OCDE; 1993; OECD Core Set of Indicators for Environmental Performance Reviews, Environmental Monograph # 83, OCDE, Paris, France. [Compendium of environmental indicator development and use to assess progress towards sustainability].
O'Connor J.; 1995; Coping with Complexity, Paper presented at 50 Session of ISI (International Statistical Institute), 21-29 August, 1995, Beijing, China.[Discussion on the different approaches and needs on information in function of users perspective and decisions].
Prescott-Allen R., 1999, Barometer of Sustainability, http://www2.iucn.org/[Description on the methodology and application to develop and use indicators to measure sustainability].
Reid W., J. McNeely, D. Tunstall, D. Bryant, M. Winograd ; 1993; Biodiversity Indicators for Policy-Makers, World Resources Institute and The World Conservation Union, Washington, D.C..[Description and application of indicators development and use for a selected issue].
Rodemburg E., D. Tunstall, F. van Bolhuis; 1995; Environmental Indicators for Global Cooperation, Working Paper #1, Global Environmental Facility (GEF), UNDP/UNEP/The World Bank, Washington, D.C..[Description on the needs and use of environmental indicators in meassuring and assessing progress of global cooperation].
Rump P.; 1995; State of the Environment Source Book, RIVM-UNEP, Bilthoven, The Netherlands.[Compendium on the different initiatives and steps to produce environmental assessment using indicators].
Swart R., H. Bronswijk, B. J. Heij, L. Niessen ;1995; Towards a Global Environmental Outlook: Integrated Global and Regional Environment Assessment, Discussion paper prepared for GEO International Expert Meeting (CIAT, Cali, Colombia), RIVM, Bilthoven, The Netherlands.[Description on the needs and use of indicators to integrate environmental assessment at different scales and levels].
UNDP; 1998; Human Development Report 1998, Oxford University Press, New York. [The most important publication regarding human dimension of the development and social indicators. Yearly updated]
©Encyclopedia of Life Support Systems (EOLSS)

UNESCO-EOLS
S
SAMPLE C
HAPTER
DIMENSIONS OF SUSTAINABLE DEVELOPMENT – Sustainable Development Indicators for Decision Making: Concepts, Methods, Definition and Use - Manuel Winograd and Andrew Farrow
UNDP; 2000; Human Development Report 2000, Oxford University Press, New York. [The most important publication regarding human dimension of the development and social indicators. Yearly updated]
UNEP, 2000, Global Environment Outlook (GEO-2000), UNEP and Earthscan, Earthscan Publications, London, UK. [An assessment about the state of the world’s environment and the main actual and future issues. Examples using indicators for the world, regions and countries].
UNEP; 1993; Environmental Data Report 1993-94, Blackwell Reference, Oxford. [An assessment about the state of the world’s environment. Examples using indicators for the world, regions and countries].
UNEP-DPCSD; 1995; The Role of Indicators in Decision-Making, Discussion Paper prepared by UNEP and DPCSD for the Indicators of Sustainable Development for Decision Making Workshop, 9-11 January, Ghent, Belgium.[Description on the use of indicators for decision and policy making].
United Nations,1998, Measuring Changes in Consumption and Production Patterns: A Set of Indicators, Department of Economic and Social Affairs, ST/ESA/264, UN, New York.[An approach to develop and use materials and resources indicators].
Wackernagel M., W. Rees; 1996; Our Ecological Footprints, Philadelphia New Society Publ., Grabiola, Canada.[Application of an approach to develop information about the use of resources with a common set of measures].
Waltner-Toews D.; 1994; Ecosystem Health: A Framework for Implementing Sustainability in Agriculture, Background Paper, pp 8-23 en Proceedings of an International Workshop Agroecosystem Health, June 19, University of Guelph, Ontario, Canada.[An approach to develop information based on ecosystems goods and services].
WCDE,1987, Our Commnon Future: The Brundtland Report, Oxford University Press, Oxford.[First definition and implications on sustainable development concept].
Winograd M,1997, Horizontal and Vertical Linkages in the Context of Sustainable Developent Indicators, in Moldan B. and Billharz S. (editors), Indicators of Sustainable Development, SCOPE, John Wiley and Son.[Description on the implications of different dimensions of the development to develop and use sustainability and environmental indicators].
Winograd M., A. Farrow, J. Eade, 1998, Atlas de Indicadores Ambientales y de Sustentabilidad para America Latina y el Caribe: ATLAS CD, CD-ROM, version 1, CIAT/PNUMA, Cali, Colombia. [A complete publication package that contains CD with georeferenced indicators and information].
Winograd M., Eade J., 1997, Environmental and Sustainability Indicators for Latin America and the Caribbean: The Use of GIS (Geographic Information Systems), in Moldan B. and Billharz S. (editors), Indicators of Sustainable Development, SCOPE, John Wiley and Son.[Description on the findings about the development and use of indicators to measure progress in a region].
Winograd M., N. Fernandez, A. Farrow, 1998, Tools for Making Decisions in Latin America and the Caribbean: Environmental Indicators and Geographical Information Systems, Centro Internacional de Agricultura Tropical (CIAT) y Programa de las Naciones Unidas para el Medio Ambiente (PNUMA), Cali, Colombia. [Description on the findings and steps about the development and use of indicators to measure progress in a region].
Winograd M.; 1995; Environmental Indicators for Latin America and the Caribbean: Toward Land-Use Sustainability, GASE in collaboration with IICA/GTZ, OAS and WRI, Washington, D.C.. [A complete publication on indicators and statistics on environmental indicators]
World Bank, 1999, Environmental Performance Indicators. A Second Edition Note, The World Bank, Washington, D.C. An approach to develop environmental information based on measure progress in policy and decision making]
World Bank, 2000, The Little Green Data Book, The World Bank, Washington, D.C. [A summary on environmental data and indicators from the world and all countries. A broad vision about the use of
©Encyclopedia of Life Support Systems (EOLSS)

UNESCO-EOLS
S
SAMPLE C
HAPTER
DIMENSIONS OF SUSTAINABLE DEVELOPMENT – Sustainable Development Indicators for Decision Making: Concepts, Methods, Definition and Use - Manuel Winograd and Andrew Farrow
environmental, social and economic information].
World Bank; 1994; Making Development Sustainable: From Concepts to Action, I. Serageldin and A. Steer (editors), ESD Occasional Paper Series # 2, The World Bank, Washington, D.C.. [A broad vision about the application of concepts and the use of environmental, social and economic information].
World Bank; 1995; Monitoring Environmental Progress: A Report on Work in Progress, ESD Series, The World Bank, Washington, D.C.. [A compendium of initiatives about the application of concepts and the use of environmental, social and economic information].
World Bank; 1997; Expanding the Measure of Wealth: Indicators of Environmentally Sustainable Development, ESD Studies and Monographs # 17, Environment Department, Washington, D.C. [A compendium of initiatives about the application of concepts and the use of environmental, social and economic information].
World Bank; 1998; World Development Indicators 1998, The World Bank, Washington, D.C. [The most important publication regarding development and economic, social and environmental indicators at country level. Yearly updated].
World Bank; 2001; World Development Indicators 2001, The World Bank, Washington, D.C. [The most important publication regarding development and economic, social and environmental indicators at country level. Yearly updated].
World Economic Forum, Yale Center for Environmental Law and Policy and Center for International Earth Science Information Network, 2001, Environmental Sustainability Index: 2001, Yale Center for Environmental Law and Policy, USA. (http://www.ciesin.columbia.edu/indicators/ESI). [Application of aggregation indicators methods to evaluate and assess progress toward sustainability at national and regional level. Tabulated data and examples for all countries].
World Watch Institute, 2002, State of the World 2002, W.W. Norton Company, USA. [An assessment of the environment around the world with global and national information in particular on issues such as climate change, population, resource conflicts and global governance. Yearly updated].
WRI; 1996; World Resources 1996-97, Oxford University Press, New York. [The most important publication to evaluate the different dimensions of the development, with economic, social and environmental indicators at global, regional and country level. Bi-annual update].
WRI; 1998; World Resources 1998-90: A Guide to the Global Environment, Oxford University Press, New York. [The most important publication to evaluate the different dimensions of the development, with economic, social and environmental indicators at global, regional and country level. Bi-annual update].
WRI; 2000; World Resources 2000-20001: People and Ecosystems, World Resources Institute Series, Washington, D.C., USA. [The most important publication to evaluate the different dimensions of the development, with economic, social and environmental indicators at global, regional and country level. Bi-annual update]. Biographical Sketches Manuel Winograd, has a Masters degree in Population Biology from Paris-7 University (France), a specialization degree in Environmental Sciences from the National Engineer School (Paris, France) and a PhD degree in Tropical Ecology from Paul Sabatier University (Toulouse, France). He was research fellow at the Institute of International Vegetation Map (Toulouse, France), associated researcher in the Ecological Systems Analysis Group at Fundacion Bariloche (Bariloche, Argentina) and international fellow at the World Resources Institute (Washington, D.C., USA). He is currently senior researcher in the Land Use Unit at the International Center for Tropical Agriculture (Cali, Colombia) and visiting scientist at the Centre de Cooperation Internationale en Recherche Agronomique pour le Developement (CIRAD, Montpellier, France). He served as consultant for many international, regional and national institutions among others the World Bank, the United Nations Environment Program, the Inter-American Institute for Agriculture Cooperation, the United Nations Development Program the World Resources Institute and
©Encyclopedia of Life Support Systems (EOLSS)

UNESCO-EOLS
S
SAMPLE C
HAPTER
DIMENSIONS OF SUSTAINABLE DEVELOPMENT – Sustainable Development Indicators for Decision Making: Concepts, Methods, Definition and Use - Manuel Winograd and Andrew Farrow
the Organization of American States. He was coordinator of different projects on sustainability indicators, rural development and environmental assessment in Latin America. He is author and co-author of different books; chapters, scientific articles and information products on sustainability and environmental indicators, decision-making tools and information, land use models and scenarios, rural development and agriculture and environmental assessment and monitoring. He developed the first series of CD-ROMs to use indicators and develop information for the Latin American region. Andrew Farrow, has BSc degree on Geography and Surveying Science from Newcastle University (UK) and a Masters degree in Geographic Information Systems from Edinburgh University (UK). He was technical support analyst in Survey Supplies Ltd (UK) and research fellow in the Land Use Unit at the International Center for Tropical Agriculture (Cali, Colombia). He participated in different projects on sustainability and environmental indicators, rural development and land use and environmental assessment in Latin America where he developed GIS applications and interfaces, databases, land use models and information products. He is author and co-author of different books; chapters, scientific articles and information products on sustainability and environmental indicators, decision-making tools and information, land use models and scenarios, rural development and agriculture and environmental assessment and monitoring. He is currently studying the theme of spatial analysis of social vulnerability for a PhD in the Center for Environmental Risk at the University of East Anglia (UK) and is part time research fellow in the Land Use Unit at the International Center for Tropical Agriculture (Cali, Colombia).
©Encyclopedia of Life Support Systems (EOLSS)