Embed Size (px)
Citation preview

FaCS
XXX
X
Our commitment to social, environmental and economic performance
Sustainability Report2006–2007
FaCS
IA 0
486.
12.0
7
© Commonwealth of Australia 2007
ISSN: 1833-4695
ISBN: 978-1-921380-82-2
This work is copyright. Apart from any use as permitted under the Copyright Act 1968, no part may be reproduced
by any process without prior written permission from the Commonwealth available from Commonwealth Copyright
Administration, Attorney-General’s Department. Requests and enquiries concerning reproduction and rights
should be addressed to the Commonwealth Copyright Administration, Attorney-General’s, Robert Garran Offices,
National Circuit, Canberra ACT 2600 or posted at www.ag.gov.au/cca
ABN: 36 342 015 855 FaCSIA, Social Security Appeals Tribunal and Australian Institute of Family Studies
How to find out more about this and other FaCSIA publications:
Internet: www.facsia.gov.au
To obtain a printed copy of the FaCSIA Sustainability Report or other FaCSIA publications, phone 1800 050 009
(a free call except from mobile and pay phones).
Acknowledgements
Sustainability report team: Rory Eames, Lisa Harvey, Shaun Holloway, Ann Lyons Wright, Leigh Richmond,
Anura Samara, and Sandy Tanner
Design: CouchCreative
Printer: Pirion Pty Ltd
This report is printed on Monza Satin Recycled paper which comprises 55 per cent recycled and 45 per cent certified
virgin fibre. This paper stock has ISO14001 environmental accreditation, is Elemental Chlorine Free (ECF) and complies
to the standards of the Environmental Management System (EMS).

Our commitment to social, environmental and economic performance
Sustainability Report2006–2007

ii iii
Secretary’s forewordThe Department of Families, Community Services and Indigenous Affairs (FaCSIA) continues to pursue improvements in social, environmental, and economic sustainability.
The FaCSIA Sustainability Report 2006–07 provides a report card on FaCSIA’s initiatives in relation to social, environmental, and economic performance.
I was delighted to attend the opening of the Department’s new building, Centraplaza, in May 2007. The building is the culmination of a long period of planning and commitment and I congratulate the efforts of staff involved. As you will see in the report, the building incorporates the latest in environmental efficient design and provides improved levels of staff comfort.
In a number of other areas, the Department continues to improve its performance. For example, paper use per person has fallen thanks to our efficiency initiatives, and there has been a large increase in the number of highly rated Green Vehicle Guide cars in the fleet.
I am particularly pleased that the Department has recorded an increase in efficiency of government services. The Department now spends 2.6 cents on every $1 of government funding it delivered, well down on 3.5 cents last year.
Staff satisfaction has increased due to our flexible working conditions. You will also see throughout the report examples of staff supporting the community through one-off fundraising events, accessing volunteering leave, and participating in the Workplace Giving Program. In recognition of the effective management of injury claims, FaCSIA’s Comcare premium has been reduced and the Department also received a bonus payment.
Overall, the report represents a department that is performing better in social and economic terms. Whilst there are achievements in environmental performances, there are challenges ahead to improve our energy efficiency.
I would like to thank all FaCSIA staff for their hard work and commend this report to you.
Dr Jeff Harmer Secretary
Contents
Secretary’s foreword iii
Executive summary iv
About this report v
About us vi
Public sector environmental reporting vii
Public agency sustainability indicators 1Our environmental management actions 4
Social performance 13Progress against 2006-07 social performance commitments 14
Environmental performance 29Progress against 2006-07 environmental performance commitments 30
Economic performance 47Progress against 2006-07 environmental performance commitments 48
Appendices 55Appendix 1 – Australian National Audit Office verification statement 56
Appendix 2 – Indicators used in this report 58
Appendix 3 – Abbreviations and terms used in the environmental performance section 61
Appendix 4 – FaCSIA sites 62
FaCSIA Sustainability Report 2006–07 FaCSIA Sustainability Report 2006–07

iv v
Executive summary2006–07 Sustainability performance highlights
SocialA more comprehensive and updated Disability Action Plan was released early in 2007 and is available on the FaCSIA Intranet.
In November 2006 FaCSIA launched a Disability Awareness e-learning module for use by the Department’s staff. Feedback has been constructive and supportive.
In the 2005–06 State of the Service Report, 93 per cent of FaCSIA staff indicated that the flexible working conditions offered were the main element accounting for staff satisfaction.
EnvironmentalOf the Department’s total electricity purchased for 2006–07, 195,145 kilowatt-hours (1.58 per cent) was GreenPower. This is estimated to have prevented the equivalent of 208 tonnes of greenhouse gases from being emitted.
Between 2005–06 and 2006–07 the Department recorded a 7.54 per cent fall in paper usage per person.
During 2006–07, pool vehicles meeting or exceeding a Green Vehicle Guide rating of 10.5 or better increased from 35 to 36.5 per cent .
EconomicThe ratio of departmental expenses to the funding delivered on behalf of the Government is 0.026:1, so that it costs FaCSIA 2.6 cents to administer every dollar it delivers on behalf of the Government.
Employee profileWhen staff profile details across the Department for 2006–07 are averaged across the departmental workforce, the typical FaCSIA employee:
was aged between 40 and 44 years
was female
came from an English-speaking background
worked as an administrative officer
worked full-time
was paid approximately $69,255 a year.
◗
◗
◗
◗
◗
◗
◗
◗
◗
◗
◗
◗
◗
About this reportThird party limited assuranceIn producing the 2006–07 FaCSIA Sustainability Report, the Department has again worked with the Australian National Audit Office (ANAO) and PricewaterhouseCoopers to provide a limited assurance review of selected performance indicators used in this report.
The review considered the completeness, accuracy, and reliability of the data, and also provides FaCSIA with feedback to improve data collection and reporting methodologies. The limited assurance statement provided by the ANAO is provided at Appendix 1.
Throughout the report two symbols appear:
This symbol denotes that, based on the procedures performed, nothing has come to the attention of the ANAO to suggest the data is materially misstated.
This symbol denotes that, based on the procedures performed, the ANAO was unable to conclude that the data was free from material misstatement.
Data not marked with either symbol was not within the scope of the assurance engagement and, as such, has not been provided with assurance over its completeness, accuracy or reliability.
Performance IndicatorsIndicators used in this report are sourced from:
Version 3.0 (2006) Global Reporting Initiative sustainability reporting guidelines
Global Reporting Initiative Sector Supplement for Public Agencies (2006)
a guide to reporting against environmental indicators developed by the then Department of the Environment and Heritage (2003).
A consolidated list of indicators that have been reported against is at Appendix 2.
CommitmentsEach of the social, environmental, and economic chapters of this report begins with a table summarising the actions taken on the Department’s commitments for 2006–07 in the area of performance covered by that chapter. Each chapter also contains a list of commitments for 2007–08.
◗
◗
◗
FaCSIA Sustainability Report 2006–07 FaCSIA Sustainability Report 2006–07

vi vii
Public sector environmental reportingMandatory reportingAustralian Government agencies have mandatory annual energy reporting requirements as part of the Energy Efficiency in Government Operations (EEGO) Policy.
Agencies must also include in their annual reports information about their environmental performance and contribution to Ecologically Sustainable Development (ESD). This is required under Section 516A of the Environment Protection and Biodiversity Conservation Act 1999.
Other recommended guides published by the Department of the Environment and Water Resources include:
criteria for determining ESD relevance
ESD reporting guidelines
generic ESD and environmental performance indicators for Commonwealth organisations.
Voluntary reportingFaCSIA voluntarily reports publicly on its social, environmental, and economic performance through our annual Sustainability Report. Financial management arrangements incorporate economic aspects of sustainability reporting. These aspects include accountability under the Financial Management and Accountability Act 1997 (the FMA Act) and the activities of the FaCSIA Risk Assessment and Audit Committee, which reports directly to the Secretary on risk and governance issues.
Stakeholder engagementIn 2006–07, FaCSIA has begun to develop a stakeholder engagement process for the Sustainability Report. This process includes staff focus groups and surveys, and consultations with technical experts on data issues. It is hoped this stakeholder engagement process will provide FaCSIA with feedback that will enable the report to be enhanced and better meet all stakeholder expectations. FaCSIA looks forward to reporting on this in the next report, and incorporating improvements for the next publication.
◗
◗
◗
About usThe Department of Families, Community Services and Indigenous Affairs (FaCSIA) operates in a complex environment delivering policy and programs that strengthen Australian families, communities and individuals.
Data for the Social Security Appeals Tribunal (SSAT) is not included in this report.
This report does not provide details on the outcomes, output groups or programs FaCSIA delivers on behalf of the Government. This information can be found in the Department’s annual reports at www.facsia.gov.au.
AccountabilitiesAs an Australian Government department, FaCSIA is accountable through our Ministers to the Parliament and to the Australian public. Our accountability arrangements stem from legislation including the Public Service Act 1999 and the Financial Management and Accountability Act 1997 (the FMA Act).
We meet our accountability requirements by publishing an Annual Report, which is compulsory under the Public Service Act 1999. The Annual Report covers the whole range of our operations and functions. For more information about FaCSIA, visit www.facsia.gov.au.
FaCSIA chooses to expand on Commonwealth department and agencies’ environmental reporting requirements of Section 516A of the Environmental Protection and Biodiversity Protection Act 1999 by publishing this Sustainability Report.
Legislation and policiesIn conducting our internal operations, FaCSIA deals with social, environmental and economic issues by meeting our legal obligations and through our organisational policies.
The legislation governing FaCSIA on social issues includes:
Disability Discrimination Act 1992
Human Rights and Equal Opportunity Commission Act 1984
Occupational Health and Safety (Commonwealth Employment) Act 1991
Racial Discrimination Act 1975
Sex Discrimination Act 1984
Workplace Relations Act 1996.
◗
◗
◗
◗
◗
◗
FaCSIA Sustainability Report 2006–07FaCSIA Sustainability Report 2006–07

viii ix
FaCSIA’s PurposeFaCSIA’s Purpose is ‘Improving the lives of Australians by helping to build the capacity and well-being of individuals, families and communities’.
FaCSIA’s Core Values
FaCSIA upholds the Australian Public Service values which include impartiality, accountability and responsiveness to the Government. As a department we choose to build on these and to have a small set of guiding principles that have intrinsic value to FaCSIA and which are meaningful to our staff. We value:
committed and responsive service to the government of the day
respect for our clients and each other
innovation and creativity
striving for excellence in whatever we do
collaborating effectively to achieve results.
FaCSIA OutcomesOutcome 1: Greater self-reliance and economic, social and community engagement for Indigenous Australians.
Outcome 2: Seniors, people with disabilities, carers, youth and women are supported, recognised and encouraged to participate in the community.
Outcome 3: Families and children have choices and opportunities.
Outcome 4: Strong and resilient communities.
Our Service Standards: what is important to usIntegrity—We do what we say we will do and act with probity.
Responsibility—We are accountable for our decisions and behaviours.
Wisdom—We use our collective and individual knowledge, insight and judgment.
Fairness—Our decisions and behaviours will be free of self-interest and bias.
Care and Respect—We have high regard for our clients, business partners and each other and we show consideration and appreciation in all our dealings.
Accuracy of information—We will maintain accurate and comprehensive records. We will provide accurate and relevant information. We will keep our publications up-to-date. We will clearly explain the reasons for any decisions we make.
Confidentiality—We will treat all information confidentially in accordance with the Commonwealth privacy provisions and laws.
◗
◗
◗
◗
◗
◗
◗
◗
◗
◗
◗
◗
◗
◗
◗
◗
Access—We will make our services accessible and provide information in a format that is easy to understand.
Effective Partnerships—We aim to consult widely to make sure that the views of our partners, clients and stakeholders are properly considered in developing or reviewing policies or services. We will also provide as much time as possible for comment on any proposals that affect our business with partners, clients and stakeholders.
Service Charter
The FaCSIA Service Charter sets out the standard of service that people who deal with the Department can expect and the ways they can help it improve service to customers. The Charter also helps FaCSIA staff to develop a better understanding of their roles and responsibilities.
Complaints Management Scheme
The FaCSIA Complaints Management Scheme is a component of the FaCSIA Service Charter and provides a means of resolving client concerns quickly and effectively, and identifying issues that require remedial action.
For 2006–07, FaCSIA registered 21 complaints. At 30 June 2007, 19 complaints had been resolved and two complaints were being dealt with.
Of those complaints received, 12 were about service providers, two were related to government policy and seven were related to FaCSIA service delivery and standards.
The number of complaints received by the Department has followed a downward trend again this year. The Department plans to review the operation of the Complaints Management Scheme to assure itself that complaints data reflects real improvements in service.
◗
◗
FaCSIA Sustainability Report 2006–07 FaCSIA Sustainability Report 2006–07

Public agency sustainability indicators

2 3
IntroductionThis year, FaCSIA has included a new set of reporting guidelines from the Global Reporting Initiative (GRI), which were specifically developed for public agencies. The GRI Pilot Sector Supplement for Public Agencies was released in 2006, and provides public agencies the opportunity to critically report against broader sustainability initiatives.
Describe the relationship to other governments or public authorities and the position of the agency within its immediate governmental structures
FaCSIA shapes social policies and delivers them with partner government agencies and non-government organisations.
The Department has three ministers in the portfolio:
The Hon. Mal Brough, MP, Minister for Families, Community Services, and Indigenous Affairs and Minister Assisting the Prime Minister for Indigenous Affairs
The Hon. Julie Bishop, MP, Minister Assisting the Prime Minister for Women’s Issues
Senator the Hon. Nigel Scullion, Minister for Community Services.
FaCSIA delivers social security to a range of recipients. A Business Partnership Agreement 2006–2010 governs the business relationship with Centrelink, through which significant social payments are delivered, including unemployment benefits and age pensions.
There are a number of agencies in the FaCSIA portfolio:
Social Security Appeals Tribunal
Aboriginal Hostels Limited
Australian Institute of Family Studies
Indigenous Land Corporation
Torres Strait Regional Authority
Northern, Central, Anindilyakwa and Tiwi Land Councils
Aboriginal Land Commissioner
Wreck Bay Aboriginal Community Council
Registrar of Aboriginal Corporations.
◗
◗
◗
◗
◗
◗
◗
◗
◗
◗
◗
◗
PA1
State the definition of sustainable development used by the public agency, and identify any statements or principles adopted to guide sustainable development policies
The principles of sustainable development used by FaCSIA are elaborated in section 3A of the Environment Protection and Biodiversity Conservation Act 1999:
decision-making processes should effectively integrate both long-term and short-term economic, environmental, social and equitable considerations;
if there are threats of serious or irreversible environmental damage, lack of full scientific certainty should not be used as a reason for postponing measures to prevent environmental degradation;
the principle of inter-generational equity—that the present generation should ensure that the health, diversity and productivity of the environment is maintained or enhanced for the benefit of future generations;
the conservation of biological diversity and ecological integrity should be a fundamental consideration in decision-making;
improved valuation, pricing and incentive mechanisms should be promoted.
These principles of ecologically sustainable development underpin and provide a basis for FaCSIA’s environmental policy.
FaCSIA Environmental PolicyFaCSIA is responsible for shaping social policies and ensuring they are delivered efficiently through partnerships with other government and non-government organisations. As well as families, the Department focuses on groups with different needs such as young people and students, people living in rural and remote areas, Aboriginal and Torres Strait Islander peoples and people from diverse cultural and linguistic backgrounds.
Our Environmental Management CommitmentsFaCSIA recognises the importance of implementing sound environmental practices throughout its administrative and support functions. The Department will continue to integrate sustainability and environmental accountability into our daily operations by:
seeking to minimise adverse environmental impacts and prevent pollution from all our operations
adhering to all relevant environmental legislation, and appropriate policies, initiatives and other non-legislative requirements
working for continual improvement in our environmental performance
reporting on our progress toward environmental sustainability through the Department’s annual Sustainability Report.
a)
b)
c)
d)
e)
◗
◗
◗
◗
PA2
FaCSIA Sustainability Report 2006–07 | Public agency sustainability indicators Public agency sustainability indicators | FaCSIA Sustainability Report 2006–07

4 �
GOAL 4 | reduce energy consumption and maintain energy efficient systems
GOAL � | reduce the amount of commingled material going to landfill through appropriate purchasing, and increasing the level of recycling
Use of amenities
GOAL 6 | reduce energy consumption and maintain energy efficient systems
GOAL 7 | reduce water use in office operations where feasible
GOAL 8 | reduce the amount of commingled material going to landfill and increase the level of recycling
Lighting
GOAL 9 | provide for adequate lighting levels in office operations, and where feasible, do so with an energy efficient approach
GOAL 10 | reduce the amount of heavy metals and other material waste associated with the disposal of fluorescent tubes going to landfill
Transport
GOAL 11 | reduce the average fuel consumption, greenhouse gas emissions and noxious emissions of the vehicles provided for pool use, and the senior executive
Describe the process by which the aspects and goals in both PA3 and PA4 were set
In accordance with FaCSIA’s environmental policy above, FaCSIA’s sustainable development goals have been set through the Environmental Management System (EMS) framework.
For each goal, provide the following information:implementation measuresresults of relevant assessments of the effectiveness of those measures before they are implementedstate targets and key indicators used to monitor progress, with a focus on outcomesdescription of progress with respect to goals and targets in the reporting periods, including results of key indicatorsactions to ensure continuous improvement towards reaching the public agency’s goals and targetspost-implementation assessment and targets for next time period.
◗
◗
◗
◗
◗
◗
Our environmental management actionsFaCSIA will implement and maintain an Environmental Management System (EMS) to ISO 14001 requirements. We will:
improve our purchasing practices to reflect environmental sustainability
reduce our waste output and adopt recycling practices
monitor energy use and implement an energy management plan
reduce our consumption of water
educate and motivate staff to actively participate and contribute to environmental management initiatives and action
report on the progress of our EMS through the annual Sustainability Report.
Identify the aspects for which the organisation has established sustainable development policies
FaCSIA has established sustainable development policies and plans under its Environmental Management System (EMS) to improve the environmental performance of its office-based operations.
FaCSIA’s environmental management plans seek to reduce pollution, save money on resources and improve staff comfort and productivity.
Specifically, aspects include:
office administration and departmental operations
use of amenities
lighting
transport.
Identify the specific goals of the organisation for each aspect listed in PA3
The goals of the Environmental Management System (EMS) plans are:
Office administration and departmental operations
GOAL 1 | aim for the highest sustainability ratings feasible in office accommodation
GOAL 2 | reduce the total amount of paper purchased and increase the percentage of recycled content paper purchased
GOAL 3 | where practical and appropriate, purchase environmentally sound products and services
◗
◗
◗
◗
◗
◗
◗
◗
◗
◗
PA3
PA4
PA5
PA6
FaCSIA Sustainability Report 2006–07 | Public agency sustainability indicators Public agency sustainability indicators | FaCSIA Sustainability Report 2006–07

6 7
GOAL 1 | Aim for the highest sustainability ratings feasible in office accommodation
Implementation measures Meeting our requirements under the Energy Efficiency in Government Operations Policy for new office buildings and leases including:
Australian Building Greenhouse Rating (ABGR) of 4.5 stars
appropriate green lease schedules when required.
◗
◗
Results of relevant assessments of the effectiveness of those measures before they are implemented
FaCSIA’s new National Office building, Centraplaza, has been designed to meet an ABGR of 5 stars.
State targets and key indicators to monitor progress, with a focus on outcomes
Electricity use in accordance with 4.5 stars ABGR.
Description of progress with respect to goals and targets in the reporting periods, including results of key indicators
This aspect is reported in more detail in the environmental performance section of this report.
Actions to ensure continuous improvement towards reaching the public agency’s goals and targets
For Centraplaza, a Building Management Committee (BMC) monitors the building’s key indicators and assesses performance against design. The BMC can take action to implement measures to meet targets.
Green Lease schedules for new leases will govern arrangements for continuous improvement.
Post-implementation assessment and targets for next time period
FaCSIA is in the early stages of implementing sustainability ratings and performance in office accommodation, and as such has not yet conducted post-implementation assessments or set targets for review.
GOAL 2 | Reduce the total amount of paper purchased and increase the percentage of recycled content paper purchased
Implementation measures Default double-sided printing, and purchasing policy to purchase only paper with 50 per cent recycled content.
GOAL 2 | Reduce the total amount of paper purchased and increase the percentage of recycled content paper purchased continued
Results of relevant assessments of the effectiveness of those measures before they are implemented
These implementation measures were introduced in 2004–05, and are now standard business practice. No pre-implementation effectiveness assessments were conducted.
State targets and key indicators to monitor progress, with a focus on outcomes
Primary target—all A4 printer and photocopy paper to have 50 per cent recycled content.
Secondary target—reduction of paper usage.
Indicator—amount of paper purchased by type and composition used for monitoring.
Description of progress with respect to goals and targets in the reporting periods, including results of key indicators
This aspect is reported in more detail in the Environmental Performance Section of this report.
Actions to ensure continuous improvement towards reaching the public agency’s goals and targets
Awareness raising for staff through poster and email campaigns.
Maintain contract with paper recyclers that guarantees waste paper is recycled.
Post-implementation assessment and targets for next time period
Monitor and analyse paper purchased data provided by the contracted paper supplier and complete a review annually in Sustainability Report.
Investigate new purchasing arrangement to improve 50 per cent recycled content target.
GOAL 3 | Where practical and appropriate purchase environmentally sound products and services
Implementation measures Re-engineer purchasing systems to restrict purchasing choices to some office products such as A4 copy paper.
Results of relevant assessments of the effectiveness of those measures before they are implemented
This implementation measure was introduced in 2004–05, and is now standard business practice. No pre-implementation effectiveness assessment was conducted.
State targets and key indicators to monitor progress, with a focus on outcomes
Inclusion of environmental considerations in purchasing policy/guidelines and practices.
FaCSIA Sustainability Report 2006–07 | Public agency sustainability indicators Public agency sustainability indicators | FaCSIA Sustainability Report 2006–07

8 9
GOAL 3 | Where practical and appropriate purchase environmentally sound products and services continued
Description of progress with respect to goals and targets in the reporting periods, including results of key indicators
This aspect is reported in more detail in the Environmental Performance Section of this report.
Actions to ensure continuous improvement towards reaching the public agency’s goals and targets
Raise awareness, provide support and motivate business managers and staff to purchase environmentally friendly goods and services.
Monitor and review purchasing data on a monthly basis.
Post-implementation assessment and targets for next time period
Investigate potential for internal reporting of procurement to Branches.
GOAL 4 and 6 | Reduce energy consumption and maintain energy efficient systems
Implementation measures A range of measures, including greater control of lighting and air conditioning through the building management system, and installing timers on kitchen boilers, have been introduced to reduce energy consumption.
Results of relevant assessments of the effectiveness of those measures before they are implemented
These implementation measures are developed and assessed on a case by case basis when significant property management issues arise. Effectiveness assessments are made on a cost and energy savings basis, dependant upon site and lease characteristics.
State targets and key indicators to monitor progress, with a focus on outcomes
Target—Energy Efficiency in Government Operations Policy target of 7,500 MJ per person per annum for office tenant light and power.
Indicator—amount of electricity consumed and proportion of GreenPower purchased.
Description of progress with respect to goals and targets in the reporting periods, including results of key indicators
This aspect is reported in more detail in the environmental performance section of this report.
GOAL 4 and 6 | Reduce energy consumption and maintain energy efficient systems continued
Actions to ensure continuous improvement towards reaching the public agency’s goals and targets
Raise awareness throughout the organisation about electricity consumption measures and the role of all staff in the reduction effort.
Build electricity consumption management issues into IT procurement activities.
Post-implementation assessment and targets for next time period
Implementation of the Energy Management Plan.
GOAL 7 | Reduce water use in office operations where feasible
Implementation measures Collect quarterly water consumption data and communicate usages to staff—educate, motivate and inform staff about the need to save water.
Results of relevant assessments of the effectiveness of those measures before they are implemented
FaCSIA is in the early stages of implementing water efficiency ratings and targets in existing office accommodation, and as such has not yet conducted post-implementation assessments or set targets for review.
State targets and key indicators to monitor progress, with a focus on outcomes
Understanding of water consumption profile for specific sites needs to be achieved before appropriate targets can be set.
Indicator—targets set.
Description of progress with respect to goals and targets in the reporting periods, including results of key indicators
This aspect is reported in more detail in the environmental performance section of this report.
Actions to ensure continuous improvement towards reaching the public agency’s goals and targets
Raise awareness, motivate and inform staff about the need to save water, including poster campaign.
Post-implementation assessment and targets for next time period
Negotiate with building owners for installation of water saving devices.
FaCSIA Sustainability Report 2006–07 | Public agency sustainability indicators Public agency sustainability indicators | FaCSIA Sustainability Report 2006–07
10 11
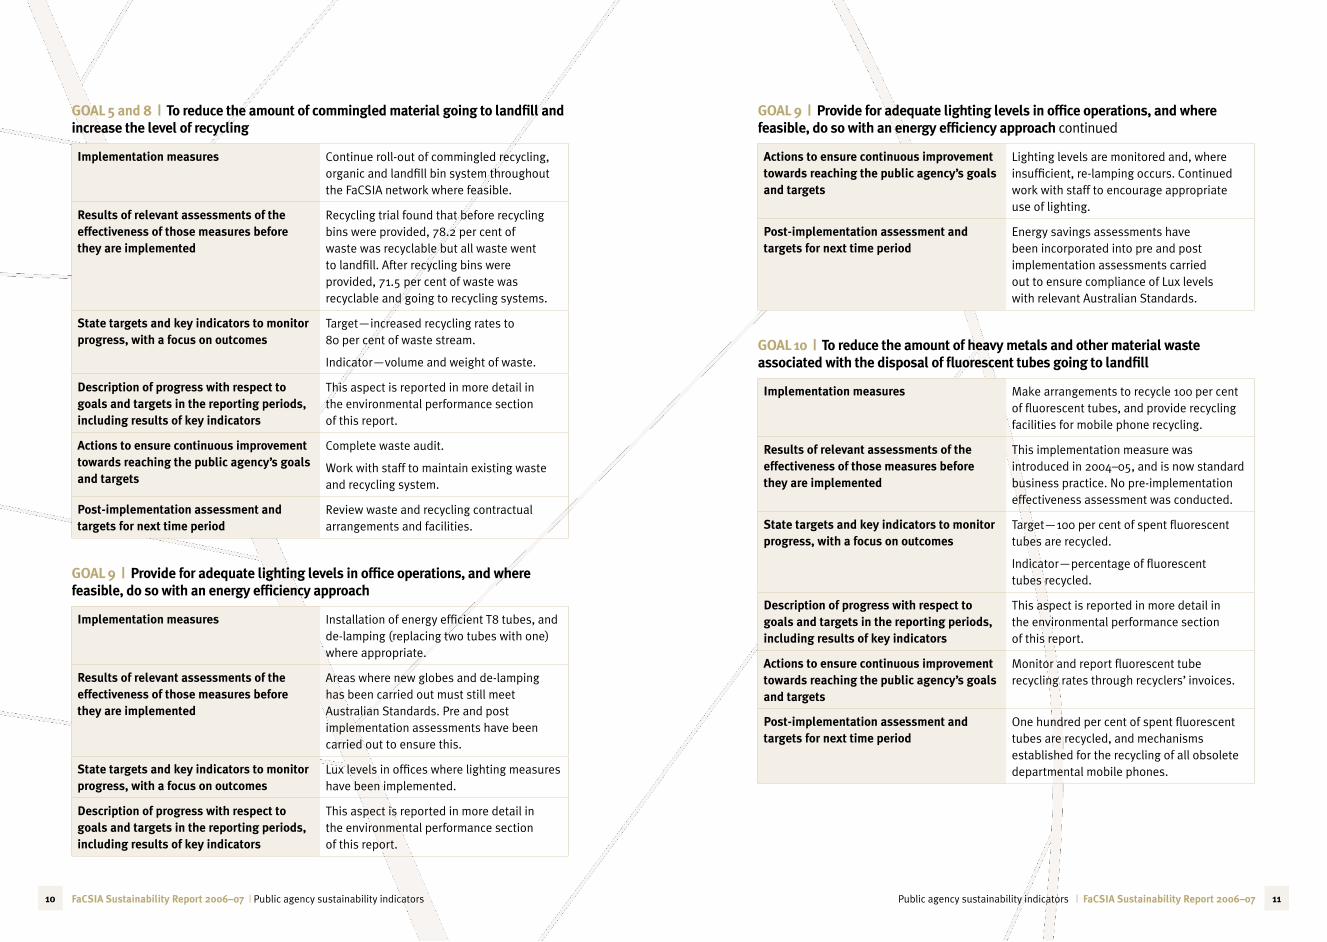
GOAL � and 8 | To reduce the amount of commingled material going to landfill and increase the level of recycling
Implementation measures Continue roll-out of commingled recycling, organic and landfill bin system throughout the FaCSIA network where feasible.
Results of relevant assessments of the effectiveness of those measures before they are implemented
Recycling trial found that before recycling bins were provided, 78.2 per cent of waste was recyclable but all waste went to landfill. After recycling bins were provided, 71.5 per cent of waste was recyclable and going to recycling systems.
State targets and key indicators to monitor progress, with a focus on outcomes
Target—increased recycling rates to 80 per cent of waste stream.
Indicator—volume and weight of waste.
Description of progress with respect to goals and targets in the reporting periods, including results of key indicators
This aspect is reported in more detail in the environmental performance section of this report.
Actions to ensure continuous improvement towards reaching the public agency’s goals and targets
Complete waste audit.
Work with staff to maintain existing waste and recycling system.
Post-implementation assessment and targets for next time period
Review waste and recycling contractual arrangements and facilities.
GOAL 9 | Provide for adequate lighting levels in office operations, and where feasible, do so with an energy efficiency approach
Implementation measures Installation of energy efficient T8 tubes, and de-lamping (replacing two tubes with one) where appropriate.
Results of relevant assessments of the effectiveness of those measures before they are implemented
Areas where new globes and de-lamping has been carried out must still meet Australian Standards. Pre and post implementation assessments have been carried out to ensure this.
State targets and key indicators to monitor progress, with a focus on outcomes
Lux levels in offices where lighting measures have been implemented.
Description of progress with respect to goals and targets in the reporting periods, including results of key indicators
This aspect is reported in more detail in the environmental performance section of this report.
GOAL 9 | Provide for adequate lighting levels in office operations, and where feasible, do so with an energy efficiency approach continued
Actions to ensure continuous improvement towards reaching the public agency’s goals and targets
Lighting levels are monitored and, where insufficient, re-lamping occurs. Continued work with staff to encourage appropriate use of lighting.
Post-implementation assessment and targets for next time period
Energy savings assessments have been incorporated into pre and post implementation assessments carried out to ensure compliance of Lux levels with relevant Australian Standards.
GOAL 10 | To reduce the amount of heavy metals and other material waste associated with the disposal of fluorescent tubes going to landfill
Implementation measures Make arrangements to recycle 100 per cent of fluorescent tubes, and provide recycling facilities for mobile phone recycling.
Results of relevant assessments of the effectiveness of those measures before they are implemented
This implementation measure was introduced in 2004–05, and is now standard business practice. No pre-implementation effectiveness assessment was conducted.
State targets and key indicators to monitor progress, with a focus on outcomes
Target—100 per cent of spent fluorescent tubes are recycled.
Indicator—percentage of fluorescent tubes recycled.
Description of progress with respect to goals and targets in the reporting periods, including results of key indicators
This aspect is reported in more detail in the environmental performance section of this report.
Actions to ensure continuous improvement towards reaching the public agency’s goals and targets
Monitor and report fluorescent tube recycling rates through recyclers’ invoices.
Post-implementation assessment and targets for next time period
One hundred per cent of spent fluorescent tubes are recycled, and mechanisms established for the recycling of all obsolete departmental mobile phones.
FaCSIA Sustainability Report 2006–07 | Public agency sustainability indicators Public agency sustainability indicators | FaCSIA Sustainability Report 2006–07

12
GOAL 11 | To reduce the average fuel consumption, greenhouse gas emissions and noxious emissions of the vehicles provided to senior executive in Juliana House in line with broader initiatives being implemented for the whole of the FaCSIA vehicle fleet
Implementation measures Promote Green Vehicle Guide-rated vehicles of 10.5 or better through vehicle leasing policy.
Results of relevant assessments of the effectiveness of those measures before they are implemented
As this implementation measure was introduced to comply with Australian Greenhouse Office and Fleet Monitoring Body policy, no pre-implementation effectiveness assessment was conducted.
State targets and key indicators to monitor progress, with a focus on outcomes
Target—greater than 28 per cent of pool fleet vehicles rated 10.5 or better by the Green Vehicle Guide.
Indicator—proportion of vehicles in fleet with Green Vehicle Guide rating of 10.5 or better.
Description of progress with respect to goals and targets in the reporting periods, including results of key indicators
This aspect is reported in more detail in the environmental performance section of this report.
Actions to ensure continuous improvement towards reaching the public agency’s goals and targets
Monitor and report vehicle leasing decisions in pool fleet and senior executive quarterly.
Post-implementation assessment and targets for next time period
This aspect is reported in more detail in the environmental performance section of this report.
Describe the role of and engagement with stakeholders with respect to the items disclosed in PA6
The aspects detailed in PA6 have been developed principally through compliance with a number of legislative requirements, mandatory performance requirements, and recommendations relating to the environmental performance of the Australian Government as a whole. These are described in more detail in the environmental section of this report.
For the 2006–07 report, FaCSIA has begun to engage internal and external stakeholders in the development of its sustainability performance targets and reporting methodologies. This process has been documented under Stakeholder Engagement, page vii.
PA7
Social performance
FaCSIA Sustainability Report 2006–07 | Public agency sustainability indicators

14 1�
Social performanceSocial indicator summary tableProgress against 2006–07 commitments:
Commitment Status Performance
Continue to develop a strategic approach to developing staff capability against the FaCSIA Integrated Capability Framework.
Ongoing FaCSIA has refreshed the Integrated Capability Framework to align to the Department’s reviewed Strategic Framework following machinery-of-government changes. The Department is continuing to align Learning and Development products to core capabilities in the Integrated Capability Framework.
Expand workforce planning activities and integrate with business planning.
Progressing FaCSIA continues to monitor and publish a range of workforce metrics to support effective workforce planning and the development of workforce strategies. FaCSIA has developed and published a workforce planning guide and supporting tools on its intranet. Links to these have been included in FaCSIA’s business planning guidelines and documentation.
Expand FaCSIA’s e-learning program.
Ongoing E-learning is an online training system offered across FaCSIA, which provides staff with a flexible and accessible mode of learning. The system provides improved access to critical corporate training such as Induction, Occupational Health and Safety (OH&S), Australian Public Service (APS) Code of Conduct, Diversity, and the Department’s Strategic Framework.
Develop a greater match between individual capabilities and the needs of the Department.
Ongoing Identification of core capabilities linked to business requirements and the access to corporate learning and development products remains an ongoing process. An example of this work includes the identification of organisational need or skills gaps which saw the development of the in-house Diploma of Government targeting agreement-making.
Social indicator summary table continued
Commitment Status Performance
Ensure injured or ill employees make an early and sustained return to work, where appropriate.
Ongoing FaCSIA facilitates individual solutions as required. FaCSIA’s Comcare premium was reduced from 1.77 per cent of payroll in the 2006–07 financial year to 1.55 per cent of payroll for the 2007–08 financial year. Further, FaCSIA received a Comcare bonus payment in excess of $120,000 in recognition of the effective management of injury claims.
Build on strategies to prevent harassment and bullying.
Ongoing Awareness sessions on the elimination of harassment and bullying were held in each State Office, and 12 were held in National Office. Options for e-learning for the prevention of harassment and bullying in the workplace are being explored.
Increase the representation of diversity categories in our workforce, where relevant, with a view to closer alignment with the Australian Public Service averages by 2006–07.
Exceeded FaCSIA’s representation of diversity categories exceeds the Australian Public Service Commission (APSC) average employment rate of these categories:
APS FaCSIA
Women 55.8% 66.51%
Indigenous Staff 2% 8.45%
People with disability 3.4% 3.96%
Diverse Linguistic Background 5.6% 7.26%
Please note that the APS figures are based on the 2006 State of the Service Report as the 2007 report will not be released until the end of November 2007.
Release an extended Disability Action Plan.
Complete A more comprehensive and updated Disability Action Plan was endorsed in the first half of 2007 and is available on the FaCSIA Intranet.
Implement the FaCSIA Diversity Plan 2006–2009.
Ongoing This is a three-year plan. The Management of Depression in the Workplace Strategy has been implemented and options for e-learning for the management of depression in the workplace are being explored. FaCSIA continues to facilitate quarterly meetings of the Diversity Network with membership from 32 APS agencies.
FaCSIA Sustainability Report 2006–07 | Social performance Social performance | FaCSIA Sustainability Report 2006–07

16 17
Social indicator summary table continued
Commitment Status Performance
Review the number of staff who have used the corporate volunteering provision and identify ways to increase usage.
Ongoing Forty staff members accessed volunteering leave in the financial year 2006–07—a drop from 62 in 2005–06. The nature of this provision does not lend itself to identify reasons for the reduction. However, FaCSIA continues to advertise this provision via the FaCSIA workplace intranet, StaffNET. It is also incorporated in the FaCSIA Certified Agreement. In June, FaCSIA also launched the Workplace Giving Program (see page 24).
IntroductionAt 30 June 2007, FaCSIA had a total workforce of 3,052 staff across the country from capital cities to remote communities. The FaCSIA workforce is 66 per cent female with an average age of 41.4 and a median classification level of APS6. FaCSIA has a diverse workforce including 258 (8.45 per cent) Aboriginal and Torres Strait Islander people, 121 (3.96 per cent) people with disability, and 221 (7.26 per cent) people from diverse linguistic backgrounds. These statistics are a significant improvement on the APS average. Our voluntary separation and unscheduled absence rates continued to improve in 2006–07.
Focusing on our peopleThe indicators reported against in this section are LA1, LA2 and LA16:
Breakdown of workforce by geographical region, status, employment type and employment contract
The total FaCSIA workforce is 3,052.
Figure 1 | Geographic location of FaCSIA staff
Table 1 | FaCSIA staff classification by gender and level
Classification Female Male
Senior Executive Service 51 57
Indigenous Cadet/Cadet/Trainee 3 0
APS1 10 10
APS2 39 22
APS3 94 41
APS4 238 74
APS5 286 120
APS6 504 232
Executive Level 1 548 288
Executive Level 2 208 151
Legal 1 15 9
Legal 2 8 6
Public Affairs Officer Grade 1 6 2
Public Affairs Officer Grade 2 11 2
Public Affairs Officer Grade 3 7 7
Senior Public Affairs Officer Grade 1 1 0
Senior Public Affairs Officer Grade 2 1 1
Total 2,030 1,022
Table 2 | Age profile of FaCSIA staff at 30 June 2007
Age Female Male
‹20 11 7
20–24 125 57
25–29 228 84
30–34 222 116
35–39 304 122
40–44 340 129
45–49 374 194
LA1
WA 4.19%
ACT 72.08%
VIC 3.60%
TAS 1.05%
SA 3.01%
QLD 6.19%
NT 3.74%
NSW 6.13%
FaCSIA Sustainability Report 2006–07 | Social performance Social performance | FaCSIA Sustainability Report 2006–07

18 19
Table 2 | Age profile of FaCSIA staff at 30 June 2007 continued
Age Female Male
50–54 270 149
55–59 107 101
60–64 38 48
65+ 11 15
Total 2,030 1,022
Figure 2 | Working arrangements at 30 June 2007—full-time, part-time and temporary
Casual 0.23%Non-ongoing part-time 1.90%
Non-ongoing full-time 9.17%
Ongoing part-time 11.21%
Ongoing full-time 77.49%
Encouraging workforce diversityThe indicators reported against in this section are HR12, LA10, LA11 and SO1:
Description of policies, guidelines and procedures to address the needs of Indigenous people
Aboriginal and Torres Strait Islander Recruitment and Retention Strategy
The Aboriginal and Torres Strait Islander Recruitment and Retention Strategy 2006–2009 covers a range of strategies to support and enhance the recruitment, career development and retention of Aboriginal and Torres Strait Islander people within FaCSIA. The Strategy has been well-received and is promoted by management.
Consultative workshops were held during June 2007 to gather input regarding the direction of the Strategy. Some 39 per cent of Aboriginal and Torres Strait Islander staff attended these workshops.
The Indigenous Entry Level Programs, National Indigenous Cadetship Program, and Indigenous graduate trainee programs are ongoing. Currently FaCSIA has 10 Aboriginal and Torres Strait Islander trainees, three Aboriginal and Torres Strait Islander cadets and two Aboriginal and Torres Strait Islander graduates. FaCSIA continues to participate in the APSC Indigenous entry level programs.
Description of equal opportunity policies or programs, as well as monitoring systems to ensure compliance and results of monitoring
FaCSIA diversity policy and strategy
FaCSIA is in the second year of implementing its three year diversity plan—Valuing Diversity —Making it Real. The FaCSIA Diversity Plan is our plan of action for creating and supporting a workplace that values, embraces, and reaps the benefits of the diversity of our people. It builds on the diversity commitment in our Values and Leadership Model. The issues it addresses are real issues for FaCSIA people that have been identified through previous consultations. The plan defines organisational, managerial and staff responsibilities for a range of specific actions with timelines to promote and support workplace diversity.
FaCSIA continues to facilitate quarterly meetings of the APS Diversity Networks, which was re-established in 2006. Diversity issues considered by the Network have included implementation of the Management Advisory Committee’s Report—Employment of People with Disability in the APS and proposed changes to the Commonwealth Disability Strategy. Currently 32 APS agencies are represented in the Network.
The percentage of ongoing part-time staff in 2006–07 was 11.21 per cent —this is a 0.13 per cent decrease from 11.34 per cent in 2005–06.
Net employment creation and average turnover
In 2006–07, as a result of several new budget measures, FaCSIA has grown from 2,540 to 3,052 staff. The Department’s voluntary separation rate for 2006–07 was 12.52 per cent . This rate excludes contractors and staff that separated from the Department through redundancy.
Description of programs to support the continued employability of employees and manage career endings
FaCSIA’s Certified Agreement and Australian Workplace Agreements support a range of flexible work, leave, development and remuneration provisions designed to support the attraction and retention of employees with diverse needs. The needs of employees towards the end of their careers are well catered for by these provisions.
LA2
LA16
HR12
LA10
FaCSIA Sustainability Report 2006–07 | Social performance Social performance | FaCSIA Sustainability Report 2006–07

20 21
Support for staff with disability
At FaCSIA people with disability are supported and encouraged to participate in our workforce. This reflects our commitment to workplace diversity outlined in FaCSIA’s Diversity Plan. It is important that workplace diversity at FaCSIA mirrors the diversity of the community we serve. The Department caters to the needs of staff with a range of disabilities through the provision of assistive technology, e-learning, and other resources. A more comprehensive and updated Disability Action Plan was endorsed in the first half of 2007.
In November 2006, FaCSIA launched a Disability Awareness e-learning module for use by the Department’s staff. Feedback has been constructive and supportive.
In May 2007, FaCSIA commenced the first of 50 beyondblue Managing Depression in the Workplace workshops for its managers. FaCSIA is currently negotiating with beyondblue to translate the workshop content into an online e-learning course.
Assistive technology is used throughout the Department, and includes:
37 users of Dragon Naturally Speaking software
one user of Exy Keys software
one user of JAWS and Zoomtext software
one user of MAGic and JAWS software.
Self-reporting of diversity information
FaCSIA’s diversity policies and programs rely on data gathered from individual staff who choose to provide information. Anecdotal and other evidence indicates that diversity staff numbers are higher than those shown by the available data. All FaCSIA staff were invited to update their diversity data in early 2007 and regular reminders will be used to continue to build the data.
Table 3 | FaCSIA staff by diversity category as at 30 June 2007
Diversity category 2004–0� 200�–06 2006–07
Number Per cent Number Per cent Number Per cent
Women 1,262 67.02 1,696 66.77 2,030 66.51
Aboriginal and Torres Strait Islanders
51 2.71 231 9.09 258 8.45
People with disability 48 2.55 79 3.11 121 3.96
People from a diverse linguistic background
101 5.36 147 5.78 221 7.26
Provision of diversity information by staff is voluntary. These figures are based on the number of individuals who have chosen to provide this information.
◗
◗
◗
◗
Website accessibility standards
The Department’s online resources comply with Australian Government web publishing standards and best practice guidelines. Adhering to the World Wide Web Consortium’s (W3C) Web Content Accessibility Guidelines, FaCSIA delivers resources of extremely high quality and high-level accessibility for all users, regardless of technology and ability.
Composition of senior management and corporate governance bodies including male/female ratio and other indicators of diversity as culturally appropriate
Executive Management Group
The Executive Management Group (EMG) is the senior executive committee in FaCSIA. It advises and assists the Secretary. EMG is responsible for whole-of-department decisions and monitoring organisational performance. This includes developing and implementing FaCSIA’s Strategic Framework, managing the One FaCSIA—results through collaboration approach to business; assessing and managing risk; and ensuring performance of ministerial and government priorities.
EMG consists of the Secretary, Associate Secretary, Deputy Secretaries, Chief Financial Officer, and Group Manager Corporate Support.
Members of the Executive Management Group as at 30 June 2007
Dr Jeff Harmer Secretary (Chair)
Mr Wayne Gibbons PSM Associate Secretary
Mr Geoff Leeper Deputy Secretary
Mr Bernie Yates Deputy Secretary
Ms Glenys Beauchamp Deputy Secretary
Ms Robyn McKay A/g Deputy Secretary
Mr Bruce Hunter Chief Financial Officer and Group Manager, Business and Financial Services
Mr Andrew Wood Group Manager, Corporate Support
Senior Management Group
The Senior Management Group (SMG) is the primary forum for senior executive consultation with Group Managers. It undertakes strategic discussions on policy themes, policy issues and other high-level matters. SMG discusses key organisational risks, performance and evaluation, and develops proposals for consideration by EMG to address key problems and improve FaCSIA performance.
SMG consists of the Secretary, Associate Secretary, Deputy Secretaries, Group Managers, and the Registrar of Aboriginal Corporations.
LA11
FaCSIA Sustainability Report 2006–07 | Social performance Social performance | FaCSIA Sustainability Report 2006–07

22 23
Table 4 | Composition of Executive Management Group and senior executives by gender
Total Female % Male %
Executive Management Group 8 2 25 6 75
Group Managers 17 11 65 6 35
Branch and State/Territory Managers 70 30 43 40 57
Committees
FaCSIA has the following governance committees reporting to the Secretary and/or Executive Management Group:
Ethics Committee
Information and Communications Technology Committee
Indigenous Policy Forum
Program Management Committee
People Committee
Research and Evaluation Committee
Risk Assessment and Audit Committee.
Ethics Committee
The Ethics Committee determines the ethical position of the Department in any governance situation of significance, doubt or difficulty. It determines and oversees the Department’s responses to allegations of fraud, misconduct, misbehaviour or impropriety. The committee is chaired by the Associate Secretary and meets quarterly. Three Group Managers and the Senior Indigenous Mentor are also members of the committee.
Information and Communications Technology Committee
Within broad direction set by the Executive Management Group, the Information Technology Committee is now the major decision-making body for long-term information technology infrastructure and project planning for the Department. It is chaired by the Associate Secretary and meets quarterly. Its members include three Group Managers, two Branch Managers, and the chairs of any Information Technology sub-committees that are operating.
Indigenous Policy Forum
The Indigenous Policy Forum supports development of the Department’s approaches to whole-of-government Indigenous policy and service delivery. It is chaired by a Deputy Secretary and meets monthly, or as required. Members include a range of Group Managers, and the Registrar of Aboriginal Corporations.
◗
◗
◗
◗
◗
◗
◗
Program Management Committee
The Program Management Committee is responsible for overseeing the business process re-engineering project (BPR), strategies for improving the Department’s engagement with community service organisations, program redesign projects in FaCSIA, including ensuring that objectives and timeframes are met within agreed resources and oversighting the implementation of change processes. The committee is chaired by a Deputy Secretary and meets monthly. There are 10 Group Managers and two Branch Managers on the committee.
People Committee
The People Committee ensures human resources are aligned with the Department’s strategic directions and business priorities. It is chaired by the Group Manager, Corporate Support, and meets quarterly. The committee includes one Deputy Secretary, three Group Managers, three Branch Managers and two Managers from the Regional Network.
Research and Evaluation Committee
The Research and Evaluation Committee ensures research and evaluation is focused on FaCSIA’s strategic priorities, makes decisions on new investments in research and evaluation, and oversees major research and evaluation activities. It is chaired by the Deputy Secretary responsible for social policy and meets monthly. Three Group Managers and five Branch Managers are also on the committee.
Risk Assessment and Audit Committee
The Risk Assessment and Audit Committee (RAAC) provides independent assurance and assistance to the Secretary and EMG on the design and operation of the Department’s risk, control and compliance framework, and on its external accountability responsibilities. The Secretary has established RAAC in compliance with Section 46 of the Financial Management and Accountability Act 1999 and Section 2.1 of the Financial Management and Accountability Orders 2005.
Description of policies to manage impacts on communities in areas affected by activities, as well as description of procedures/programs to address this issue, including monitoring systems and results of monitoring
Participating in the community
During 2006–07, 40 staff members accessed volunteering leave.
Supporting Australian communities is a key business outcome for FaCSIA. It is also a motivating factor for many employees choosing to work for this Department. This passion to assist is evident in the way in which staff have responded at a personal level to major issues affecting our communities, both at home and abroad.
Staff have also shown their willingness to give their time and support to local community charities or non-profit organisations.
SO1
FaCSIA Sustainability Report 2006–07 | Social performance Social performance | FaCSIA Sustainability Report 2006–07

24 2�
FaCSIA’s internal corporate website has a dedicated volunteering page which provides information on support given to encourage staff to volunteer their time in the community. Throughout 2006–07, this site received 11,486 views equating to an average of 220 views per week.
FaCSIA recognises and supports staff in these activities through:
The FACSIA Social Club which plays the special role of fostering a sense of community, and of championing many good causes throughout the year such as ‘Shave for a Cure’ activities for the Leukaemia Foundation.
The FaCSIA Certified Agreement provides staff with a day’s leave for volunteering activities with an approved community organisation. This form of leave recognises that staff may wish to support community organisations and provides an opportunity to do so during business hours.
Promoting a selected range of one-off fundraising events such as the Australian Red Cross Blood Service, Hartley Lifecare and the recent Salvation Army Red Shield Appeal Corporate Challenge.
The FaCSIA Workplace Giving Program (WPG) is a voluntary program that allows staff to make a real difference to the community. Workplace Giving allows staff to donate directly from their pre-tax pay to a charitable or non-profit organisation of their choice. Organisations must have Deductible Gift Recipient (DGR) status, however, the majority of charities and non-profit community organisations already have this status.
FaCSIA also recognises that these activities are only those captured through the Department’s payroll and Workplace Giving Program (WPG) systems. The total number of staff accessing volunteering leave or utilising WPG does not include volunteering outside business hours, or donations made by staff outside the payroll system.
Providing capability developmentThe indicator reported against in this section is LA9:
Average hours of training per year per employee
Staff training hours
FaCSIA has delivered 105 corporately managed training programs over the 2006–07 financial year. The average number of training hours per person was 15.7, down by 4.11 per cent from last year. This may represent the logical flow-on from machinery-of-government changes with an expanded and remote network where formal training time is more challenging. However, the roll-out of e-learning modules and mixed-mode delivery looks to address this potential knowledge gap in regional locations. Unfortunately this increase in training availability will not impact on the reported statistics.
◗
◗
◗
◗
Integrated Capability Framework
The FaCSIA Strategic Framework identifies our Purpose, Business Outcomes, Core Business Processes, Leadership Model and Values. To support the Strategic Framework, FaCSIA has developed an Integrated Capability Framework which contains a set of descriptors underpinning each of the Core Business Processes, Leadership Capabilities and FaCSIA Values.
Developing FaCSIA capabilitiesA variety of avenues have been developed within FaCSIA to provide staff with the opportunity to develop individual capability within the Department, such as:
The Diploma of Government (Contract Management) is new to FaCSIA. It was identified by our senior executive as a business need for staff managing contracts involving funding agreements, and identified in an outcome from a recent Australian National Audit Office audit report.
E-learning is an online training system offered across FaCSIA which provides all staff with a flexible and accessible mode of learning for key corporate training such as Induction, Occupational Health and Safety, APS Code of Conduct, Diversity, and an overview of the Department’s Strategic Framework.
The FaCSIA Leadership Program is aimed at senior and middle managers and provides opportunities for staff at the SES and Executive levels to develop their skills and knowledge of managing people and leading change through a variety of mediums such as seminars, workshops and residential programs.
Calendar Priority Skills are offered based on FaCSIA’s Core Business Processes (CBP) —these include Financial Management in FaCSIA, Understanding your Accountabilities, Working with Commercial Contracts in FaCSIA, Contracts Management, Orientation, Working with Funding Agreements, Policy Development and Advice, and Issues Management, Writing to and for the Minister (advanced), and Managing Stakeholder Engagement.
Launch of Leadership Program by the Secretary
The FaCSIA Leadership Program was formally launched by the Secretary in March 2007. The Program is a suite of development opportunities designed to accommodate varying learning styles and capability needs based on the Department’s five key Leadership Capabilities. The Program is delivered through five key areas:
Monthly seminar series open to all staff where speakers from the public and private sectors are invited to share their leadership experiences. These seminar sessions have been attended by approximately 490 staff.
Two and a half day leadership residential, open to SES and EL2 staff and led by a FaCSIA General Manager as a Residential Sponsor.
Workshops, open to SES, EL2 and State-based EL1s, that focus on leading change and developing people management skills by providing staff with innovative and practical suggestions that can be applied in the workplace.
360 Degree Assessment and a debriefing feedback session offered to selected staff, and 23 staff participated in the first month of the program in June 2007.
◗
◗
◗
◗
◗
◗
◗
◗
LA9
FaCSIA Sustainability Report 2006–07 | Social performance Social performance | FaCSIA Sustainability Report 2006–07

26 27
Supporting and Leading Change program
The Supporting and Leading Change program was discontinued in July 2006 with the development of the new Leadership Program.
External Programs—including ANZSOG
A key component of the Leadership Program is the link to external development opportunities facilitated by the Australian Public Service Commission, including:
Australian and New Zealand School of Government (ANZSOG)
Career Development Assessment Centres (CDAC)
Leading Australia’s Future In the Asia-Pacific (LAFIA)
APSC Executive and Leadership programs and seminars.
Maintaining a healthy and safe work environmentThe indicator reported on in this section is LA7:
Standard injury, lost day and absentee rates, and the number of work-related fatalities
Occupational Health and Safety
FaCSIA is committed to the health and safety of its employees and recognises the importance of positive interventions aimed at improving employee health and safety. Investment in employee health will also improve performance through enhancing capacity.
FaCSIA acknowledges its employer responsibilities under the Occupational Health and Safety Act 1991 and seeks to meet them by:
creating and maintaining a safe and healthy working environment free from work related injury or disease
continuing to enhance existing strategies to avoid preventable injury or illness
creating management and employee awareness of health and safety issues and a culture that integrates occupational health and safety into everyday business and striving to achieve best practice in occupational health and safety.
Incident reports
During 2006–07:
no provisional improvement notices were issued.*
no improvement notices were issued.**
no dangerous occurrences were reported.* A provisional improvement notice is issued by a health and safety representative under certain provisions of the Occupational Health and Safety
(Commonwealth Employment) Act 1988, when a hazard has been identified or an injury has occurred. The hazard can then be addressed within an agreed timeframe.
** An improvement notice is a notice issued by a Comcare Investigator when a breach of the Occupational Health and Safety (Commonwealth Employment) Act 1988 is found to exist.
◗
◗
◗
◗
◗
◗
◗
◗
◗
◗
There were 120 Occupational Health and Safety (OH&S) incident reports lodged with FaCSIA’s OH&S Team in 2006–07 and 27 claims for workers compensation were linked to incident reports.
There were 42 claims lodged that were not linked to incident reports. That is, injuries which were cumulative such as overuse injuries and psychological injuries.
FaCSIA reported 10 incidents to Comcare, but none resulted in a Comcare investigation. The amount of lost time associated with claims lodged and accepted this year was 92.94 weeks for the Department.
An indication of the level of work that has been conducted to reduce workplace injuries is that Comcare have advised that FaCSIA’s Comcare premium will be reduced from 1.77 per cent of payroll for 2006–07 to 1.55 per cent of payroll for 2007–08. The reduction reflects the overall premium rate for all Commonwealth agencies. Further, FaCSIA will receive a Comcare bonus payment in excess of $120,000 in recognition of the effective management of injury claims by the People Branch OH&S Team and FaCSIA managers over the past three years.
As at 30 June 2007, the average sick leave usage for the financial year—calculated with a 2006–07 department average headcount of 2,819 was 6.96 days per employee. This is a decrease of 10 per cent (0.84 days) from 2005–06.
Achieving work-life balanceThe indicator reported on in this section is LA12:
Employee benefits beyond those legally mandated
FaCSIA is committed to helping employees balance their work, family and other personal priorities by providing a range of flexible and family-friendly working arrangements.
FaCSIA’s Certified Agreement and Individual Australian Workplace Agreements contain comprehensive initiatives in order to promote a balance of work and life.
In the 2005–06 State of the Service Report, 93 per cent of FaCSIA staff indicated that the flexible working conditions offered were the main element accounting for staff satisfaction.
2007–08 social commitmentsCommitments under the Reconciliation Plan, including:
cultural awareness for all staff
establishment of an Aboriginal and Torres Strait Islander staff mentoring program.
Roll-out of new Occupational Health and Safety compliance as required under the new Act.
Commence collection agreement negotiations for 2008–10 Certified Agreement.
Fund the establishment of a dedicated Assistive Technology resource.
Develop an approach for rolling staff ‘Pulse’ surveys.
Develop a comprehensive Government Business Manager guide to assist staff in their new, challenging roles in isolated locations.
◗
◗
◗
◗
◗
◗
◗
◗
LA7
LA12
FaCSIA Sustainability Report 2006–07 | Social performance Social performance | FaCSIA Sustainability Report 2006–07

Environmental performance

30 31
Environmental performance Environmental indicator summary tableProgress against 2006–07 commitments:
Commitment Status Performance
Continue to work on the water efficient redesign of Tuggeranong Office Park, ACT.
Ongoing The refurbishment of the Tuggeranong Office Park (TOP) is still in its early planning stages. A background paper has been completed on water efficiency issues for consideration in the refurbishment of TOP.
Maintain and upgrade ISO 14001 certification for Juliana House.
Achieved In December 2006, a surveillance and upgrade certification audit was completed for FaCSIA’s Juliana House Environmental Management System (EMS).
Ensure all future FaCSIA accommodation meets the highest feasible sustainability ratings.
Ongoing In April 2007 Centraplaza was opened, and designed to achieve a 5 star Australian Building Greenhouse Rating (ABGR). Office refurbishments in Canberra and Melbourne incorporated environmental performance measures. All new sites incorporate FaCSIA’s commingled waste management system.
Review and update the Greenhouse Challenge Plus Agreement to reflect changes in the tenanted site portfolio during 2006–07.
Not Achieved FaCSIA’s Greenhouse Challenge Plus Agreement with the Australian Greenhouse Office has not been updated to reflect changes in FaCSIA’s property portfolio as a result of machinery-of-government changes.
Work to reduce water use by developing a water management strategy in conjunction with a water use policy for Australian Government operations.
Ongoing FaCSIA’s new building, Centraplaza, opened during April 2007 and incorporates new water efficiency features.
Water efficiency is included in FaCSIA’s EMS. Water use has decreased at TOP, and Guilfoyle House.
Obtain a more detailed understanding of our patterns of waste generation and disposal through a waste audit of Tuggeranong Office Park.
Not Achieved The waste audit has not yet been conducted.
Environmental indicator summary table continued
Commitment Status Performance
Develop a more appropriate environmental performance data reporting methodology for Indigenous Coordination Centres.
Achieved Significant improvements in data collection and reporting for Indigenous Coordination Centres are reflected in a number of performance indicators in this section.
IntroductionThis year’s Sustainability Report 2006–07 reflects a challenging time in the environmental performance of FaCSIA.
During 2006–07, the Department has been managing the increased impact on operations of the integration of the Office of Indigenous Policy Coordination (OIPC), and more particularly Indigenous Coordination Centres, many of which are in rural and remote Australia. Performance across a range of areas has been affected as a result, and data generally reflects the increased consumption of energy. As the merger with OIPC only took place in the last few months of the 2005–06 financial year, the full impact of the change was not quantifiable until the end of 2006–07.
To make a comparison with this year’s figures more meaningful, estimates of annual figures, had OIPC been within the Department for the whole of the 2005–06 financial year, are presented in sections of this report.
Improvements in environmental performance that have been recorded in past years have been compromised by recent trends. The Department has focused on dealing with the combined effect of the expanded property portfolio, increased numbers of staff, and widened areas of responsibility. Future focus will now need to turn to renewed planning for performance improvement.
Significant work is needed to strengthen commitments, put in place a detailed strategy, communicate this effectively, and engage staff and stakeholders to ensure success.
Despite this trend, FaCSIA’s continuing effort in environmental performance has delivered some important environmental performance improvements throughout 2006–07:
greater energy efficiency delivered by new buildings and retrofitting of existing buildings
reduction in water use at key office sites.
The completion of a new national office building in Canberra was a significant focus from late 2006 to May this year. As described on page 37, the building incorporates some significant environmental design features. Other refurbishment projects throughout the Department have incorporated state of the art environmental features.
◗
◗
FaCSIA Sustainability Report 2006–07 | Environmental performance Environmental performance | FaCSIA Sustainability Report 2006–07

32 33
Table 6 | Overview of environmental performance
2004–0� 200�–06* 2006–07
Energy use from office tenant light and power
MJ 17,108,043 21,557,575 44,409,760
MJ per employee
9,086 11,004 14,211
Equivalent greenhouse emissions
tCO2–e 4,968 5,788 12,218
Energy use from vehicles MJ 6,506,190 5,904,634 17,735,037
MJ per employee
3,455 3,013 6,291
Equivalent greenhouse emissions
tCO2–e 475 482 1,352
Air travel tCO2–e 2,706 3,177 3,672
Paper consumption Tonnes 77.9 87.4 128.5
Kg per employee
41.4 44.3 41.1
Reams 29,977 33,618 49,407
Reams per employee
15.9 17.1 15.8
* Energy use data shown in this table for 2005–06 includes only the part year impact of the machinery-of-government changes which came into effect in 2006. This allows for a comparison of the actual increase in energy usage with 2006–07, which includes the full year impact of the changes.
Greater detail on performance for 2006–07 is given under the respective indicator headings which follow, including tables and graphs where provided.
Figure 3 | Proportional FaCSIA CO2–e estimates across car fleet, flights and
electricity consumption
FaCSIA electricity 71%FaCSIA flights 21%
FaCSIA car fleet 8%
There have been increases in greenhouse gas emissions due to increased air travel, vehicle usage and electricity consumption associated with staffing increases, and accounting for machinery-of-government changes for the full 2006–07 year. The largest proportional increase is in electricity, with a change from 61 per cent in 2005–06 to 71 per cent in 2006–07. Emissions resulting from air travel have reduced as a proportion from 34 per cent to 21 per cent while vehicle usage has increased from five per cent to eight per cent.
Environmental Management SystemThe indicators reported against in this section are EM1, EM2 and EM3:
Environmental management system conformance
Environmental performance improvement process
Integration of environment with other business management systems
In December 2006, the Environmental Management System (EMS) at Juliana House was certified to the international standard ISO14001 2004. The program began in May 2006 when a surveillance audit was conducted. In the lead up to the certification audit, the Environmental Performance Team conducted staff awareness meetings throughout Juliana House, in which the importance of staff behaviour was emphasised and improved technical measures were outlined. The meetings were positive and most staff engaged with the EMS.
Environmental performance data has continuously shown that Juliana House outperforms the remainder of the Department and, despite the age of the building, continues to perform well as a result of technical improvements and continued staff effort and commitment.
The opening of Centraplaza, with its state of the art environmentally friendly design, represents the next phase in development for the EMS. During April and May 2007, when staff were relocating to Centraplaza from other departmental buildings, further staff awareness meetings were held, with a positive response from staff. Technical improvements, including water and energy efficiency and a commingled waste management system, are already in place at Centraplaza.
Work on integrating environmental decision-making into other business management systems and processes, such as construction and procurement, continued in 2006–07. An example of this is in the construction and fit-out of the new Centraplaza building, and a number of offices in Canberra and Melbourne. Adhesives and materials used in furniture, fittings, and paint contain low or no volatile organic compounds. Furniture throughout Centraplaza contains recycled material and can be repaired rather than replaced.
EM1
EM2
EM3
FaCSIA Sustainability Report 2006–07 | Environmental performance Environmental performance | FaCSIA Sustainability Report 2006–07

34 3�
Electricity consumptionThe indicators reported against in this section are EN3, EN8 and EN17:
Direct energy use segmented by primary source
Greenhouse gas emissions
Initiatives to use renewable energy sources and increase energy efficiency
Energy use for office accommodation and greenhouse gas emissions associated with electricity consumption continue to be FaCSIA’s most significant environmental impact.
The Department manages and pays for electricity supplying office tenant light and power to 58 sites (see Appendix 4 for locations). This includes an additional six sites to those reported in 2005–06.
A commitment was made in the 2005–06 report to develop a more appropriate data reporting methodology for Indigenous Coordination Centres (ICCs). The data used for the 2005–06 report included data from the merger between OIPC and FaCS effective from May 2006 but could not accurately reflect the impact of ICCs on performance due to constraints with data collection and methodology.
This report includes energy used in ICCs, and adjustments to 2005–06 data have been made to provide a comparison on performance against 2006–07 data.
Table 7 | Tenant light and power, energy use and greenhouse emissions 2006–07 for sites listed at Appendix 4
2004–0� 200�–06* 2006–07 Per cent change 200�–06
to 2006–07
Total kWh 4,752,234 10,472,092 12,336,044 +17.80
kWh/m2 127 150** 170 +13.33
kWh per employee 2,524 3,777 3,947 +4.50
Total MJ 17,108,043 37,699,531 44,409,760 +17.80
MJ/m2 457.7 541.6** 613.4 +13.26
MJ per employee 9,086 13,600 14,211 +4.49
EN3
EN8
EN17
Table 7 | Tenant light and power, energy use and greenhouse emissions 2006–07 for sites listed at Appendix 4 continued
2004–0� 200�–06* 2006–07 Per cent change 200�–06
to 2006–07
Renewable electricity consumed (kWh)
176,803 169,266*** 195,145 +15.29
Total tCO2–e 4,968 10,203 12,218 +19.74
tCO2–e/m2 0.133 0.146** 0.169 +15.75
tCO2–e per employee 2.6 3.68 3.91 +6.25
* The numbers in 2005–06 are generally different to those reported last year as this report estimates the annual OIPC data for 2005–06 from the two months available data (May and June). A comparison on performance can then be made with 2006–07 as this period included a full year of energy data for OIPC.
Employee data for 2006–07 also allows for the additional non-FaCSIA staff in ICCs. An adjustment to 2005–06 staff numbers has also been made to allow for the impact of ICCs on the annualised energy usage.
** Correction due to total accommodation area reported in 2005–06 reducing by approx five per cent.
*** The percentage of renewable electricity for Tuggeranong Office Park was incorrect in the 2005–06 report. The tCO2–e figures have also been altered to reflect this reduction.
During 2006–07, FaCSIA procured electricity for an increased workforce and an expanded property portfolio. Energy use per employee was 14,211 MJ in 2006–07, and remains well above the revised Energy Efficiency in Government Operations Policy energy use intensity target of 7,500 MJ per employee per year.
The figure of 5,988,215 kWh consumed by the Department during 2005–06 has been annualised in this report to include a full year consumption for OIPC. This provides a basis for comparison with 2006–07 figures and shows an increased usage of 18 per cent.
The relocation of over 450 staff into the new energy efficient Centraplaza building was the focus of activity in 2006–07. This building is designed to use a significantly lower amount of electricity than other buildings in the remaining FaCSIA property portfolio. Centraplaza has accommodated staff primarily from Lovett Tower in the Woden Town Centre, which was one of the oldest buildings in FaCSIA National Office. This relocation should see some decline in the energy consumption per staff member.
In other positive moves, the refitting of the Victorian and South Australian State Offices, combined with the collocation of Indigenous Coordination Centres into these sites has commenced, with energy efficiency considerations and waste recycling requirements included in the projects.
FaCSIA Sustainability Report 2006–07 | Environmental performance Environmental performance | FaCSIA Sustainability Report 2006–07

36 37
Figure 4 | Total electricity consumed 2004–0� to 2006–07
Electricity sourced from renewable resources
As part of a whole-of-government electricity supply contract, electricity purchased for Juliana House and Tuggeranong Office Park contains eight per cent GreenPower. GreenPower (www.greenpower.gov.au) is an initiative which provides for the assurance that electricity purchased from participating energy retailers meets stringent environmental standards.
In 2006–07, a total 195,145 kilowatt hours of the Department’s total electricity purchased was GreenPower. This is estimated to have prevented the equivalent of 208 tonnes of greenhouse gases from being emitted.
Figure � | Renewable electricity consumed 2004–0� to 2006–07
155,000
160,000
165,000
170,000
175,000
180,000
185,000
190,000
195,000
200,000
kWh
2004–05 2005–06 2006–07
Energy management
Centraplaza provides an example of energy management through the design of light and heating and cooling systems.
Open plan areas have been located next to the windows to optimise the use of natural light. The windows are double glazed and fitted with adjustable roller blinds.
Lighting is managed by the Building Management System and, for energy efficiency, this is set to operate so that lights are movement-activated and are programmed to dim down during periods of inactivity. They will automatically switch off after a designated time period without detection of movement.
Centraplaza
Centraplaza, FaCSIA’s new national office building, will be a flagship for FaCSIA’s efforts towards economic, social and environmental sustainability. This means taking a different view of the way that we work. It especially means taking more responsibility for the things we do that impact our people, the environment and the communities in which we operate.
There will be a number of aspects of Centraplaza that will demonstrate this, such as:
Greenhouse gas reduction: through using less energy, purchasing GreenPower and utilising natural gas, Centraplaza will emit approximately one third of the average greenhouse gas equivalents compared to other FaCSIA sites.
Water reduction: rainwater capture and re-use, water-efficient bathroom fittings and minimal water-dependant landscaping will reduce water use to a minimum.
Staff wellbeing: adhesives and materials used in furniture, fittings and paint contain low or no volatile organic compounds; a key factor in ‘sick buildings’.
Staff in Centraplaza will be the most important factor in helping ensure that this green building operates in the way it has been designed. As the Minister for Community Services said at the opening in May 2007: ‘Centraplaza has set higher goals for building efficiency in Canberra while not losing sight of the importance of providing an attractive and efficient work environment for staff.’
Staff will be encouraged to:
Reduce: all staff (not just Centraplaza staff ) are encouraged to use iManage to avoid printing, however all printer and photocopy machines within Centraplaza will also have the capacity to print double-sided and two pages to a side.
Re-use: furniture throughout Centraplaza will contain recycled material (steel, wood) and can be repaired rather than replaced.
Recycle: facilities and systems have been established for the recycling of commingled waste (bottles, cans, etc.) organic waste, toner cartridges, paper, cardboard, polystyrene, and mobile phones.
◗
◗
◗
◗
◗
◗
0
2,000,000
4,000,000
6,000,000
8,000,000
10,000,000
12,000,000
14,000,000
kWh
2004–05 2005–06 2006–07
FaCSIA Sustainability Report 2006–07 | Environmental performance Environmental performance | FaCSIA Sustainability Report 2006–07

38 39
TransportThe indicators reported against in this section are EN3, EN8 and EN17:
Direct energy use segmented by primary source (transport)
Greenhouse gas emissions
Initiatives to use renewable energy sources and increase energy efficiency
The FaCSIA fleetFleet data is based on the Fringe Benefit Tax (FBT) year (1 April to 31 March).
The fleet consisted of 307 leased vehicles in 2006–07 compared to 126 vehicles in 2005–06. These increased figures include the effect of the merger of FaCS with the Office of Indigenous Policy Coordination (OIPC) in 2006.
This figure includes leases that have expired, new leases and vehicles gained and lost with staff movements throughout the year. The fleet is comprised of pool vehicles and non-pool vehicles provided to senior executive service staff as part of their salary package and staff on Australian Workplace Agreements.
An 18 per cent increase in the number of large four wheel drive vehicles added to the FaCSIA fleet through the merger of OIPC corresponds with the 18 per cent increase in the average fuel consumption of the fleet (Figure 6).
Table 8 | Environmental performance of the FaCSIA fleet
2004–0� 200�–06 2006–07 Per cent change 200�–06
to 2006–07
Total litres of fuel used 190,451 172,340 500,483 +190
Energy (MJ) 6,506,190 5,904,634 17,735,037 +200
Total kilometres 1,759,438 1,657,123 4,051,848 +144
Average fuel consumption (litres/100km)
10.8 10.4 12.35 +18.8*
Greenhouse gas emissions (tCO2
–e)475 482 1,352 +180
* An 18 per cent increase in the number of large 4WD vehicles added to the FaCSIA fleet through the merger of OIPC corresponds with the 18 per cent increase in the average fuel consumption of the fleet.
EN3
EN8
EN17
Figure 6 | Average fuel consumption of the FaCSIA fleet
9
9.5
10
10.5
11
11.5
12
12.5
Ave
rage
Fue
l Con
sum
ptio
n (l
itre
s/10
0km
)
2004–05 2005–06 2006–07
Green Vehicle Guide rating
The Green Vehicle Guide (GVG—www.greenvehicleguide.gov.au) rates vehicles on the amount of air pollution and greenhouse emissions they emit, and their fuel consumption. Typically, the GVG rating system ranges from four to 20, with the lower the number, the poorer the performance.
The Australian Government has set a performance target for department and agency fleet vehicles to ensure a minimum of 28 per cent of fleet vehicles have a GVG rating of 10.5 or better.
FaCSIA’s vehicle leasing policy specifies that all new leased pool vehicles must have a GVG rating of 10.5 or better, and unless supported by a business case for an alternative, to be an Australian four cylinder vehicle. During 2006–07, pool vehicles meeting or exceeding a GVG rating of 10.5 increased from 35 to 36.5 per cent . This indicates that the policy of replacing pool vehicles with models rated 10.5 or better is improving this percentage.
The Australian Government policy does not apply to non-pool vehicles such as those leased to senior executive service staff. The non-pool vehicle fleet accounts for 43 per cent of the total FaCSIA fleet. Provision is also made in the FaCSIA fleet policy guidelines to encourage employees to choose hybrid vehicles, and the increase in the percentage of 10.5 or greater GVG rated vehicles amongst non-pool vehicle fleet is positive.
Table 9 | Percentage of GVG-rated vehicles meeting or exceeding the GVG rating of 10.�
2004–0� FBT 200�–06 FBT 2006–07 FBT
Pool fleet 25 35 36.5
Non-pool fleet 15.8 20.59 24
FaCSIA Sustainability Report 2006–07 | Environmental performance Environmental performance | FaCSIA Sustainability Report 2006–07

40 41
Figure 7 | Percentage of GVG-rated vehicles meeting or exceeding the GVG rating of 10.�
0
5
10
15
20
25
30
35
40
Perc
enta
ge
2004–05 2005–06 2006–07
Non-pool fleetPool fleet
Using the shuttle bus
During 2006–07, FaCSIA and Centrelink continued to provide a free shuttle bus service for FaCSIA and Centrelink staff travelling in Canberra between Woden and Tuggeranong. This year, the number of staff trips taken on the bus increased by approximately 20 per cent, from 23,339 in 2005–06 to 28,190 in 2006–07. The number of trips taken by FaCSIA staff was 46 per cent of the total trips (13,070).
The increase in usage is reflected in a number of factors. A new office site has been opened at Greenway Waters and the shuttle bus diverted to operate via that point. In addition to this, an increase in staff numbers overall and greater awareness of the availability of the shuttle bus are driving an increase in patronage. The shuttle bus offers a convenient alternative for staff because it avoids the hassle of driving and car parking.
Without the shuttle bus, it is expected that approximately three quarters of those FaCSIA staff journeys, some 9,803 trips would have been made with alternative transport such as private vehicles, or taxis. This methodology recognises that some staff journeys will be shared when staff are travelling for the same purpose.
This year, the bus service saved the equivalent of approximately 18.6 tonnes of greenhouse gas emissions. Over the life of the shuttle bus services, it is estimated to have saved 56.4 tonnes of greenhouse gas emissions (from 2002–03 to present).
Table 10 | Total number of shuttle bus staff trips and tCO2–e saved
2004–0� 200�–06 2006–07 Per cent change 200�–06
to 2006–07
Total staff trips 19,395 23,339 28,190 20.8
Greenhouse Gas Emissions saved (tCO2
–e)7.3 11.8 18.6 57.6
FaCSIA staff trips 9,739 10,353 13,070 26.2
Estimated individual car trips saved
7,302 7,765 9,803 26.2
Figure 8 | Total number of staff trips and tonnes of CO2–e saved
0
5,000
10,000
15,000
20,000
25,000
30,000
0
2
4
6
8
10
12
14
16
18
20
2004–05 2005–06 2006–07
Tota
l num
ber o
f sta
ff tr
ips
Tonnes of CO2 equivalent saved
Total staff trips Greenhouse Gas Emissions saved (tCO2
–e)
Air travel
The Department recognises work-related air travel contributes to greenhouse gas emissions and is continuing work to report the environmental impact of air travel taken by staff. Approximately 30 per cent of the air travel reported is related to travel by non-departmental passengers on FaCSIA organised travel. This travel is included in the reported totals on kilometres travelled and the total warming effect.
In 2006–07, departmental staff flew 28,468,746 kilometres , producing 3,672 tonnes of CO2
–e. This is a dramatic increase compared to 2005–06 (see Table 11). This data now reflects the full effect of the merger in 2006 between FaCS and OIPC. In the final two months of 2005–06, when the OIPC was incorporated with FaCSIA, a significant increase in air travel was recorded. This reflects OIPC’s responsibility for communities in remote areas throughout Australia.
FaCSIA Sustainability Report 2006–07 | Environmental performance Environmental performance | FaCSIA Sustainability Report 2006–07

42 43
The main contributing factor was a 55 per cent increase in the distance travelled for domestic flights when compared against 2005–06. There was also a 20 per cent increase in distance travelled on international flights. Of the overall increase of 9,764,134 kilometres flown, approximately 97 per cent is attributable to domestic travel, and three per cent for international travel, which highlights the impact of the increase in domestic travel.
Measures to reduce the impact that domestic air travel is having on the total warming effect need to be considered. These include determining if travel for meetings can be reduced through the use of teleconferencing and potentially offsetting the emissions.
Table 11 | Estimated total distance and greenhouse gas emission of FaCSIA work-related flights*
2004–0� 200�–06 2006–07 Per cent change 200�–06
to 2006–07
Total kilometres travelled
16,747,445 18,704,612 28,468,746 52.20
Total tCO2–e 2,706 3,177 3,672 15.56
* The 2005–06 data includes flights taken by former OIPC staff.
Explanation of total warming effect
FaCSIA has used Greenfleet’s emissions calculator to report on the total warming effect of its 2006–07 flight emissions. Total warming effect accounts for the environmental impact of releasing greenhouse gases at flight altitude, where there is a greater impact when compared to the same gases being released at ground level.
The estimated total warming effect of the Department’s air travel for the year was 10,688 tCO2
–e , which is a substantially larger environmental impact than the 3,672 tCO2–e
calculated to burn the same amount of fuel at ground level.
Paper consumptionThe indicators reported against in this section are EN1 and EN2:
Total materials use other than water by type
Percentage of materials used that are waste from sources external to the reporting organisation
Printer and photocopier paper
FaCSIA continued to implement its 50 per cent recycled paper policy for A4 white printer and photocopier paper throughout 2006–07. This paper is made from 50 per cent Australian de-inked pulp and 50 per cent virgin fibre sourced from sustainably managed plantations, forests, and sawmill waste. The paper is manufactured in an ISO 14001 certified plant and meets government archival standards and requirements.
Last year’s Sustainability Report did not include paper consumed by OIPC, or for Indigenous Coordination Centres (ICCs). In this year’s report, we have achieved one of our commitments from the 2006–07 report for improved data from ICCs and have been able to incorporate their paper usage into the Department’s paper consumption statistics. The operations of OIPC have been integrated into FaCSIA, and all paper is now purchased as part of department-wide purchasing arrangements.
Whilst 2005–06 saw an increase in paper usage to over a ream per person, FaCSIA’s paper usage is now at its lowest since reporting began in 2002–03, and between 2005–06 and 2006–07 the Department recorded a 7.54 per cent fall in paper usage per person.
Initiatives that have been undertaken to reduce paper consumption include the use of the electronic document management system to circulate documents without printing, and the setting of default double sided printing in all departmental computers. These initiatives have been successful—staff are encouraged to minimise printing—and when they need to, maximise double sided printing. In 2003–04 the Department recorded a printing rate of 19.4 reams per staff member, and since these initiatives were introduced paper consumption rates have been consistently lower.
Table 12 | Printer and photocopier A4 white paper purchased (under department-wide paper supplier agreements)
2004–0� 200�–06 2006–07 Per cent change 200�–06
to 2006–07
Total tonnes 77.9 87.4 128.5 +48
Total reams 29,977 33,618 49,407 +48
Total sheets 14,988,500 16,809,000 24,703,500 +48
Kg/employee 41.4 44.3 41.1 –7.21
Reams/employee 15.9 17.1 15.8 –7.54
Sheets/employee 7,960 8,525 7,905 –7.27
EN1
EN2
FaCSIA Sustainability Report 2006–07 | Environmental performance Environmental performance | FaCSIA Sustainability Report 2006–07

44 4�
Figure 9 | Average paper use per employee from 2004–0� to 2006–07
15
15.5
16
16.5
17
17.5
Ream
s pe
r em
ploy
ee
2004–05 2005–06 2006–07
Waste and recyclingThe indicator reported against in this section is EN11:
Total amount of waste by type and destination
Fluorescent tube recycling
A partnership with Centrelink continues to ensure that all used fluorescent tubes from Canberra sites are disposed of in an environmentally appropriate manner. The management of the disposal of these tubes is an important part of ensuring that, as old fluorescent tubes are replaced through energy management initiatives, more waste is not sent to landfill. This year approximately 1,500 tubes were collected and reprocessed instead of being sent to landfill.
Water consumption
The indicator reported against in this section is EN5:
Total water use
Water consumption data is available for three Canberra sites: Juliana House in Woden, Guilfoyle House in Tuggeranong, and Tuggeranong Office Park. Water data is calculated by the net lettable area and the number of employees at each site.
EN11
Table 13 | Water consumption at FaCSIA sites where data is available
Total kL kL/m2 kL per employee
Juliana House
2004–05 7,206 1.08 17.00
2005–06 5,871 0.88 12.76
2006–07 6,448 0.97 14.33
Per cent change 2005–06 to 2006–07 9.83 9.83 12.27
Guilfoyle House
2004–05 615 0.38 6.80
2005–06 1,013 0.63 9.74
2006–07 783 0.48 7.32
Per cent change 2005–06 to 2006–07 –22.70 –22.70 –24.87
Tuggeranong Office Park (pro rata)*
2004–05 17,970 1.50 23.80
2005–06 24,407 2.01 32.33
2006–07 21,619 1.78 26.53
Per cent change 2005–06 to 2006–07 –11.42 –11.44 –17.95
* FaCSIA shares the Tuggeranong Office Park with Centrelink. As there is no separate metering, the water consumption is estimated through the net lettable area occupied by FaCSIA.
This year, water consumption for Juliana House rose by 9.83 per cent in total, and 12.27 per cent per employee. This increase is difficult to attribute to a specific cause. Current quarterly water usage data is not detailed enough to determine whether this increase is due to plumbing and equipment, seasonal variation (such as demands on air conditioning), or staff water use behaviours.
By contrast, Guilfoyle House demonstrated a reduction in water consumption, with a decrease of 22.7 per cent in total, and 24.8 per cent per employee. Adherence to water restrictions throughout the 2006–07 summer, combined with closer management of toilet flushing regimes can be attributed to this reduction.
The decrease in water consumption at Tuggeranong Office Park (TOP) could be partly attributed to conformance with Territory government water restrictions put in place for approximately half of 2006–07. The continuation of measures undertaken in 2005–06, such as the changes to the garden watering systems, better staff reporting of leaking taps and upgrading of toilets, have also contributed.
EN5
FaCSIA Sustainability Report 2006–07 | Environmental performance Environmental performance | FaCSIA Sustainability Report 2006–07

46
The TOP complex is expected to be sold in early 2008. After the sales transactions are complete, FaCSIA will have the opportunity to negotiate future options for the facility. These negotiations may result in opportunities to address inefficient water usage but also may result in alternative proposals for the site. An outcome of these negotiations is not expected to be achieved until the end of the financial year 2007–08.
Figure 10 | FaCSIA water consumption kL/m2 across three national office sites from 2004–0� to 2006–07
0
0.5
1
1.5
2
2.5
kL/m
2
2004–05 2005–06 2006–07
Juliana House
Guilfoyle House
Tuggeranong Office Park
Water reduction measures
Centraplaza incorporates water metering which will enable close examination of usage. Latest technology waterless, odourless urinals have been installed throughout the building, and flow regulators have been installed in all hand basins. Water efficiency has also been considered in all appliances such as dishwashers.
2007–08 environmental commitmentsDevelop a department-wide energy management and greenhouse gas reduction strategy and gain EMG support for implementation.
Continue to work to reduce waste to landfill by implementing recycling in National and State Office sites and green procurement practices nationally.
Reduce water use through cost-effective water reduction measures and developing a water-use reduction strategy for procurement, property management and accommodation requirements.
Review, update and gain EMG support for FaCSIA’s membership of the Greenhouse Challenge Plus Program.
◗
◗
◗
◗
FaCSIA Sustainability Report 2006–07 | Environmental performance
Economic performance

48 49
Economic performanceEconomic indicator summary tableProgress against 2006–07 commitments:
Commitment Status Economic performance
Ensure 90 per cent of invoices are paid within 30 days from receipt of goods and services.
Achieved 94 per cent of invoices were paid within 30 days from receipt of invoice.
Capture and report information on the purchase of goods and services from small to medium enterprises.
Achieved 21 per cent of goods and services purchased were from small to medium enterprises.
IntroductionIn an effort to continually improve the Department’s reporting scope, this year a number of new Global Reporting Initiative indicators for economic performance have been included. As these indicators are new, FaCSIA is at an early stage of re-engineering data gathering systems, and presenting the required information. These new indicators have been attempted in the interest of continually improving our reporting scope.
In 2006–07 FaCSIA continued to ensure that over 90 per cent of invoices are paid within agreed terms, and that over 10 per cent of goods and services purchased by the Department were from small to medium sized enterprises.
A highlight this year is that FaCSIA’s efficiency in delivering payments and services on behalf of the Government has again improved.
Economic efficiency
Revenues
FaCSIA is funded each year in the Australian Government Budget. Revenues from the Australian Government for the Department’s operations are presented in Table 14:
Table 14 | Revenues from Australian Government Budget 2004–0� to 2006–07
2004–0� 200�–06 2006–07 Per cent change 200�–06
to 2006–07
Amount funded for departmental operations
$448.1 million
$270.7 million
$407.4 million
66 per cent
Amount funded to pay service providers
$1,457.5 million
$1,199.9 million
$794.7 million
66 per cent
Economic viability
FaCSIA’s current ratio of assets to liabilities is 1.28:1 (2005–06: 1.74:1). The ratio measures the department’s short-term liquidity and indicates its ability to meet short-term debts.
At 30 June 2007, the Department’s net assets value was $171.3 million (2005–06: $131.0 million).
Efficiency in delivering
FaCSIA is responsible for delivering approximately $47 billion worth of payments and services on behalf of the government. The ratio of departmental expenses to the funding delivered is 0.026:1. In other words, it costs FaCSIA 2.6 cents (2005–06: 3.5 cents) to administer every dollar it delivers on behalf of the Government.
Supporting smaller airlines
During 2006–07 FaCSIA’s use of smaller airlines totalled 11.94 per cent of all domestic travel by the Department.
When Canberra and Sydney sectors (which has no smaller airlines available) are excluded, the proportion of smaller airlines used on all other routes is 14.2 per cent. This is an increase from 8.6 per cent in 2005–06. This increase in use reflects the Department’s increased travel requirements to rural and remote areas of Australia, in which smaller airlines operate. However, the figures also show that our use of airlines such as Virgin Blue and Rex has increased both in numbers and as a proportion.
Net sales
FaCSIA derives its revenue primarily through appropriations from the Australian Government.
Table 1� | FaCSIA Appropriations from the Australian Government by type for 2006–07
2006–07 $’000
DEPARTMENTAL
Revenue from Government 1,192,150
Other revenue 25,613
Capital 13,847
Subtotal 1,231,610
ADMINISTERED
Revenue from Government 46,781,248
Other revenue 278,291
Capital –
Subtotal 47,0�9,�39
TOTAL REVENUE 48,291,149
EC1
FaCSIA Sustainability Report 2006–07 | Economic performance Economic performance | FaCSIA Sustainability Report 2006–07

�0 �1
Suppliers and contractorsThe indicators reported against in this section are EC3 and EC4:
Cost of all goods, materials and services purchased
Suppliers
In 2006–07, the Department’s total expenditure on suppliers was $179.6 million ($115.3 million in 2005–06). Table 16 below shows the distribution of this expenditure across major categories, including a comparison of expenditure in 2006–07 against previous years.
Table 16 | Expenditure on suppliers from 2004–0� to 2006–07
Category $’ million 2004–0�
$’ million 200�–06
$’ million 2006–07
Travel 8.5 8.2 14.7
Consultants and contractors 53.2 42.8 67.3
Training 2.8 2.9 5.2
Motor vehicles 1.4 1.4 3.5
Publishing/printing 10.4 7.7 9.5
Communications (telephone and IT) 14.6 9.5 9.8
Property 15.9 23.0 13.7
General 27.1 2.7 28.5
Insurance and legal services 4.0 5.5 10.9
Licence fees 11.1 7.0 6.8
Postage 4.2 1.2 1.2
Office equipment 1.4 0.3 0.9
Financial summary 1.9 1.5 1.5
Office supplies 0.5 1.1 1.6
Freight 0.5 0.5 1.5
Total 1�8.7 11�.3 176.6
EC3
Percentage of contracts that were paid in accordance with agreed terms, excluding agreed penalty arrangements
Under Australian Government procurement guidelines, trading terms are for payment of suppliers’ invoices for less than $5 million within 30 days of receipt of the goods and services and a correctly rendered invoice.
In 2006–07, the percentage of FaCSIA payments to suppliers paid within agreed terms was 94 per cent (2005–06: 97 per cent).
Competitive tendering and contracting
Competitive tendering and contracting (CTC) shares responsibility for delivery of services previously performed in-house, with an external organisation or business.
FaCSIA has a range of CTC contracts in place that have had a significant impact on its administrative work. Several of these were reviewed, renewed or replaced during 2006–07 in accordance with existing contractual provisions; changes to the Department’s business needs, or amended service level requirements.
Contracts equal to or more than $100,000 that were entered into, or remained current during 2006–07, are reported in FaCSIA’s Annual Report. Details of all contracts over $100,000 are available on the Department’s website in accordance with Senate Order No. 192. Payments under these contracts are GST inclusive.
Consultants
During 2006–07, 248 new consultancy contracts were agreed involving total actual expenditure of $12.2 million. In addition, 64 ongoing consultancy contracts were active during the year involving total actual expenditure of $17.4 million.
Summary information on consultancy services for FaCSIA and the Social Security Appeals Tribunal (SSAT) is set out in the 2006–07 Annual Report.
Employee expensesThe indicator reported against in this section is EC5:
Total payroll and benefits (including wages, pension, other benefits and redundancy payments) broken down by region
Employee expenses include wages; health and fitness rebates; annual, sick, maternity, paternity, carers, recreational and cultural leave; and superannuation. For information about non-financial benefits see ‘Achieving work-life balance’ in the social performance section of this report.
EC4
FaCSIA Sustainability Report 2006–07 | Economic performance Economic performance | FaCSIA Sustainability Report 2006–07
EC5

�2 �3
Table 17 | Employee expenditure 2004–0� to 2006–07
2004–0� 200�–06 2006–07 Per cent change 200�–06
to 2006–07
Number staff employed at 30 June
1,883 2,540 3,052 20.1
Employee expenses $230.941 million
$166.297 million
$234.085 million
40.7
Taxes
Total sum of taxes of all types paid broken down by country
Fringe Benefits Tax (FBT)
FaCSIA is liable for FBT on the following benefits provided to employees:
expense Payment Benefits in the form of healthy lifestyle rebate, remote locality leave fare, HECS or studies reimbursement
living away from home allowance
car fringe benefits to SES officers through the Executive Leased Vehicle Scheme
car parking in relation to car parking spaces provided to employees*
meal entertainment in relation to meals or entertainment provided to FaCSIA employees*
residual benefits in the form of property (i.e. computers, office furniture) provided to employees for in-home partial business use.
* These benefits do not necessarily attract FBT liability in all cases.
The rate of FBT is 46.5 per cent of the taxable value of the benefit provided. The taxable value of benefits paid to FaCSIA employees for 2007 was $1,044,101, and the FBT payable on these benefits was $977,578.
Goods and Services Tax (GST)
FaCSIA is registered for GST. The Department collects GST on taxable supplies made and pays GST on taxable supplies purchased. FaCSIA is always in a net refund position in relation to GST.
◗
◗
◗
◗
◗
◗
Donations
Donations to community, civil society, and other groups broken down in terms of cash and in-kind donations per type of group
As a government department, FaCSIA cannot be involved in philanthropy involving taxpayer funds. However, the Department’s programs and operations bring direct economic benefits to communities across Australia.
Gross Expenditures
Gross expenditures broken down by type of payment
In 2006–07, FaCSIA’s gross expenditure was $48 billion. This expenditure is broken down by type of payment in Table 18.
Table 18 | Gross administered and departmental expenditures 200�–06 to 2006–07
Expenditure 200�–06 $ ’000
2006–07 $’000
Administered
Subsidies 11,739 12,586
Personal benefits 40,033,300 43,278,241
Grants 2,915,047 3,043,077
Suppliers 64,266 174,752
Other 77,078 272,592
Subtotal 43,101,430 46,781,248
Departmental
Employee expenses 166,297 234,085
Suppliers 115,264 179,644
Payments for service delivery 1,199,867 784,712
Other 16,616 24,743
Subtotal 1,498,044 1,223,184
Total expenditure 44,�99,474 48,004,432
2007–08 economic commitmentsEnsure 90 per cent of invoices are paid within 30 days from receipt of goods and services.
Capture and report information on the purchase of goods and services from small to medium enterprises.
◗
◗
EC8
EC10
FaCSIA Sustainability Report 2006–07 | Economic performance Economic performance | FaCSIA Sustainability Report 2006–07
PA8

�4
Appendices
FaCSIA Sustainability Report 2006–07 | Economic performance
�6 �7
Appendix 1Australian National Audit Office verification statementIndependent assurance statement to the Secretary of the Department of Families, Community Services and Indigenous Affairs—2006–07 Sustainability Report (to be supplied by client)
FaCSIA Sustainability Report 2006–07 | Appendices Appendices | FaCSIA Sustainability Report 2006–07

�8 �9
Appendix 2Indicators used in this report
Public agency indicators
Reference Indicator Page
PA1 Describe the relationship to other governments or public authorities and the position of the agency within its immediate governmental structures.
2
PA2 State the definition of sustainable development used by the public agency, and identify any statements or principles adopted to guide sustainable development policies.
3
PA3 Identify the aspects for which the organisation has established sustainable development policies.
4
PA4 Identify the specific goals of the organisation for each aspect listed in PA3.
4
PA� Describe the process by which the aspects and goals in both PA3 and PA4 were set.
5
PA6 For each goal, provide the following information:
implementation measures
results of relevant assessments of the effectiveness of those measures before they are implemented
state targets and key indicators used to monitor progress, with a focus on outcomes
description of progress with respect to goals and targets in the reporting periods, including results of key indicators
actions to ensure continuous improvement towards reaching the public agency’s goals and targets.
Post-implementation assessment and targets for next time period.
◗
◗
◗
◗
◗
5
PA7 Describe the role of and engagement with stakeholders with respect to the items disclosed in PA6.
12
Social indicators
Reference Indicator Page
Human rights—Indigenous rights indicator
HR12 Description of policies, guidelines and procedures to address the needs of Indigenous people
19
Labour practices—employment indicator
LA1 Breakdown of workforce by geographical region, status, employment type and employment contract
16
LA2 Net employment creation and average turnover 18
LA7 Standard injury, lost day and absentee rates, and the number of work related fatalities
26
LA9 Average hours of training per year per employee 24
LA10 Description of equal opportunity policies or programs, as well as monitoring systems to ensure compliance and results of monitoring
19
LA11 Composition of senior management and corporate governance bodies, including male/female ratio and other indicators of diversity as culturally appropriate
21
LA12 Employee benefits beyond those legally mandated 27
LA16 Description of programs to support the continued employability of employees and to manage career endings
18
Social performance—society
SO1 Description of policies to manage impacts on communities in areas affected by activities, as well as description of procedures/programs to address this issue, including monitoring systems and results of monitoring
23
Environmental indicators
Reference Indicator Page
Environmental performance—environmental indicators
EM1 Environmental management system conformance 33
EM2 Environmental performance improvement process 33
FaCSIA Sustainability Report 2006–07 | Appendices Appendices | FaCSIA Sustainability Report 2006–07

60 61
Environmental indicators continued
Reference Indicator Page
Environmental performance—environmental indicators
EM3 Integration of environment with other business management systems
33
EN1 Total materials used other than water, by type 42
EN2 Percentage of materials used that are wastes (processed or unprocessed) from sources external to the reporting organisation
42
EN3 Direct energy use segmented by primary source 34, 38
EN� Total water use 44
EN8 Greenhouse gas emissions 34, 38
EN11 Total amount of waste by type and destination 44
EN17 Initiatives to use renewable energy sources and to increase energy efficiency
34, 38
Economic indicators
Reference Indicator Page
Economic performance—economic indicators
EC1 Net sales 49
EC3 Cost of all goods, materials and services purchased 50
EC4 Percentage of contracts that were paid in accordance with agreed terms, excluding agreed penalty arrangements
51
EC� Total payroll and benefits (including wages, pension, other benefits and redundancy payments) broken down by region
51
EC8 Total sum of taxes of all types paid broken down by country 52
EC10 Donations to community, civil society, and other groups broken down in terms of cash and in-kind donations per type of group
53
PA8 Gross expenditures broken down by type of payment 53
Appendix 3Abbreviations and terms used in the environmental performance section
J Joule A unit of energy or work
kJ Kilojoule 1,000 joules
MJ Megajoule 1,000,000 joules
GJ Gigajoule 1,000,000,000 joules
W Watt A unit of power based on rate of energy use equal to one joule per second
kWh Kilowatt hour The kilowatt–hour (symbolised kWh) is a unit of energy equivalent to one kilowatt (1kW) of power expended for one hour (1 h) of time
t Tonne 1,000 kilograms
kL Kilolitre 1,000 litres
tCO2–e Tonnes of carbon
dioxide equivalentStandard measure of greenhouse gas emissions. It takes into account the varying global warming potential of different greenhouse gases
The United Nations lists carbon dioxide, methane, nitrous oxide, hydrofluorocarbons, perfluorocarbons and sulphur hexafluoride as greenhouse gases
One tonne of carbon dioxide equivalent would fill the average-sized three-bedroom house
Ream Equivalent to a ream of A4 printer/copier paper
A packet of A4 printer/copier paper contains 500 sheets
The average weight is approximately 2.6 kilograms
NLA(m2) Net Lettable Area Expressed in square metres
FaCSIA Sustainability Report 2006–07 | Appendices Appendices | FaCSIA Sustainability Report 2006–07

62 63
Appendix 4FaCSIA sites
FaCSIA site listings
ACT—FaCSIA—Hume—Raws Crescent
ACT— National Office—Canberra—Hobart Place, University Ave
ACT—National Office—Tuggeranong—28 Oakden St
ACT—National Office—Tuggeranong—Fernwood Gym, Cnr Soward Way and Scollay St
ACT—National Office—Tuggeranong—Greenway Waters, Cnr Anketell and Cowlishaw Sts
ACT—National Office—Tuggeranong—Guilfoyle House, Cnr Reed and Anketell Sts
ACT—National Office—Tuggeranong—Homeworld Building, Anketell St
ACT—National Office—Tuggeranong—Reed St
ACT—National Office—Tuggeranong—Tuggeranong Office Park
ACT—National Office—Woden—Bank House, Woden Town Square
ACT—National Office—Woden—Bonner House East, Neptune St
ACT—National Office—Woden—Centraplaza, Bowes St
ACT—National Office—Woden—Juliana House, Bowes St
ACT—OIPC—Phillip—10–16 Colbee Court
ACT—OIPC—Woden—Bradley St
ACT—OIPC National Office—Woden—Lovett Tower
NSW—FaCSIA State Office—Sydney—Oxford St
NSW—ICC—Bourke—Mertin St
NSW—ICC—Coffs Harbour—Duke St
NSW—ICC—Queanbeyan—Monaro St
NSW—ICC—Tamworth—180 Peel St
NSW—ICC—Tamworth—468–472 Peel St
NSW—ICC—Wagga Wagga—Cnr Thompson and O’Reilly Sts
NSW—OIPC State Office—Sydney—Elizabeth St
NT—FaCSIA State Office—Casuarina—Met Building, Scaturchio St
NT—ICC—Alice Springs—Jock Nelson Centre, Hartley St
NT—ICC—Katherine—Katherine Terrace
NT—ICC—Nhulunbuy—Commonwealth Centre, Endeavour Square
FaCSIA site listings continued
NT—ICC—Nhulunbuy—Lot 1470, Franklyn St
NT—ICC—Nhulunbuy—Miwatj Medical Centre, Arnhem Rd
NT—ICC—Tennant Creek—ATSIC Building, Paterson St
NT—OIPC State Office—Casuarina—Scaturchio St
QLD—FaCSIA Regional Office—Aitkenvale—155 Hugh St
QLD—FaCSIA State Office—Brisbane—Adelaide St
QLD—ICC—Cairns—Grafton St
QLD—ICC—Mt Isa—Simpson St
QLD—ICC—Rockhampton—Cnr Fitzroy and East Sts
QLD—ICC—Roma—McDowell St
QLD—ICC—Townsville—Stanley St
QLD—OIPC State Office—Brisbane—Edward St
SA—FaCSIA State Office—Adelaide—Currie St
SA—ICC—Ceduna—Cnr Merghiny and East Terrace
SA—ICC—Port Augusta—Stirling Rd
SA—OIPC State Office—Adelaide—Waymouth St
TAS—FaCSIA State Office—Hobart—Montpellier Building, Kirksway Pl
TAS—OIPC State Office—Hobart—Argyle St
VIC—FaCSIA State Office—Melbourne—Casselden Pl, Lonsdale St
VIC—OIPC State Office—Melbourne—Casselden Pl, Lonsdale St
WA—FaCSIA State Office—Perth—Central Park, St Georges Terrace
WA—ICC—Broome—Short St
WA—ICC—Derby—Hardman St
WA—ICC—Geraldton—Chapman Rd
WA—ICC—Geraldton—Lester Ave
WA—ICC—Kalgoorlie—Boulder Rd
WA—ICC—Kununurra—Coolibah Dve
WA—ICC—South Hedland—Brand St
WA—OIPC State Office—Perth—55 St Georges Terrace
WA—OIPC State Office—Perth—Adelaide Terrace
FaCSIA Sustainability Report 2006–07 | Appendices Appendices | FaCSIA Sustainability Report 2006–07

64 6�
How to find out more about this and other FaCSIA publicationsTo view and download a copy of the FaCSIA Sustainability Reports, and Annual Reports visit www.facsia.gov.au
To obtain a printed copy of the FaCSIA Sustainability Report or other FaCSIA publications phone 1800 050 009 (a free call except from mobile and pay phones).
Enquiries about this report should be directed to:
Branch Manager Corporate Strategy Branch Department of Families, Community Services and Indigenous Affairs PO Box 7788 Canberra Mail Centre ACT 2610 Email: [email protected] Fax: 02 6200 9572
FaCSIA Sustainability Report 2006–07 | Appendices FaCSIA Sustainability Report 2006–07