Embed Size (px)
Citation preview

SUSTAINABILITY INDEX AND INTEGRATED WATER RESOURCES MANAGEMENT OF THE
RIO VERDE GRANDE BASIN IN BRAZIL
Edson de Oliveira Vieira
Instituto de Ciências Agrárias/UFMG
Samuel Sandoval Solis Land, Air and Water Resources/Univ. of California - Davis
1

1. Introduction
• Verde Grande River Basin
• Several problems
• High variability in time and space of water resources
• Activities that demand a lot of water
• There is almost no infrastructure for WR
2

1. Introduction
• Droughts
• PET 2000 mm/year
• Precip 830 mm/year
30
100
200
300
400
500
600
700
800
900
Jul Aug Sep Oct Nov Dec Jan Feb Mar Apr May Jun
Pre
cip
itat
ion
(m
m)
Average 2000 - 2014
2014
2013
2012
Precipitation– Annual Average

2. Background
• Verde Grande Basin stands out for:
• Agricultural production (irrigated areas)
• Livestock• Expansion of Population (Urban)
• Industry (only AVG Subbasin)
• Water Conflicts have been recorded since 1980’s
4

2. Background
• In 2003, the creation of the Verde Grande river basin Committee (CBHVG –Comitê da Bacia Hidrográfica do Verde Grande) was approved by the National Water Resources Council (CNRH – Conselho Nacional de Recursos Hídricos)
• In 2011, “Water Resources Plan of the Verde Grande river basin (PRH Verde Grande)” was approved, which aimed to articulate the instruments of the National Water Resources Policy (PNRH)
5

2. Background
In the Water Plan of Verde Grande, three scenarios were envisaged for policy implementation:
• Interventions that were already planned or underway in relation to the increase in water supply - considered in the Trend Scenario.
• And Normative 1 and 2 in which performance of water management is present with successive efficiencies to increase both the water supply and efficient water use
6

2. Background
• However, in Verde Grande Basin, there are no studies that allow us to evaluate and compare the sustainability of different actions or methods of water management in different scenarios.
7
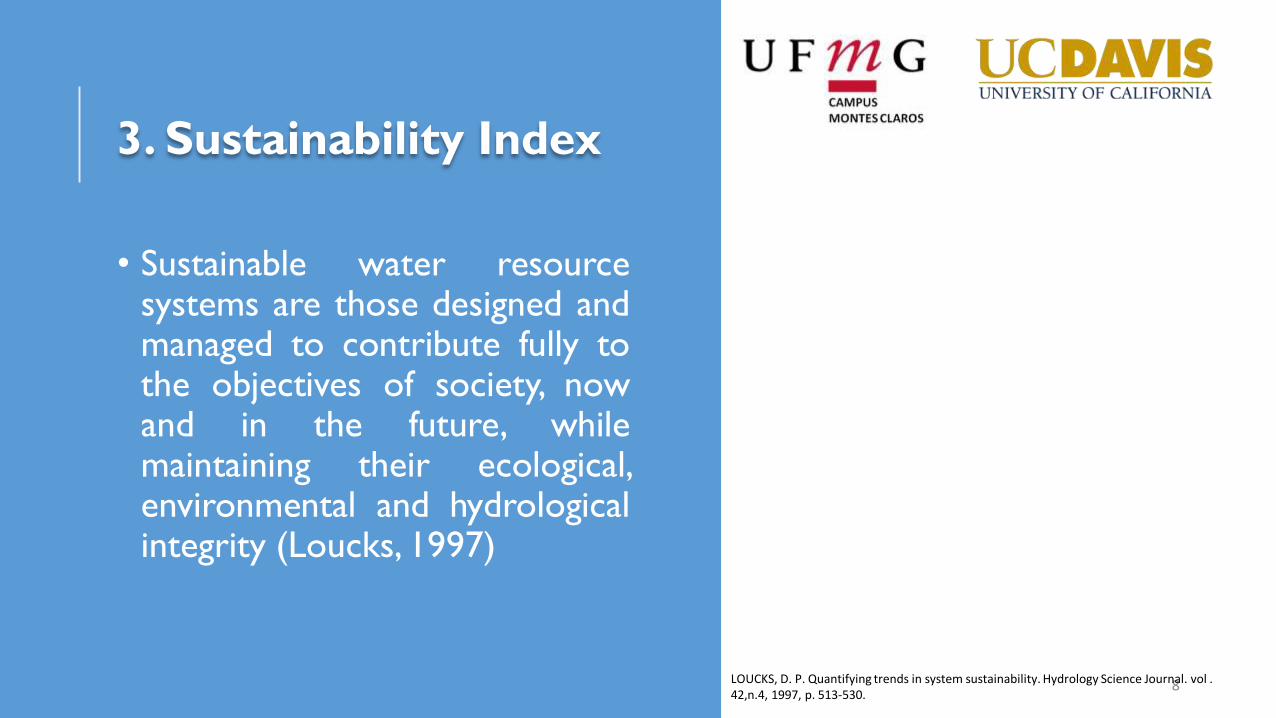
3. Sustainability Index
• Sustainable water resourcesystems are those designed andmanaged to contribute fully tothe objectives of society, nowand in the future, whilemaintaining their ecological,environmental and hydrologicalintegrity (Loucks, 1997)
8LOUCKS, D. P. Quantifying trends in system sustainability. Hydrology Science Journal. vol . 42,n.4, 1997, p. 513-530.

3. Sustainability Index
• Large emphasis has been given tothe adaptability of water resourcesand to measures that reduce thevulnerability of these systems for aproposed future scenario (Ceronet al, 2011; Sandoval-Solis et al,2011; Ceron et al, 2012; Cortés etal 2012).
• The vulnerability is the magnitudeof an adverse impact on a system.
9
Cerón,W. L.; Trujillo, A. R ; Escobar, Y. C. Modelo para el monitoreo y seguimiento de indicadoresde sostenibilidad del recurso hídrico em el sector agrícola. Cuadernos de Geografía, Vol.20, n.2,2011, p.77-89.
Cerón,W. L.; Trujillo, A. R ; Escobar, Y. C. Aplicacion del índice de sostenibilidad del recurso hídricoem la agricultura (ISRHA) para definir estrategias tecnológicas sostenibles em la microcuencaCentella. Ingenieria y Desarrollo. Universidad del Norte. Vol.30, n.2, 2012, p.160-181.
Cortés, A. E.; Oyarzún, R. ; Kretschmer, N. ; Chaves, H. ; Soto, G. ; Soto, M. ; Amézaga, J. ; Oyarzún,J. ; Rötting, T. ; Señoret, M. ; Maturana, H. Application of the Watershed Sustainability Index to theElqui river basin, North-Central Chile. Obras y Proyectos, vol.12, 2012, p.57-69.
SANDOVAL-SOLIS, S.; McKinney, D. C.; Loucks, D. P. Sustainability index for water resourcesplanning and management. Journal of water resources planning and management. vol. 137, n.5,Sep/Out. 2011. p381-390.

3. Sustainability Index
• Sustainability index (SI) of waterresources allows the user toevaluate and compare differentmethods of management andwater uses with regard to itssustainability.
• SI takes into account measuresof Reliability, Vulnerability andResilience
10

3. Sustainability Index
• Thus, given the increasingconflicts between water users inthe Verde Grande Basin, itbecomes necessary to evaluateand compare the many actionsproposed in the Water Planusing the sustainability index,taking into account the manywater users and futurescenarios
11

4. Objectives
Evaluate water management of Verde GrandeRiver Basin, Minas Gerais State, Brazil:
• 1. Evaluate the current and future watermanagement scenarios
• 2. Calculate the Sustainability Index (SI) ofwater resources;
• 3. Evaluate and compare water demand andwater supply for activities of the WaterResources Plan of Verde Grande basin inthree scenarios of water availability.
12

13
5. Methodology
• Characterization of the study area
• Area = 31,410 km²
• Main river (VG) = 577 km
• 768,000 inhabitants at 2011, (ANA, 2011)
• 8 Subbasins (Water Plan)
ANA, Agência Nacional das Águas. Plano dos Recursos Hídricos da Bacia Hidrográfica do Rio Verde Grande-
Relatório síntese. Brasília, 2011. 182p.

14
- Area 3,098 Km²,
- Highest stretches of VGB,
- Concentrates about 48% of all
population and the almost all
industries of the VGB
Area 7,107 Km²,- Largest cattle of VGB
- Area 1,934 Km²,- Smallest subbasin of VGB - Smallest population of whole
basin - Largest irrigated area with
more than 21,000 ha irrigated
Area is 2,113 Km²,- Largest reservoir of VGB- Second largest population of
the whole basin
- Area is 7,715 Km²,- Largest Subbasin of VGB

15
0%
20%
40%
60%
80%
100%
Industry Irrigation Livestock RuralPop UrbanPop
AVG
0%
20%
40%
60%
80%
100%
Irrigation Livestock RuralPop UrbanPop
MVG_TA
0.0%
20.0%
40.0%
60.0%
80.0%
100.0%
Irrigation Livestock RuralPop UrbanPop
MVG_TB
0.0%
20.0%
40.0%
60.0%
80.0%
100.0%
Irrigation Livestock RuralPop UrbanPop
AG
0%
20%
40%
60%
80%
100%
Irrigation Livestock RuralPop UrbanPop
MBG
0.0%
20.0%
40.0%
60.0%
80.0%
100.0%
Irrigation Livestock RuralPop UrbanPop
AVP
0%
20%
40%
60%
80%
100%
Irrigation Livestock RuralPop UrbanPop
BVP
0.0%
20.0%
40.0%
60.0%
80.0%
100.0%
Irrigation Livestock RuralPop
BVG
Water Demand by Subbasin

Geography of themodel
• 6 Control points• 3 in Verde Grande River
• 1 in Gorutuba River
• 1 in Mosquito River
• 1 in Verde Pequeno River
16

17
Million m³/year

Performance Criteria
18
1. Reliability (Frequency of sucess)
𝑅𝑒𝑙𝑖 =𝑁𝑜. 𝑜𝑓 𝑡𝑖𝑚𝑒𝑠 𝐷𝑡
𝑖 = 0
𝑛
𝐷𝑡𝑖 = ቐ
𝑋𝑇𝑎𝑟𝑔𝑒𝑡,𝑡𝑖 − 𝑋𝑆𝑢𝑝𝑝𝑙𝑖𝑒𝑑,𝑡
𝑖 , 𝐼𝑓 𝑋𝑇𝑎𝑟𝑔𝑒𝑡,𝑡𝑖 > 𝑋𝑆𝑢𝑝𝑝𝑙𝑖𝑒𝑑,𝑡
𝑖
0 , 𝐼𝑓 𝑋𝑇𝑎𝑟𝑔𝑒𝑡,𝑡𝑖 = 𝑋𝑆𝑢𝑝𝑝𝑙𝑖𝑒𝑑,𝑡
𝑖
Deficits
2. Resilience (Quickness of recovery)
𝑅𝑒𝑠𝑖 =𝑁𝑜. 𝑡𝑖𝑚𝑒𝑠 𝐷𝑡
𝑖 = 0 𝑓𝑜𝑙𝑙𝑜𝑤𝑠 𝐷𝑡𝑖 > 0
𝑁𝑜. 𝑡𝑖𝑚𝑒𝑠 𝐷𝑡𝑖 > 0 𝑜𝑐𝑜𝑟𝑟𝑒𝑑
3. Vulnerability (Severity of deficits)
𝑉𝑢𝑙𝑖 =
σ𝑡=0𝑡=𝑛𝐷𝑡
𝑖
𝑁𝑜. 𝑜𝑓 𝑡𝑖𝑚𝑒𝑠 𝐷𝑡𝑖 > 0 𝑜𝑐𝑜𝑟𝑟𝑒𝑑
𝑋𝑇𝑎𝑟𝑔𝑒𝑡𝑖
𝐷𝑡𝑖 = Deficits𝑋𝑇𝑎𝑟𝑔𝑒𝑡𝑖 = 𝑤𝑎𝑡𝑒𝑟 𝑑𝑒𝑚𝑎𝑛𝑑
𝑋𝑆𝑢𝑝𝑝𝑙𝑖𝑒𝑑𝑖 = 𝑤𝑎𝑡𝑒𝑟 𝑆𝑢𝑝𝑝𝑙𝑖𝑒𝑑
t = time periodi = water user
4. Maximum Deficit
𝑀𝑎𝑥 𝐷𝑒𝑓𝑖 =max 𝐷𝑎𝑛𝑛𝑢𝑎𝑙
𝑖
𝑊𝑎𝑡𝑒𝑟 𝑑𝑒𝑚𝑎𝑛𝑑𝑖

Sustainability Index
• Sustainability (SI) Index proposed bySandoval-Solis et al. (2011) variation ofLoucks’ SI (Loucks 1997)
• Values vary from 0 – 1
• There is implicit weighting becausethe index gives added weight to thecriteria with worst performence
19
𝑆𝐼𝑖 = 𝑅𝑒𝑙𝑖 ∗ 𝑅𝑒𝑠𝑖 ∗ 1 − 𝑉𝑢𝑙𝑖 ∗ 1 − 𝑀𝑎𝑥 𝐷𝑒𝑓𝑖ൗ1 4
𝑆𝐼𝑖 = ෑ
𝑚=1
𝑀
𝐶𝑚𝑖
1𝑀
𝐶𝑚𝑖 = Performance Criteria
M = No. of Performance Criteria
𝑆𝐺𝐺𝑟𝑜𝑢𝑝𝐾 =
𝑖=1∈𝑘
𝑖=𝑗=𝑘
𝑊𝑢𝑠𝑒𝑟 𝑖 x 𝑆𝐼𝑈𝑠𝑒𝑟 𝑖

WEAP Software
• Input data:
• Land use
• Land cover information
• Climate
• Precipitation
• Temperature
• Relative Humidity
• Wind Velocity
• Stream flow
• Reservoir data
20

WEAP Software
• Demand data: (Water Users)
• Urban Population
• Rural Population
• Livestock
• Irrigation
• Industry (AVG)
21

WEAP Software
• Period of analysis:
• Time step - Monthly
• 2000 – 2014 – Historic (Calibration andValidation)
• 2015 – 2030 – Future Scenarios
22

23
0
500000
1000000
1500000
2000000
2500000
3000000
3500000
4000000
4500000
Jan
-00
May
-01
Sep
-02
Jan
-04
May
-05
Sep
-06
Jan
-08
May
-09
Sep
-10
Jan
-12
May
-13
Sep
-14
Jan
-16
May
-17
Sep
-18
Jan
-20
May
-21
Sep
-22
Jan
-24
May
-25
Sep
-26
Jan
-28
May
-29
Sep
-30
Wat
er R
equ
irem
ent (
Mill
m³) Irrig_AVG
Pecuaria_AVGPopRural_AVGPopUrban_AVG
Historic
Future Data (Water Plan)
0
5000000
10000000
15000000
20000000
25000000
30000000
Jan
-00
Mar
-01
May
-02
Jul-
03
Sep
-04
No
v-05
Jan
-07
Mar
-08
May
-09
Jul-
10
Sep
-11
No
v-12
Jan
-14
Mar
-15
May
-16
Jul-
17
Sep
-18
No
v-19
Jan
-21
Mar
-22
May
-23
Jul-
24
Sep
-25
No
v-26
Jan
-28
Mar
-29
May
-30
Wat
er R
equ
irem
ent (
Mill
m³)
Irrig_AVGPecuaria_AVGPopRural_AVGPopUrban_AVG
Historic DataFuture Data (Water Plan)
Water Required – MVG_TAWater Required - AVG
Water Demand Foreseen in Water Plan of Verde Grande

24

Scenarios of Analysis
• Baseline (no actions)
• Trend
• Normative 1
• Normative 2
25
ACTIONS Nº
Start
Year
Import water from Congonhas Dam 2m³/s 1 2018
Water Diversion From São Francisco River 1.5m³/s 2 2020
Water Diversion From São Francisco River 1.5 (3m³/s) 3 2025
Water Diversion From São Francisco River 1.5 (4.5m³/s) 4 2028
Rio Verde Dam 0.15m³/s 5 2025
Cocos Dam 0.05m³/s 6 2025
Pedras Dam 0.04m³/s 7 2028
Mamonas Dam 0.05m³/s 8 2028
São Domingos Dam 0.42m³/s 9 2028
SCENARIOS 2015 2016 2017 2018 2019 2020 2021 2022 2023 2024 2025 2026 2027 2028 2029 2030
Trend 1 1 1 1 1 1 1 1 1 1 1 1 1
Normative 1 1 1 1,2 1,2 1,2 1,2 1,2 1,2,3 1,2,3 1,2,3 1,2,3 1,2,3 1,2,3
Normative 2 1 1 1,2 1,2 1,2 1,2 1,2 1 - 6 1 - 6 1 - 6 1 - 9 1 - 9 1 - 9

26
0.00
10.00
20.00
30.00
40.00
50.00
60.00
70.00
1/1
/20
00
6/1
/20
00
11/1
/200
0
4/1
/20
01
9/1
/20
01
2/1
/20
02
7/1
/20
02
12/1
/200
2
5/1
/20
03
10/1
/200
3
3/1
/20
04
8/1
/20
04
1/1
/20
05
6/1
/20
05
11/1
/200
5
4/1
/20
06
9/1
/20
06
2/1
/20
07
7/1
/20
07
12/1
/200
7
5/1
/20
08
10/1
/200
8
3/1
/20
09
8/1
/20
09
1/1
/20
10
6/1
/20
10
11/1
/201
0
4/1
/20
11
9/1
/20
11
2/1
/20
12
7/1
/20
12
12/1
/201
2
5/1
/20
13
10/1
/201
3
3/1
/20
14
8/1
/20
14
Stre
amfl
ow
(m³/
s)
Observed (m3/s)
Predicted (m3/s)
STATISTICMean, m³/s 7.83Median, m³/s 2.95Standard Deviation, m³/s 10.44Pearson's Correlation 0.91Coefficient of Determination 0.82Index of Agreement (Willmott) 0.95Coefficient of Efficiency (Nash) 0.82
Calibration

27
STATISTICMean, m³/s 12.10Median, m³/s 6.15Standard Deviation, m³/s 13.92Pearson's Correlation 0.83Coefficient of Determination 0.70Index of Agreement (Willmott) 0.90Coefficient of Efficiency (Nash) 0.69
0.00
10.00
20.00
30.00
40.00
50.00
60.00
70.00
80.00
90.00
100.00
1/1
/200
0
6/1
/200
0
11/1
/200
0
4/1/
2001
9/1/
2001
2/1/
2002
7/1/
2002
12/1
/200
2
5/1/
2003
10/1
/200
3
3/1
/200
4
8/1
/200
4
1/1
/200
5
6/1
/200
5
11/1
/200
5
4/1
/200
6
9/1
/200
6
2/1
/200
7
7/1
/200
7
12/1
/200
7
5/1
/200
8
10/1
/200
8
3/1
/200
9
8/1
/200
9
1/1
/201
0
6/1
/201
0
11/1
/201
0
4/1
/201
1
9/1
/201
1
2/1
/201
2
7/1
/201
2
12/1
/201
2
5/1
/201
3
10/1
/201
3
3/1
/201
4
8/1
/201
4
Stre
amfl
ow
(m³/
s)
Observed (m3/s)
Predicted (m3/s)
Calibration

RESULTS
28

29
0.0
10.0
20.0
30.0
40.0
50.0
60.0
70.0
80.0
90.0
100.0
Baseline Tendencial Normative 1 Normative 2
AVG - Vulnerability Irrigation
livestock
RuralPop
UrbanPop
0.0
10.0
20.0
30.0
40.0
50.0
60.0
70.0
80.0
90.0
100.0
Baseline Tendencial Normative 1 Normative 2
AVG - Max Deficit Irrigation
livestock
RuralPop
UrbanPop
0.0
10.0
20.0
30.0
40.0
50.0
60.0
70.0
80.0
90.0
100.0
Baseline Tendencial Normative 1 Normative 2
AVG - Resilience Irrigation
livestock
RuralPop
UrbanPop
0.0
10.0
20.0
30.0
40.0
50.0
60.0
70.0
80.0
90.0
100.0
Baseline Tendencial Normative 1 Normative 2
AVG - Reliability (Volume)Irrigation
livestock
RuralPop
UrbanPop

30
0.0
20.0
40.0
60.0
80.0
100.0
Baseline Tendencial Normative 1 Normative 2
MVG_TB - Reliability (Volume)Irrigation
livestock
RuralPop
UrbanPop
0.0
10.0
20.0
30.0
40.0
50.0
60.0
70.0
80.0
90.0
100.0
Baseline Tendencial Normative 1 Normative 2
MVG_TB - VulnerabilityIrrigation
livestock
RuralPop
UrbanPop
0.0
10.0
20.0
30.0
40.0
50.0
60.0
70.0
80.0
90.0
100.0
Baseline Tendencial Normative 1 Normative 2
MVG_TB - Max DeficitIrrigation
livestock
RuralPop
UrbanPop
0.0
10.0
20.0
30.0
40.0
50.0
60.0
70.0
80.0
90.0
100.0
Baseline Tendencial Normative 1 Normative 2
MVG_TB - Resilience
Irrigation
livestock
RuralPop
UrbanPop

Baseline
vs
Trend Scenario
19.4%
48.3%
31.8%29.9%
28.0%
1.1%
6.5%
26.5%
50.6%50.2%
34.2%
29.7%
0%
10%
20%
30%
40%
50%
60%
AVG MVG_TA MVG_TB AG MBG AVP BVP BVG
Sust
ain
abili
ty In
dex
(%
) Baseline
Trend Scenario
Sustainability Index

Baseline
vs
Normative 1
19.4%
48.3%
31.8%29.9%
28.0%
1.1%
6.5%
26.5%
54.7% 55.6%
41.4%
30.4%
29.0%
39.6%
0%
10%
20%
30%
40%
50%
60%
AVG MVG_TA MVG_TB AG MBG AVP BVP BVG
Sust
ain
abili
ty In
dex
(%
)
Baseline
Normative 1
Sustainability Index

Baseline
vs
Normative 2
Sustainability Index19.3%
47.8%
31.2% 30.0% 27.9%
1.1%
6.1%
25.5%
54.3% 54.5%
40.1%31.6%
30.2%
0%
10%
20%
30%
40%
50%
60%
70%
80%
90%
100%
AVG MVG_TA MVG_TB AG MBG AVP BVP BVG
Sust
ain
abili
ty In
dex
(%
)
Baseline
Normative 2

34
Sustainability Index of VG BasinSustainability Index by Group
0%
20%
40%
60%
80%
100%
Irrigation livestock RuralPop UrbanPop
Baseline Trend Normative 1 Normative 2
24.8%
28.2%
31.3%
41.7%
10%
15%
20%
25%
30%
35%
40%
45%
Baseline Trend Normative 1 Normative2

• The Sustainability Index identified policies that improved the water availability of Verde Grande for the future.
• The Sustainability index shows that water supply in all scenarios in VGB is still unsustainable because the maximum deficit problem has not been solved.
• The comparison of the SG among different water users identified that the water policies have significantly improved the water supply only for the Urban Population user.
• Considering the whole VGB, there are no significant improvements in water supply with implementation of the policies proposed by the Water Resources Plan for the Verde Grande river basin.
35
CONCLUSIONS

OBRIGADO
THANK YOU
GRACIAS
GRAZIE
MERCI
SHUKRAN
XIE XIE
오브리
با تشکر از شما
36