Embed Size (px)
Citation preview

Playtech plc Sustainability and Responsible Business Addendum to the Annual Report 2020

Contents1 Introduction2 Our Sustainability Strategy3 Materiality5 Summary of 2020 ESG Data8 Reporting Methodology15 GRI and SASB Indicators Index
Sustainability and Responsible Business Addendum to the Annual Report 2020
1Playtech plc Sustainability and Responsible Business Addendum to the Annual Report 2020
Sustainability and Responsible Business Addendum
Introduction
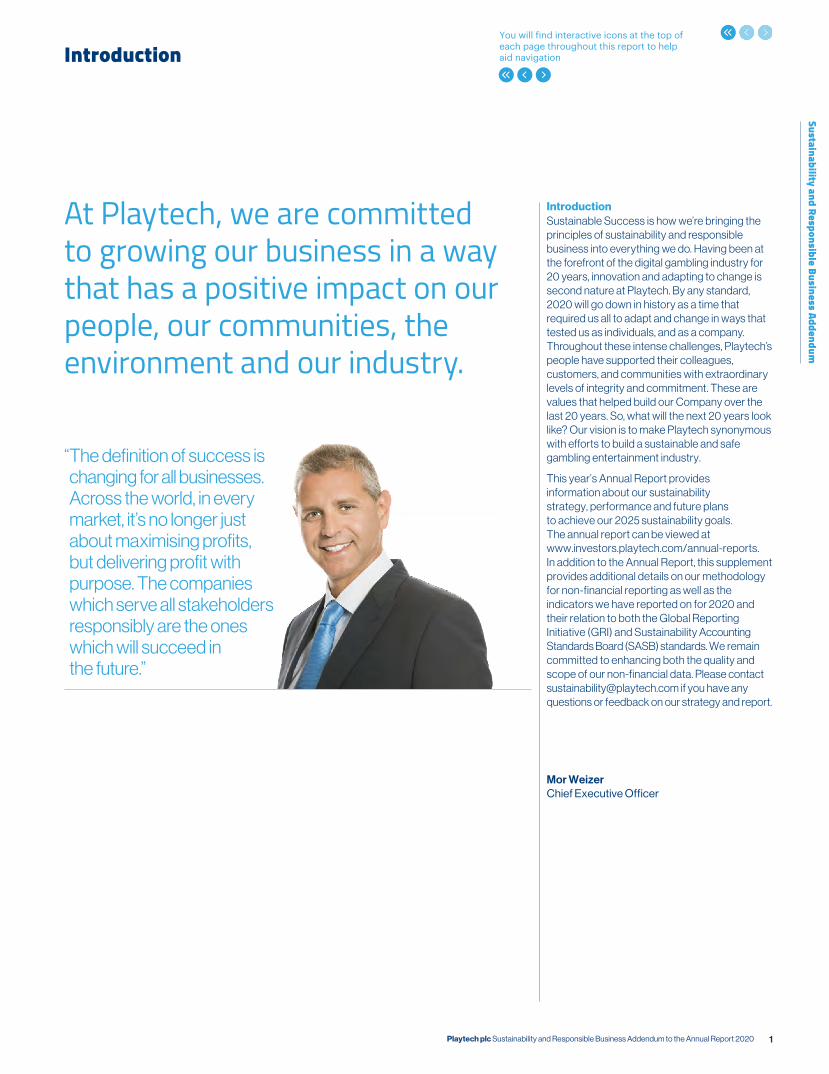
At Playtech, we are committed to growing our business in a way that has a positive impact on our people, our communities, the environment and our industry.
IntroductionSustainable Success is how we’re bringing the principles of sustainability and responsible business into everything we do. Having been at the forefront of the digital gambling industry for 20 years, innovation and adapting to change is second nature at Playtech. By any standard, 2020 will go down in history as a time that required us all to adapt and change in ways that tested us as individuals, and as a company. Throughout these intense challenges, Playtech’s people have supported their colleagues, customers, and communities with extraordinary levels of integrity and commitment. These are values that helped build our Company over the last 20 years. So, what will the next 20 years look like? Our vision is to make Playtech synonymous with efforts to build a sustainable and safe gambling entertainment industry.
This year’s Annual Report provides information about our sustainability strategy, performance and future plans to achieve our 2025 sustainability goals. The annual report can be viewed at www.investors.playtech.com/annual-reports. In addition to the Annual Report, this supplement provides additional details on our methodology for non-financial reporting as well as the indicators we have reported on for 2020 and their relation to both the Global Reporting Initiative (GRI) and Sustainability Accounting Standards Board (SASB) standards. We remain committed to enhancing both the quality and scope of our non-financial data. Please contact [email protected] if you have any questions or feedback on our strategy and report.
Mor WeizerChief Executive Officer
“ The definition of success is changing for all businesses. Across the world, in every market, it’s no longer just about maximising profits, but delivering profit with purpose. The companies which serve all stakeholders responsibly are the ones which will succeed in the future.”
You will find interactive icons at the top of each page throughout this report to help aid navigation

2 Playtech plc Sustainability Supplement 2020
Sustainability and Responsible Business Addendum to the Annual Report 2020
Our Sustainability Strategy
It is about raising standards for Playtech and the whole of the gambling sector. Sustainable Success is built around our commitments to powering safer gambling, promoting integrity and inclusivity, and partnering on shared societal challenges. By bringing our passion for innovation to this ambition, we are determined to be a leader in the digital entertainment industry. Sustainable Success builds on Playtech’s strong tradition of responsible business practices. The strategy helps us to align our culture and values with our plans and ambitions and to effectively focus our attention, energy, and resources on our most material social and environmental issues.
At the heart of Sustainable Success are three commitments:
• powering safer gambling solutions;
• promoting integrity and an inclusive culture; and
• partnering on shared societal challenges.
We have set goals for each of these commitment areas and will report on our progress year on year.
Sustainable Success is how we are bringing the principles of sustainability and responsible business into everything we do.
Powering safer gambling solutions
Promoting integrity and an inclusive culture
Partnering on shared societal challenges
• Increase uptake of safer gambling technology, tools and solutions
• Harness investment in R&D to advance the next generation of safer solutions and features — including responsible game design
• Strengthen safer gambling standards and technology across our operations
• Promote integrity and reduce compliance risk across our operations and supply chain
• Strengthen data security and privacy practices across the business
• Reduce our carbon footprint by 40% by 2025
• Strengthen diversity and inclusion and reduce the gender pay gap
• Help people live healthier online lives and adopt digital resilience and safer gambling behaviours
• Increase employee participation in and contribution to volunteering
• Contribute to and support research, education and training to prevent, reduce and address gambling-related harm
2025 sustainability strategy
A trusted, global leader in safer products, data analytics and player engagement solutions to raise industry standards
Playtech creates technology that changes the way people experience gambling to build a sustainable and safe entertainment industry
Purpose
Values
Ambition
Integrity Innovation Excellence Performance
Commitments

3Playtech plc Sustainability and Responsible Business Addendum to the Annual Report 2020
Sustainability and Responsible Business Addendum
Materiality
Playtech defines an issue as being material if it is considered important by key stakeholders and could have a significant financial impact on the business. As such, the business considers both risks and opportunities as part of the materiality assessments. The most recent materiality assessment started in Q4 2020. For this, Playtech conducted a systematic scan of the priority issues for the gambling sector, as defined by investors and the wider financial community, employees, licensees, gambling charities, regulators and the media. The Company then grouped together the long list of issues into more meaningful clusters, which were prioritised through a variety of exercises, including internal interviews as well as input and validation via interviews with a selection of external stakeholders. Lastly, the draft outcomes were presented to our newly formed Stakeholder Advisory Panel which provided additional insights and made recommendations for keeping the assessment up to date in the future.
Issues that matter to Playtech and society
The diagram on the next page provides a visual overview of Playtech’s ESG concerns segmented by; strategic, operational, material and emerging issues. Emerging issues typically represent challenges that may not be on stakeholders’ radar yet but are instrumental in the Group’s planning for the future.
While this may break with usual conventions around materiality assessments, Playtech is a unique business, spanning both the technology and gambling industry classifications for environment, social and governance (ESG) benchmarks. To that end, the Company has taken into account material issues from both sectors in its materiality assessment.
Playtech operates in a world that is ever changing. Regularly assessing which issues are most material to the business and industries it operates in is essential to successfully test and develop the Group’s responsible business strategy and reporting.

4 Playtech plc Sustainability and Responsible Business Addendum to the Annual Report 2020
Sustainability and Responsible Business Addendum to the Annual Report 2020
• Safer gambling embraces areas such as games design and product safety, marketing, investment in research, education and treatment (RET), customer engagement, regulation, data analytics and the use of AI
• Carbon efficiency and reduction covers policies, initiatives and performance relating to climate change prevention, mitigation and adaptation
• Corporate governance (ESG) refers to elements of governance that relate to the social and environmental aspects of sustainability such asBoard diversity and experience, incentives and remuneration, as well as integration of sustainability into decision making
• Financial crime focuses on anti-money laundering (AML), anti-bribery and corruption (ABC), tax evasion and professional integrity
• Human capital management covers issues such as talent attraction and retention, employee engagement, training and development,and diversity and inclusion
• Data protection and cybersecurity relates to policy, governance and resourcing as well as operational KPIs including breachesand compliance costs
• Employee health and safety which relates to looking after the mental and physical health of employees – a concern that has come further tothe fore as a result of COVID-19.
To date, materiality has helped inform the development of Sustainable Success and, in the future, the insights gained will help to refine it further. The approach to materiality is dynamic and will continue to evolve and adapt, ensuring assessments help the business to capture changes in the business and in society, as well as focusing reporting and ESG disclosures.
Impact on Playtech High
Imp
orta
nce
to s
take
hold
ers
H
igh
* Sharp increase in importance due to COVID-19.** Relevant to Snai only.
Tax transparency
StrategicSafer gambling
Material
Operational
Ethics of AI
Emerging
Data protection and cybersecurity
Community investment
Lobby andpublic policy
Biodiversity
Waste
Conflict mineralsWater security**
Labour standards
Responsible supply chain
Carbon reduction and efficiency
Corporate governance (ESG)
Human capital management
Employee health and safety*
Financial crime
Digital wellbeing and resilience
Materiality continued
Sustainability Materiality Matrix
The seven issues identified as being the most material are:

5Playtech plc Sustainability and Responsible Business Addendum to the Annual Report 2020
Sustainability and Responsible Business Addendum
2020 2019 2018 GRI SASB Notes
Pillar 1 – POWERING SAFER GAMBLING SOLUTIONS
Escalations to licensees – iPokerAML (%) 0.03 0.05 0.04
Collusion (%) 1.03 6.06 * 2.12 * * Restated due to amended methodology with more refined calculation of unique players for full year based on quarterly data.
Responsible gambling (%) 0.36 0.14 0.14
Responsible gambling escalation to licensees – Live CasinoEscalations from Euro Live Technologies 5,211 * This number has increased due to the number
of Live operations included in the scope of reporting, continued investment in staff training and chat tool improvements.
Risk escalations from all four Live operations 19,558 *
Responsible gambling performance – B2C
Proportion of customers self-excluding (%)* 29 27 * Number of self-exclusions and registrations with GAMSTOP as a percentage of total unique customers within Playtech’s B2C operations in the UK.
Proportion of customers using RG tools (%)** 9 9 *** ** RG tools comprise reality checks, time-outs and deposit limits.
*** Restated due to improved methodology to consider unique players. Previously reported figure (27%) included non-unique player accounts.
B2C customer interactionsEmails 420,071
Person-to-person interactions via phone, email or live chat
6,478
Pop-up messages 21,276
Customer clicks on SmartTips 42,048
Pillar 2 – PROMOTING INTEGRITY AND AN INCLUSIVE CULTURE
TrainingCompliance* * Includes Snaitech employees.
Total number of employees eligible 5,080 GRI 205-2
Total number of employees completing training 4,981 GRI 205-2
Completion rate 98% GRI 205-2
Average hours per employee 9.14 GRI 404-1
Information securityTotal number of employees eligible 5,420
Total number of employees completing training 5,333
Completion rate 98%
Average hours per employee 0.67 GRI 404-1
Summary of 2020 ESG Data
The following provides an overview of key ESG metrics included in the FY 2020 Annual Report, the KPIs are presented under the three pillars of Playtech’s sustainability strategy. The table also indicates the relationship to relevant GRI and SASB indicators. Additional information is available at http://www.investors.playtech.com/annual-reports

6 Playtech plc Sustainability and Responsible Business Addendum to the Annual Report 2020
Sustainability and Responsible Business Addendum to the Annual Report 2020
2020 2019 2018 GRI SASB Notes
Global compliance – senior leaderTotal number of employees eligible 1,044 GRI 205-2
Total number of employees completing training
881 GRI 205-2
Completion rate 84% GRI 205-2
Average hours per employee 1.5 GRI 404-1
Human rights refresher training (number of employees trained)
29 * GRI 412-2 * This will continue to be delivered in 2021.
Bespoke safer gambling training (number of employees trained)
116* * ** 116 people with B2C roles participated.
Incident reports through the independent Speak Up hotline*
0 0 1 * In 2021, Playtech will refresh its speak up policy, procedures and platform as well as launching refreshed awareness for colleagues across the business.
* 2020 absolute data is an estimate based on 99.3% actual data coverage by headcount. Coverage has been above 90% for all three years.
** Using the latest Department for Environment, Food and Rural Affairs (DEFRA) conversion factors (CO
2e).
*** Using the latest DEFRA electricity conversion factor (CO
2e) for all UK locations and district
heating conversion factors for the whole Group, and the latest International Energy Agency (IEA) conversion factors for all electricity use at non-UK sites (CO
2e).
+ Due to reporting timelines, data for November and December 2020 has been estimated using November and December 2019 actual data, except for sites where actual 2020 data was already available.
^ Indicates independently assured data by PwC.
27,677,113 30,932,101 31,715,777 GRI 302-1, GRI 302-4
SV-CA-130a.1, TC-
SI-130a.1
1,556,362
9,316 ̂ 10,914 11,543 GRI 305-5
350.09
1,155 ̂ 1,421 1,650 GRI 305-1
47.63
1.37 ̂ 1.70 1.92 GRI 305-4
8,161 ̂ 9,493 9,893 GRI 305-2
Environment metricsGreenhouse gas emissions*+Global total energy consumption (kWh)
UK total energy consumption (kWh) Global total GHG emissions (tonnes CO
2e) UK total
GHG emissions (tonnes CO2
e) Global
Scope 1 energy emissions (tonnes CO
2e)**
UK Scope 1 energy emissions (tonnes CO2
e)** GHG intensity tonnes (CO
2e/employee)
Global Scope 2 (location-based) emissions (tonnes CO
2e)***
UK Scope 2 (location-based) emissions (tonnes CO
2e)***
302.46
Water consumption* * 2018 data covering Snaitech operations only; 2019 and 2020 data covering all of Playtech’s operations.
** 2020 estimate based on 84% actual data coverage by headcount.
*** Restated due to the inclusion of a multiplying factor that was used for water charges in the Philippines. Calculations have since been restated to the actual consumption.
Total water consumption (m3)** 611,629 719,635 *** 502,511 GRI 303-5 TC-SI-130a.2
Water consumption for watering racetracks (m3)
167,831 175,259 232,615
Water consumption for watering racetracks (% of total)
27.4% 24.4% *** 46.3%
Waste and effluent* * Data covering Snaitech operations only (excluding Snai Rete Italia and Epiqa – Rome office).
** This figure is split between Racetracks (Manure/by-product of animal origin – 7.225), Racetracks (other – 359) and offices (77).
Total waste production (tonnes) 7,665 8,850 7,829 GRI 306-3
> Sent to landfill (tonnes) 5 52 180 GRI 306-5
> Reused or recycled (tonnes) 7,660 ** 8,798 7,650 GRI 306-4
Hazardous waste (tonnes) 66 96 127
Summary of 2020 ESG Data continued

7Playtech plc Sustainability and Responsible Business Addendum to the Annual Report 2020
Sustainability and Responsible Business Addendum
2020 2019 2018 GRI SASB Notes
Gender splits
Employees (%)*
Male 60.7 58.6 58.2 GRI 405-1 TC-SI-330a.3
* Employees are defined as the total number of employees on the payroll on 31 December.
** Senior managers are defined as the top 500 highest earning employees at Playtech.
*** Directors are defined as Board Directors on 31 December.
Female 39.3 41.4 41.8 GRI 405-1 TC-SI-330a.3
Senior managers (%)**Male 80.6 81.4 83.4 GRI 405-1 TC-SI-
330a.3
Female 19.4 18.6 16.6 GRI 405-1 TC-SI-330a.3
Directors (%)***
Male 71.4 75.0 75.0 GRI 405-1 TC-SI-330a.3
Female 28.6 25.0 25.0 GRI 405-1 TC-SI-330a.3
Gender pay gap* * Based on UK employees only. The numbers were calculated in line with the UK Government’s requirements for reporting gender pay figures and cover payroll and bonuses paid up to 5 April 2018, 5 April 2019 and 5 April 2020 respectively.
** Based on hourly rate of pay. In line with the UK Government’s guidance for gender pay gap reporting, furloughed employees are excluded from the calculation.
*** Based on total bonuses received. In line with the UK Government’s guidance for gender pay gap reporting, furloughed employees are included in the calculation.
Median gender pay gap (%)** 21.0 31.7 60.4 GRI 405-2
Mean gender pay gap (%)** 25.5 32.5 49.4 GRI 405-2
Median gender bonus gap (%)*** 31.1 25.9 16.7 GRI 405-2
Mean gender bonus gap (%)*** 49.6 52.7 67.0 GRI 405-2
Occupational health and safety data* * Covers Snaitech operations only.
** 200,000 is a fixed coefficient (50 working weeks x 40 hours x 100).
*** Number of days’ absence is defined as total hours of absence/8 (hours of work per day); 31,942 days of absence are due to furloughed absences.
Total number of accidents 4 11 13 GRI 403-9
Accident ratio: total number of accidents/working hours x 200,000**
0.67 1.6 2.1 GRI 403-9
Number of days lost to accidents 88 310 248 GRI 403-9
Severity of accident index: total days lost for accidents/working hours x 200,000**
14.81 45.9 39.2 GRI 403-9
Number of days’ absence*** 40,131 7,949 7,144 GRI 403-10
Pillar 3 – PARTNERING ON SHARED SOCIETAL CHALLENGES
Community investmentNumber of countries reporting on community investment
10 GRI 413-1
Charities worked with >100
Estimated cumulative number of people engaged
>10,000
Total value of gifts in kind distributed (€) >40,000 GRI 201-1
Total value of monetary donations (€) >300,000 GRI 201-1
Investment in research, education and treatment programmes to reduce gambling-related harm (£)
>1,300,000

8 Playtech plc Sustainability and Responsible Business Addendum to the Annual Report 2020
Sustainability and Responsible Business Addendum to the Annual Report 2020
Underlying reporting principlesThe following principles underlie our approach to sustainability reporting:
• All data and information is a true and fair reflection of our performance, and provides sufficient transparency for the reader to have confidence in the integrity of our reporting.
• We are clear about the definitions, scope and boundaries of our reporting.
• If we have any exclusions in our reporting due to data gaps, then those exclusions are clearly stated.
• Any assumptions that we make are clearly stated, and the accounting and calculation methods explained.
Reporting boundariesPlaytech is a global business with offices in 27 jurisdictions, namely:
• Antigua
• Australia
• Austria
• Bulgaria
• Cyprus
• Denmark
• Estonia
• Germany
• Gibraltar
• Guernsey
• Isle of Man
• Israel
• Italy
• Latvia
• Malta
• Philippines
• Poland
• Romania
• Russia
• Singapore
• South Africa
• Spain
• Sweden
• Ukraine
• United Kingdom
• United States
• Vietnam
We report performance on a Group-wide basis. Our reporting boundaries are defined by financial control as explained by the Greenhouse Gas (GHG) Protocol.
Associated companies of which we own a share that is less than 35% are excluded from the reporting boundary. Since 2020, we have a 85% stake in a joint venture (Statscore). Statscore is considered 100% consolidated from a reporting perspective. We therefore report on 100% of Statscore’s headcount and impacts.
As per the protocol for financial reporting we have to treat any business sold within the reporting year as “discontinued” in the results, on the basis that including it in our consolidated results as normal gives a misleading view of the Group’s continuing operations. We aim to include any acquired businesses during the financial year in our reporting, and we will make it clear if and when this is not possible, e.g. due to incompatible systems or lack of data.
Use of estimatesWe have made every effort to capture all relevant data, but it is not feasible or practical to capture everything. Where we have made estimates to cover such occasions, we make this clear in the criteria and where we deviate from this, we will give a further explanation in the relevant section of the report.
Roles, responsibilities and accountabilitiesWe follow a strict process to ensure that the data we report is as accurate as possible and any queries surrounding the data have been followed up in the best manner. We start by using a standardised reporting template to collect the data. Data is then collated and reviewed by the relevant responsible data owners, using this template. Once the data has been collected in full, it is then subject to a second check by our Group Internal Audit team and a third check by our external advisers. This process allows us to reduce the number of errors in our reporting process.
Data is collected from sources at Group level and from individuals at an individual office level, hereafter referred to as “offices”.
Restatement of reported dataWe think it is important for the business and also for the reader of our ARA to be able to see our sustainability performance over time. Where information becomes available that impacts figures reported in prior years by 5% or more, we will restate figures in prior years to make data as comparable between years as possible.
We report sustainability data under six broad headings: safer gambling, gender diversity, environment, health, safety and wellbeing, training, and community investment.
Safer gamblingUnder this heading, we collect data and provide quantitative indicators relating to our safer gambling (SG) tools, processes and initiatives.
B2BParameter: escalations (iPoker)• Definition: the percentage of escalations to
licensees, split by anti-money laundering (AML), collusion and responsible gambling (RG).
• Scope: all unique players.
• Units: percentage of escalations.
• Method: sum of escalations during each quarter (1 January–31 March; 1 April–30 June; 1 July–30 September; 1 October–31 December) by type (AML, collusion, RG) divided by the total number of network unique players for that quarter. Annual figures calculated by taking the average of each quarter’s figure.
• Source: collected by the iPoker team. Numbers extracted from Poker admin system reports and internal databases.
Playtech sustainability data: principles and methodologyThis document spells out the principles and methodology used by Playtech to collect, analyse and verify the Company’s sustainability data as it relates to mandatory reporting in the Annual Report and Accounts (ARA).
Reporting methodology

9Playtech plc Sustainability and Responsible Business Addendum to the Annual Report 2020
Sustainability and Responsible Business Addendum
Parameter: escalations (Live)• Definition: the total number of escalations to
licensees about players in Eurolive, PTR, CGM and S-Tech.
• Scope: all players in each of the four studios.
• Units: number of escalations.
• Method: sum of escalations during the year, from 1 January to 31 December 2020.
• Source: collected by the Live team. Numbers extracted from Live admin system reports.
Parameter: number of Playtech Protect customers• Definition: the number of brands actively
using Playtech Protect services, including BetBuddy.
• Scope: all brands of Playtech.
• Units: number of brands.
• Method: sum of brands actively using BetBuddy as at the year end, 31 December 2020.
• Source: collected by the Compliance team. Numbers extracted from legal/contracts.
Parameter: number of Software as a Service (SaaS) partnerships offering safer gambling and compliance services• Definition: the number of SaaS partnerships
offering safer gambling and compliance services.
• Scope: all SaaS partnerships.
• Units: number of SaaS partnerships.
• Method: sum of SaaS partnerships as at the year end, 31 December 2020.
• Source: collected by the Product Strategy and Innovation team. Numbers extracted from our internal databases.
Parameter: research and insights on SG• Definition: the number of research articles,
blogs, whitepapers and podcasts published that contribute to SG.
• Scope: all publications, as specified in the definition.
• Units: number of publications.
• Method: sum of articles, blogs, whitepapers and podcasts published in the year from 1 January to 31 December 2020 that contribute to SG.
• Source: collected by the Compliance team, available on the Playtech Protect (Research) website.
B2CParameter: self-exclusions • Definition: total number of unique self-
exclusions and/or registrations with GAMSTOP as a percentage of total unique and active customers within Playtech’s B2C operations in the UK.
• Scope: all Playtech B2C customers in the UK and Ireland.
• Units: number of unique customer self-exclusions and/or registrations with GAMSTOP.
• Method: sum of unique self-exclusions started during the year from 1 January to 31 December 2020.
• Source: collected by Compliance. Numbers extracted from Information Management Solution (IMS) reports.
Parameter: SG tools • Definition: the total number of unique Playtech
customers that have experienced at least one out of the following SG tools: emails, reality checks, time-outs and/or deposit limits.
• Scope: all active Playtech B2C customers in the UK.
• Units: number of unique customers experiencing at least one SG tool.
• Method: sum of unique and active customers using one or more of the SG tools mentioned in the definition during the year from 1 January to 31 December 2020.
• Source: collected by the Compliance team. Numbers extracted from IMS reports.
Parameter: customer interactions regarding SG• Definition: the total number of customer
interactions regarding SG through emails sent; person-to-person interactions (chat, email or phone call); and pop-up messages during the year from 1 January to 31 December 2020.
• Scope: all Playtech B2C customers in the UK.
• Units: total number of customer interactions regarding SG and breakdown by type of interaction (total number of RG emails sent, person-to-person interaction (either via live chat/phone call/email) and pop up messages).
• Method: sum of customer interactions by type of interaction.
• Source: collected by the Compliance team. Numbers extracted from the Customer Relationship Management (CRM) platform.
Parameter: clicks on SmartTips • Definition: the total number of customer clicks
on SmartTips during the year from 1 January to 31 December 2020.
• Scope: all Playtech B2C customers in the UK.
• Units: total number of clicks.
• Method: sum of clicks.
• Source: collected by Compliance. Numbers extracted from IMS reports.
Gender diversityUnder this heading we collect data and report on indicators to assess the gender diversity of our employees.
Total employeesParameter: employee number• Definition: total number of employees as at
31 December 2020.
• Scope: all employees in Playtech Group – both full time and part time. This includes those who are full time employed, a contractor, an intern, on maternity leave or parental leave, or on unpaid vacation, and those with “other” status (e.g. sick leave).
• Units: number of employees.
• Method: sum of employees by office.
• Source: Global HR. Data extracted from the main HR management system, HRis.
• Numbers submitted by Global HR for the Playtech Group and Snaitech HR for Snaitech.
Employee diversityParameter: employee gender split• Definition: the percentage of male or female
employees as at 31 December 2020.
• Scope: all employees in Playtech Group – both full time and part time. This includes those who are full time employed, a contractor, an intern, on maternity leave or parental leave, or on unpaid vacation, and those with “other” status (e.g. sick leave).
• Units: percentage (%).
• Method: sum of female employees as a percentage of the total employee number on 31 December 2020 (same for male employees).
• Source: Global HR and Snaitech HR. Global HR data extracted from the main HR management system, HRis; Snaitech HR data extracted from Snaitech’s HR management system, Zuchetti.
• Numbers submitted by Global HR for the Playtech Group and Snaitech HR for Snaitech.

10 Playtech plc Sustainability and Responsible Business Addendum to the Annual Report 2020
Sustainability and Responsible Business Addendum to the Annual Report 2020
Employee diversity continuedParameter: senior managers’ gender split• Definition: the percentage of male or female
employees in senior managerial positions on 31 December 2020. A “senior manager” is a person who, as defined by the Strategic Report statutory reporting requirements:
• has responsibility for planning, directing or controlling the activities of the Company, or a strategically significant part of the Company; and
• is a full time employee of the Company.
• We have taken this to mean the top 500 highest paid employees at Playtech Group based on payroll identifiable on HRis, which excludes allowances and benefits.
• Scope: all full time employees in Playtech. This includes those who are full time employed, an intern; on maternity leave or parental leave, or on unpaid vacation, and those with “other” status (e.g. sick leave). It excludes the Group Chief Executive Officer and Group Chief Financial Officer because they are included in the Directors’ gender split.
• Units: percentage (%).
• Method: sum of female senior managers as a percentage of the total number of employees in senior managerial positions on 31 December 2020 (same for male senior managers).
• Source: Global HR and Snaitech HR. Global HR data extracted from the main HR management system, HRis. Snaitech HR data extracted from Snaitech’s HR management system, Zuchetti.
• Numbers submitted by Global HR for the Playtech Group and Snaitech HR for Snaitech.
Parameter: Directors’ gender split• Definition: the percentage of male or female
Board Directors on 31 December 2020.
• Scope: members of Playtech Group’s Board of Directors, including both Executive and Non-executive Directors.
• Units: percentage (%).
• Method: sum of female members of the Board of Directors as a percentage of the total number of members of the Board of Directors on 31 December 2020 (same for male Directors).
• Source: Global HR. Data extracted from the main HR management system, HRis.
EnvironmentUnder this heading we collect data and report against indicators to monitor the environmental impacts of our business.
Energy useParameter: total energy consumption• Definition: the total amount of energy
consumed within all our assets, including office buildings, racetracks, live studios and data centres. Energy includes diesel for vehicles, district heating, electricity, fuel oil, gas, gasoline for generators, gasoline for vehicles, LPG for heating, and methane for heating.
• Scope: we aim to collect aggregate data from offices covering at least 85% of the total number of staff that are office based and 100% of our own data centres.
• Time period: the reporting period is 1 January 2020 to 31 December 2020. Due to reporting timelines, data for November and December 2020 has been estimated using November and December 2019 actual data, except for sites where actual 2020 data was already available.
• Units: kilowatt-hours (kWh).
• Method: sum of energy data reported per office and fuel type, converting to kWh where not already reported in that unit. Where we are not able to collect data for the full 12-month period for an office that was functional for the full 12-month period, we pro-rate the data to compensate for the missing information. This is done by splitting the reporting period into 24 half-month periods and multiplying the total energy use figure with the appropriate factor to compensate for missed half-month periods.
• Source: collected directly from offices covering at least 85% of Playtech’s staff and 100% of data centres. We then estimate for 100% of Playtech’s office-based staff (i.e. the staff that are based out of a Playtech-operated office, even if they work elsewhere from time to time) by calculating a pro-rated value for offices where actual data is not available based on the headcount data at 31 December 2020 from HR. This is done by multiplying the total energy consumption figure by the % of missed headcount. So, if coverage is 95% the total energy consumption figure is multiplied by a factor of 1.05.
• For offices that are able to collect actual data for some energy sources but not for a particular one, we still use the actual reported data. The missing data is calculated by finding a similar office type (e.g. office/office + data centre). We calculate the kWh/m2 consumption of the missing energy source. The missing data is then estimated by multiplying the office size by the proxy office’s kWh/m2 figure.
• Output: global figures (covering all 27 jurisdictions listed in the Reporting boundaries section) and UK figures (covering all of Playtech’s operations in the UK), to comply with Streamlined Energy and Carbon Reporting (SECR) requirements.
Greenhouse gas (GHG) emissionsParameter: Scope 1 and 2 GHG emissions• Definition: the amount of carbon dioxide
equivalent (CO2
e) emitted through the energy used within all our assets, including office buildings, racetracks, live studios and data centres. CO
2e includes the gases carbon
dioxide (CO2
), methane (CH4
) and nitrogen dioxide (N
2O). This is reported as follows:
• Scope 1 (direct) emissions from energy used in Company-owned or controlled facilities and vehicles. This includes diesel for vehicles, fuel oil, gas, gasoline for generators, gasoline for vehicles, LPG for heating, and methane for heating.
• Scope 2 (indirect) emissions from purchased electricity, steam, heating and cooling for own use. This includes district heating and cooling, and electricity.
• Total Scope 1 and 2 GHG emissions.
• GHG intensity. This is defined as the total absolute Scope 1 and 2 emissions (tonnes CO
2e) divided by the total number of
employees who are based in Playtech offices (i.e. excluding permanent homeworkers). Please refer to parameter: employee number for further details.
• Scope: we aim to collect aggregate data from offices covering at least 85% of the total number of staff that are office based and 100% of our own data centres.
• Currently we do not report on CO2
e emissions arising from our use of third party data centres or services, but we aim to do so in the future.
Reporting methodology continued

11Playtech plc Sustainability and Responsible Business Addendum to the Annual Report 2020
Sustainability and Responsible Business Addendum
• Time period: the reporting period is 1 January 2020 to 31 December 2020. Due to reporting timelines, data for November and December 2020 has been estimated using November and December 2019 actual data, except for sites where actual 2020 data was already available.
• Units: tonnes of CO2
e.
• Method: multiplying energy data by appropriate available emissions factors from the UK Government’s Department for Food, Environment and Rural Affairs (DEFRA) or the International Energy Agency (IEA).
• UK emissions factors are derived from DEFRA’s most recent Greenhouse Gas Conversion Factors for Company Reporting.
• International emissions factors are derived from IEA’s most recent Emissions from Fuel Combustion data.
• Key assumptions in using these factors are as follows:
• For office and data centre electricity, specific country conversion factors are used depending on the office location: the UK grid conversion factor comes from DEFRA (CO
2e); for all other countries it is
derived from IEA data (CO2
, CH4
and N2
O). We calculate our Scope 2 emissions using a location-based approach.
• Gas, fuel oil, vehicle diesel/petrol, LPG, gasoline for generators and district heat use a consistent conversion factor regardless of global location (i.e. UK DEFRA emission factors).
• Source: collected directly from offices covering at least 85% of Playtech’s staff and 100% of data centres. We then estimate for 100% of Playtech’s office-based staff (i.e. the staff that are based out of a Playtech-operated office, even if they work elsewhere from time to time) by calculating a pro-rated value for offices where actual data is not available, based on the headcount data at 31 December 2020 from HR. This is done by multiplying the total Scope 1 and 2 GHG emissions figure by the % of missed headcount. So, if coverage is 95% the total GHG emission figure is multiplied by a factor of 1.05.
• For offices that are able to collect actual data for some energy sources but not for a particular one, Scope 1 and 2 GHG emissions are calculated based on the estimated kWh energy consumption figure as explained under parameter: total energy consumption.
• Output (Scope 1 emissions; Scope 2 emissions; and total Scope 1 and 2 emissions): global figures (covering all 27 jurisdictions listed in the Reporting boundaries section) and UK figures (covering all of Playtech’s operations in the UK), to comply with Streamlined Energy and Carbon Reporting (SECR) requirements. GHG intensity is reported as a global figure only.
Data collection processThe following process is followed to ensure that the data received is collated and reported as accurately as possible.
Playtech Group excl. Snaitech1a. The greenhouse gas data collection tool is
filled in by Local Financial Controllers on a country or office basis.
2a. The data is then sent to Group Finance, where a Corporate Controller undertakes an initial assessment of the integrity and completeness of the data, following up with data providers as necessary. Once the dataset is complete, Group Finance passes on the complete dataset to both Playtech’s Group Internal Audit team and Playtech’s external sustainability advisers.
Snaitech1b. The same greenhouse gas data collection
tool as the one used by Playtech Group is filled in by three data owners: one for Snaitech offices; one for property agencies; and one for racetracks.
2b. The data is then sent to Snaitech’s Internal Audit team, which undertakes an initial assessment of the integrity and completeness of the data, following up with data owners as necessary. Once the dataset is complete, Snaitech Internal Audit passes on the complete dataset to both Playtech’s Group Internal Audit team and Playtech’s external sustainability advisers.
Both Playtech Group and Snaitech3. The advisers perform the next step of the
analysis, calculating the relevant CO2
e emissions. They also perform a check of the data in its final form to verify data quality.
4. The data review and findings are formally documented as an audit trail by the sustainability advisers, which in turn is reviewed by Internal Audit.
5. Finally, the full dataset (i.e. containing all of the Playtech Group data, including Snaitech data) will be signed off and approved by Playtech’s Chief Financial Officer.
Snaitech, our Italian business unit which accounts for a significant part of the Group’s energy use and GHG emissions, also reports environmental metrics separately in its annual sustainability reports. While these use a different reporting period for some metrics including energy use and GHG emissions (calendar year versus the Group’s November–October), we check alignment between Snaitech’s reported figures and those disclosed as part of the Group’s annual reporting to identify any discrepancies and flag potential issues in the methodology followed for Group reporting.
Water useParameter: total water consumption• Definition: the amount of water consumed
within all our assets, including office buildings, racetracks, live studios and data centres.
• Scope: we aim to collect aggregate data from offices covering at least 85% of the total number of staff that are office based and 100% of our own racetracks.
• Time period: the data reported in the Annual Report corresponds to the data collected for the 12-month period between 1 November 2019 and 31 October 2020 except for sites where data for 1 January 2020 to 31 December 2020 was already available.
• Units: cubic metres (m3).
• Method: sum of water use data reported for each asset, converting to m3 where not already reported in that unit. Where we were not able to collect data for the full 12-month period for an office that was functional for the full 12-month period, we pro-rate the data to compensate for the missing information. This is done by splitting the reporting period into 24 half-month periods and multiplying the total water use figure with the appropriate factor to compensate for missed half-month periods.
• Source: collected directly from offices covering at least 85% of Playtech’s staff and 100% of racetracks. We then estimate for 100% of Playtech’s office-based staff (i.e. the staff that are based out of a Playtech-operated office, even if they work elsewhere from time to time) by taking the average water use per capita for the offices we have data cover for, and multiplying the figure by the figure for total office-based employees collected from Group HR.

12 Playtech plc Sustainability and Responsible Business Addendum to the Annual Report 2020
Sustainability and Responsible Business Addendum to the Annual Report 2020
Water use continuedParameter: water consumption for watering racetracks• Definition: the amount of water consumed for
watering the three racetracks owned by Snaitech: San Siro galoppo and La Maura trotto (Milan) and Sesana trotto (Montecatini Terme).
• Scope: data collected directly from the three Snaitech-owned racetracks.
• Time period: the data reported in the Annual Report corresponds to the data collected for the 12-month period between 1 November 2019 and 31 October 2020 except for sites where data for 1 January 2020 to 31 December 2020 was already available.
• Units: cubic metres (m3) and percentage of total water use (%).
• Method: sum of water use data reported for each of the three racetracks, converting to m3 where not already reported in that unit. Where we are not able to collect data for the full 12-month period for an office that was functional for the full 12-month period, we pro-rate the data to compensate for the missing information. This is done by splitting the reporting period into 24 half-month periods and multiplying the total water use figure with the appropriate factor to compensate for missed half-month periods.
• Source: collected directly from the three racetracks.
WasteParameter: total waste production• Definition: the amount of waste produced in all
of Snaitech’s operations, including office buildings, racetracks, live studios and data centres, and split by destination (landfill or reused/recycled).
• Scope: we aim to collect aggregate data from offices covering at least 85% of the total number of Snaitech staff that are office based and 100% of our own racetracks. The figure does not include Snai Rete Italia, the Area Scom and Epiqa – Rome office.
• Time period: the data reported in the Annual Report corresponds to the data collected for the 12-month period between 1 November 2019 and 31 October 2020 except for sites where data for 1 January 2020 to 31 December 2020 was already available.
• Units: tonnes.
• Method: sum of waste production data reported for each asset, converting to tonnes where not already reported in that unit. Where we are not able to collect data for the full 12-month period for an office that was functional for the full 12-month period, we
pro-rate the data to compensate for the missing information. This is done by splitting the reporting period into 24 half-month periods and multiplying the total water use figure with the appropriate factor to compensate for missed half-month periods.
• Source: collected directly from offices covering at least 85% of Snaitech’s staff and 100% of racetracks. We then estimate for 100% of Snaitech’s office-based staff (i.e. the staff that are based out of a Snaitech-operated office, even if they work elsewhere from time to time) by taking the average waste production per capita for the offices we have data cover for, and multiplying the figure by the figure for total office-based employees collected from Snaitech HR.
Parameter: hazardous waste production• Definition: the amount of hazardous waste
produced in all of Snaitech’s operations, including office buildings, racetracks, live studios and data centres.
• Scope: we aim to collect aggregate data from offices covering at least 85% of the total number of Snaitech staff that are office based and 100% of our own racetracks. The figure does not include Snai Rete Italia, the Area Scom and Epiqa – Rome office.
• Time period: the data reported in the Annual Report corresponds to the data collected for the 12-month period between 1 November 2019 and 31 October 2020 except for sites where data for 1 January 2020 to 31 December 2020 was already available.
• Units: tonnes.
• Method: sum of waste production data reported for each asset, converting to tonnes where not already reported in that unit. Where we are not able to collect data for the full 12-month period for an office that was functional for the full 12-month period, we pro-rate the data to compensate for the missing information. This is done by splitting the reporting period into 24 half-month periods and multiplying the total water use figure with the appropriate factor to compensate for missed half-month periods.
• Source: collected directly from offices covering at least 85% of Snaitech’s staff and 100% of racetracks. We then estimate for 100% of Snaitech’s office-based staff (i.e. the staff that are based out of a Snaitech-operated office, even if they work elsewhere from time to time) by taking the average hazardous waste production per capita for the offices we have data cover for, and multiplying the figure by the figure for total office-based employees collected from Snaitech HR.
Health, safety and wellbeingUnder this heading we collect data and report on indicators to assess the health, safety and wellbeing of our employees.
Health and safetyParameter: accidents• Definition: total number of accidents that have
affected an employee of Snaitech in the year from 1 January to 31 December 2020. “Accident” is defined in accordance with GRI 403: Occupational Health and Safety 2018.
• Scope: all employees in Snaitech – both full time and part time. This includes those who are full time employed, a contractor, an intern, on maternity leave or parental leave, or on unpaid vacation, and those with “other” status (e.g. sick leave).
• Units: number of accidents; accident ratio.
• Method: sum of number of accidents. For the accident ratio, this number is divided by the total number of working hours and multiplied by 200,000 (a fixed coefficient).
• Source: Snaitech HR. Data extracted from the main HR management system, Zuchetti.
• Numbers submitted by offices.
Parameter: days lost to accidents• Definition: total number of working days lost
by employees of Snaitech due to accidents in the year from 1 January to 31 December 2020. “Accident” is defined in accordance with GRI 403: Occupational Health and Safety 2018.
• Scope: all employees in Snaitech – both full time and part time. This includes those who are full time employed, a contractor, an intern, on maternity leave or parental leave, or on unpaid vacation, and those with “other” status (e.g. sick leave).
• Units: number of days.
• Method: sum of hours of absence due to accidents divided by 8 (hours of work per day).
• Source: Snaitech HR. Data extracted from the main HR management system, Zuchetti.
• Numbers submitted by offices.
Parameter: severity of accidents• Definition: total number of working days lost
by employees of Snaitech due to accidents in the year from 1 January to 31 December 2020. “Accident” is defined in accordance with GRI 403: Occupational Health and Safety 2018.
• Scope: all employees in Snaitech – both full time and part time. This includes those who are full time employed, a contractor, an intern, on maternity leave or parental leave, or on unpaid vacation, and those with “other” status (e.g. sick leave).
Reporting methodology continued
13Playtech plc Sustainability and Responsible Business Addendum to the Annual Report 2020
Sustainability and Responsible Business Addendum
Health, safety and wellbeing continuedHealth and safety continuedParameter: severity of accidents continued• Units: severity of accident ratio.
• Method: sum of hours of absence due to accidents divided by total working hours multiplied by 200,000 hours (a fixed coefficient: 50 working weeks x 40 hours x 100).
• Source: Snaitech HR. Data extracted from the main HR management system, Zuchetti.
• Numbers submitted by offices.
Parameter: absence• Definition: total number of working days lost
by employees of Snaitech due to absence in the year from 1 January to 31 December 2020. “Absence” is defined in accordance with GRI 403: Occupational Health and Safety 2018.
• Scope: all employees in Snaitech – both full time and part time. This includes those who are full time employed, a contractor, an intern, on maternity leave or parental leave, or on unpaid vacation, and those with “other” status (e.g. sick leave).
• Units: total number of days.
• Method: sum of hours of absence multiplied by 8 (hours of work per day).
• Source: Snaitech HR. Data extracted from the main HR management system, Zuchetti.
• Numbers submitted by offices.
WellbeingParameter: wellbeing initiatives• Definition: total number of wellbeing initiatives
in the year from 1 January to 31 December 2020. A wellbeing initiative is defined as any initiative that is designed to contribute to the mental and/or physical wellbeing of employees.
• Scope: all employees in Playtech Group – both full time and part time. This includes those who are full time employed, a contractor, an intern, on maternity leave or parental leave, or on unpaid vacation, and those with “other” status (e.g. sick leave).
• Units: total number of initiatives.
• Method: sum of wellbeing initiatives.
• Source: Global HR. Data extracted from the Playtech Academy, the Group’s learning and development platform.
• Numbers submitted by offices.
Parameter: employee participation• Definition: total number of employees
participating in at least one wellbeing initiative in the year from 1 January to 31 December 2020. A wellbeing initiative is defined as any initiative that is designed to contribute to the mental and/or physical wellbeing of employees.
• Scope: all employees in Playtech Group – both full time and part time. This includes those who are full time employed, a contractor, an intern, on maternity leave or parental leave, or on unpaid vacation, and those with “other” status (e.g. sick leave).
• Units: total number of employees and percentage of total employees in the Playtech Group who have participated in at least one initiative (refer to Gender Diversity – parameter: employee number).
• Method: sum of the number of employees participating in at least one wellbeing initiative per office.
• Source: Global HR. Data extracted from the Playtech Academy, the Group’s learning and development platform.
• Numbers submitted by offices.
TrainingUnder this heading we collect data and report on indicators to assess the training that our employees receive.
TrainingParameter: employees eligible for training• Definition: total number of employees eligible
for training in the year from 1 January to 31 December 2020, split by training type (compliance, human rights, information security, global compliance senior leader (ILT), customer interaction (GamCare), chat moderator (GamCare), mental health first aid).
• Scope: all employees in Playtech Group – both full time and part time. This includes those who are full time employed, a contractor, an intern, on maternity leave or parental leave, or on unpaid vacation, and those with “other” status (e.g. sick leave).
• Units: total number of employees.
• Method: sum of number of employees eligible for training by training type.
• Source: Global HR.
Parameter: employees completing training• Definition: total number of employees
completing training in the year from 1 January to 31 December 2020, split by training type (compliance, human rights, information security, global compliance senior leader ILT, customer interaction (GamCare), chat moderator (GamCare), mental health first aid).
• Scope: all employees in Playtech Group – both full time and part time. This includes those who are full time employed, a contractor, an intern, on maternity leave or parental leave, or on unpaid vacation, and those with “other” status (e.g. sick leave).
• Units: total number of employees.
• Method: sum of number of employees completing training by training type.
• Source: Global HR.
Parameter: completion rate• Definition: rate of employees completing the
training they were eligible for in the year from 1 January to 31 December 2020, split by training type (compliance, human rights, information security, global compliance senior leader ILT, customer interaction (GamCare), chat moderator (GamCare), mental health first aid).
• Scope: all employees in Playtech Group – both full time and part time. This includes those who are full time employed, a contractor, an intern, on maternity leave or parental leave, or on unpaid vacation, and those with “other” status (e.g. sick leave).
• Units: percentage of employees.
• Method: sum of number of employees completing training by training type divided by total number of employees eligible for that training type.
• Source: Global HR.
Parameter: average training hours per employee• Definition: average hours spent on training per
employee in the year from 1 January to 31 December 2020, split by training type (compliance, human rights, information security, global compliance senior leader ILT, customer interaction (GamCare), chat moderator (GamCare), mental health first aid).
• Scope: all employees in Playtech Group – both full time and part time. This includes those who are full time employed, a contractor, an intern, on maternity leave or parental leave, or on unpaid vacation, and those with “other” status (e.g. sick leave).
• Units: number of hours.
• Method: weighted average of average hours spent on training per employee per training type. Weighted average is calculated by taking the average figure for Playtech and Snaitech, and calculating a weighted average based on number of employees completing training.
• Source: Global HR.

14 Playtech plc Sustainability and Responsible Business Addendum to the Annual Report 2020
Sustainability and Responsible Business Addendum to the Annual Report 2020
Community investmentUnder this heading we collect data and report on indicators to assess the community investment we make.
Community investmentParameter: countries with community investment initiatives• Definition: total number of countries with at
least one community investment initiative in the year from 1 January to 31 December 2020. A community investment initiative is defined as any initiative that fits within our community investment strategy and budget, including volunteering, donations or gifts in kind.
• Scope: all countries where the Playtech Group operates.
• Units: total number of countries.
• Method: sum of countries with at least one community investment initiative.
• Source: offices.
Parameter: charities that Playtech has worked with• Definition: total number of charities which
Playtech has worked with through at least one community investment initiative in the year from 1 January to 31 December 2020. A community investment initiative is defined as any initiative that fits within our community investment strategy and budget, including volunteering, donations or gifts in kind.
• Scope: all countries where the Playtech Group operates.
• Units: total number of charities.
• Method: sum of charities with which Playtech has worked through at least one community investment initiative.
• Source: offices.
Parameter: people engaged• Definition: total number of people engaged
through at least one community investment initiative in the year from 1 January to 31 December 2020. A community investment initiative is defined as any initiative that fits within our community investment strategy and budget, including volunteering, donations or gifts in kind. Engaged is defined as an individual that has directly benefited and/or has interacted with the programme supported from financial and/or in-kind support.
• Scope: all countries where the Playtech Group operates.
• Units: total number of people engaged.
• Method: sum of people engaged by each community investment initiative.
• Source: offices.
Parameter: value of community investment• Definition: total monetary value delivered
through community investment initiatives in the year from 1 January to 31 December 2020, split by gifts in kind and monetary donations. A community investment initiative is defined as any initiative that fits within our community investment strategy and budget, including volunteering, donations or gifts in kind.
• Scope: all countries where the Playtech Group operates.
• Units: Euros (€).
• Method: sum of monetary value of each gift in kind and monetary donation made by each community investment initiative.
• Source: offices.
Data checking and assuranceAll of the sustainability data that is collected and reported by Playtech undergoes a rigorous amount of checks both internally and using external advisers.
Individuals with responsibility for collecting and handling data are provided with detailed instructions and guidance before and during the data collection process.
The data that is collected is kept for a minimum of three years.
PwC has provided assurance for the following metrics reported as part of environment:
• global Scope 1 energy emissions (tonnes CO
2e);
• global Scope 2 (location-based) emissions (tonnes CO
2e); and
• GHG intensity (tonnes CO2
e/employee).
Reporting methodology continued

15Playtech plc Sustainability and Responsible Business Addendum to the Annual Report 2020
Sustainability and Responsible Business Addendum
GRI and SASB Indicators Index
Disclosure number Disclosure title Reference
GRI 102: GENERAL STANDARDS (2016)
102-1 Name of the organisation Annual Report: p.1
102-2 Activities, brands, products and services Annual Report: p.4
102-3 Location of headquarters Annual Report: p.205
102-4 Location of operations Annual Report: p.4
102-5 Ownership and legal form Annual Report: pp.121–125
102-6 Markets served Annual Report: pp.12–13; pp.20–21
102-7 Scale of the organisation Annual Report: p.2; pp.4–5; pp.72–77; p.133
102-8 Information on employees and other workers Annual Report: p.63
102-9 Supply chain Annual Report: p.24; pp.62–63; p.81
102-10 Significant changes to the organisation and its supply chain Annual Report: pp.6–9; pp.20–21; p.81
102-11 Precautionary principle or approach Annual Report: pp.60–62; pp.78–82
102-12 External initiatives Annual Report: pp.62–64
102-14 Statement from senior decision-maker Annual Report: pp.26–30
102-15 Key impacts, risks and opportunities Annual Report: pp.78–82
102-16 Values, principles, standards and norms of behaviour Annual Report: pp.16–17; pp.46–49
102-17 Mechanisms for advice and concerns about ethics Annual Report: p.59; p.79
102-18 Governance structure Annual Report: p.48; pp.86–95
102-19 Delegating authority Annual Report: pp.91–92; p.97
102-20 Executive-level responsibility for economic, environmental and social topics Annual Report: p.48; p.92
102-21 Consulting stakeholders on economic, environmental and social topics Annual Report: pp.47–48
102-22 Composition of the highest governance body and its committees Annual Report: pp.86–87
102-23 Chair of the highest governance body Annual Report: p.86
102-24 Nominating and selecting the highest governance body Annual Report: pp.92–93
102-25 Conflicts of interest Annual Report: p.117
102-26 Role of highest governance body in setting purpose, values and strategy Annual Report: pp.88–93
102-27 Collective knowledge of highest governance body Annual Report: pp.86–87
102-28 Evaluating the highest governance body’s performance Annual Report: pp.94–95
102-29 Identifying and managing economic, environmental and social impacts Annual Report: p.48; p.92
102-30 Effectiveness of risk management processes Annual Report: p.92
102-31 Review of economic, environmental and social topics Annual Report: p.48; p.90
102-32 Highest governance body’s role in sustainability reporting Annual Report: pp.90–91
102-33 Communicating critical concerns Annual Report: p.22; p.95; p.119
102-34 Nature and total number of critical concerns Annual Report: p.59; p.95
102-35 Remuneration policies Annual Report: pp.103–108
102-36 Process for determining remuneration Annual Report: pp.103–108
Playtech is publishing a GRI Content Index in reference to the various standards developed by the Global Reporting Initiative (GRI) that apply to Playtech’s most material environmental, social and governance (ESG) issues. Where applicable, we reference the most recent reporting standards that have been published by April 2021. This is the third year Playtech has reported in reference to the GRI Standards, having first published a GRI Content Index in 2019.
The GRI’s Sustainability Reporting Guidelines, first published in 2000 (“GRI Standards”), provide a framework for reporting on an organisation’s economic, environmental and social performance. The GRI Standards provide a common language for organisations and stakeholders, and represent global best practice for sustainability reporting. For more information on the GRI Standards, visit https://www.globalreporting.org/standards/.

16 Playtech plc Sustainability and Responsible Business Addendum to the Annual Report 2020
Sustainability and Responsible Business Addendum to the Annual Report 2020
Disclosure number Disclosure title Reference
102-37 Stakeholders’ involvement in remuneration Annual Report: pp.103–108
102-38 Annual total compensation ratio Annual Report: p.115
102-40 List of stakeholder groups Annual Report: pp.7–8; pp.22–25
102-42 Identifying and selecting stakeholders Annual Report: p.22; pp.94–95
102-43 Approach to stakeholder engagement Annual Report: pp.22–25; pp.94–95
102-44 Key topics and concerns raised Annual Report: pp.22–25
102-45 Entities included in the consolidated financial statements Annual Report: pp.184–185
102-47 List of material topics Annual Report: p.48
102-48 Restatements of information Annual Report: p.52; p.55; p.61; p.77; p.133; p.138; p.174; p.204
102-49 Changes in reporting Annual Report: pp.46–49
102-50 Reporting period Annual Report: p.6
102-52 Reporting cycle Website: http://www.investors.playtech.com/annual-reports/2019.aspx
102-53 Contact point for questions regarding the report Website: http://www.investors.playtech.com/investor-contacts.aspx
102-55 GRI content index This is the index
102-56 External assurance Annual Report: pp.61–62; pp.127–132
GRI 103: MANAGEMENT APPROACH (2016) for series 200
103-1 Explanation of the material topic and its boundary Annual Report: pp.46–69
103-2 The management approach and its components Annual Report: pp.46–69
103-3 Evaluation of the management approach Annual Report: pp.46–69
GRI 201: ECONOMIC PERFORMANCE (2016)
201-1 Direct economic value generated and distributed Annual Report: p.2; p.5; pp.11–13; pp.19–20; p.67; pp.75–76; pp.133–138
201-2 Financial implications and other risks and opportunities due to climate change Annual Report: p.81
201-4 Financial assistance received from government Annual Report: p.23; p.70; p.140
GRI 203: INDIRECT ECONOMIC IMPACT (2016)
203-1 Infrastructure investments and services supported Annual Report: p.68
GRI 205: ANTI-CORRUPTION (2016)
205-1 Operations assessed for risks related to corruption Annual Report: p.58; p.79; p.95; p.119
205-2 Communication and training about anti-corruption policies and procedures Annual Report: pp.58–59
GRI 103: MANAGEMENT APPROACH (2016) for series 300
103-1 Explanation of the material topic and its boundary Annual Report: pp.46–69
103-2 The management approach and its components Annual Report: pp.46–69
103-3 Evaluation of the management approach Annual Report: pp.46–69
GRI 302: ENERGY (2016)
302-1 Energy consumption within the organisation Annual Report: pp.60–62
302-3 Energy intensity Annual Report: p.61
302-4 Reduction of energy consumption Annual Report: pp.60–62
GRI and SASB Indicators Index continued

17Playtech plc Sustainability and Responsible Business Addendum to the Annual Report 2020
Sustainability and Responsible Business Addendum
Disclosure number Disclosure title Reference
GRI 303: WATER AND EFFLUENTS (2018)
303-5 Water consumption Annual Report: p.61
GRI 305: EMISSIONS (2016)
305-1 Direct (Scope 1) GHG emissions Annual Report: p.61
305-2 Energy indirect (Scope 2) GHG emissions Annual Report: p.61
305-4 GHG emissions intensity Annual Report: p.61
305-5 Reduction of GHG emissions Annual Report: p.61
GRI 306: EFFLUENTS AND WASTE (2020)
306-3 Waste generated Annual Report: p.61
306-4 Waste diverted from disposal Annual Report: p.61
306-5 Waste directed to disposal Annual Report: p.61
GRI 103: MANAGEMENT APPROACH (2016) for series 400
103-1 Explanation of the material topic and its boundary Annual Report: pp.46–69
103-2 The management approach and its components Annual Report: pp.46–69
103-3 Evaluation of the management approach Annual Report: pp.46–69
GRI 401: EMPLOYMENT (2016)
401-2 Benefits provided to full time employees that are not provided to temporary or part time employees
Annual Report: pp.163–166
GRI 403: OCCUPATIONAL HEALTH AND SAFETY (2018)
403-1 Occupational health and safety management system Annual Report: p.65
403-2 Hazard identification, risk assessment and incident investigation Annual Report: p.65
403-4 Worker participation, consultation and communication on occupational health and safety
Annual Report: p.65
403-5 Worker training on occupational health and safety Annual Report: pp.64–65
403-6 Promotion of worker health Annual Report: pp.64–65
403-7 Prevention and mitigation of occupational health and safety impacts directly linked by business relationships
Annual Report: p.65
403-8 Workers covered by an occupational health and safety management system Annual Report: p.65
403-9 Work-related injuries Annual Report: p.65
403-10 Work-related ill health Annual Report: p.65
GRI 404: TRAINING AND EDUCATION (2016)
404-1 Average hours of training per year per employee Annual Report: p.59
404-2 Programmes for upgrading employee skills and transition assistance programmes Annual Report: p.59
GRI 405: DIVERSITY AND EQUAL OPPORTUNITY (2016)
405-1 Diversity of governance bodies and employees Annual Report: p.63
405-2 Ratio of basic salary and remuneration of women to men Annual Report: p.63
GRI 407: FREEDOM OF ASSOCIATION AND COLLECTIVE BARGAINING (2016)
407-1 Operations and suppliers in which the right to freedom of association and collective bargaining may be at risk
Annual Report: p.58; pp.62–63

18 Playtech plc Sustainability and Responsible Business Addendum to the Annual Report 2020
Sustainability and Responsible Business Addendum to the Annual Report 2020
Disclosure number Disclosure title Reference
GRI 408: CHILD LABOUR (2016)
408-1 Operations and suppliers at significant risk for incidents of child labour Annual Report: p.58; pp.62–63
GRI 409: FORCED OR COMPULSORY LABOUR (2016)
409-1 Operations and suppliers at significant risk for incidents of forced or compulsory labour
Annual Report: p.58; pp.62–63
GRI 412: HUMAN RIGHTS ASSESSMENT (2016)
412-1 Operations that have been subject to human rights reviews or impact assessments Annual Report: p.58; pp.62–63
412-2 Employee training on human rights policies or procedures Annual Report: p.59
GRI 413: LOCAL COMMUNITIES (2016)
413-1 Operations with local community engagement, impact assessments and development programmes
Annual Report: pp.66–69
GRI 415: PUBLIC POLICY (2016)
415-1 Political contributions Annual Report: p.123
GRI 416: CUSTOMER HEALTH AND SAFETY (2016)
416-1 Assessment of the health and safety impacts of product and service categories Annual Report: p.16; pp.46–47; pp.50–56; p.69
GRI 417: MARKETING AND LABELLING (2016)
417-1 Requirements for product and service information and labelling Annual Report: pp.50–56
GRI 419: SOCIO-ECONOMIC COMPLIANCE (2016)
419-1 Non-compliance with laws and regulations in the social and economic area Annual Report: p.30; p.76
The US-based SASB sets out sustainability reporting standards for various sectors. The following table provides references to our relevant reporting in relation to the sector-specific standard for casinos and gaming and software and IT services. Playtech provides software and services to betting and gaming operators, and also runs its own B2C online gambling operations. Not all indicators are relevant, for example Playtech does not run any physical casino operations. This is the first time Playtech is publishing a SASB index. For more information on the SASB standards visit https://materiality.sasb.org/.
Disclosure number Disclosure title Reference
SV-CA-130a.1/TC-SI-130a.1 (1) total energy consumed; (2) percentage grid electricity; (3) percentage renewable Annual Report: pp.60–62
TC-SI-130a.2 (1) total water withdrawn, (2) total water consumed, percentage of each in regions with high or extremely high baseline water stress
Annual Report: p.61
TC-SI-220a.1 Description of policies and practices relating to behavioural advertising and user privacy Annual Report: pp.60–61
TC-SI-230a.2 Description of approach to identifying and addressing data security risks, including use of third-party cybersecurity standards
Annual Report: pp.60–61
SV-CA-510a.1 Description of anti-money laundering policies and practices Annual Report: p.52; pp.58–59
TC-SI-330a.3 Percentage of gender and racial/ethnic group representation for (1) management, (2) technical staff, and (3) all other employees
Annual Report: p.63
TC-SI-550a.2 Description of business continuity risks related to disruptions of operations Annual Report: pp.80–81
GRI and SASB Indicators Index continued